+ All Categories
Home > Documents > BEFORE THE AIR QUALITY CONTROL … · 1 before the air quality control commission state of colorado...

BEFORE THE AIR QUALITY CONTROL … · 1 before the air quality control commission state of colorado...

Date post: 07-Sep-2018
Category:
Upload: dangphuc
View: 214 times
Download: 0 times
Share this document with a friend
142
1 BEFORE THE AIR QUALITY CONTROL COMMISSION STATE OF COLORADO REBUTTAL STATEMENT OF COALITION OF ENERGY PRODUCING ATTAINMENT COUNTIES (INCLUDING THE COUNTIES OF GARFIELD, MESA, MOFFAT, MONTEZUMA AND RIO BLANCO) IN THE MATTER OF PROPOSED REVISIONS TO REGULATION NUMBERS 3, 6 AND 7 AS IT RELATES TO THE SCHEDULED OIL AND GAS RULEMAKING HEARING FEBRUARY 19-21, 2014 The Energy Producing attainment counties, through its undersigned counsel, hereby submits its Rebuttal Statement in this matter pursuant to Sections V.E.6.c. of the Procedural Rules of the Colorado Air Quality Control Commission ("AQCC" or the "Commission"), and pursuant to the Commission's December 10, 2013 Notice of Public Rulemaking Hearing ("Notice"). I. EXECUTIVE SUMMARY The Energy Producing Attainment Counties (EPAC) coalition consisting of Garfield, Mesa, Moffat, Montezuma and Rio Blanco Counties support regional regulation of oil and gas operations and we support many of the Division's draft proposed rule changes. As EPAC reviewed the Division’s draft rules and the prehearing statements and exhibits from the Division and other parties, we note one compelling fact and unity of opinion consistent with longstanding Division air quality designationsthere are no locations in Colorado outside of the Northern Front Range and Denver Metropolitan Area non-attainment area (NAA) that fail to meet EPA National Ambient Air Quality Standards (NAAQS) for any criteria pollutant including ozone (McNally et al., 2009). This is based on ambient measurements from a substantial network of air quality monitoring stations throughout the region including western Colorado and the Commission should consider rules with flexibility to address the differential needs of attainment versus nonattainment areas. The EPAC coalition is concerned that the Division’s proposed rules and assertions made in their prehearing statement regarding development and application of a statewide emission control rule is counter to well established case law and Federal and state statutes. By rule, the air quality standards adopted by the Colorado Air Quality Control Commission (Commission) may vary for different parts of the state "as may be necessitated by variations in altitude, topography, climate, or meteorology." [CRS 25-7- 108(1)(a)]. Expanding on the foregoing statutory language in light of apparent legislative intent, the Colorado Supreme Court found that the Commission regulations addressing those variables must be
Transcript

1

BEFORE THE AIR QUALITY CONTROL COMMISSION STATE OF COLORADO

REBUTTAL STATEMENT OF COALITION OF ENERGY PRODUCING ATTAINMENT COUNTIES (INCLUDING THE COUNTIES OF GARFIELD, MESA, MOFFAT, MONTEZUMA AND RIO BLANCO)

IN THE MATTER OF PROPOSED REVISIONS TO REGULATION NUMBERS 3, 6

AND 7 AS IT RELATES TO THE SCHEDULED OIL AND GAS RULEMAKING

HEARING FEBRUARY 19-21, 2014

The Energy Producing attainment counties, through its undersigned counsel, hereby submits its Rebuttal Statement in this matter pursuant to Sections V.E.6.c. of the Procedural Rules of the Colorado Air Quality Control Commission ("AQCC" or the "Commission"), and pursuant to the Commission's December 10, 2013 Notice of Public Rulemaking Hearing ("Notice").

I. EXECUTIVE SUMMARY

The Energy Producing Attainment Counties (EPAC) coalition consisting of Garfield, Mesa, Moffat,

Montezuma and Rio Blanco Counties support regional regulation of oil and gas operations and we

support many of the Division's draft proposed rule changes. As EPAC reviewed the Division’s draft rules

and the prehearing statements and exhibits from the Division and other parties, we note one compelling

fact and unity of opinion consistent with longstanding Division air quality designations—there are no

locations in Colorado outside of the Northern Front Range and Denver Metropolitan Area non-attainment

area (NAA) that fail to meet EPA National Ambient Air Quality Standards (NAAQS) for any criteria

pollutant including ozone (McNally et al., 2009). This is based on ambient measurements from a

substantial network of air quality monitoring stations throughout the region including western Colorado

and the Commission should consider rules with flexibility to address the differential needs of attainment

versus nonattainment areas.

The EPAC coalition is concerned that the Division’s proposed rules and assertions made in their

prehearing statement regarding development and application of a statewide emission control rule is

counter to well established case law and Federal and state statutes. By rule, the air quality standards

adopted by the Colorado Air Quality Control Commission (Commission) may vary for different parts of the

state "as may be necessitated by variations in altitude, topography, climate, or meteorology." [CRS 25-7-

108(1)(a)]. Expanding on the foregoing statutory language in light of apparent legislative intent, the

Colorado Supreme Court found that the Commission regulations addressing those variables must be

2

formulated with regard to the various factors that constitute, produce or dispel air pollution, describe

maximum concentrations of contaminants that can be tolerated, consider the degree to which particular

types of emissions are subject to treatment, and consider the continuous, intermittent, or seasonal nature

of the emission to be controlled. According to the Court, Commission's action must also be both

reasonable and necessary. [see for example, Fry Roofing Co. v. State Department of Health Air Pollution

Variance Board, 179 Colo. 223,499 P.2d 1176 (1972)]. In simplest terms, the Commission and the

Division have ample legal precedent and applicable statutes to guide them toward a set of rules with

flexibility to account for what are sure to be different tiers of cost and benefit for disparate areas such as

attainment areas of western Colorado and the nonattainment areas of Eastern Colorado.

The Division’s prehearing statement and draft proposed rules do not clearly show alignment between the

new regulatory requirements and a demonstrated and feasible implementation plan that is enforceable by

the Division without additional and unidentified dedicated resources. Other parties including the Local

Government Coalition and the Conservation Groups have proposed draft rule revisions and alternate

proposals that will compound the workload impact for the Division as relates to regulatory oversight and

enforcement. We understand the Division proposes reducing APEN permitting requirements as one way

to reduce staff workload but there still seems to be inadequate accounting for the resources needed to

enforce the proposed regulations. EPAC’s concern is that promulgation of even the best new regulations,

absent a sound plan to enforce them and demonstrate to the public and the regulated community that the

regulations are being enforced and are in fact providing the expected benefit could erode public

confidence. We request the Commission and Division communicate an effective enforcement and

evaluation strategy before approving new regulations.

Garfield County likely has implemented and self-funded the most comprehensive long-term baseline air

quality monitoring program of any rural county in the United States. This is indicative of the concern the

county has to ensure the best industry practices reasonably available are in place at all times and that we

can directly measure pollutant concentrations rather than rely on easily generated and grossly inaccurate

estimates of emissions as an indicator of what is in our air. This monitoring program requires annual

investment of over $250,000 each year plus 1.5 staff positions dedicated to the monitoring program and

related air quality management and improvement programs. Additionally, Garfield County recently

committed $1,000,000 to a first-in-kind world-class study to directly measure air emissions from oil and

gas drilling. Led by one of the world's premier scientists in the field, Dr. Jeffrey Collett, Colorado State

University's Atmospheric Science Department is currently conducting experiments over three years in the

Piceance Basin to help county commissioners make scientifically informed decisions. Following county

leadership, the State of Colorado found merit in our study and has engaged the same scientists to

similarly study drilling emissions in eastern Colorado, using our design. The point of this information is to

advise the Commission that our western Colorado Counties are the first to step up to ensure the best

science is developed to define and mitigate oil and gas impacts and we expect the Commission to

3

carefully consider this information to develop science-based regulations where practical as indicated in

Federal and state statutes.

Calculated air quality trends associated with criteria and non-criteria air pollutant levels indicate baseline

concentrations dropping over the past several years in EPAC counties, including Garfield County, where

longstanding and uniquely comprehensive air monitoring for concentrations of 80+ criteria and noncriteria

pollutants in western Colorado is apparently not being taken into consideration by the Division. EPAC

believes the Division, in its prehearing statement and in the draft proposed rules, erred by omission in

failing to discuss and account for substantial locally-funded (and Division supported and encouraged)

long-term air monitoring networks that produce hundreds of samples each year for a broad suite of VOCs

including many hazardous air pollutants (HAPs) and continuous monitor data for ozone and other criteria

pollutants at many locations in the EPAC attainment area. This omission seems counter to applicable

statutes. These monitoring data are readily accessible and should have been utilized by the Division and

other Parties to the rulemaking for the purpose of developing science-based proposed rules and alternate

proposals for attainment areas that may or may not mesh exactly with proposed rules for nonattainment

areas. Our point is that the analysis and consideration of the voluminous ambient air quality data should

be evaluated as new regulations are drafted. In rebuttal, EPAC provides Exhibits in the form of monitoring

reports, statistical summaries and trends calculations for consideration by the Commission.

The Local Community Organizations, in their prehearing statement has requested greater transparency

through public access to site inspection and other compliance data. EPAC agrees with this concept within

reasonable constraints and emphasizes the value of this transparency will come from an inspection

program that also requires the Division to consistently review Leak Detection and Repair (LDAR)

inspection reports and to publicly post periodic LDAR program information that informs the public and the

regulated community how and if the program is achieving stated goals.

WPX Energy, in their prehearing statement at Exhibit A, Figure 4, has provided compelling information

regarding the diminishing return on investment for repeated LDAR cycles. WPX requests reduced

instrument based monitoring inspection frequencies within narrow circumstances including those where

an operator demonstrates a high degree of success finding, repairing and ultimately preventing leaks

going forward. Perhaps this is an area where some flexibility and difference between rules in attainment

and nonattainment areas could be accommodated and where a statewide rule is not strictly required or

supported by existing data. The EPAC coalition provides rebuttal data regarding ambient air quality

conditions that supports the notion that air quality impacts (and emissions that cause them) within the

EPAC area are declining rather than increasing as some prehearing statements seem to indicate. The

EPAC coalition plans to provide testimony regarding the Division’s proposed LDAR frequency and the

more intensive LDAR proposals from other parties. Proposed regulations placing the burden of inspection

4

and reporting on the regulated community should apply common sense, non-punitive, approaches that

will most optimally and cost effectively help the Division reach its stated emission-control goals.

The EPAC coalition requests the Commission consider flexible time frames for implementation of specific

control measures and LDAR requirements in a manner that reasonably accounts for nonattainment

versus attainment areas relative to immediate need to reduce ozone precursor emissions. Western

Colorado, and the EPAC area in particular, is well within attainment and there should be some

opportunity to allow our regulated community an opportunity to make the investments necessary to

comply with new requirements that may be approved by the Commission.

The EPAC coalition restates from our prehearing statement our concern that the Division’s cost benefit

and regulatory analysis documents remain unavailable for review. Based on the information gaps evident

in the Division’s initial economic analysis and prehearing statement, EPAC requests the Commission

ensure an adequate cost benefit analysis includes fiscal impacts to local, County, State and Federal

governments. The Division cannot know if statewide rules are in fact the most reasonable and beneficial

approach unless it also evaluates non-statewide approaches. The EPAC coalition expects and looks

forward to reviewing a comprehensive cost benefit analysis document that recognizes and evaluates the

differential costs that will be required of: 1) different operators large and small and 2) different oil and gas

basins as well as the differential benefits to be derived between liquids-rich and dry gas basins.

The EPAC coalition supports stronger regulation of oil and gas emissions. However, there needs to be a

demonstrated balance within these stronger regulations to scale differing emissions reduction potential

and the implementation costs that certainly exist between liquids rich (and higher emission potential)

basins in eastern Colorado and the dry gas basins of western Colorado. The Division’s prehearing

statement and the referenced Initial Economic Analysis seem to make the case for against a one-size-fits-

all statewide rule: “…there are 6,422 tanks or tank batteries in the nonattainment area, and 8,080 tanks or

tank batteries state-wide.” The division then describes lofty growth projects for the liquids-rich DJ basin as

justification for the proposed statewide rule—EPAC disagrees with these broad assumptions and

mischaracterizations that so plainly ignore the differential benefits to be achieved between the

nonattainment and attainment areas. The lack of provided information about costs and benefits

significantly hinders our ability to effectively evaluate and provide definitive perspectives regarding the

Division’s proposed rule changes as currently drafted. We reserve the right to provide additional analysis,

comment and alternative proposals as warranted, including discussion of fiscal impacts to local

governments, once these crucial documents become available for review.

The Division’s prehearing statement and other documentation for the draft proposed rules provides overly

simplistic and exaggerated projections for growth in oil and gas activity in western Colorado oil and gas

basins. EPAC requests the Commission and Division provide more substantial analysis of industry growth

patterns and in a manner that reasonably addresses differences between western Colorado dry gas

5

basins and the liquids-rich basins in eastern Colorado. We note other parties, including the DGS group

have provided growth projection data and studies that may help the Commission ensure new regulations

are based on a sound understanding of the growth scenarios the regulations should account for. EPAC

reserves the right to provide testimony at the hearing related to western Colorado oil and gas activity

growth and retraction patterns characteristic of our area.

The EPAC coalition agrees with the prehearing statements made by several parties that note the

stakeholder process and discussions leading up to this rulemaking emphasized the need to fully

implement new EPA OOOO rules and to look for opportunity to reasonably reduce nonmethane VOCs.

The original premise was that improved control of greenhouse gases such as methane would be a

beneficial, albeit coincidental, outcome as reasonable control strategies were developed for the priority

hydrocarbon emissions targeted during the stakeholder meeting process. Ultimately the Division

partnered with only a fraction of the original stakeholder group and that smaller partnership developed

draft rules with a scope and primary goal (greenhouse gas emission control) not contemplated by the full

stakeholder group discussions over 8 months. EPAC remains challenged to fully endorse draft proposed

rules that clearly lack the expected and required full stakeholder discussion process. We continue to

review the draft rules and prehearing statements and look forward to reviewing rebuttal statements and

especially the Division’s regulatory and cost benefit analysis.

II. RESPONSE TO ISSUES RAISED BY PARTIES

The Air Pollution Control Division prehearing statement and statements from other parties including the

Local Government Coalition and the Local Community Organizations advocate for a statewide one-size-

fits-all set of rules as logical and appropriate. They hold to this position even as they fail to fairly and

reasonably consider readily available air quality monitoring data and studies that may indicate a flexible

science-based set of rules could equally, or perhaps more optimally and effectively, achieve stated

emission control goals while encouraging control investments where they are most needed. Some of

these same parties, including the Division, are the first to impress upon EPAC members such as Garfield

County that they should continue to invest heavily in air monitoring and assessments, so it seems

contradictory to then ignore this science at the critical moment when they can best be used to inform this

critical rulemaking process.

Air quality resources throughout the west slope and within the EPAC boundaries are generally considered

good to pristine and similar to background levels found throughout the rural western US. Based on

available data, only in nearfield, source-dominated environments (e.g., along roadways, within city and

town areas, and downwind of industrial or resource development facilities) are there measured

concentrations above those background levels. In most cases these impacted receptors are nearfield to

6

the emission sources and not necessarily indicative of regionally persistent impacts. Only ozone data

demonstrates an area and regional impact.

EMISSIONS

The EPAC coalition area, like many western Colorado regions, is in a relatively complex terrain and

mostly rural setting. Air pollutant emissions at most western Colorado locations can be dominated by

mobile sources (e.g., diesel trucks, automobiles industry and farm equipment), biogenic sources (e.g.,

forest turpine and forest fires), residential heating (e.g., natural gas and wood), oil and gas exploration

and production, and electric power generation (CDPHE, 2013). Although it is understandable that the

VOC emissions are dominated by E&P and naturally occurring biogenics, total annual VOC emissions are

still considered relatively low, relative to urban airsheds.

The EPAC coalition review of the Division’s and other parties prehearing statements indicate they are

flawed to the extent they propose statewide control measures but fail to consider that over the past 6

years, the oil and gas industry in western Colorado has implemented enhanced emissions control

technology and made operational changes to reduce volatile organic compounds (VOCs) and hazardous

air pollutants (HAPs). For instance, industry began implementing green completions as early as 2002

and this practice became a requirement in the 2008 COGCC rule making. Enclosed vapor combustors

were added to control emissions from condensate tanks with the potential to emit more than 20 tons of

VOCs per year and in Garfield, Mesa, and Rio Blanco Counties (2008 COGCC rule making). These

vapor combustors typically reduce VOC emissions by over 98%. Enclosed vapor combustors were also

added to condensate, crude oil, and produced water tanks with the potential to emit more than 5 tons of

VOCs per year located within a quarter mile of a building. Glycol dehydration units located in Garfield,

Mesa, or Rio Blanco Counties which have the potential to emit move than 5 tons of VOCs per year

located within a quarter mile of a building are also required to be controlled and reduce VOC emissions

by at least 90 percent.

Industry has also reduced VOC and HAP emissions by constructing centralized water management

facilities that significantly reduce truck traffic and associated emissions. These facilities also include

rigorous control technologies that satisfy the State’s Regulation 7 RACT requirements. These centralized

water management strategies have replaced trucks that were needed for well servicing and reduced truck

traffic (36,100 fewer water truck trips in Garfield County for WPX Energy in 2013) (Tyler Bittner,

Engineering team lead, WPX Energy written commun. Jan. 29, 2014). Finally, Industry has also removed

and replaced high bleed pneumatic devices with low or no bleed units in response to 2008 COGCC rule

making and in preparation of NSPS Subpart OOOO and proposed state Regulation 7 requirements.

All of these technology and operational changes have resulted in reduced impacts to air quality resources

in the region. This is reflected in the Garfield County ambient air quality data and data for the surrounding

7

west slope. With current state and federal E&P regulatory programs already in place combined with the

economic incentives to minimize emissions and capture product for sale, the proposed statewide

rulemaking requirements seem unlikely to have the intended and proportional beneficial impact on air

resources for the disproportionate costs to industry.

Ozone on the other hand is not a directly emitted pollutant but requires a complex combination of oxides

of nitrogen (NOx) and volatile organic compounds (VOCs) in significant quantity, plenty of solar energy,

and extended residence time (days) to form at elevated concentrations. These characteristics make

localized formation in remote locations difficult to achieve. Measured ambient ozone concentrations in

isolated rural areas like Garfield and surrounding counties are believed to be primarily the result of

regional and long range transport into the area as evidenced by ozone data compiled by the Division

(CDPHE, 2014). Modeling studies indicate that on average, 95% of the peak predicted ozone (i.e., 82

ppb) and 92% of the fourth highest predicted ozone (i.e., 74 ppb) in 2008 at monitors in Garfield county

are primarily due to precursor emissions and ozone coming from outside the state of Colorado (Environ,

2013). This reflects long range contribution from natural sources (e.g., stratospheric injection, western US

forest fires, etc.), from western U.S. urban centers (e.g. Los Angeles, San Francisco, Las Vegas, etc.),

and from international transport into North America (e.g., Lin et al., 2014). This is additionally exacerbated

by naturally occurring biogenic contributions upwind from the surrounding region.

Emissions of HAPs such as benzene, formaldehyde, polycyclic aromatic hydrocarbon (PAHs), etc. are

highly localized and generally associated with short-term events with limited exposure. An important

example of these emissions, relevant to air quality resources on the west slope, include formaldehyde

and benzene from internal combustion engines, exploration and production, diesel particulate matter and

associated polycyclic aromatic hydrocarbons (PAHs), and benzo(a)pyrene and benzene from wood

smoke, all of which are proven human carcinogens. These sources are prevalent on the west slope.

AMBIENT AIR IMPACTS

Criteria Pollutants

Ambient air quality monitoring is a direct measurement of air quality impacts at any given receptor. Based

on the Garfield County 2012 Air Quality Monitoring Summary (Exhibit 1), concentrations of all criteria

pollutants measured are well-below applicable NAAQS thresholds. This includes continuous monitoring

of ozone, nitrogen dioxide and particulate matter. Concentrations of carbon monoxide, sulfur dioxide, and

lead in western Colorado are extremely low, at or near instrument detection levels (Air Pollution Control

Division, 2013) and are not routinely monitored because of a lack of significant emissions.

Summer Ozone

As rebuttal to Division and other prehearing statements that statewide control measures will improve

ozone levels statewide, including within the EPAC area, a review of a Division-provided compilation of

8

ambient data, summary statistics and data graphs of collected ozone data are provided (CDPHE, 2014).

Central and western Colorado over the past 23 years show background contribution to Garfield County

ozone levels unchanged or slightly lower since 1990. The Gothic station, located between Gunnison and

Crested Butte, is isolated from E&P development and other localized and near-region air emissions and

would be considered representative of background ozone levels into Garfield County. Ozone data

collected for Gothic shows 3-year averages of the 4th highest 8-hour concentrations at 70 ppb for the

period 1990-1998 and lower at 70 ppb for 2004-2013 (EPA, 2014a). These data also indicates ozone

concentrations in Garfield County and Mesa County are well below the applicable ambient air standard.

Ozone data collected at southwest Colorado stations upwind of Garfield County in the summertime

include Mesa Verde and Ignacio (CDPHE, 2014). This ozone data at Mesa Verde and Ignacio show

identical characteristics with 3-year averages of 4th highest 8-hour concentrations for 1994 through 2001

averaging 67 ppb and 66 ppb respectively (EPA, 2014b). This pattern repeats for the period, 2008

through 2013, with Mesa Verde 69 ppb, Ignacio 67 ppb, and Cortez 67 ppb and Rifle the lowest at 65 ppb

(EPA 2014b). This clearly demonstrates measured ozone impacts in Garfield County are the result of

transport into the region from outside the state and not the result of localized emissions impacts. This

pattern repeats itself throughout western Colorado and re-enforces the belief that the proposed

rulemaking would have no effect on ozone impacts in western Colorado.

0.060

0.065

0.070

0.075

0.080

19

90

-19

92

19

91

-19

93

19

92

-19

94

19

93

-19

95

19

94

-19

96

19

95

-19

97

19

96

-19

98

19

97

-19

99

19

98

-20

00

19

99

-20

01

20

00

-20

02

20

01

-20

03

20

02

-20

04

20

03

-20

05

20

04

-20

06

20

05

-20

07

20

06

-20

08

20

07

-20

09

20

08

-20

10

20

09

-20

11

20

10

-20

12

20

11

-20

13

Par

ts p

er

mil

lion

Year

8-Hour Ozone --- 3-year Avg. of 4th Max. Western Slope (key sites)

EPA-Gothic

Palisade

Colorado NM

BLM-Meeker

Rifle

BLM-Rangely

Lay Peak

8-hr. NAAQS = 0.075 ppm

2013 thru 9/30

9

Winter Ozone

Where ozone is considered a summertime pollutant, over the past few years there have been several

elevated ozone events in winter-type conditions in the intermountain region (i.e., Utah, Wyoming and

Colorado) that have exceed the NAAQS threshold. Importantly, where ozone is considered a

summertime pollutant, this has occurred in wintertime conditions and in select E&P source-dominated

locations with unique and easily identifiable topographical settings. Referred to as cold pool ozone, to

form it requires sustained snow cover; shallow and persistent (i.e., days) stable atmospheric layer at

ground level and; accumulation of trapped pollutants in a restricted dispersion topography (e.g., basin-

type) with little air exchange (Lyman et al., 2013). As can be seen by the regional 8-hour average data

previously discussed, this pollution cannot be transported to other locations, including Garfield County.

Any winds capable of advecting this cold, dense air would mix and dilute the plume thereby reducing the

concentrations to background levels. Rangely and Dinosaur, both unique in their topographical setting,

have documented these events which are under intense study by industry and research community.

However, both locations cannot be generalized as typical statewide exposures. This suggests statewide

rulemaking for a unique exposure is not economically responsible nor an efficient strategy. More needs to

be learned about this unique condition before an emissions control strategy is developed for the Rangely

area.

Non-Criteria Air Pollutants

In rebuttal to prehearing statement assertions by the Division and others that statewide emissions

controls are advisable without first reviewing relevant and available data, the EPAC coalition provides

0.050

0.055

0.060

0.065

0.070

0.075

0.080

19

90

-19

92

19

92

-19

94

19

94

-19

96

19

96

-19

98

19

98

-20

00

20

00

-20

02

20

02

-20

04

20

04

-20

06

20

06

-20

08

20

08

-20

10

20

10

-20

12

Par

ts p

er m

illio

n

Year

8-Hour Ozone --- 3-year Avg. of 4th Max. Southwest area

USFS-Shamrock

SUIT-Ignacio

SUIT-Hwy 550

Mesa Verde NP

Cortez

8-hr. NAAQS = 0.075 ppm

2013 thru 9/30

10

rebuttal exhibits and data summaries. Garfield County likely has implemented the most comprehensive

long-term baseline air quality monitoring program of any rural county in the United States. This is

indicative of the concern the county has to ensure the best industry practices are in place and that we can

directly measure ambient pollutant concentrations rather than rely on easily generated and grossly

inaccurate estimates of emissions as an indicator of what is in our air. This program requires annual

investment of over $250,000 each year plus 1.5 staff dedicated to the monitoring program and related air

quality management and improvement programs. This does not include the $1,000,000 Garfield County

recently committed to first-in-kind world-class study to directly measure air emissions from oil and gas

drilling. Led by one of the world's premier scientists in the field, Dr. Jeffrey Collett, Colorado State

University's Atmospheric Science Department is currently gathering data over three years in the Piceance

Basin to help commissioners make scientifically informed decisions. Following county leadership, the

State of Colorado found merit in our study and has engaged the same scientists to similarly study drilling

emissions in eastern Colorado, using our design. The point of this information is to advise the

Commission that our western Colorado Counties are the first to step up to ensure the best science is

utilized to define and mitigate oil and gas impacts and we expect the Commission to carefully consider

this information to develop science-based regulations where practical as indicated in Federal and state

statutes.

We operate five long-term air quality monitoring stations located in Parachute, Battlement Mesa, Rifle,

Carbondale, and mobile collection equipment that collects air quality samples every six days (Exhibit 1

and Exhibit 2). Unlike many monitoring programs, ours continually invests in data review and

interpretation including annually published summary reports (ARS 2009, 2010, 2011 and 2012) and

invited public health risk assessments (CDPHE, 2010) which enables us to keep the pulse of air quality

in our area. Annual reports and other County air monitoring efforts have produced an unparalleled data

set one that shows we have very good air quality and it is improving every year. These monitoring data

are well known to the Division, readily accessible and should have been utilized by the Division and other

Parties to the rulemaking for the purpose of developing science-based proposed rules and alternate

proposals for attainment areas that may or may not mesh exactly with proposed rules for nonattainment

areas.

These data include speciated VOCs and other hazardous air pollutants such as formaldehyde, benzene,

polycyclic aromatic hydrocarbons (PAHs). Although not widely monitored throughout western Colorado,

non-criteria pollutant data are densely collected in Garfield County and show decreasing annual trends in

measured ambient concentrations throughout the county from 2008 to 2012 (Air Resource Specialists,

2013).. These concentrations are generally well below significance level or potential adverse human

heath thresholds.

11

Table 4-1 from Rebuttal Exhibit 1 Garfield County 2012 Air Quality Monitoring Summary.

Parachute Site

Annual Average Mass Trends (HAPs Parameters)

2008-2012

p-value in bold blue indicates significantly decreasing 2008-2012 concentration trend

HAP

Average Mass (µg/m3) Slope (µg/m3

per year)

p-Value 2008 2009 2010 2011 2012

1,2,4-Trimethylbenzene 0.91 0.62 0.42 0.43 0.39 -0.11 0.04

1,3,5-Trimethylbenzene 0.61 0.51 0.40 0.22 0.18 -0.11 0.01

1,3-Butadiene 0.08 0.12 0.10 0.10 0.09 0.00 0.59

Acetaldehyde 1.11 0.99 0.92 0.90 0.75 -0.08 0.01

Acetone 3.42 3.28 2.67 2.79 2.34 -0.26 0.04

Benzene 2.31 2.69 1.74 1.44 1.31 -0.28 0.04

Crotonaldehyde 0.10 0.10 0.12 0.09 0.08 -0.01 0.24

Cyclohexane 3.92 3.77 2.90 2.22 1.99 -0.54 0.01

Ethylbenzene 0.59 0.44 1.04 0.32 0.17 -0.10 0.12

Formaldehyde 1.74 1.73 1.53 1.64 1.27 -0.11 0.04

Isopropylbenzene 0.09 0.08 0.07 0.08 0.06 -0.01 0.04

Methylcyclohexane 9.24 9.43 6.41 4.65 4.19 -1.47 0.04

m-Xylene/p-Xylene 3.91 3.63 2.20 1.11 1.15 -0.84 0.04

n-Hexane 5.78 5.64 3.93 3.34 3.01 -0.75 0.01

n-Nonane 2.20 2.01 1.13 0.97 0.61 -0.40 0.01

n-Propylbenzene 0.18 0.15 0.13 0.10 0.10 -0.02 0.01

o-Xylene 0.77 0.65 0.43 0.40 0.27 -0.13 0.01

Propionaldehyde 0.12 0.09 0.09 0.09 0.07 -0.01 0.04

Propylene 0.57 0.57 0.62 0.55 0.69 0.03 0.41

Styrene 0.12 0.08 0.12 0.13 1.56 0.04 0.04

Toluene 9.86 5.83 3.96 5.79 4.27 -1.38 0.12

12

Benzene is one of the non-criteria pollutants measured that has its origin from E&P gas production,

gasoline burning engines, and wood combustion. Over the past 5 years (2008-2012), average benzene

concentrations have dropped throughout Garfield County with current annual average concentrations less

than 0.3 ppb and maximum levels for the most recent 2 years, generally less than 1.5 ppb. For

comparison the Alberta, Canada Ambient Air Quality Objective (Standard) for benzene (Alberta

Government, 2013.) is 9 ppb for a 1-hour average and 0.9 ppb for an annual average. That is 3 times

higher than the Garfield County annual average at a Canadian location that has seen significant E&P

development. National Institute of Occupational Safety and Health (NIOSH) and the Occupational Safety

and Health Administration (OSHA) have set chronic exposures at or well above 100 ppb, nearly one

thousand times higher than Garfield County averages.

0

20

40

60

80

100

120

140

160

180

200

20

08

20

09

20

10

20

11

20

12

20

08

20

09

20

10

20

11

20

12

20

08

20

09

20

10

20

11

20

12

Parachute Rifle Bell-Melton

SN

MO

C (

pp

bV

)

Garfield County SNMOC Sites 2008-2012 Annual Averages

Alkenes

Aromatics

Heavy Alkanes

Light Alkanes

13

0 10 20 30 40 50 60 70 80 90

Parachute Rifle Bell-Melton

Co

nc

en

tra

tio

n (

pp

bv)

Garfield County Annual Average Trends Ethane

2008 2009 2010 2011 2012

0

0.1

0.2

0.3

0.4

0.5

0.6

0.7

0.8

0.9

Parachute Rifle Bell-Melton

Co

nc

en

tra

tio

n (

pp

bv)

Garfield County Annual Average Trends Benzene

2008 2009 2010 2011 2012

14

Legal Analysis

The EPAC coalition is concerned that the Division’s proposed rules and assertions made in their

prehearing statement regarding development and application of a statewide emission control rule is

counter to well established case law and Federal and state statutes. By rule, the air quality standards

adopted by the Colorado Air Quality Control Commission (Commission) may vary for different parts of the

state "as may be necessitated by variations in altitude, topography, climate, or meteorology." [CRS 25-7-

108(1)(a)]. Expanding on the foregoing statutory language in light of apparent legislative intent, the

Colorado Supreme Court found that the Commission regulations addressing those variables must be

formulated with regard to the various factors that constitute, produce or dispel air pollution, describe

maximum concentrations of contaminants that can be tolerated, consider the degree to which particular

types of emissions are subject to treatment, and consider the continuous, intermittent, or seasonal nature

of the emission to be controlled. According to the Court, the Commission's action must also be both

reasonable and necessary. [see for example, Fry Roofing Co. v. State Department of Health Air Pollution

Variance Board, 179 Colo. 223,499 P.2d 1176 (1972)].

Western Colorado is remotely populated with a complex terrain setting characterized by good to pristine

air quality resources. This is much different than exists within the Denver and Northern Front Range

urban corridor that is also within the State’s only nonattainment area. The source-receptor geometry and

atmospheric dispersion conditions are also substantially different between the two. Western Colorado

ambient air quality data is compelling and shows trends that reflect successful implementation of

advanced emissions control technologies. Therefore, there does not appear to be sufficient reason to

simply assume the proposed rulemaking, in current form, will have any reasonably predictable effect on

impacts to air quality resources on a statewide basis and for western Colorado in particular. For this

reason, the EPAC coalition again requests the Commission closely scrutinize the available air quality data

available within this rebuttal statement and elsewhere and ensure the best science is applied in the place

of loosely estimated calculations of air quality benefits and a less than rigorous attempt to adhere to the

prevailing statutes and case law that urge caution before ignoring ready opportunities to understand the

air quality dynamics of an area before attempting to impose new regulations.

15

III. LIST OF WITNESSES

At this time the EPAC Coalition is unable to determine all rebuttal witnesses who may be called upon until

we are afforded opportunity to review the unreleased regulatory analysis and cost benefit analysis and

have opportunity to review the rebuttal statements from other parties. As a result, EPAC not only reserves

the right but expects to list further witnesses either jointly or as individual counties in response to other

parties’ rebuttal statements.

Witnesses may include EPAC coalition county staff and elected officials. Selected consultants and topical

experts as may be needed to provide rebuttal testimony, including, without limitation:

Dr. Robert A. Arnott, Principal/Owner, Strategic Environmental Analysis. Dr. Arnott may testify regarding

the Division’s proposed regulatory changes as well as any issues raised in connection with these issues.

Dr. Arnott may testify regarding timelines for regulation implementation and relationships to cost benefit

claims made by any party. Dr. Arnott testify regarding any alternative proposals submitted by other

parties. Dr. Arnott may testify regarding the relationship of methane emissions to ozone NAA impacts. Dr.

Arnott may testify regarding issues other parties raise regarding EPAC prehearing statements, rebuttal

statements, alternative proposals and testimony.

Mr. Kirby Wynn, Oil and Gas Liaison for Garfield County. Mr. Wynn may testify regarding the Division’s

proposed regulatory changes as well as any issues raised in connection with these issues including other

parties’ alternative proposals and rebuttal statement and the cost benefit and regulatory analysis. Mr.

Wynn may testify regarding issues other parties raise regarding EPAC prehearing statements, rebuttal

statements, alternative proposals and testimony.

Dr. Jim Wilkinson, senior consultant with Golder Associates. Dr. Wilkinson may testify regarding the

Division’s proposed regulatory changes as well as any issues raised in connection with these issues

including other parties’ alternative proposals and rebuttal statements. Dr. Wilkinson may testify regarding

the relationship of methane and nonmethane hydrocarbon emissions to ozone NAA impacts and other

impacts. Dr. Wilkinson may testify regarding issues other parties raise regarding EPAC prehearing

statements, rebuttal statements, alternative proposals and testimony.

16

IV. EXHIBITS AND REFERENCES Exhibit 1, Air Resource Specialists (ARS). 2013. Garfield County 2012 Air Quality Monitoring Summary. Produced for Garfield County Public Health Department. Available online at http://www.garfield-county.com/air-quality/documents.aspx. Exhibit 2, 2013, Garfield County air quality monitoring program design. Exhibit 3, Two Regional Ozone plots inserted to rebuttal statement text: Colorado Department of Public Health and Environment, Air Pollution Control Division. “Western Colorado Ozone Graph”. 17 January 2014. Gordon Pierce written communication. Exhibit 4, Air Resource Specialists (ARS). 2014. Letter transmittal of data and results References cited Air Resource Specialists (ARS). 2009. Garfield County 2008 Air Quality Monitoring Summary. Produced for Garfield County Public Health Department. Available online at http://www.garfield-county.com/air-quality/documents.aspx. Air Resource Specialists (ARS). 2010. Garfield County 2009 Air Quality Monitoring Summary. Produced for Garfield County Public Health Department. Available online at http://www.garfield-county.com/air-quality/documents.aspx. Air Resource Specialists (ARS). 2011. Garfield County 2010 Air Quality Monitoring Summary. Produced for Garfield County Public Health Department. Available online at http://www.garfield-county.com/air-quality/documents.aspx. Air Resource Specialists (ARS). 2012. Garfield County 2011 Air Quality Monitoring Summary. Produced for Garfield County Public Health Department. Available online at http://www.garfield-county.com/air-quality/documents.aspx. Air Resource Specialists (ARS). 2013. Garfield County 2012 Air Quality Monitoring Summary. Produced for Garfield County Public Health Department. Available online at http://www.garfield-county.com/air-quality/documents.aspx. Alberta Government. “Alberta Ambient Air Quality Objectives and Guidelines Summary.” August 2013. Available online at http://environment.gov.ab.ca/info/library/5726.pdf Garfield County Public Health Department. December 2007. Garfield County Ambient Air Quality Monitoring Summary: June 2005-May 2007. Available online at http://www.garfield-county.com/air-quality/documents.aspx. Colorado Department of Public Health and Environment, Air Pollution Control Division. “2013 Stakeholder Meeting #2”. 28 February 2013. PowerPoint Presentation. Colorado Department of Public Health and Environment, Air Pollution Control Division. “Colorado Air Quality Data Report.” November 2013. Available online at http://www.colorado.gov/airquality/tech_doc_repository.aspx Colorado Department of Public Health and Environment, Air Pollution Control Division. “Western Colorado Ozone Graph”. 17 January 2014. Gordon Pierce written communication.

17

Colorado Department of Public Health and Environment, Disease Control and Epidemiology Division. “Garfield County Air Toxics Inhalation: Screening Level Human Health Risk Assessment: Inhalation of Volatile Organic Compounds Measured in 2008 Air Quality Monitoring Study.” June 2010. Available online at http://www.garfield-county.com/environmental-health/human-health-risk-of-oil-gas.aspx Environ. “Western Regional Air Partnership (WRAP) West-wide Jump-start Air Quality Modeling Study (WestJumpAQMS): Final Report.” September 2013. Prepared for Tom Moore, Western Regional Air Partnership. Prepared by Environ International Corporation, Alpine Geophysics, LLC, and University of North Carolina. www.wrapair2.org/pdf/WestJumpAQMS_FinRpt_Finalv2.pdf, www.wrapair2.org/pdf/Appendix_B_O3_10hi_Model_Days.xlsx EPA (2014a). CASTNET, Download Data, Ozone 8HR DMAX. http://java.epa.gov/castnet/epa_jsp/prepackageddata.jsp EPA (2014b). AirData. http://www.epa.gov/airdata/ad_data_daily.html EPA (2013a). Curently Designated Nonattainment Areas for All Criteria Pollutants. www.epa.gov/oaqps001/greenbk/ancl.html Lin, Jintai; Pan Da; Davis, Steven J.; Zhang, Qiang; He, Kebin; Wang, Can; Streets, David G.; Wuebbles, Donald J.; and Guan, Dabo. “China’s international trade and air pollution in the United States.” PNAS 2014 ; published ahead of print January 21, 2014. www.pnas.org/content/early/2014/01/16/1312860111.full.pdf+html?with-ds=yes Lyman et al. 2013. 2013 Uintah Basin Winter Ozone & Air Quality Study. Utah State University. McNally, D. E., C. Loomis, R. Morris, and T. Saskulyanontvittaya “Draft Final Report: 2020 Ozone Source Apportionment Modeling for the Denver Area.” 2009. http://www.ozoneaware.org/postfiles/documentsandpresentations/modeling/Draft%20Final%202020_OSAT_Report.pdf

GARFIELD COUNTY 2012 AIR QUALITY MONITORING SUMMARY

Prepared for:

Garfield County Public Health Department 195 West 14th Street

Rifle, CO 81650

Prepared by:

July 31, 2013

kwynn
Typewritten Text
kwynn
Typewritten Text
kwynn
Typewritten Text
kwynn
Typewritten Text
kwynn
Typewritten Text
kwynn
Typewritten Text
EPAC Rebuttal Exhibit 1

TABLE OF CONTENTS

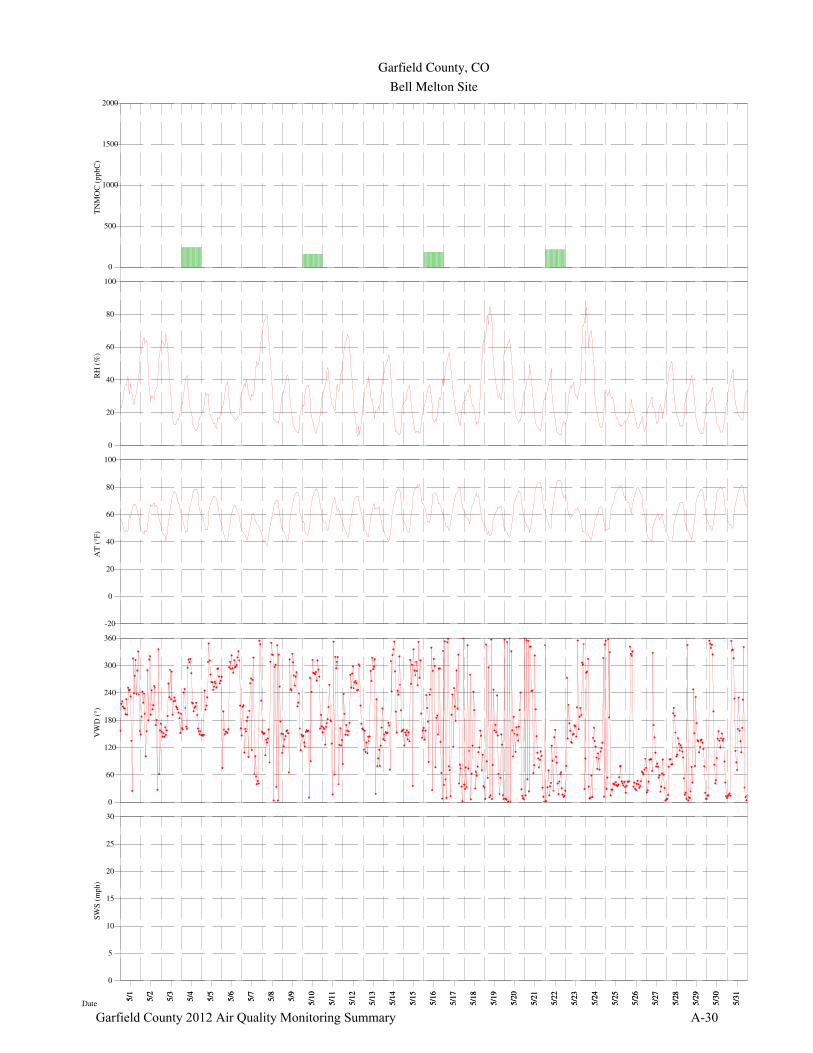
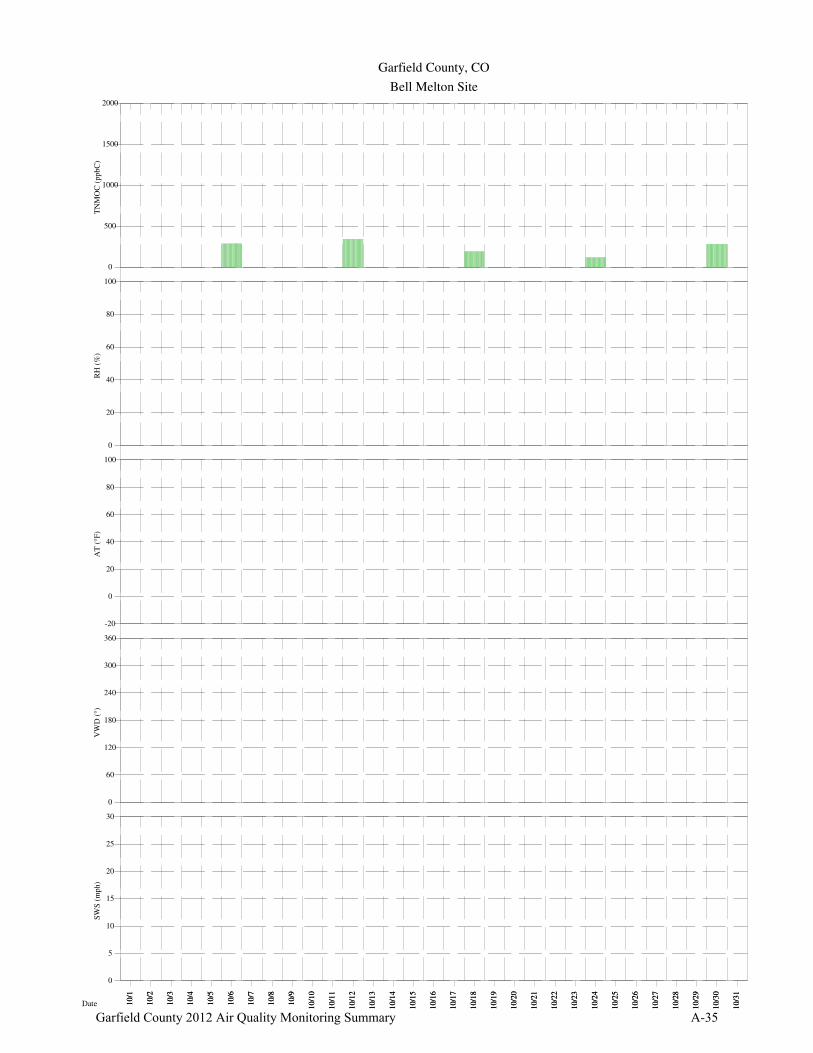
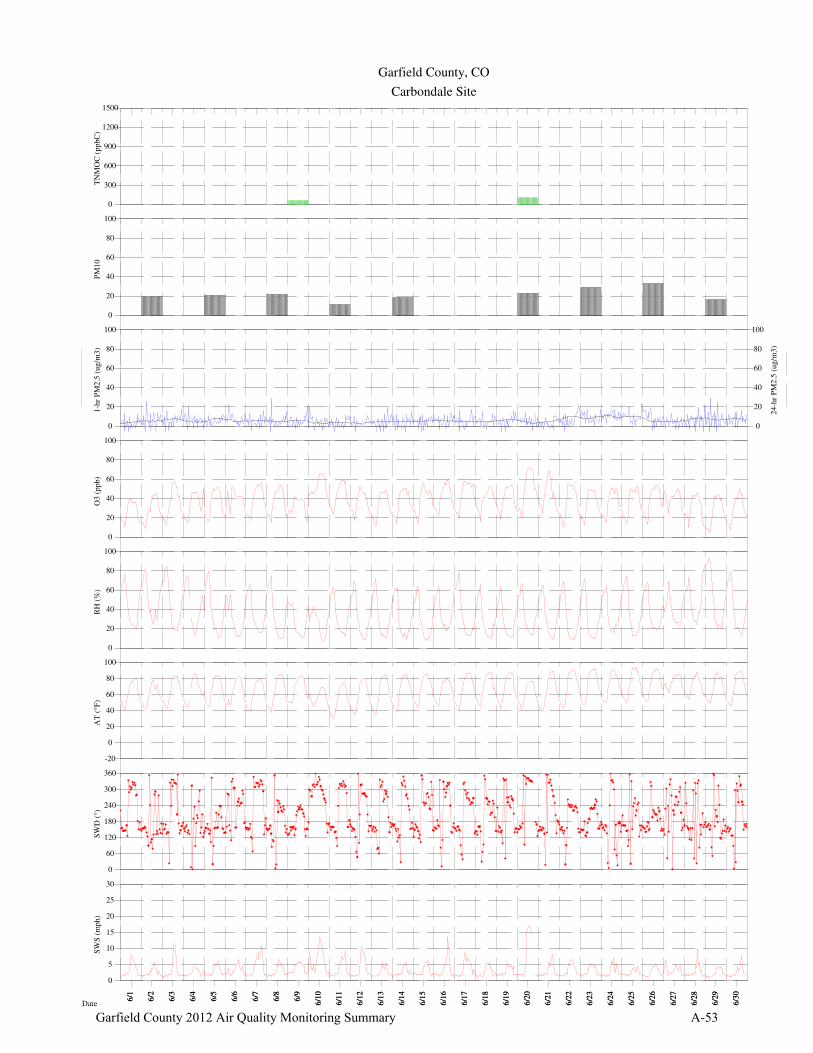
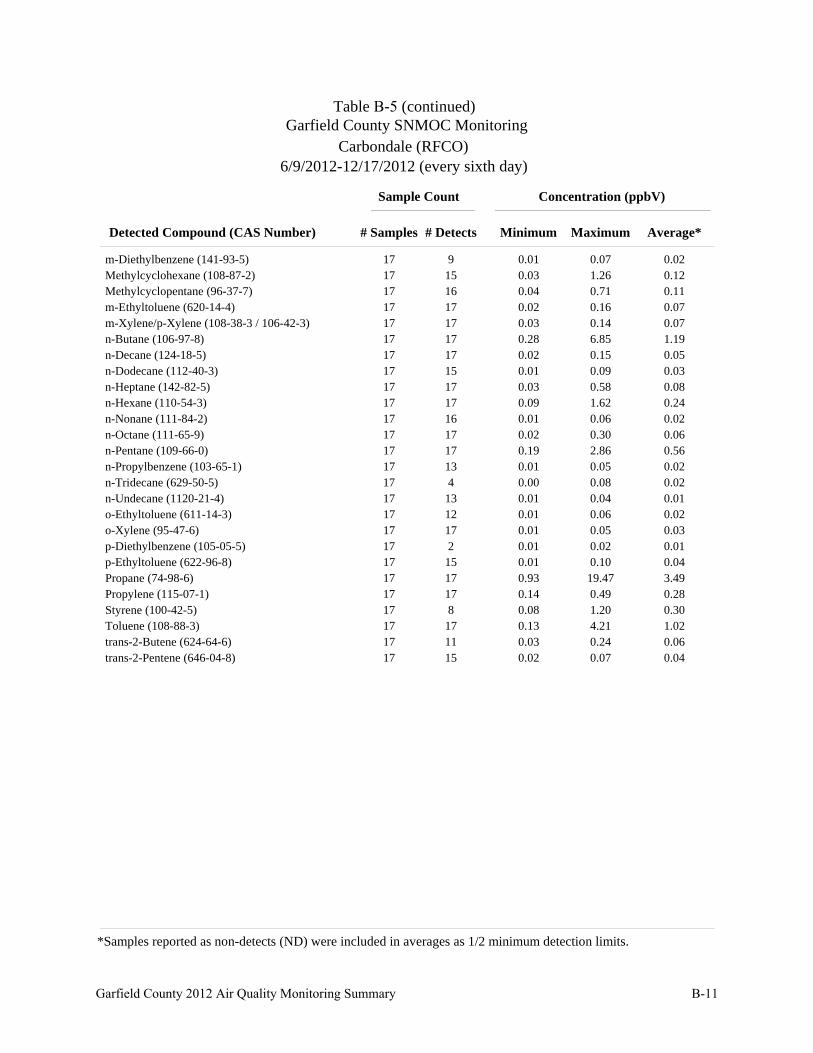
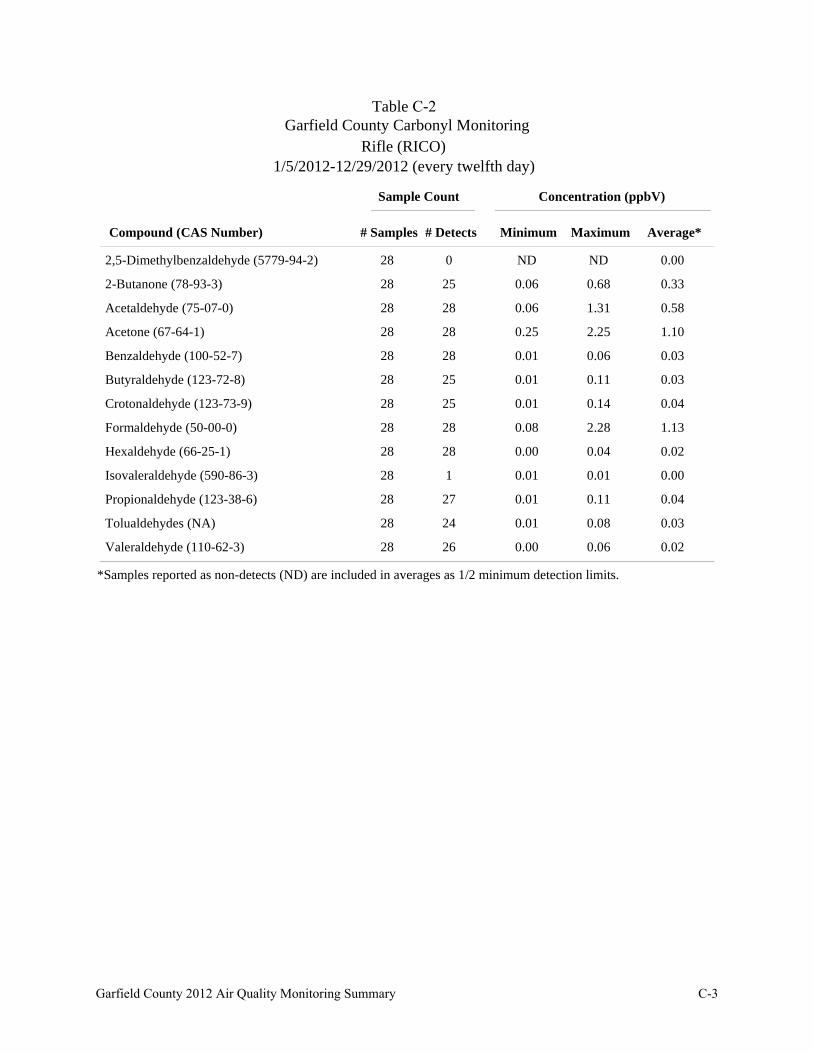
Section Page LIST OF ACRONYMS AND ABBREVIATIONS iv EXECUTIVE SUMMARY v 1.0 INTRODUCTION 1-1 2.0 METEOROLOGICAL SUMMARIES 2-1 3.0 CRITERIA POLLUTANT SUMMARIES 3-1 3.1 Ozone 3-5 3.2 Nitrogen Dioxide 3-8 3.3 Particulate Matter 3-9 3.3.1 Filter Based PM10 Measurements 3-9 3.3.2 Continuous PM Measurements 3-12 4.0 VOLATILE ORGANIC COMPOUNDS 4-1 4.1 Speciated Non-Methane Hydrocarbons 4-1 4.1.1 Annual Average SNMOCs 4-5 4.2 Carbonyls 4-5 4.2.1 Annual Average Carbonyl Concentrations 4-8 4.3 Hazardous Air Pollutants Summaries 4-9 4.3.1 Annual Average HAP Concentrations 4-9 5.0 REFERENCES 5-1 APPENDIX A Garfield County 2012 Monthly Time Series Plots A-1 APPENDIX B Garfield County 2012 SNMOC Concentrations B-1 APPENDIX C Garfield County 2012 Carbonyl Concentrations C-1

LIST OF FIGURES

Figure Page 1-1 Map of Garfield County Monitoring Sites 1-2 2-1 Map with Wind Roses Depicting 2012 Wind Speed and Direction Measured at the

Garfield County Monitoring Sites 2-1 3-1 2012 Diurnal Average Concentrations of Ozone and Nitrogen Dioxide Measured at the Battlement Mesa Site 3-6 3-2 Daily Maximum 8-Hour Averages of Ozone Monitored at the Rifle Site 3-7 3-3 Daily Maximum 8-Hour Averages of Ozone Monitored at the Battlement Mesa Site 3-7 3-4 Daily Maximum 8-Hour Averages of Ozone Monitored at the Carbondale Site 3-8

Garfield County 2012 Air Quality Monitoring Summary i

LIST OF FIGURES

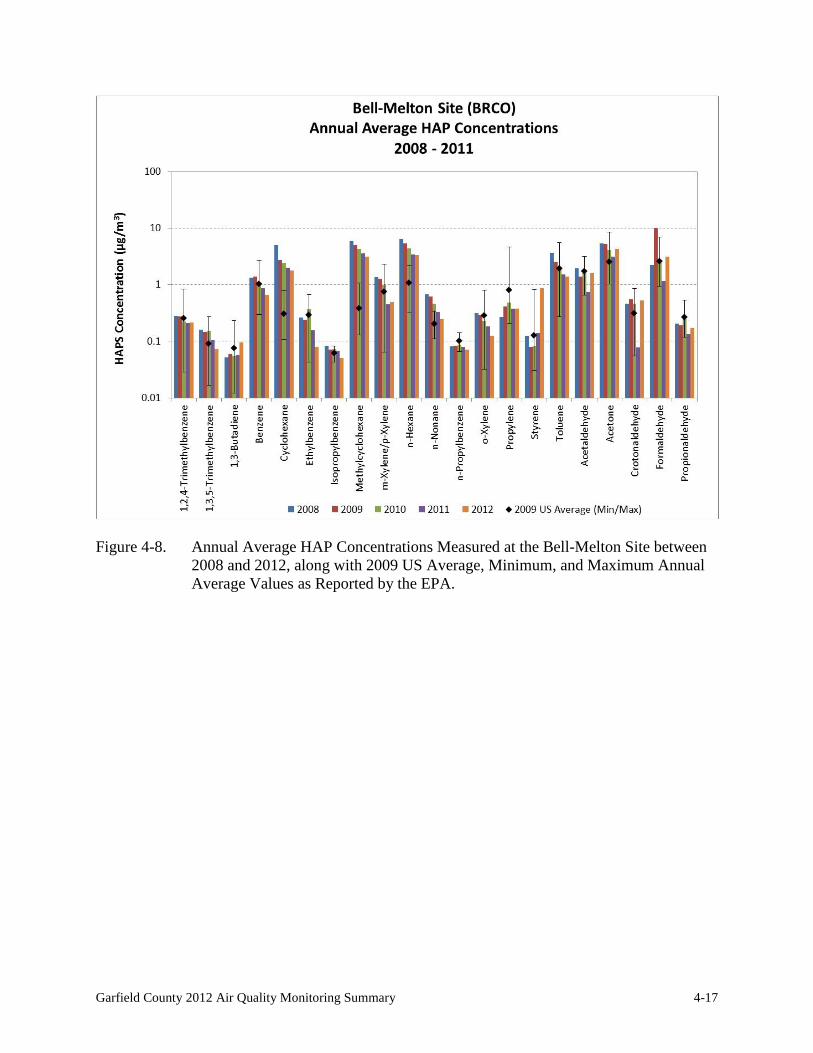
Figure Page 3-5 Daily Maximum 1-Hour Averages of Nitrogen Dioxide Monitored at the Battlement Mesa Site 3-9 3-6 Annual Average PM10 Measured at the Parachute Site 3-11 3-7 Annual Average PM10 Measured at the Rifle Site 3-11 3-8 Highest and Second Highest 24-Hour Average PM10 Measured at the Parachute Site 3-12 3-9 Highest and Second Highest 24-Hour Average PM10 Measured at the Rifle Site 3-12 3-10 Annual Average PM2.5 Measured at the Rifle Site 3-13 3-11 Highest and 98th Percentile 24-Hour Average PM2.5 Measured at the Rifle Site 3-13 4-1 2012 24-Hour SNMOC Measurements by Category in Units of ppbV 4-3 4-2 2012 24-Hour SNMOC Measurements by Category in Units of ppbC 4-4 4-3 Average SNMOC Concentrations Measured by the Garfield County Air Monitoring Program between 2008 and 2012 4-5 4-4 2012 24-Hour Major Carbonyl Compound Concentrations in Units of ppbV 4-7 4-5 Average Carbonyl Concentrations Measured by the Garfield County Air Monitoring Program between 2008 and 2012 4-8 4-6 Annual Average HAP Concentrations Measured at the Parachute Site between 2008 and 2012, along with 2009 US Average, Minimum, and Maximum Annual Average Values as Reported by the EPA 4-15 4-7 Annual Average HAP Concentrations Measured at the Rifle Site between 2008 and 2012, along with 2009 US Average, Minimum, and Maximum Annual Average Values as Reported by the EPA 4-16 4-8 Annual Average HAP Concentrations Measured at the Bell-Melton Site between 2008 and 2012, along with 2009 US Average, Minimum, and Maximum Annual Average Values as Reported by the EPA 4-17 4-9 Annual Average HAP Concentrations Measured at the Battlement Mesa Site between 2008 and 2012, along with 2009 US Average, Minimum, and Maximum Annual Average Values as Reported by the EPA 4-18

Garfield County 2012 Air Quality Monitoring Summary ii

LIST OF TABLES

Table Page 1-1 Garfield County Parameters Monitored by Site 1-3 3-1 2012 Standards Summary for the Rifle Site 3-2 3-2 2012 Standards Summary for the Parachute Site 3-2 3-3 Battlement Mesa Site Standards Summary 10/24/2012-12/31/2012 3-3 3-4 Carbondale Site Standards Summary 3/29/2012-12/31/2012 3-4 4-1 Parachute Site Annual Average Mass Trends (HAPs Parameters) 2008-2012 4-11 4-2 Rifle Site Annual Average Mass Trends (HAPs Parameters) 2008-2012 4-12 4-3 Bell-Melton Site Annual Average Mass Trends (HAPs Parameters) 2008-2012 4-13 4-4 Battlement Mesa Site Annual Average Mass Trends (HAPs Parameters) 2011-2012 4-14

Garfield County 2012 Air Quality Monitoring Summary iii

LIST OF ACRONYMNS AND ABBREVIATIONS

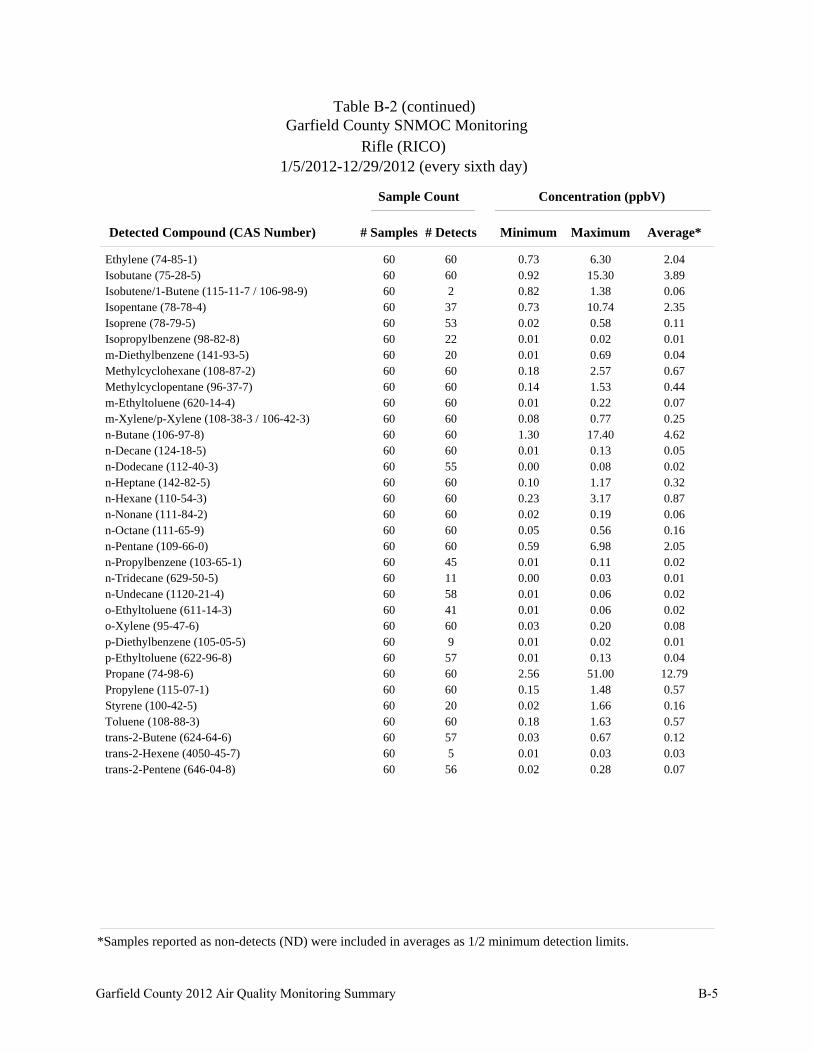
ARS Air Resource Specialists, Inc. ATSDR Agency for Toxic Substances and Disease Registry BMCO Battlement Mesa, Colorado Air Quality Monitoring Site BRCO Bell-Melton, Colorado Air Quality Monitoring Site BTEX Benzene, toluene, ethylbenzene, and xylenes CARB California Air Resources Board CDPHE Colorado Department of Public Health and Environment EPA U.S. Environmental Protection Agency ERG Eastern Research Group, Inc. FRM Federal Reference Method GCPHD Garfield County Public Health Department HAPs Hazardous Air Pollutants NAAQS National Ambient Air Quality Standards NATTS National Air Toxics Trends Stations NIOSH National Institute for Occupational Safety and Health NOX Oxides of nitrogen O3 Ozone PACO Parachute Creek, Colorado Air Quality Monitoring Site PM2.5 Particulate matter ≤ 2.5 microns in diameter PM10 Particulate matter ≤ 10 microns in diameter RICO Rifle, Colorado Air Quality Monitoring Site SNMOC Speciated non-methane organic compounds TEI Thermo Environmental Instruments TEOM Tapered Element Oscillating Microbalance TNMOC Total non-methane organic compounds UATMP Urban Air Toxics Monitoring Program VOC Volatile organic compounds

Garfield County 2012 Air Quality Monitoring Summary iv

EXECUTIVE SUMMARY This report summarizes air quality monitoring data collected during 2012 in Garfield

County, Colorado. Air quality is currently monitored at five locations in the county, which are all in close proximity to urban areas in the county, and to oil and gas development areas. Parameters monitoring include:

• Meteorology (e.g., wind speed, wind direction, temperature, relative humidity and

precipitation).

- Meteorological data are collected along with air quality parameters to better understand the local conditions and transport of air pollutants.

• Criteria pollutants (e.g. particulate matter ≤ 10 micrometers in diameter (PM10), particulate matter ≤ 2.5 micrometers in diameter (PM2.5), ozone (O3) and (NO2).

- Criteria pollutants are pollutants subject to National Ambient Air Quality Standards (NAAQS).

• Volatile organic compounds (VOCs), including subsets of speciated non-methane organic carbon (SNMOCs), carbonyls and hazardous air pollutants (HAPs).

Results through 2012 indicate that: • Air quality measurements in Garfield County did not violate NAAQS for PM10,

PM2.5, O3, or NO2.

• Total SNMOC measurements have decreased on an annual average basis since measurements began in 2008.

• Light alkanes (e.g., ethane, propane, iso/n-butane, and iso/n-pentane), which are commonly associated with natural gas, made up 83-89% of the total SNMOC compounds measured. These light alkanes may contribute to ozone formation and odor issues but are not considered HAPs.

Of the 78 SNMOC and 12 carbonyl compounds measured in Garfield County, 21

compounds are considered as HAPs. The health effects of HAPs measured in Garfield County were reported for data collected in 2008 in the Garfield County Air Toxics Inhalation Screening Level Human Risk Assessment (CDPHE 2010), which is available from the Garfield County Air Quality Management website (http://www.garfield-county.com/air-quality/). Findings of this risk assessment report indicated that, individually, the HAP components were below risk assessment criteria, but cumulative effects approached chronic (70-year exposure period) non-hazard levels. The largest contributors to the cumulative levels were benzene and formaldehyde. For HAPs measurements, results through 2012 indicate that:

• Most parameters, including benzene, showed statistically significant decreasing

annual average trends at all sites.

• Formaldehyde showed slightly decreasing trends at the more rural sites and no significant trend at the more urban Rifle site. Comparisons to regional measurements

Garfield County 2012 Air Quality Monitoring Summary v

indicated that formaldehyde was measured at much lower levels than larger nearby urban sites (e.g., Grand Junction).

• Of the 21 HAPS measured in Garfield County, the only parameter that showed an increasing annual average trend was styrene, which is primarily associated with the production of polystyrene plastics and resins.

Detailed air quality monitoring information through 2012 is provided in this report.

Additional information, including real-time air quality data, previous air quality data reports, educational materials, air quality management plans, emissions assessments, and health assessments are available from the Garfield County Air Quality Management website (http://www.garfield-county.com/air-quality/. Any questions regarding air quality in Garfield County should be addressed to:

Garfield County Public Health Department 195 West 14th Street

Rifle, CO 81650

Phone: 970-625-5200 Fax: 970-625-4804

Garfield County 2012 Air Quality Monitoring Summary vi

1.0 INTRODUCTION

Air quality monitoring in Garfield County has expanded in recent years in response to increases in citizens’ concerns regarding air quality in the area, especially related to increased population and the expansion of oil and gas development in the county. The Garfield County Public Health Department (GCPHD) has implemented and maintains a network of air quality monitors designed to serve a wide range of purposes, including monitoring of criteria pollutant levels, ozone formation potential, toxics assessments, and source attribution for specific pollutants. This annual air quality data report presents data collected in Garfield County through 2012. The 2012 monitoring network in Garfield County consisted of five monitoring locations, which are described below.

• Parachute (PACO): Parachute is a small urban center of approximately 1,300 people

within very close proximity to oil and development and production activities. The town is located along Interstate 70 and is the transportation hub for heavily traveled roads which service the surrounding canyons.

• Rifle (RICO): Rifle is a rapidly growing urban center on the Interstate 70 corridor with estimated population of about 9,200 people. Rifle is in close proximity to oil and gas development activities, and is also central to industrial support for the oil and gas industry.

• Bell-Melton (BRCO): The Bell-Melton site is a rural homestead approximately four miles south of the town of Silt, in close proximity to moderate oil and gas development and heavy natural gas production.

• Battlement Mesa (BMCO): Battlement Mesa is a rural community located about 1.5 miles southeast of Parachute. This site began operation in September 2010 in response to a proposed large natural gas development within to community, and to begin developing baseline data in advance of the project.

• Carbondale (RFCO): Carbondale is a rural community located about 12.5 miles southeast of Glenwood Spring at the confluence of the Roaring Fork and Crystal River valleys. The Carbondale, or Roaring Fork, monitor began monitoring in March 2012 to characterize air quality in the area and also to gather data downwind of the Colorado valley sites.

Figure 1-1 is a map of the monitoring sites and Table 1-1 lists the parameters monitored.

The GCPHD monitors pollutants and meteorology at these stations with technical support from several agencies, as noted in Table 1-1 near real-time. Real-time data, including camera images, are displayed on the Garfield County Air Quality Monitoring website (http://www.garfieldcountyaq.net).

Garfield County 2012 Air Quality Monitoring Summary 1-1

Figure 1-1. Map of Garfield County Monitoring Sites.

Garfield County 2012 Air Quality Monitoring Summary 1-2

Table 1-1

Garfield County Parameters Monitored by Site

Component Method Sampling Frequency Reporting Agency

Rifle, Colorado SNMOC TO-12 24-hour (1/6 day) ERG Carbonyls TO-11A 24-hour (1/12 day) ERG PM10 FRM 24-hour (1/3 day) CDPHE PM10 TEOM Hourly ARS PM2.5 TEOM Hourly ARS Ozone 42C Hourly ARS Meteorology Various Hourly ARS Visibility Web Camera Digital 15-min ARS

Parachute, Colorado SNMOC TO-12 24-hour (1/6 day) ERG Carbonyls TO-11A 24-hour (1/12 day) ERG PM10 FRM 24-hour (1/3 day) CDPHE Meteorology Various Hourly ARS

Bell-Melton, Colorado SNMOC TO-12 24-hour (1/6 day) ERG Carbonyls TO-11A 24-hour (1/12 day) ERG Meteorology Various Hourly GCPHD

Battlement Mesa, Colorado SNMOC TO-12 24-hour (1/6 day) ERG Carbonyls TO-11A 24-hour (1/12 day) ERG PM10 BAM Hourly ARS PM2.5 BAM Hourly ARS Ozone API Hourly ARS NO/NO2/NOX API Hourly ARS

CH4/NMHC/THC Baseline MOCON Hourly ARS

Meteorology Various Hourly ARS Carbondale, Colorado

SNMOC TO-12 24-hour (1/6 day) ERG Carbonyls TO-11A 24-hour (1/12 day) ERG PM10 FRM 24-hour (1/3 day) CDPHE PM2.5 E-BAM Hourly ARS Ozone 2B Hourly ARS Meteorology Various Hourly ARS

Garfield County 2012 Air Quality Monitoring Summary 1-3

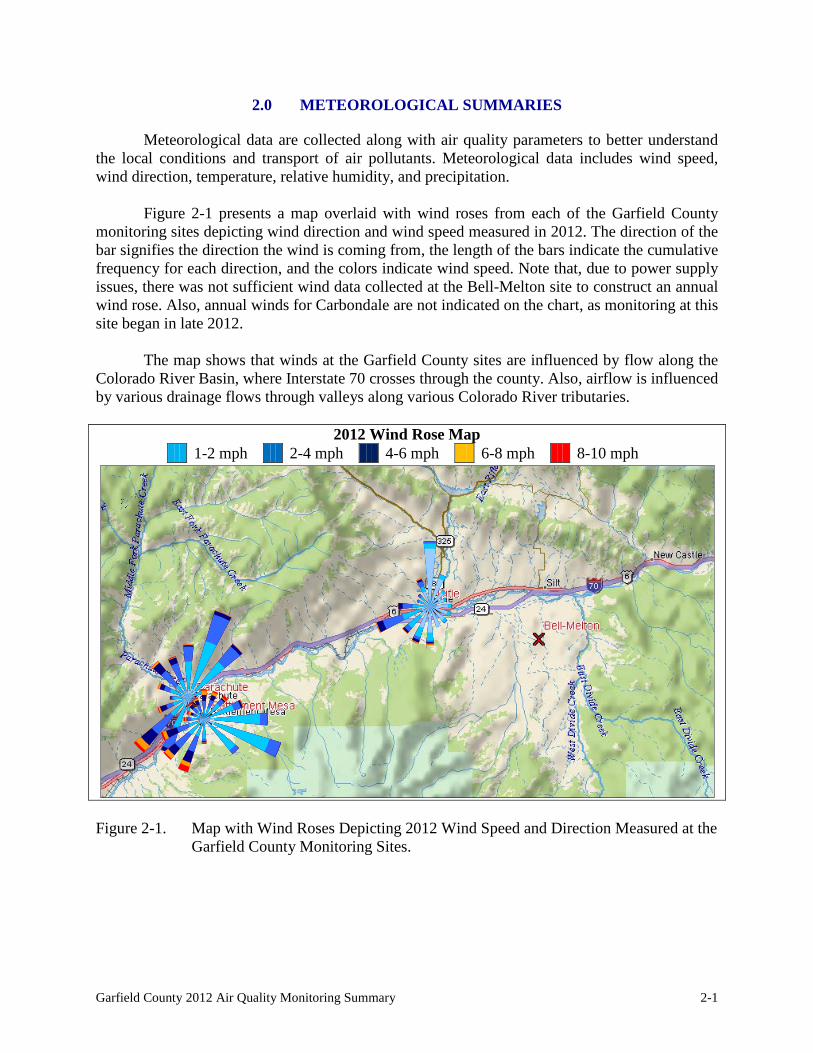
2.0 METEOROLOGICAL SUMMARIES Meteorological data are collected along with air quality parameters to better understand

the local conditions and transport of air pollutants. Meteorological data includes wind speed, wind direction, temperature, relative humidity, and precipitation.

Figure 2-1 presents a map overlaid with wind roses from each of the Garfield County

monitoring sites depicting wind direction and wind speed measured in 2012. The direction of the bar signifies the direction the wind is coming from, the length of the bars indicate the cumulative frequency for each direction, and the colors indicate wind speed. Note that, due to power supply issues, there was not sufficient wind data collected at the Bell-Melton site to construct an annual wind rose. Also, annual winds for Carbondale are not indicated on the chart, as monitoring at this site began in late 2012.

The map shows that winds at the Garfield County sites are influenced by flow along the Colorado River Basin, where Interstate 70 crosses through the county. Also, airflow is influenced by various drainage flows through valleys along various Colorado River tributaries.

2012 Wind Rose Map

1-2 mph 2-4 mph 4-6 mph 6-8 mph 8-10 mph

Figure 2-1. Map with Wind Roses Depicting 2012 Wind Speed and Direction Measured at the

Garfield County Monitoring Sites.

Garfield County 2012 Air Quality Monitoring Summary 2-1

3.0 CRITERIA POLLUTANT SUMMARIES The Clean Air Act requires the Environmental Protection Agency (EPA) to set two types

of National Ambient Air Quality Standards (NAAQS) for ground-level ozone (O3), particle pollution (PM2.5 and PM10), lead, nitrogen dioxide (NO2), carbon monoxide (CO), and sulfur dioxide (SO2). The types of standards are as follows:

• Primary Standards: These standards are designed to protect public health with an

adequate margin of safety, including the health of sensitive populations such as asthmatics, children, and the elderly.

• Secondary Standards: These standards are designed to protect public welfare from adverse effects, including visibility impairment and effects on the environment (e.g., vegetation, soils, water, and wildlife).

PM10 is monitored using filter-based Federal Reference Method (FRM) samplers at the

Parachute, Rifle and Carbondale sites. Continuous PM2.5 and PM10 are also monitored at the Rifle and Battlement Mesa sites and continuous PM2.5 at the Carbondale site. The level of the national primary and secondary ambient air quality standards for PM10 is a 24-hour average concentration of 150 micrograms per cubic meter (µg/m3). A violation of the standard occurs when the number of days with a 24-hour average concentration above 150 µg/m3 over a 3-year period is equal to or less than one. The standards for PM2.5 are an annual arithmetic mean of 15 µg/m3, and a 24-hour average of 35 µg/m3. A violation of the PM2.5 standard occurs when the 3-year average of the weighted annual mean exceeds that annual standard, or the 3-year average of the 98th percentile 24-hour average value exceeds the 24-hour standard.

Continuous O3 is monitored at the Rifle, Battlement Mesa, and Carbondale sites. The

NAAQS for O3 is currently 0.075 ppm (75 ppb) over an 8-hour period. An exceedance of the standard occurs when an 8-hour average O3 concentration is greater than or equal to 76 ppb. A violation of the standard occurs when the three-year average of the fourth highest daily maximum 8-hour average ozone concentration equals or exceeds 76 ppb.

Continuous NO2 is monitored at the Battlement Mesa site. The NAAQS for NO2 include

an annual arithmetic mean of 0.053 ppm (53 ppb) and a 1-hour daily maximum of 0.100 ppm (100 ppb). A violation of the 1-hour standard occurs when the 3-year average of the 98th percentile of the daily maximum 1-hour averages is greater than the standard.

Values measured as comparable to standards are presented with the corresponding

NAAQS in Tables 3-1 through 3-4. At present, air quality measurements in Garfield County do not violate air quality standards for these criteria pollutants.

Garfield County 2012 Air Quality Monitoring Summary 3-1

Table 3-1

2012 Standards Summary for the Rifle Site

Parameter NAAQS Measured

Averaging Time Standard Measured Value Date(s)

Ozone (O3)

Rolling 8-hour

0.075 ppm/ 75 ppb

Highest Daily Max.: 78 ppb 4/28

4th Highest Daily Max.: 68 ppb 4/14, 5/26

Particulate Matter ≤2.5µm* (PM2.5)

Annual 15 µg/m3 Arithmetic Mean: 10.4 µg/m3 1/1-12/31

24-hour 35 µg/m3 Highest Daily Max.: 47.4 µg/m3 8/16

2nd Highest Daily Max.: 41.7 µg/m3 8/17

Particulate Matter ≤10µm**

(PM10)

24-hour 150 µg/m3 Highest Daily Max.: 50 µg/m3 4/6

2nd Highest Daily Max.: 46 µg/m3 8/16

*Calculated using continuous TEOM measurements **Calculated using 1/3 day filter-based measurements

Table 3-2

2012 Standards Summary for the Parachute Site

Parameter NAAQS Measured

Averaging Time Standard Measured Value Date(s)

Particulate Matter ≤10µm* (PM10)

24-hour 150 µg/m3 Highest Daily Max.: 65 µg/m3 3/7

2nd Highest Daily Max.: 44 µg/m3 8/16

*Calculated using 1/3 day filter-based measurements

Garfield County 2012 Air Quality Monitoring Summary 3-2

Table 3-3

Battlement Mesa Site Standards Summary

October 24, 2012 – December 31, 2012

Parameter NAAQS Measured

Averaging Time Standard Measured Value Date(s)

Ozone (O3)

Rolling 8-hour

0.075 ppm/ 75 ppb

Highest Daily Max.: 45 ppb 11/3

4th Highest Daily Max.: 43 ppb 11/4, 11/8

Nitrogen Dioxide (NO2)

Annual 0.053 ppm/ 53 ppb Arithmetic Mean: 16.6 ppb 10/24- 12/31

1-hour 0.100 ppm/ 100 ppb

Highest Daily Max.: 31.8 ppb 12/30

2nd Highest Daily Max.: 30.2 ppb 12/23

Particulate Matter ≤2.5µm* (PM2.5)

Annual 15 µg/m3 Arithmetic Mean: 2.6 µg/m3 10/24-12/31

24-hour 35 µg/m3 Highest Daily Max.: 5.9 µg/m3 12/24

2nd Highest Daily Max.: 5.6 µg/m3 11/9

Particulate Matter ≤10µm* (PM10)

Annual 50 µg/m3 Arithmetic Mean: 4.8 µg/m3 10/24-12/31

24-hour 150 µg/m3 Highest Daily Max.: 17.7 µg/m3 11/9

2nd Highest Daily Max.: 10.1 µg/m3 12/30

*Calculated using continuous BAM measurements

Garfield County 2012 Air Quality Monitoring Summary 3-3

Table 3-4

Carbondale Site Standards Summary

March 29, 2012 – December 31, 2012

Parameter NAAQS Measured

Averaging Time Standard Measured Value Date(s)

Ozone (O3)

Rolling 8-hour

0.075 ppm/ 75 ppb

Highest Daily Max.: 69 ppb 5/26

4th Highest Daily Max.: 66 ppb 4/14

Particulate Matter ≤2.5µm* (PM2.5)

Annual 15 µg/m3 Arithmetic Mean: 5.9 µg/m3 3/29-12/31

24-hour 35 µg/m3 Highest Daily Max.: 24.2 µg/m3 8/16

2nd Highest Daily Max.: 21.3 µg/m3 5/26

Particulate Matter ≤10µm**

(PM10)

24-hour 150 µg/m3 Highest Daily Max.: 40 µg/m3 11/2

2nd Highest Daily Max.: 38 µg/m3 8/16

*Calculated using continuous E-BAM measurements **Calculated using 1/3 day filter-based measurements

Garfield County 2012 Air Quality Monitoring Summary 3-4
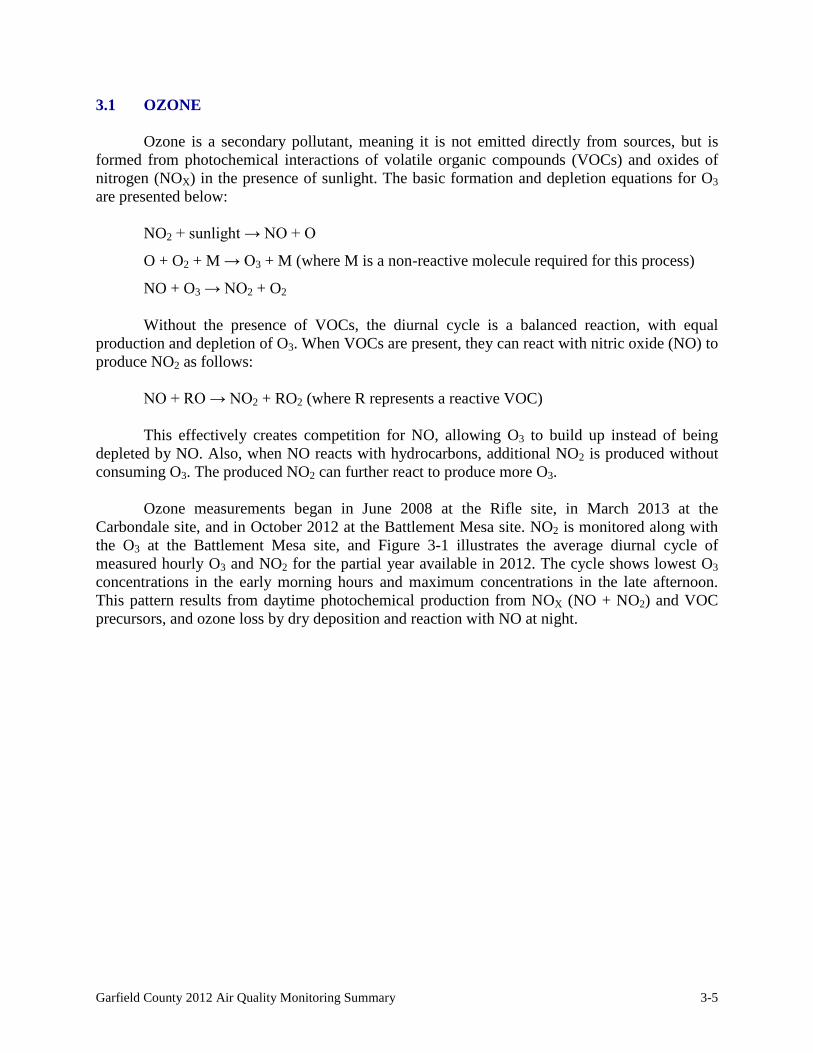
3.1 OZONE

Ozone is a secondary pollutant, meaning it is not emitted directly from sources, but is formed from photochemical interactions of volatile organic compounds (VOCs) and oxides of nitrogen (NOX) in the presence of sunlight. The basic formation and depletion equations for O3 are presented below:

NO2 + sunlight → NO + O

O + O2 + M → O3 + M (where M is a non-reactive molecule required for this process)

NO + O3 → NO2 + O2 Without the presence of VOCs, the diurnal cycle is a balanced reaction, with equal

production and depletion of O3. When VOCs are present, they can react with nitric oxide (NO) to produce NO2 as follows:

NO + RO → NO2 + RO2 (where R represents a reactive VOC) This effectively creates competition for NO, allowing O3 to build up instead of being

depleted by NO. Also, when NO reacts with hydrocarbons, additional NO2 is produced without consuming O3. The produced NO2 can further react to produce more O3.

Ozone measurements began in June 2008 at the Rifle site, in March 2013 at the Carbondale site, and in October 2012 at the Battlement Mesa site. NO2 is monitored along with the O3 at the Battlement Mesa site, and Figure 3-1 illustrates the average diurnal cycle of measured hourly O3 and NO2 for the partial year available in 2012. The cycle shows lowest O3 concentrations in the early morning hours and maximum concentrations in the late afternoon. This pattern results from daytime photochemical production from NOX (NO + NO2) and VOC precursors, and ozone loss by dry deposition and reaction with NO at night.

Garfield County 2012 Air Quality Monitoring Summary 3-5

Figure 3-1. 2012 Diurnal Average Concentrations of Ozone and Nitrogen Dioxide Measured

at the Battlement Mesa Site.

Figures 3-2 through 3-4 present daily maximum 8-hour averages of O3 monitored at the Rifle, Battlement Mesa, and Carbondale sites in 2012 respectively, along with the NAAQS. In Garfield County, O3 measurements at the Rifle site are highest in the summer, which is consistent with the expected photo activity associated with hot summer months. It was previously thought that, due to the nature of ozone formation, elevated levels of O3 were only possible during the summer. Recently, high O3 readings have been recorded during the wintertime in the Green River Basin in Wyoming, and the Uintah Basin in Utah. Wintertime O3 formation requires, along with VOC and NO2 emissions, distinct meteorological conditions. The meteorological conditions associated with wintertime O3 include strong temperature inversions, low winds, snow cover, and bright sunlight. O3 measurements in Garfield County do not currently appear to be affected by the same conditions that have contributed to wintertime O3 highs in Wyoming and Utah.

Garfield County 2012 Air Quality Monitoring Summary 3-6

Figure 3-2. Daily Maximum 8-Hour Averages of Ozone Monitored at the Rifle Site.

Figure 3-3. Daily Maximum 8-Hour Averages of Ozone Monitored at the Battlement Mesa

Site.

Garfield County 2012 Air Quality Monitoring Summary 3-7

Figure 3-4. Daily Maximum 8-Hour Averages of Ozone Monitored at the Carbondale Site. 3.2 NITROGEN DIOXIDE

Oxides of nitrogen (NOX) released from emission sources primarily consist of nitric

oxide (NO), with lesser amounts of nitrogen dioxide (NO2). NO is a colorless and odorless gas which, in the presence of O3, will react to form NO2. NO2 is a reddish-brown gas which is partially responsible for the "brown haze" observed near large cities. Only NO2 is considered a regulated pollutant, but it is generally measured alongside NO, where NO and NO2 are collectively reported as NOx (NOx = NO + NO2). The components of NOx have been identified as precursors for both O3 and particulate matter.

NO2 measurements began at the Battlement Mesa site in late 2012. Figure 3-5 presents

daily maximum 1-hour averages of NO2 along with the NAAQS, indicating that measured values were well below the standard. Hourly average values for the Battlement Mesa site are presented in time series plots along with other parameters in Appendix A.

Garfield County 2012 Air Quality Monitoring Summary 3-8

0

20

40

60

80

100

120

1/1

2/1

3/1

4/1

5/1

6/1

7/1

8/1

9/1

10/1

11/1

12/1

Hou

rly N

O2

(ppb

)

2012

NAAQS

Figure 3-5. Daily Maximum 1-Hour Averages of Nitrogen Dioxide Monitored at the

Battlement Mesa Site. 3.3 PARTICULATE MATTER

Particulate matter (PM) consists of solid particles and liquid droplets that are small enough to be inhaled. The size of particles is directly linked to their potential for causing health problems. Particulate matter with diameter larger than 2.5 microns (PM2.5) and smaller than 10 microns (PM10) pose the greatest concern, because they can get deep into the lungs and cause serious health problems. Particulate matter can be emitted directly into the air or can be formed in the atmosphere through complex chemical reactions from emissions of sulfur dioxides, nitrogen oxides, and other compounds. Coarse particulate matter can come from sources like road dust, construction, and wood-burning. Particulate sources associated with natural gas development may include grading and leveling of well pads, construction of facilities, construction of access roads to well pads, and subsequent vehicle traffic. Natural emissions like forest fires can also contribute to particulate matter.

Filter based 24-hour PM10 is measured every third day at the Parachute, Rifle, and

Carbondale sites. Continuous PM10 and PM2.5 monitoring began at the Rifle site in September 2008 and at the Battlement Mesa site in November 2012, and continuous PM2.5 monitoring began at the Carbondale site in March 2012. Annual summaries are provided here, and hourly and 24-hour average values for these sites are presented in time series plots along with other parameters in Appendix A.

3.3.1 Filter Based PM10 Measurements

Figure 3-6 presents the annual average PM10 measured at the Parachute site since 2000,

and Figure 3-7 presents annual average PM10 measured at the Rifle site since 2005. At both the Rifle and Parachute sites, the highest average recorded PM10 was recorded in 2008, but measurements at this site have dropped since 2009. Note that annual averages for the Carbondale site are not presented, as only a partial year was available in 2012.

Garfield County 2012 Air Quality Monitoring Summary 3-9

Figures 3-8 and 3-9 present the highest and second highest 24-hour average values measured at the Parachute and Rifle sites, respectively. The NAAQS for PM10 is a 24-hour average of 150 ppb, which was exceeded at the Parachute site in 2008. No exceedances have been recorded at the Rifle site. Note that an exceedance of the standard is not a violation unless the average number of annual exceedances over a 3-year period is greater than or equal to 1.

Figure 3-6. Annual Average PM10 Measured at the Parachute Site.

Figure 3-7. Annual Average PM10 Measured at the Rifle Site.

Garfield County 2012 Air Quality Monitoring Summary 3-10

Figure 3-8. Highest and Second Highest 24-Hour Average PM10 Measured at the Parachute

Site.

Figure 3-9. Highest and Second Highest 24-Hour Average PM10 Measured at the Rifle Site. 3.3.2 Continuous PM Measurements

Continuous PM10 and PM2.5 have been monitored at the Rifle site since mid-2008, at the Battlement Mesa site since November 2012 and continuous PM2.5 has been monitoring at the Carbondale site since March 2012. Continuous PM10 data are useful to monitor alongside filter-based PM in part to make continuous data available in real-time on the Garfield County Air Quality Management website (http://www.garfield-county.com/air-quality/).

Continuous data are also comparable to regulatory standards, as presented for PM2.5 here. Figure 3-10 presents the annual average of continuous PM2.5 measured at the Rifle site since 2009, and Figure 3-11 presents the highest and 98th percentile 24-hour average values measured

Garfield County 2012 Air Quality Monitoring Summary 3-11

at the Rifle site. The NAAQS for PM2.5 is an arithmetic mean of 15 µg/m3 and a 24-hour average of 35 µg/m3. A violation of the PM2.5 standard occurs when the 3-year average of the weighted annual mean exceeds that annual standard, or the 3-year average of the 98th percentile 24-hour average value exceeds the 24-hour standard. The highest 24-hour PM2.5 value in 2009 measured above the standard, but this is not considered an exceedance because the 98th percentile value was below the standard.

Figure 3-10. Annual Average PM2.5 Measured at the Rifle Site.

Figure 3-11. Highest and 98th Percentile 24-Hour Average PM2.5 Measured at the Rifle Site.

Garfield County 2012 Air Quality Monitoring Summary 3-12

4.0 VOLATILE ORGANIC COMPOUNDS In 2012, speciated non-methane hydrocarbons (SNMOCs) and carbonyl compounds were

monitored at all Garfield County sites. SNMOCs and carbonyl compounds are subsets of volatile organic compounds (VOCs), which are carbon- and hydrogen-based chemicals that exist in the gas phase or can evaporate from liquids. VOCs can react in the atmosphere to form ozone (O3) and particulate matter. Hazardous air pollutants (HAPs) are a subset of VOC compounds, and include compounds that are known or believed to cause human health effects. Summaries of SNMOCs, carbonyls, and HAP levels measured in 2012 are presented in this section. Plots of the sum of all SNMOCs measured, or total non-methane organic carbon (TNMOC), are presented alongside other particulate, gaseous and meteorological measurements at each site in Appendix A.

4.1 SPECIATED NON-METHANE HYDROCARBONS

SNMOC compounds were collected and analyzed according to EPA Compendium

Method TO-12, with 24-hour samples collected on a 1-in-6 day schedule. This method includes analyses for 78 different compounds. Annual averages are presented here, and Appendix B lists minimum, maximum, and average concentrations of all detected SNMOC compounds by site.

SNMOC compounds can be grouped into classifications with similar characteristics. For annual average summaries, measured SNMOC compounds were grouped into the following categories:

• Light Alkanes: Alkanes are the simplest hydrocarbons, consisting of only carbon and

hydrogen with single bonds. Light alkanes, which include alkanes with up to five carbon atoms (ethane, propane, iso/n-butane and iso/n-pentane), along with methane, are primary components of natural gas and gasoline vapors.

• Heavy Alkanes: The hydrocarbons in crude oil are mostly heavy alkanes, which here include alkanes with more than five carbon atoms (C5). Crude oil products include gasoline, a refined mix of predominantly C6 to C10 hydrocarbons, and diesel, which is a refined mix ranging from approximately C10 to C15.

• Alkenes: Alkenes are more complex than alkanes, with at least one carbon to carbon

double bond. These compounds are not generally found in crude oil. Alkenes are much more reactive than alkanes, and will deplete quickly in the atmosphere. Alkenes are produced in refineries when larger alkane molecules are dissociated (or cracked) into smaller compounds. Some alkene compounds, including terpenes such as isoprene and a- and b-pinene, are naturally emitted from vegetation.

• Aromatics: Aromatic compounds are the most abundant compounds emitted from gas-fired engines. These compounds include the BTEX parameters (benzene, toluene, ethylbenzene, and m/p-xylenes), which are commonly associated with motor vehicles, but can also have sources associated with oil and gas production.

Garfield County 2012 Air Quality Monitoring Summary 4-1

Figure 4-1 presents categories of measured SNMOCs in units of ppbV (parts per billion by volume) measured in 2012 at each site. In general, measured compounds consisted mostly of light alkanes, which represented between 83% and 89% of total SNMOCs measured. Seasonal variation showed higher concentrations in winter and lower concentrations in summer. These trends can be influenced by the variations in temperature, as VOCs deplete faster during the summer due to higher reactivity at higher temperatures. Also, some emissions, including cold-start engine emissions and residential wood burning, are higher in the winter.

Figure 4-2 presents measurements by category in units of ppbC, where ppbC represents

the number of carbon molecules measured (ppbV multiplied by the number of carbons in each compound). Heavier alkanes and aromatics are more significant sources of carbon than the lighter alkanes. The unknown category indicates the part of the total carbon measurements where individual species were not identified. Note that for the Carbondale site, the majority of carbon compounds detected were not among the species identified. The specific compounds targeted for analysis in Garfield County are intended to focus on natural gas influences and hazardous compounds, which appear to comprise relatively small proportions of the compounds measured in Carbondale.

Carbon content in a molecule is important because it is related to compound reactivity,

which contributes to O3 formation potential. O3 is formed from photochemical interactions of VOCs and NOX in the presence of sunlight, as described in Section 3.1. The light alkanes that dominate measurements by volume are the least reactive compounds but could theoretically contribute significantly to O3 formation potential. Highly reactive compounds including aromatics such as toluene and m/p-xylenes, which are less abundant, but have greater potential to contribute to the O3 formation due to their higher reactivity. Currently, Garfield County does not violate O3 standards, but if O3 levels become more of a concern in Garfield County, it would be useful to target further controls for emissions of VOCs that have the greatest potential to contribute to O3 formation.

Garfield County 2012 Air Quality Monitoring Summary 4-2

Figure 4-1. 2012 24-Hour SNMOC Measurements by Category in Units of ppbV.

Garfield County 2012 Air Quality Monitoring Summary 4-3

Figure 4-2. 2012 24-Hour SNMOC Measurements by Category in Units of ppbC.

Garfield County 2012 Air Quality Monitoring Summary 4-4

4.1.1 Annual Average SNMOCs Garfield County began collecting SNMOC data at the Parachute (PACO), Rifle (RICO),

and Bell-Melton (BMCO) sites in 2008, at the Battlement Mesa (BMCO) in September 2010, and at the Carbondale (RFCO) in 2012. Figure 4-3 presents comparisons of annual average SNMOC data collected between 2008 and 2012. For sites that monitored all five years (PACO, RICO and BRCO), SNMOC concentrations have been decreasing since 2008, with the largest relative decreases between 2011 and 2012. Decreases in total SNMOC concentrations are mainly attributable to decreases in light alkane concentrations (depicted in blue), which are the primary components of natural gas. Note that insufficient data were available for the RFCO site to calculate a representative annual average.

0

20

40

60

80

100

120

140

160

180

200

2008

2009

2010

2011

2012

2008

2009

2010

2011

2012

2008

2009

2010

2011

2012

2010

*20

1120

12

2012

*

PACO RICO BRCO BMCO RFCO

SNM

OC

(ppb

V)

Garfield County SNMOC Sites2008-2012 Annual Averages

Alkenes

Aromatics

Heavy Alkanes

Light Alkanes

*Full year not available (BMCO began sampling in September 2010, RFCO began in June 2012) Figure 4-3 Average SNMOC Concentrations Measured by the Garfield County Air

Monitoring Program between 2008 and 2012.

4.2 CARBONYLS

Carbonyl compounds were collected and analyzed according to EPA Compendium Method TO-11A, with 24-hour samples collected at all five sites on a 1-in-12 day schedule. This method includes analysis for 12 different carbonyl compounds.

Garfield County 2012 Air Quality Monitoring Summary 4-5

Carbonyls are highly reactive and play a critical role in the formation of O3. Some carbonyls, including formaldehyde and acetaldehyde, also have adverse chronic and acute health effects. The major sources of directly emitted carbonyls are fuel combustion, mobile sources, and process emissions from oil refineries.

Figure 4-4 presents time series plots of the major compounds, and Appendix C lists

minimum, maximum, and average concentrations of all detected carbonyl compounds. Major compounds measured included formaldehyde, acetaldehyde, and acetone. In general, carbonyl compounds were highest during summer months as warm temperatures affected the photochemical production that contributes to the formation of these compounds.

Garfield County 2012 Air Quality Monitoring Summary 4-6

Figure 4-4. 2012 24-Hour Major Carbonyl Compound Concentrations in Units of ppbV.

Garfield County 2012 Air Quality Monitoring Summary 4-7

4.2.1 Annual Average Carbonyl Concentrations

Garfield County began collecting SNMOC data at the Parachute, Rifle, and Bell-Melton sites in 2008, at the Battlement Mesa (BMCO) in September 2010, and at the Carbondale (RFCO) in June 2012. Figure 4-5 presents comparisons of annual average carbonyl data collected between 2008 and 2012. In 2012, average measured total carbonyl levels were the lowest since measurements began 2008.

0

1

2

3

4

5

2008

2009

2010

2011

2012

2008

2009

2010

2011

2012

2008

2009

2010

2011

2012

2010

*20

1120

12

2012

*

PACO RICO BRCO BMCO RFCO

Car

bony

ls (p

pbV)

Garfield County Carbonyl Sites2008-2012 Annual Averages

Other Carbonyls

Formaldehyde

Acetone

Acetaldehyde

*Full year not available (BMCO began sampling in September 2010, RFCO began in June 2012) Figure 4-5. Average Carbonyl Concentrations Measured by the Garfield County Air

Monitoring Program between 2008 and 2012.

Garfield County 2012 Air Quality Monitoring Summary 4-8

4.3 HAZARDOUS AIR POLLUTANTS SUMMARIES VOCs include a class of compounds called hazardous air pollutants (HAPs). The EPA

has designated approximately 190 VOC compounds as HAPs, including benzene, toluene, ethyl-benzene and xylenes (also known as the BTEX compounds). No NAAQS or any other ambient air standards exist for VOCs. Instead, emissions limits on industrial sources have been set, and the EPA has developed a set of risk factors for both acute and chronic exposures for HAPs. In addition, risk factors from the Agency for Toxic Substances and Disease Registry (ATSDR), the California Air Resources Board (CARB), the National Institute for Occupational Safety and Health (NIOSH), and others can be used to determine potential risks from exposure to VOCs.

Of the 78 SNMOC and 12 carbonyl compounds measured in Garfield County, 21 compounds have been identified as HAPs. The Garfield County Air Toxics Inhalation Screening Level Human Risk Assessment (CDPHE 2010) assessed data collected in 2008, and risk assessments based on 2009 through 2012 HAP levels will be prepared in separate risk assessment reports prepared by the CDPHE Disease Control and Environmental Epidemiology Division. Findings of the 2008 report indicated that, individually, the HAP components were below risk assessment criteria, but cumulative effects approached chronic (70 year exposure period) non-hazard levels. The largest contributors to the cumulative levels were benzene and formaldehyde. Summaries below look at annual averages for the HAPs measured in Garfield County and regionally, but do not address health effects of these compounds.

4.3.1 Annual Average HAP Concentrations

Tables 4-1 through 4-4 present annual averages and trends for of HAP concentrations

measured between 2008 and 2012. Annual trends were calculated for each HAP, with a trend defined as the slope derived using Theil statistics, which is a nonparametric regression technique that is commonly applied to environmental data to determine statistically significant trends. The significance of the trend is represented with p-values calculated using Mann-Kendall trend statistics. Determining a significance level helps to distinguish random variability in data from a real tendency to increase or decrease over time, where lower p-values indicate higher confidence levels in the computed slopes. Regional trends are presented here for aerosol species trends with p-value statistics less than 0.05 (95% confidence level). Statistically significant decreasing trends are indicated in blue, and statistically significant increasing trends are depicted in red. Note that annual averages are presented for 2011 and 2012 measurements at the Battlement Mesa site, but trends are not calculated as the EPA recommends using at least five years of data to determine reliable trend statistics.

Annual averages for these components are also depicted graphically in in Figures 4-6

through 4-9. For perspective on concentrations measured in Garfield County, the average, maximum, and minimum of annual average data reported for 45 urban sites across the United States in 2009, excluding the Garfield County sites, is also presented in the figures. The 2009 average was obtained from an annual report published by the EPA for sites across the country as part of the Urban Air Toxics Monitoring Program (UATMP) and National Air Toxics Trends Stations (NATTS) (EPA 2011). Specific observations are listed below.

Garfield County 2012 Air Quality Monitoring Summary 4-9

• A number of HAPs compounds, including benzene, have measured statistically significant decreasing annual average trends at all sites.

• A number of additional compounds, including formaldehyde, showed statistically significant decreasing trends at the Parachute and Bell-Melton sites, but insignificant trends at the more urban Rifle site.

• Of the 21 HAPS measured in Garfield County, the only statistically significant

increasing trend was measured for styrene at all sites, where annual average increases were small, between 0.01 to 0.04 µg/m3 per year. Styrene in the atmosphere is primarily associated with the production of polystyrene plastics and resins. Styrene measurements were much higher in 2012 than previous years, and may require further investigation to determine possible sources for these measurements.

It is important to note that annual average values summarized here do not necessarily

indicate a health risk. Actual magnitudes of these HAP compounds related to possible health risk are evaluated separately in the CDPHE risk assessment reports.

Garfield County 2012 Air Quality Monitoring Summary 4-10

Table 4-1

Parachute Site Annual Average Mass Trends (HAPs Parameters)

2008-2012

HAP Average Mass (µg/m3) Slope

(µg/m3 per year)

p-Value 2008 2009 2010 2011 2012

1,2,4-Trimethylbenzene 0.91 0.62 0.42 0.43 0.39 -0.11 0.04

1,3,5-Trimethylbenzene 0.61 0.51 0.40 0.22 0.18 -0.11 0.01

1,3-Butadiene 0.08 0.12 0.10 0.10 0.09 0.00 0.59

Acetaldehyde 1.11 0.99 0.92 0.90 0.75 -0.08 0.01

Acetone 3.42 3.28 2.67 2.79 2.34 -0.26 0.04

Benzene 2.31 2.69 1.74 1.44 1.31 -0.28 0.04

Crotonaldehyde 0.10 0.10 0.12 0.09 0.08 -0.01 0.24

Cyclohexane 3.92 3.77 2.90 2.22 1.99 -0.54 0.01

Ethylbenzene 0.59 0.44 1.04 0.32 0.17 -0.10 0.12

Formaldehyde 1.74 1.73 1.53 1.64 1.27 -0.11 0.04

Isopropylbenzene 0.09 0.08 0.07 0.08 0.06 -0.01 0.04

Methylcyclohexane 9.24 9.43 6.41 4.65 4.19 -1.47 0.04

m-Xylene/p-Xylene 3.91 3.63 2.20 1.11 1.15 -0.84 0.04

n-Hexane 5.78 5.64 3.93 3.34 3.01 -0.75 0.01

n-Nonane 2.20 2.01 1.13 0.97 0.61 -0.40 0.01

n-Propylbenzene 0.18 0.15 0.13 0.10 0.10 -0.02 0.01

o-Xylene 0.77 0.65 0.43 0.40 0.27 -0.13 0.01

Propionaldehyde 0.12 0.09 0.09 0.09 0.07 -0.01 0.04

Propylene 0.57 0.57 0.62 0.55 0.69 0.03 0.41

Styrene 0.12 0.08 0.12 0.13 1.56 0.04 0.04

Toluene 9.86 5.83 3.96 5.79 4.27 -1.38 0.12

Garfield County 2012 Air Quality Monitoring Summary 4-11

Table 4-2

Rifle Site Annual Average Mass Trends (HAPs Parameters)

2008-2012

HAP Average Mass (µg/m3) Slope

(µg/m3 per year)

p-Value 2008 2009 2010 2011 2012

1,2,4-Trimethylbenzene 0.62 0.71 0.52 0.42 0.54 -0.05 0.24

1,3,5-Trimethylbenzene 0.33 0.33 0.30 0.18 0.17 -0.04 0.04

1,3-Butadiene 0.13 0.12 0.17 0.19 0.16 0.02 0.24

Acetaldehyde 1.55 1.39 1.47 1.41 1.16 -0.07 0.12

Acetone 3.58 3.11 3.08 2.74 2.80 -0.19 0.04

Benzene 1.68 2.22 1.44 1.27 0.97 -0.21 0.04

Crotonaldehyde 0.15 0.17 0.18 0.14 0.13 -0.01 0.24

Cyclohexane 2.46 2.48 1.95 1.86 1.55 -0.24 0.04

Ethylbenzene 0.48 0.56 0.84 0.35 0.27 -0.07 0.24

Formaldehyde 1.89 1.67 1.80 1.82 1.52 -0.05 0.24

Isopropylbenzene 0.08 0.08 0.08 0.08 0.06 0.00 0.41

Methylcyclohexane 4.78 5.08 3.74 3.36 2.58 -0.57 0.04

m-Xylene/p-Xylene 2.35 2.58 1.70 0.90 1.08 -0.40 0.12

n-Hexane 4.50 4.61 3.48 4.40 2.88 -0.35 0.12

n-Nonane 0.81 0.86 0.59 0.44 0.32 -0.13 0.04

n-Propylbenzene 0.15 0.16 0.16 0.12 0.13 -0.01 0.24

o-Xylene 0.64 0.75 0.51 0.43 0.38 -0.07 0.04

Propionaldehyde 0.16 0.15 0.16 0.13 0.11 -0.01 0.04

Propylene 0.86 1.05 1.04 0.93 0.96 0.00 0.59

Styrene 0.08 0.08 0.08 0.10 0.75 0.01 0.04

Toluene 4.34 4.62 3.07 5.90 2.14 -0.51 0.41

Garfield County 2012 Air Quality Monitoring Summary 4-12

Table 4-3

Bell-Melton Site Annual Average Mass Trends (HAPs Parameters)

2008-2012

HAP Average Mass (µg/m3) Slope

(µg/m3 per year)

p-Value 2008 2009 2010 2011 2012

1,2,4-Trimethylbenzene 0.91 0.62 0.42 0.43 0.39 -0.11 0.04

1,3,5-Trimethylbenzene 0.61 0.51 0.40 0.22 0.18 -0.11 0.01

1,3-Butadiene 0.08 0.12 0.10 0.10 0.09 0.00 0.59

Acetaldehyde 1.11 0.99 0.92 0.90 0.75 -0.08 0.01

Acetone 3.42 3.28 2.67 2.79 2.34 -0.26 0.04

Benzene 2.31 2.69 1.74 1.44 1.31 -0.28 0.04

Crotonaldehyde 0.10 0.10 0.12 0.09 0.08 -0.01 0.24

Cyclohexane 3.92 3.77 2.90 2.22 1.99 -0.54 0.01

Ethylbenzene 0.59 0.44 1.04 0.32 0.17 -0.10 0.12

Formaldehyde 1.74 1.73 1.53 1.64 1.27 -0.11 0.04

Isopropylbenzene 0.09 0.08 0.07 0.08 0.06 -0.01 0.04

Methylcyclohexane 9.24 9.43 6.41 4.65 4.19 -1.47 0.04

m-Xylene/p-Xylene 3.91 3.63 2.20 1.11 1.15 -0.84 0.04

n-Hexane 5.78 5.64 3.93 3.34 3.01 -0.75 0.01

n-Nonane 2.20 2.01 1.13 0.97 0.61 -0.40 0.01

n-Propylbenzene 0.18 0.15 0.13 0.10 0.10 -0.02 0.01

o-Xylene 0.77 0.65 0.43 0.40 0.27 -0.13 0.01

Propionaldehyde 0.12 0.09 0.09 0.09 0.07 -0.01 0.04

Propylene 0.57 0.57 0.62 0.55 0.69 0.03 0.41

Styrene 0.12 0.08 0.12 0.13 1.56 0.04 0.04

Toluene 9.86 5.83 3.96 5.79 4.27 -1.38 0.12

Garfield County 2012 Air Quality Monitoring Summary 4-13

Table 4-4

Battlement Mesa Site Annual Average Mass Trends (HAPs Parameters)

2011-2012

HAP Average Mass (µg/m3) Slope*

(µg/m3 per year)

p-Value* 2008 2009 2010 2011 2012

1,2,4-Trimethylbenzene -- -- -- 0.44 0.37 N/A N/A

1,3,5-Trimethylbenzene -- -- -- 0.22 0.15 N/A N/A

1,3-Butadiene -- -- -- 0.06 0.09 N/A N/A

Acetaldehyde -- -- -- 0.76 0.57 N/A N/A

Acetone -- -- -- 3.83 3.28 N/A N/A

Benzene -- -- -- 1.56 1.10 N/A N/A

Crotonaldehyde -- -- -- 0.07 0.07 N/A N/A

Cyclohexane -- -- -- 2.09 1.64 N/A N/A

Ethylbenzene -- -- -- 0.37 0.19 N/A N/A

Formaldehyde -- -- -- 1.45 0.93 N/A N/A

Isopropylbenzene -- -- -- 0.08 0.05 N/A N/A

Methylcyclohexane -- -- -- 4.23 3.35 N/A N/A

m-Xylene/p-Xylene -- -- -- 1.12 1.03 N/A N/A

n-Hexane -- -- -- 3.34 2.68 N/A N/A

n-Nonane -- -- -- 0.68 0.42 N/A N/A

n-Propylbenzene -- -- -- 0.14 0.10 N/A N/A

o-Xylene -- -- -- 0.46 0.27 N/A N/A

Propionaldehyde -- -- -- 0.08 0.06 N/A N/A

Propylene -- -- -- 0.42 0.42 N/A N/A

Styrene -- -- -- 0.08 1.94 N/A N/A

Toluene -- -- -- 2.99 4.40 N/A N/A

*Note that annual averages are indicated, but trend statistics could not be calculated with only 2 years of complete data. (--) No data available.

Garfield County 2012 Air Quality Monitoring Summary 4-14

Figure 4-6. Annual Average HAP Concentrations Measured at the Parachute Site between

2008 and 2012, along with 2009 US Average, Minimum, and Maximum Annual Average Values as Reported by the EPA.

Garfield County 2012 Air Quality Monitoring Summary 4-15

Figure 4-7. Annual Average HAP Concentrations Measured at the Rifle Site between 2008

and 2012, along with 2009 US Average, Minimum, and Maximum Annual Average Values as Reported by the EPA.

Garfield County 2012 Air Quality Monitoring Summary 4-16

Figure 4-8. Annual Average HAP Concentrations Measured at the Bell-Melton Site between

2008 and 2012, along with 2009 US Average, Minimum, and Maximum Annual Average Values as Reported by the EPA.

Garfield County 2012 Air Quality Monitoring Summary 4-17

Figure 4-9. Annual Average HAP Concentrations Measured at the Battlement Mesa Site in

2011 and 2012, along with 2009 US Average, Minimum and Maximum Annual Average Values as Reported by the EPA.

Garfield County 2012 Air Quality Monitoring Summary 4-18

5.0 REFERENCES Colorado Department of Public Health and Environment (CDPHE). 2010. Garfield County Air

Toxics Inhalation: Screening Level Human Health Risk Assessment. Available online at http://www.garfield-county.com/public-health/documents/.

Environmental Protection Agency (EPA). 2011. 2008-2009 National Monitoring Programs

Annual Report (UATMP, NATTS, and CSATAM). Available online at http://www.epa.gov/ttnamti1/uatm.html.

Garfield County 2012 Air Quality Monitoring Summary 5-1

APPENDIX A

Garfield County

2012 Monthly Time Series Plots

Acronyms Used on Plots:

TNMOC = Total Non-Methane Organic Carbon PM10 = Particulate Matter ≤ 10 µm PM2.5 = Particulate Matter ≤ 2.5 µm

O3 = Ozone RH = Relative Humidity

AT = Atmospheric Temperature VWD = Vector Wind Direction

SWS = Scalar Wind Speed

Garfield County 2012 Air Quality Monitoring Summary A-1

0

5

10

15

20

25

30

SWS

(mph

)

0

60

120

180

240

300

360

VW

D (°

)

-20

0

20

40

60

80

100

AT

(°F)

0

20

40

60

80

100

RH

(%)

.0

.2

.4

.6

.8

1.0

RN

F (in

.)

0

20

40

60

80

100

PM10

0

300

600

900

1200

1500TN

MO

C (p

pbC

)

1/1

1/1

1/2

1/2

1/3

1/3

1/4

1/4

1/5

1/5

1/6

1/6

1/7

1/7

1/8

1/8

1/9

1/9

1/10

1/10

1/11

1/11

1/12

1/12

1/13

1/13

1/14

1/14

1/15

1/15

1/16

1/16

1/17

1/17

1/18

1/18

1/19

1/19

1/20

1/20

1/21

1/21

1/22

1/22

1/23

1/23

1/24

1/24

1/25

1/25

1/26

1/26

1/27

1/27

1/28

1/28

1/29

1/29

1/30

1/30

1/31

1/31

Date

Garfield County, COParachute Site

Garfield County 2012 Air Quality Monitoring Summary A-2

0

5

10

15

20

25

30

SW

S (

mph)

0

60

120

180

240

300

360

VW

D (

°)

-20

0

20

40

60

80

100

AT

(°F

)

0

20

40

60

80

100

RH

(%

)

.0

.2

.4

.6

.8

1.0

RN

F (

in.)

0

20

40

60

80

100

PM

10

0

300

600

900

1200

1500T

NM

OC

(ppbC

)

3/1

3/1

3/2

3/2

3/3

3/3

3/4

3/4

3/5

3/5

3/6

3/6

3/7

3/7

3/8

3/8

3/9

3/9

3/1

03/1

0

3/1

13/1

1

3/1

23/1

2

3/1

33/1

3

3/1

43/1

4

3/1

53/1

5

3/1

63/1

6

3/1

73/1

7

3/1

83/1

8

3/1

93/1

9

3/2

03/2

0

3/2

13/2

1

3/2

23/2

2

3/2

33/2

3

3/2

43/2

4

3/2

53/2

5

3/2

63/2

6

3/2

73/2

7

3/2

83/2

8

3/2

93/2

9

3/3

03/3

0

3/3

13/3

1

Date

Garfield County, CO

Parachute Site

March 2012

Garfield County 2012 Air Quality Monitoring Summary A-3

0

5

10

15

20

25

30

SW

S (

mph)

0

60

120

180

240

300

360

VW

D (

°)

-20

0

20

40

60

80

100

AT

(°F

)

0

20

40

60

80

100

RH

(%

)

.0

.2

.4

.6

.8

1.0

RN

F (

in.)

0

20

40

60

80

100

PM

10

0

300

600

900

1200

1500T

NM

OC

(ppbC

)

3/1

3/1

3/2

3/2

3/3

3/3

3/4

3/4

3/5

3/5

3/6

3/6

3/7

3/7

3/8

3/8

3/9

3/9

3/1

03/1

0

3/1

13/1

1

3/1

23/1

2

3/1

33/1

3

3/1

43/1

4

3/1

53/1

5

3/1

63/1

6

3/1

73/1

7

3/1

83/1

8

3/1

93/1

9

3/2

03/2

0

3/2

13/2

1

3/2

23/2

2

3/2

33/2

3

3/2

43/2

4

3/2

53/2

5

3/2

63/2

6

3/2

73/2

7

3/2

83/2

8

3/2

93/2

9

3/3

03/3

0

3/3

13/3

1

Date

Garfield County, CO

Parachute Site

March 2012

Garfield County 2012 Air Quality Monitoring Summary A-4

0

5

10

15

20

25

30

SW

S (

mph)

0

60

120

180

240

300

360

VW

D (

°)

-20

0

20

40

60

80

100

AT

(°F

)

0

20

40

60

80

100

RH

(%

)

.0

.2

.4

.6

.8

1.0

RN

F (

in.)

0

20

40

60

80

100

PM

10

0

300

600

900

1200

1500T

NM

OC

(ppbC

)

4/1

4/1

4/2

4/2

4/3

4/3

4/4

4/4

4/5

4/5

4/6

4/6

4/7

4/7

4/8

4/8

4/9

4/9

4/1

04/1

0

4/1

14/1

1

4/1

24/1

2

4/1

34/1

3

4/1

44/1

4

4/1

54/1

5

4/1

64/1

6

4/1

74/1

7

4/1

84/1

8

4/1

94/1

9

4/2

04/2

0

4/2

14/2

1

4/2

24/2

2

4/2

34/2

3

4/2

44/2

4

4/2

54/2

5

4/2

64/2

6

4/2

74/2

7

4/2

84/2

8

4/2

94/2

9

4/3

04/3

0

Date

Garfield County, CO

Parachute Site

April 2012

Garfield County 2012 Air Quality Monitoring Summary A-5

0

5

10

15

20

25

30

SW

S (

mph)

0

60

120

180

240

300

360

VW

D (

°)

-20

0

20

40

60

80

100

AT

(°F

)

0

20

40

60

80

100

RH

(%

)

.0

.2

.4

.6

.8

1.0

RN

F (

in.)

0

20

40

60

80

100

PM

10

0

300

600

900

1200

1500T

NM

OC

(ppbC

)

5/1

5/1

5/2

5/2

5/3

5/3

5/4

5/4

5/5

5/5

5/6

5/6

5/7

5/7

5/8

5/8

5/9

5/9

5/1

05/1

0

5/1

15/1

1

5/1

25/1

2

5/1

35/1

3

5/1

45/1

4

5/1

55/1

5

5/1

65/1

6

5/1

75/1

7

5/1

85/1

8

5/1

95/1

9

5/2

05/2

0

5/2

15/2

1

5/2

25/2

2

5/2

35/2

3

5/2

45/2

4

5/2

55/2

5

5/2

65/2

6

5/2

75/2

7

5/2

85/2

8

5/2

95/2

9

5/3

05/3

0

5/3

15/3

1

Date

Garfield County, CO

Parachute Site

May 2012

Garfield County 2012 Air Quality Monitoring Summary A-6

0

5

10

15

20

25

30

SW

S (

mph)

0

60

120

180

240

300

360

VW

D (

°)

-20

0

20

40

60

80

100

AT

(°F

)

0

20

40

60

80

100

RH

(%

)

.0

.2

.4

.6

.8

1.0

RN

F (

in.)

0

20

40

60

80

100

PM

10

0

300

600

900

1200

1500T

NM

OC

(ppbC

)

6/1

6/1

6/2

6/2

6/3

6/3

6/4

6/4

6/5

6/5

6/6

6/6

6/7

6/7

6/8

6/8

6/9

6/9

6/1

06/1

0

6/1

16/1

1

6/1

26/1

2

6/1

36/1

3

6/1

46/1

4

6/1

56/1

5

6/1

66/1

6

6/1

76/1

7

6/1

86/1

8

6/1

96/1

9

6/2

06/2

0

6/2

16/2

1

6/2

26/2

2

6/2

36/2

3

6/2

46/2

4

6/2

56/2

5

6/2

66/2

6

6/2

76/2

7

6/2

86/2

8

6/2

96/2

9

6/3

06/3

0

Date

Garfield County, CO

Parachute Site

June 2012

Garfield County 2012 Air Quality Monitoring Summary A-7

0

5

10

15

20

25

30

SW

S (

mph)

0

60

120

180

240

300

360

VW

D (

°)

-20

0

20

40

60

80

100

AT

(°F

)

0

20

40

60

80

100

RH

(%

)

.0

.2

.4

.6

.8

1.0

RN

F (

in.)

0

20

40

60

80

100

PM

10

0

300

600

900

1200

1500T

NM

OC

(ppbC

)

7/1

7/1

7/2

7/2

7/3

7/3

7/4

7/4

7/5

7/5

7/6

7/6

7/7

7/7

7/8

7/8

7/9

7/9

7/1

07/1

0

7/1

17/1

1

7/1

27/1

2

7/1

37/1

3

7/1

47/1

4

7/1

57/1

5

7/1

67/1

6

7/1

77/1

7

7/1

87/1

8

7/1

97/1

9

7/2

07/2

0

7/2

17/2

1

7/2

27/2

2

7/2

37/2

3

7/2

47/2

4

7/2

57/2

5

7/2

67/2

6

7/2

77/2

7

7/2

87/2

8

7/2

97/2

9

7/3

07/3

0

7/3

17/3

1

Date

Garfield County, CO

Parachute Site

July 2012

Garfield County 2012 Air Quality Monitoring Summary A-8

0

5

10

15

20

25

30

SW

S (

mph)

0

60

120

180

240

300

360

VW

D (

°)

-20

0

20

40

60

80

100

AT

(°F

)

0

20

40

60

80

100

RH

(%

)

.0

.2

.4

.6

.8

1.0

RN

F (

in.)

0

20

40

60

80

100

PM

10

0

300

600

900

1200

1500T

NM

OC

(ppbC

)

8/1

8/1

8/2

8/2

8/3

8/3

8/4

8/4

8/5

8/5

8/6

8/6

8/7

8/7

8/8

8/8

8/9

8/9

8/1

08/1

0

8/1

18/1

1

8/1

28/1

2

8/1

38/1

3

8/1

48/1

4

8/1

58/1

5

8/1

68/1

6

8/1

78/1

7

8/1

88/1

8

8/1

98/1

9

8/2

08/2

0

8/2

18/2

1

8/2

28/2

2

8/2

38/2

3

8/2

48/2

4

8/2

58/2

5

8/2

68/2

6

8/2

78/2

7

8/2

88/2

8

8/2

98/2

9

8/3

08/3

0

8/3

18/3

1

Date

Garfield County, CO

Parachute Site

August 2012

Garfield County 2012 Air Quality Monitoring Summary A-9

0

5

10

15

20

25

30

SW

S (

mph)

0

60

120

180

240

300

360

VW

D (

°)

-20

0

20

40

60

80

100

AT

(°F

)

0

20

40

60

80

100

RH

(%

)

.0

.2

.4

.6

.8

1.0

RN

F (

in.)

0

20

40

60

80

100

PM

10

0

300

600

900

1200

1500T

NM

OC

(ppbC

)

9/1

9/1

9/2

9/2

9/3

9/3

9/4

9/4

9/5

9/5

9/6

9/6

9/7

9/7

9/8

9/8

9/9

9/9

9/1

09/1

0

9/1

19/1

1

9/1

29/1

2

9/1

39/1

3

9/1

49/1

4

9/1

59/1

5

9/1

69/1

6

9/1

79/1

7

9/1

89/1

8

9/1

99/1

9

9/2

09/2

0

9/2

19/2

1

9/2

29/2

2

9/2

39/2

3

9/2

49/2

4

9/2

59/2

5

9/2

69/2

6

9/2

79/2

7

9/2

89/2

8

9/2

99/2

9

9/3

09/3

0

Date

Garfield County, CO

Parachute Site

September 2012

Garfield County 2012 Air Quality Monitoring Summary A-10

0

5

10

15

20

25

30

SW

S (

mph)

0

60

120

180

240

300

360

VW

D (

°)

-20

0

20

40

60

80

100

AT

(°F

)

0

20

40

60

80

100

RH

(%

)

.0

.2

.4

.6

.8

1.0

RN

F (

in.)

0

20

40

60

80

100

PM

10

0

300

600

900

1200

1500T

NM

OC

(ppbC

)

10/1

10/1

10/2

10/2

10/3

10/3

10/4

10/4

10/5

10/5

10/6

10/6

10/7

10/7

10/8

10/8

10/9

10/9

10/1

010/1

0

10/1

110/1

1

10/1

210/1

2

10/1

310/1

3

10/1

410/1

4

10/1

510/1

5

10/1

610/1

6

10/1

710/1

7

10/1

810/1

8

10/1

910/1

9

10/2

010/2

0

10/2

110/2

1

10/2

210/2

2

10/2

310/2

3

10/2

410/2

4

10/2

510/2

5

10/2

610/2

6

10/2

710/2

7

10/2

810/2

8

10/2

910/2

9

10/3

010/3

0

10/3

110/3

1

Date

Garfield County, CO

Parachute Site

October 2012

Garfield County 2012 Air Quality Monitoring Summary A-11

0

5

10

15

20

25

30

SW

S (

mph)

0

60

120

180

240

300

360

VW

D (

°)

-20

0

20

40

60

80

100

AT

(°F

)

0

20

40

60

80

100

RH

(%

)

.0

.2

.4

.6

.8

1.0

RN

F (

in.)

0

20

40

60

80

100

PM

10

0

300

600

900

1200

1500T

NM

OC

(ppbC

)

11/1

11/1

11/2

11/2

11/3

11/3

11/4

11/4

11/5

11/5

11/6

11/6

11/7

11/7

11/8

11/8

11/9

11/9

11/1

011/1

0

11/1

111/1

1

11/1

211/1

2

11/1

311/1

3

11/1

411/1

4

11/1

511/1

5

11/1

611/1

6

11/1

711/1

7

11/1

811/1

8

11/1

911/1

9

11/2

011/2

0

11/2

111/2

1

11/2

211/2

2

11/2

311/2

3

11/2

411/2

4

11/2

511/2

5

11/2

611/2

6

11/2

711/2

7

11/2

811/2

8

11/2

911/2

9

11/3

011/3

0

Date

Garfield County, CO

Parachute Site

November 2012

Garfield County 2012 Air Quality Monitoring Summary A-12

0

5

10

15

20

25

30

SW

S (

mph)

0

60

120

180

240

300

360

VW

D (

°)

-20

0

20

40

60

80

100

AT

(°F

)

0

20

40

60

80

100

RH

(%

)

.0

.2

.4

.6

.8

1.0

RN

F (

in.)

0

20

40

60

80

100

PM

10

0

300

600

900

1200

1500T

NM

OC

(ppbC

)

12/1

12/1

12/2

12/2

12/3

12/3

12/4

12/4

12/5

12/5

12/6

12/6

12/7

12/7

12/8

12/8

12/9

12/9

12/1

012/1

0

12/1

112/1

1

12/1

212/1

2

12/1

312/1

3

12/1

412/1

4

12/1

512/1

5

12/1

612/1

6

12/1

712/1

7

12/1

812/1

8

12/1

912/1

9

12/2

012/2

0

12/2

112/2

1

12/2

212/2

2

12/2

312/2

3

12/2

412/2

4

12/2

512/2

5

12/2

612/2

6

12/2

712/2

7

12/2

812/2

8

12/2

912/2

9

12/3

012/3

0

12/3

112/3

1

Date

Garfield County, CO

Parachute Site

December 2012

Garfield County 2012 Air Quality Monitoring Summary A-13

0

5

10

15

20

25

30

SW

S (

mph)

0

60

120

180

240

300

360

VW

D (

°)

-20

0

20

40

60

80

100

AT

(°F

)

0

20

40

60

80

100

RH

(%

)

.0

.2

.4

.6

.8

1.0

RN

F (

in.)

0

20

40

60

80

100

O3 (

ppb)

0

20

40

60

80

100

1-h

r P

M2.5

(ug/m

3)

0

20

40

60

80

100

24-h

r P

M2.5

(ug/m

3)

0

20

40

60

80

100

1-h

r P

M10 (

ug/m

3)

0

20

40

60

80

100

24-h

r P

M10 (

ug/m

3)

0

20

40

60

80

100

PM

10

0

300

600

900

1200

1500

TN

MO

C (

ppbC

)

1/1

1/1

1/2

1/2

1/3

1/3

1/4

1/4

1/5

1/5

1/6

1/6

1/7

1/7

1/8

1/8

1/9

1/9

1/1

01/1

0

1/1

11/1

1

1/1

21/1

2

1/1

31/1

3

1/1

41/1

4

1/1

51/1

5

1/1

61/1

6

1/1

71/1

7

1/1

81/1

8

1/1

91/1

9

1/2

01/2

0

1/2

11/2

1

1/2

21/2

2

1/2

31/2

3

1/2

41/2

4

1/2

51/2

5

1/2

61/2

6

1/2

71/2

7

1/2

81/2

8

1/2

91/2

9

1/3

01/3

0

1/3

11/3

1

Date

Garfield County, CO

Rifle Site

January 2012

Garfield County 2012 Air Quality Monitoring Summary A-14

0

5

10

15

20

25

30

SW

S (

mph)

0

60

120

180

240

300

360

VW

D (

°)

-20

0

20

40

60

80

100

AT

(°F

)

0

20

40

60

80

100

RH

(%

)

.0

.2

.4

.6

.8

1.0

RN

F (

in.)

0

20

40

60

80

100

O3 (

ppb)

0

20

40

60

80

100

1-h

r P

M2.5

(ug/m

3)

0

20

40

60

80

100

24-h

r P

M2.5

(ug/m

3)

0

20

40

60

80

100

1-h

r P

M10 (

ug/m

3)

0

20

40

60

80

100

24-h

r P

M10 (

ug/m

3)

0

20

40

60

80

100

PM

10

0

300

600

900

1200

1500

TN

MO

C (

ppbC

)

2/1

2/1

2/2

2/2

2/3

2/3

2/4

2/4

2/5

2/5

2/6

2/6

2/7

2/7

2/8

2/8

2/9

2/9

2/1

02/1

0

2/1

12/1

1

2/1

22/1

2

2/1

32/1

3

2/1

42/1

4

2/1

52/1

5

2/1

62/1

6

2/1

72/1

7

2/1

82/1

8

2/1

92/1

9

2/2

02/2

0

2/2

12/2

1

2/2

22/2

2

2/2

32/2

3

2/2

42/2

4

2/2

52/2

5

2/2

62/2

6

2/2

72/2

7

2/2

82/2

8

2/2

92/2

9

Date

Garfield County, CO

Rifle Site

February 2012

Garfield County 2012 Air Quality Monitoring Summary A-15

0

5

10

15

20

25

30

SW

S (

mph)

0

60

120

180

240

300

360

VW

D (

°)

-20

0

20

40

60

80

100

AT

(°F

)

0

20

40

60

80

100

RH

(%

)

.0

.2

.4

.6

.8

1.0

RN

F (

in.)

0

20

40

60

80

100

O3 (

ppb)

0

20

40

60

80

100

1-h

r P

M2.5

(ug/m

3)

0

20

40

60

80

100

24-h

r P

M2.5

(ug/m

3)

0

20

40

60

80

100

1-h

r P

M10 (

ug/m

3)

0

20

40

60

80

100

24-h

r P

M10 (

ug/m

3)

0

20

40

60

80

100

PM

10

0

300

600

900

1200

1500

TN

MO

C (

ppbC

)

3/1

3/1

3/2

3/2

3/3

3/3

3/4

3/4

3/5

3/5

3/6

3/6

3/7

3/7

3/8

3/8

3/9

3/9

3/1

03/1

0

3/1

13/1

1

3/1

23/1

2

3/1

33/1

3

3/1

43/1

4

3/1

53/1

5

3/1

63/1

6

3/1

73/1

7

3/1

83/1

8

3/1

93/1

9

3/2

03/2

0

3/2

13/2

1

3/2

23/2

2

3/2

33/2

3

3/2

43/2

4

3/2

53/2

5

3/2

63/2

6

3/2

73/2

7

3/2

83/2

8

3/2

93/2

9

3/3

03/3

0

3/3

13/3

1

Date

Garfield County, CO

Rifle Site

March 2012

Garfield County 2012 Air Quality Monitoring Summary A-16

0

5

10

15

20

25

30

SW

S (

mph)

0

60

120

180

240

300

360

VW

D (

°)

-20

0

20

40

60

80

100

AT

(°F

)

0

20

40

60

80

100

RH

(%

)

.0

.2

.4

.6

.8

1.0

RN

F (

in.)

0

20

40

60

80

100

O3 (

ppb)

0

20

40

60

80

100

1-h

r P

M2.5

(ug/m

3)

0

20

40

60

80

100

24-h

r P

M2.5

(ug/m

3)

0

20

40

60

80

100

1-h

r P

M10 (

ug/m

3)

0

20

40

60

80

100

24-h

r P

M10 (

ug/m

3)

0

20

40

60

80

100

PM

10

0

300

600

900

1200

1500

TN

MO

C (

ppbC

)

4/1

4/1

4/2

4/2

4/3

4/3

4/4

4/4

4/5

4/5

4/6

4/6

4/7

4/7

4/8

4/8

4/9

4/9

4/1

04/1

0

4/1

14/1

1

4/1

24/1

2

4/1

34/1

3

4/1

44/1

4

4/1

54/1

5

4/1

64/1

6

4/1

74/1

7

4/1

84/1

8

4/1

94/1

9

4/2

04/2

0

4/2

14/2

1

4/2

24/2

2

4/2

34/2

3

4/2

44/2

4

4/2

54/2

5

4/2

64/2

6

4/2

74/2

7

4/2

84/2

8

4/2

94/2

9

4/3

04/3

0

Date

Garfield County, CO

Rifle Site

April 2012

Garfield County 2012 Air Quality Monitoring Summary A-17

0

5

10

15

20

25

30

SW

S (

mph)

0

60

120

180

240

300

360

VW

D (

°)

-20

0

20

40

60

80

100

AT

(°F

)

0

20

40

60

80

100

RH

(%

)

.0

.2

.4

.6

.8

1.0

RN

F (

in.)

0

20

40

60

80

100

O3 (

ppb)

0

20

40

60

80

100

1-h

r P

M2.5

(ug/m

3)

0

20

40

60

80

100

24-h

r P

M2.5

(ug/m

3)

0

20

40

60

80

100

1-h

r P

M10 (

ug/m

3)

0

20

40

60

80

100

24-h

r P

M10 (

ug/m

3)

0

20

40

60

80

100

PM

10

0

300

600

900

1200

1500

TN

MO

C (

ppbC

)

5/1

5/1

5/2

5/2

5/3

5/3

5/4

5/4

5/5

5/5

5/6

5/6

5/7

5/7

5/8

5/8

5/9

5/9

5/1

05/1

0

5/1

15/1

1

5/1

25/1

2

5/1

35/1

3

5/1

45/1

4

5/1

55/1

5

5/1

65/1

6

5/1

75/1

7

5/1

85/1

8

5/1

95/1

9

5/2

05/2

0

5/2

15/2

1

5/2

25/2

2

5/2

35/2

3

5/2

45/2

4

5/2

55/2

5

5/2

65/2

6

5/2

75/2

7

5/2

85/2

8

5/2

95/2

9

5/3

05/3

0

5/3

15/3

1

Date

Garfield County, CO

Rifle Site

May 2012

Garfield County 2012 Air Quality Monitoring Summary A-18

0

5

10

15

20

25

30

SW

S (

mph)

0

60

120

180

240

300

360

VW

D (

°)

-20

0

20

40

60

80

100

AT

(°F

)

0

20

40

60

80

100

RH

(%

)

.0

.2

.4

.6

.8

1.0

RN

F (

in.)

0

20

40

60

80

100

O3 (

ppb)

0

20

40

60

80

100

1-h

r P

M2.5

(ug/m

3)

0

20

40

60

80

100

24-h

r P

M2.5

(ug/m

3)

0

20

40

60

80

100

1-h

r P

M10 (

ug/m

3)

0

20

40

60

80

100

24-h

r P

M10 (

ug/m

3)

0

20

40

60

80

100

PM

10

0

300

600

900

1200

1500

TN

MO

C (

ppbC

)

6/1

6/1

6/2

6/2

6/3

6/3

6/4

6/4

6/5

6/5

6/6

6/6

6/7

6/7

6/8

6/8

6/9

6/9

6/1

06/1

0

6/1

16/1

1

6/1

26/1

2

6/1

36/1

3

6/1

46/1

4

6/1

56/1

5

6/1

66/1

6

6/1

76/1

7

6/1

86/1

8

6/1

96/1

9

6/2

06/2

0

6/2

16/2

1

6/2

26/2

2

6/2

36/2

3

6/2

46/2

4

6/2

56/2

5

6/2

66/2

6

6/2

76/2

7

6/2

86/2

8

6/2

96/2

9

6/3

06/3

0

Date

Garfield County, CO

Rifle Site

June 2012

Garfield County 2012 Air Quality Monitoring Summary A-19

0

5

10

15

20

25

30

SW

S (

mph)

0

60

120

180

240

300

360

VW

D (

°)

-20

0

20

40

60

80

100

AT

(°F

)

0

20

40

60

80

100

RH

(%

)

.0

.2

.4

.6

.8

1.0

RN

F (

in.)

0

20

40

60

80

100

O3 (

ppb)

0

20

40

60

80

100

1-h

r P

M2.5

(ug/m

3)

0

20

40

60

80

100

24-h

r P

M2.5

(ug/m

3)

0

20

40

60

80

100

1-h

r P

M10 (

ug/m

3)

0

20

40

60

80

100

24-h

r P

M10 (

ug/m

3)

0

20

40

60

80

100

PM

10

0

300

600

900

1200

1500

TN

MO

C (

ppbC

)

7/1

7/1

7/2

7/2

7/3

7/3

7/4

7/4

7/5

7/5

7/6

7/6

7/7

7/7

7/8

7/8

7/9

7/9

7/1

07/1

0

7/1

17/1

1

7/1

27/1

2

7/1

37/1

3

7/1

47/1

4

7/1

57/1

5

7/1

67/1

6

7/1

77/1

7

7/1

87/1

8

7/1

97/1

9

7/2

07/2

0

7/2

17/2

1

7/2

27/2

2

7/2

37/2

3

7/2

47/2

4

7/2

57/2

5

7/2

67/2

6

7/2

77/2

7

7/2

87/2

8

7/2

97/2

9

7/3

07/3

0

7/3

17/3

1

Date

Garfield County, CO

Rifle Site

July 2012

Garfield County 2012 Air Quality Monitoring Summary A-20

0

5

10

15

20

25

30

SW

S (

mph)

0

60

120

180

240

300

360

VW

D (

°)

-20

0

20

40

60

80

100

AT

(°F

)

0

20

40

60

80

100

RH

(%

)

.0

.2

.4

.6

.8

1.0

RN

F (

in.)

0

20

40

60

80

100

O3 (

ppb)

0

20

40

60

80

100

1-h

r P

M2.5

(ug/m

3)

0

20

40

60

80

100

24-h

r P

M2.5

(ug/m

3)

0

20

40

60

80

100

1-h

r P

M10 (

ug/m

3)

0

20

40

60

80

100

24-h

r P

M10 (

ug/m

3)

0

20

40

60

80

100

PM

10

0

300

600

900

1200

1500

TN

MO

C (

ppbC

)

8/1

8/1

8/2

8/2

8/3

8/3

8/4

8/4

8/5

8/5

8/6

8/6

8/7

8/7

8/8

8/8

8/9

8/9

8/1

08/1

0

8/1

18/1

1

8/1

28/1

2

8/1

38/1

3

8/1

48/1

4

8/1

58/1

5

8/1

68/1

6

8/1

78/1

7

8/1

88/1

8

8/1

98/1

9

8/2

08/2

0

8/2

18/2

1

8/2

28/2

2

8/2

38/2

3

8/2

48/2

4

8/2

58/2

5

8/2

68/2

6

8/2

78/2

7

8/2

88/2

8

8/2

98/2

9

8/3

08/3

0

8/3

18/3

1

Date

Garfield County, CO

Rifle Site

August 2012

Garfield County 2012 Air Quality Monitoring Summary A-21

0

5

10

15

20

25

30

SW

S (

mph)

0

60

120

180

240

300

360

VW

D (

°)

-20

0

20

40

60

80

100

AT

(°F

)

0

20

40

60

80

100

RH

(%

)

.0

.2

.4

.6

.8

1.0

RN

F (

in.)

0

20

40

60

80

100

O3 (

ppb)

0

20

40

60

80

100

1-h

r P

M2.5

(ug/m

3)

0

20

40

60

80

100

24-h

r P

M2.5

(ug/m

3)

0

20

40

60

80

100

1-h

r P

M10 (

ug/m

3)

0

20

40

60

80

100

24-h

r P

M10 (

ug/m

3)

0

20

40

60

80

100

PM

10

0

300

600

900

1200

1500

TN

MO

C (

ppbC

)

9/1

9/1

9/2

9/2

9/3

9/3

9/4

9/4

9/5

9/5

9/6

9/6

9/7

9/7

9/8

9/8

9/9

9/9

9/1

09/1

0

9/1

19/1

1

9/1

29/1

2

9/1

39/1

3

9/1

49/1

4

9/1

59/1

5

9/1

69/1

6

9/1

79/1

7

9/1

89/1

8

9/1

99/1

9

9/2

09/2

0

9/2

19/2

1

9/2

29/2

2

9/2

39/2

3

9/2

49/2

4

9/2

59/2

5

9/2

69/2

6

9/2

79/2

7

9/2

89/2

8

9/2

99/2

9

9/3

09/3

0

Date

Garfield County, CO

Rifle Site

September 2012

Garfield County 2012 Air Quality Monitoring Summary A-22

0

5

10

15

20

25

30

SW

S (

mph)

0

60

120

180

240

300

360

VW

D (

°)

-20

0

20

40

60

80

100

AT

(°F

)

0

20

40

60

80

100

RH

(%

)

.0

.2

.4

.6

.8

1.0

RN

F (

in.)

0

20

40

60

80

100

O3 (

ppb)

0

20

40

60

80

100

1-h

r P

M2.5

(ug/m

3)

0

20

40

60

80

100

24-h

r P

M2.5

(ug/m

3)

0

20

40

60

80

100

1-h

r P

M10 (

ug/m

3)

0

20

40

60

80

100

24-h

r P

M10 (

ug/m

3)

0

20

40

60

80

100

PM

10

0

300

600

900

1200

1500

TN

MO

C (

ppbC

)

10/1

10/1

10/2

10/2

10/3

10/3

10/4

10/4

10/5

10/5

10/6

10/6

10/7

10/7

10/8

10/8

10/9

10/9

10/1

010/1

0

10/1

110/1

1

10/1

210/1

2

10/1

310/1

3

10/1

410/1

4

10/1

510/1

5

10/1

610/1

6

10/1

710/1

7

10/1

810/1

8

10/1

910/1

9

10/2

010/2

0

10/2

110/2

1

10/2

210/2

2

10/2

310/2

3

10/2

410/2

4

10/2

510/2

5

10/2

610/2

6

10/2

710/2

7

10/2

810/2

8

10/2

910/2

9

10/3

010/3

0

10/3

110/3

1

Date

Garfield County, CO

Rifle Site

October 2012

Garfield County 2012 Air Quality Monitoring Summary A-23

0

5

10

15

20

25

30

SW

S (

mph)

0

60

120

180

240

300

360

VW

D (

°)

-20

0

20

40

60

80

100

AT

(°F

)

0

20

40

60

80

100

RH

(%

)

.0

.2

.4

.6

.8

1.0

RN

F (

in.)

0

20

40

60

80

100

O3 (

ppb)

0

20

40

60

80

100

1-h

r P

M2.5

(ug/m

3)

0

20

40

60

80

100

24-h

r P

M2.5

(ug/m

3)

0

20

40

60

80

100

1-h

r P

M10 (

ug/m

3)

0

20

40

60

80

100

24-h

r P

M10 (

ug/m

3)

0

20

40

60

80

100

PM

10

0

300

600

900

1200

1500

TN

MO

C (

ppbC

)

11/1

11/1

11/2

11/2

11/3

11/3

11/4

11/4

11/5

11/5

11/6

11/6

11/7

11/7

11/8

11/8

11/9

11/9

11/1

011/1

0

11/1

111/1

1

11/1

211/1

2

11/1

311/1

3

11/1

411/1

4

11/1

511/1

5

11/1

611/1

6

11/1

711/1

7

11/1

811/1

8

11/1

911/1

9

11/2

011/2

0

11/2

111/2

1

11/2

211/2

2

11/2

311/2

3

11/2

411/2

4

11/2

511/2

5

11/2

611/2

6

11/2

711/2

7

11/2

811/2

8

11/2

911/2

9

11/3

011/3

0

Date

Garfield County, CO

Rifle Site

November 2012

Garfield County 2012 Air Quality Monitoring Summary A-24

0

5

10

15

20

25

30

SW

S (

mph)

0

60

120

180

240

300

360

VW

D (

°)

-20

0

20

40

60

80

100

AT

(°F

)

0

20

40

60

80

100

RH

(%

)

.0

.2

.4

.6

.8

1.0

RN

F (

in.)

0

20

40

60

80

100

O3 (

ppb)

0

20

40

60

80

100

1-h

r P

M2.5

(ug/m

3)

0

20

40

60

80

100

24-h

r P

M2.5

(ug/m

3)

0

20

40

60

80

100

1-h

r P

M10 (

ug/m

3)

0

20

40

60

80

100

24-h

r P

M10 (

ug/m

3)

0

20

40

60

80

100

PM

10

0

300

600

900

1200

1500

TN

MO

C (

ppbC

)

12/1

12/1

12/2

12/2

12/3

12/3

12/4

12/4

12/5

12/5

12/6

12/6

12/7

12/7

12/8

12/8

12/9

12/9

12/1

012/1

0

12/1

112/1

1

12/1

212/1

2

12/1

312/1

3

12/1

412/1

4

12/1

512/1

5

12/1

612/1

6

12/1

712/1

7

12/1

812/1

8

12/1

912/1

9

12/2

012/2

0

12/2

112/2

1

12/2

212/2

2

12/2

312/2

3

12/2

412/2

4

12/2

512/2

5

12/2

612/2

6

12/2

712/2

7

12/2

812/2

8

12/2

912/2

9

12/3

012/3

0

12/3

112/3

1

Date

Garfield County, CO

Rifle Site

December 2012

Garfield County 2012 Air Quality Monitoring Summary A-25

0

5

10

15

20

25

30

SW

S (

mph)

0

60

120

180

240

300

360

VW

D (

°)

-20

0

20

40

60

80

100

AT

(°F

)

0

20

40

60

80

100

RH

(%

)

0

500

1000

1500

2000T

NM

OC

(ppbC

)

1/1

1/1

1/2

1/2

1/3

1/3

1/4

1/4

1/5

1/5

1/6

1/6

1/7

1/7

1/8

1/8

1/9

1/9

1/1

01/1

0

1/1

11/1

1

1/1

21/1

2

1/1

31/1

3

1/1

41/1

4

1/1

51/1

5

1/1

61/1

6

1/1

71/1

7

1/1

81/1

8

1/1

91/1

9

1/2

01/2

0

1/2

11/2

1

1/2

21/2

2

1/2

31/2

3

1/2

41/2

4

1/2

51/2

5

1/2

61/2

6

1/2

71/2

7

1/2

81/2

8

1/2

91/2

9

1/3

01/3

0

1/3

11/3

1

Date

Garfield County, CO

Bell Melton Site

January 2012

Garfield County 2012 Air Quality Monitoring Summary A-26

0

5

10

15

20

25

30

SW

S (

mph)

0

60

120

180

240

300

360

VW

D (

°)

-20

0

20

40

60

80

100

AT

(°F

)

0

20

40

60

80

100

RH

(%

)

0

500

1000

1500

2000T

NM

OC

(ppbC

)

2/1

2/1

2/2

2/2

2/3

2/3

2/4

2/4

2/5

2/5

2/6

2/6

2/7

2/7

2/8

2/8

2/9

2/9

2/1

02/1

0

2/1

12/1

1

2/1

22/1

2

2/1

32/1

3

2/1

42/1

4

2/1

52/1

5

2/1

62/1

6

2/1

72/1

7

2/1

82/1

8

2/1

92/1

9

2/2

02/2

0

2/2

12/2

1

2/2

22/2

2

2/2

32/2

3

2/2

42/2

4

2/2

52/2

5

2/2

62/2

6

2/2

72/2

7

2/2

82/2

8

2/2

92/2

9

Date

Garfield County, CO

Bell Melton Site

February 2012

Garfield County 2012 Air Quality Monitoring Summary A-27

0

5

10

15

20

25

30

SW

S (

mph)

0

60

120

180

240

300

360

VW

D (

°)

-20

0

20

40

60

80

100

AT

(°F

)

0

20

40

60

80

100

RH

(%

)

0

500

1000

1500

2000T

NM

OC

(ppbC

)

3/1

3/1

3/2

3/2

3/3

3/3

3/4

3/4

3/5

3/5

3/6

3/6

3/7

3/7

3/8

3/8

3/9

3/9

3/1

03/1

0

3/1

13/1

1

3/1

23/1

2

3/1

33/1

3

3/1

43/1

4

3/1

53/1

5

3/1

63/1

6

3/1

73/1

7

3/1

83/1

8

3/1

93/1

9

3/2

03/2

0

3/2

13/2

1

3/2

23/2

2

3/2

33/2

3

3/2

43/2

4

3/2

53/2

5

3/2

63/2

6

3/2

73/2

7

3/2

83/2

8

3/2

93/2

9

3/3

03/3

0

3/3

13/3

1

Date

Garfield County, CO

Bell Melton Site

March 2012

Garfield County 2012 Air Quality Monitoring Summary A-28

0

5

10

15

20

25

30

SW

S (

mph)

0

60

120

180

240

300

360

VW

D (

°)

-20

0

20

40

60

80

100

AT

(°F

)

0

20

40

60

80

100

RH

(%

)

0

500

1000

1500

2000T

NM

OC

(ppbC

)

4/1

4/1

4/2

4/2

4/3

4/3

4/4

4/4

4/5

4/5

4/6

4/6

4/7

4/7

4/8

4/8

4/9

4/9

4/1

04/1

0

4/1

14/1

1

4/1

24/1

2

4/1

34/1

3

4/1

44/1

4

4/1

54/1

5

4/1

64/1

6

4/1

74/1

7

4/1

84/1

8

4/1

94/1

9

4/2

04/2

0

4/2

14/2

1

4/2

24/2

2

4/2

34/2

3

4/2

44/2

4

4/2

54/2

5

4/2

64/2

6

4/2

74/2

7

4/2

84/2

8

4/2

94/2

9

4/3

04/3

0

Date

Garfield County, CO

Bell Melton Site

April 2012

Garfield County 2012 Air Quality Monitoring Summary A-29

0

5

10

15

20

25

30

SW

S (

mph)

0

60

120

180

240

300

360

VW

D (

°)

-20

0

20

40

60

80

100

AT

(°F

)

0

20

40

60

80

100

RH

(%

)

0

500

1000

1500

2000T

NM

OC

(ppbC

)

5/1

5/1

5/2

5/2

5/3

5/3

5/4

5/4

5/5

5/5

5/6

5/6

5/7

5/7

5/8

5/8

5/9

5/9

5/1

05/1

0

5/1

15/1

1

5/1

25/1

2

5/1

35/1

3

5/1

45/1

4

5/1

55/1

5

5/1

65/1

6

5/1

75/1

7

5/1

85/1

8

5/1

95/1

9

5/2

05/2

0

5/2

15/2

1

5/2

25/2

2

5/2

35/2

3

5/2

45/2

4

5/2

55/2

5

5/2

65/2

6

5/2

75/2

7

5/2

85/2

8

5/2

95/2

9

5/3

05/3

0

5/3

15/3

1

Date

Garfield County, CO

Bell Melton Site

May 2012

Garfield County 2012 Air Quality Monitoring Summary A-30

0

5

10

15

20

25

30

SW

S (

mph)

0

60

120

180

240

300

360

VW

D (

°)

-20

0

20

40

60

80

100

AT

(°F

)

0

20

40

60

80

100

RH

(%

)

0

500

1000

1500

2000T

NM

OC

(ppbC

)

6/1

6/1

6/2

6/2

6/3

6/3

6/4

6/4

6/5

6/5

6/6

6/6

6/7

6/7

6/8

6/8

6/9

6/9

6/1

06/1

0

6/1

16/1

1

6/1

26/1

2

6/1

36/1

3

6/1

46/1

4

6/1

56/1

5

6/1

66/1

6

6/1

76/1

7

6/1

86/1

8

6/1

96/1

9

6/2

06/2

0

6/2

16/2

1

6/2

26/2

2

6/2

36/2

3

6/2

46/2

4

6/2

56/2

5

6/2

66/2

6

6/2

76/2

7

6/2

86/2

8

6/2

96/2

9

6/3

06/3

0

Date

Garfield County, CO

Bell Melton Site

June 2012

Garfield County 2012 Air Quality Monitoring Summary A-31

0

5

10

15

20

25

30

SW

S (

mph)

0

60

120

180

240

300

360

VW

D (

°)

-20

0

20

40

60

80

100

AT

(°F

)

0

20

40

60

80

100

RH

(%

)

0

500

1000

1500

2000T

NM

OC

(ppbC

)

7/1

7/1

7/2

7/2

7/3

7/3

7/4

7/4

7/5

7/5

7/6

7/6

7/7

7/7

7/8

7/8

7/9

7/9

7/1

07/1

0

7/1

17/1

1

7/1

27/1

2

7/1

37/1

3

7/1

47/1

4

7/1

57/1

5

7/1

67/1

6

7/1

77/1

7

7/1

87/1

8

7/1

97/1

9

7/2

07/2

0

7/2

17/2

1

7/2

27/2

2

7/2

37/2

3

7/2

47/2

4

7/2

57/2

5

7/2

67/2

6

7/2

77/2

7

7/2

87/2

8

7/2

97/2

9

7/3

07/3

0

7/3

17/3

1

Date

Garfield County, CO

Bell Melton Site

July 2012

Garfield County 2012 Air Quality Monitoring Summary A-32

0

5

10

15

20

25

30

SW

S (

mph)

0

60

120

180

240

300

360

VW

D (

°)

-20

0

20

40

60

80

100

AT

(°F

)

0

20

40

60

80

100

RH

(%

)

0

500

1000

1500

2000T

NM

OC

(ppbC

)

8/1

8/1

8/2

8/2

8/3

8/3

8/4

8/4

8/5

8/5

8/6

8/6

8/7

8/7

8/8

8/8

8/9

8/9

8/1

08/1

0

8/1

18/1

1

8/1

28/1

2

8/1

38/1

3

8/1

48/1

4

8/1

58/1

5

8/1

68/1

6

8/1

78/1

7

8/1

88/1

8

8/1

98/1

9

8/2

08/2

0

8/2

18/2

1

8/2

28/2

2

8/2

38/2

3

8/2

48/2

4

8/2

58/2

5

8/2

68/2

6

8/2

78/2

7

8/2

88/2

8

8/2

98/2

9

8/3

08/3

0

8/3

18/3

1

Date

Garfield County, CO

Bell Melton Site

August 2012

Garfield County 2012 Air Quality Monitoring Summary A-33

0

5

10

15

20

25

30

SW

S (

mph)

0

60

120

180

240

300

360

VW

D (

°)

-20

0

20

40

60

80

100

AT

(°F

)

0

20

40

60

80

100

RH

(%

)

0

500

1000

1500

2000T

NM

OC

(ppbC

)

9/1

9/1

9/2

9/2

9/3

9/3

9/4

9/4

9/5

9/5

9/6

9/6

9/7

9/7

9/8

9/8

9/9

9/9

9/1

09/1

0

9/1

19/1

1

9/1

29/1

2

9/1

39/1

3

9/1

49/1

4

9/1

59/1

5

9/1

69/1

6

9/1

79/1

7

9/1

89/1

8

9/1

99/1

9

9/2

09/2

0

9/2

19/2

1

9/2

29/2

2

9/2

39/2

3

9/2

49/2

4

9/2

59/2

5

9/2

69/2

6

9/2

79/2

7

9/2

89/2

8

9/2

99/2

9

9/3

09/3

0

Date

Garfield County, CO

Bell Melton Site

September 2012

Garfield County 2012 Air Quality Monitoring Summary A-34

0

5

10

15

20

25

30

SW

S (

mph)

0

60

120

180

240

300

360

VW

D (

°)

-20

0

20

40

60

80

100

AT

(°F

)

0

20

40

60

80

100

RH

(%

)

0

500

1000

1500

2000T

NM

OC

(ppbC

)

10/1

10/1

10/2

10/2

10/3

10/3

10/4

10/4

10/5

10/5

10/6

10/6

10/7

10/7

10/8

10/8

10/9

10/9

10/1

010/1

0

10/1

110/1

1

10/1

210/1

2

10/1

310/1

3

10/1

410/1

4

10/1

510/1

5

10/1

610/1

6

10/1

710/1

7

10/1

810/1

8

10/1

910/1

9

10/2

010/2

0

10/2

110/2

1

10/2

210/2

2

10/2

310/2

3

10/2

410/2

4

10/2

510/2

5

10/2

610/2

6

10/2

710/2

7

10/2

810/2

8

10/2

910/2

9

10/3

010/3

0

10/3

110/3

1

Date

Garfield County, CO

Bell Melton Site

October 2012

Garfield County 2012 Air Quality Monitoring Summary A-35

0

5

10

15

20

25

30

SW

S (

mph)

0

60

120

180

240

300

360

VW

D (

°)

-20

0

20

40

60

80

100

AT

(°F

)

0

20

40

60

80

100

RH

(%

)

0

500

1000

1500

2000T

NM

OC

(ppbC

)

11/1

11/1

11/2

11/2

11/3

11/3

11/4

11/4

11/5

11/5

11/6

11/6

11/7

11/7

11/8

11/8

11/9

11/9

11/1

011/1

0

11/1

111/1

1

11/1

211/1

2

11/1

311/1

3

11/1

411/1

4

11/1

511/1

5

11/1

611/1

6

11/1

711/1

7

11/1

811/1

8

11/1

911/1

9

11/2

011/2

0

11/2

111/2

1

11/2

211/2

2

11/2

311/2

3

11/2

411/2

4

11/2

511/2

5

11/2

611/2

6

11/2

711/2

7

11/2

811/2

8

11/2

911/2

9

11/3

011/3

0

Date

Garfield County, CO

Bell Melton Site

November 2012

Garfield County 2012 Air Quality Monitoring Summary A-36

0

5

10

15

20

25

30

SW

S (

mph)

0

60

120

180

240

300

360

VW

D (

°)

-20

0

20

40

60

80

100

AT

(°F

)

0

20

40

60

80

100

RH

(%

)

0

500

1000

1500

2000T

NM

OC

(ppbC

)

12/1

12/1

12/2

12/2

12/3

12/3

12/4

12/4

12/5

12/5

12/6

12/6

12/7

12/7

12/8

12/8

12/9

12/9

12/1

012/1

0

12/1

112/1

1

12/1

212/1

2

12/1

312/1

3

12/1

412/1

4

12/1

512/1

5

12/1

612/1

6

12/1

712/1

7

12/1

812/1

8

12/1

912/1

9

12/2

012/2

0

12/2

112/2

1

12/2

212/2

2

12/2

312/2

3

12/2

412/2

4

12/2

512/2

5

12/2

612/2

6

12/2

712/2

7

12/2

812/2

8

12/2

912/2

9

12/3

012/3

0

12/3

112/3

1

Date

Garfield County, CO

Bell Melton Site

December 2012

Garfield County 2012 Air Quality Monitoring Summary A-37

0

5

10

15

20

25

30

SW

S (

mph)

0

60

120

180

240

300

360

VW

D (

°)

-20

0

20

40

60

80

100

AT

(°F

)

0

20

40

60

80

100

RH

(%

)

0

20

40

60

80

100

1-h

r P

M2.5

(ug/m

3)

0

20

40

60

80

100

24-h

r P

M2.5

(ug/m

3)

0

20

40

60

80

100

1-h

r P

M10 (

ug/m

3)

0

20

40

60

80

100

24-h

r P

M10 (

ug/m

3)

0

20

40

60

80

100

NO

2 (

ppb)

0

20

40

60

80

100

NO

(ppb)

0

20

40

60

80

100

NO

X (

ppb)

0

20

40

60

80

100

O3 (

ppb)

.00

.50

1.00

1.50

2.00

NM

HC

(ppm

)

0

500

1000

1500

2000

TN

MO

C (

ppbC

)

1/1

1/1

1/2

1/2

1/3

1/3

1/4

1/4

1/5

1/5

1/6

1/6

1/7

1/7

1/8

1/8

1/9

1/9

1/1

01/1

0

1/1

11/1

1

1/1

21/1

2

1/1

31/1

3

1/1

41/1

4

1/1

51/1

5

1/1

61/1

6

1/1

71/1

7

1/1

81/1

8

1/1

91/1

9

1/2

01/2

0

1/2

11/2

1

1/2

21/2

2

1/2

31/2

3

1/2

41/2

4

1/2

51/2

5

1/2

61/2

6

1/2

71/2

7

1/2

81/2

8

1/2

91/2

9

1/3

01/3

0

1/3

11/3

1

Date

Garfield County, CO

Battlement Mesa Site

January 2012

Garfield County 2012 Air Quality Monitoring Summary A-38

0

5

10

15

20

25

30

SW

S (

mph)

0

60

120

180

240

300

360

VW

D (

°)

-20

0

20

40

60

80

100

AT

(°F

)

0

20

40

60

80

100

RH

(%

)

0

20

40

60

80

100

1-h

r P

M2.5

(ug/m

3)

0

20

40

60

80

100

24-h

r P

M2.5

(ug/m

3)

0

20

40

60

80

100

1-h

r P

M10 (

ug/m

3)

0

20

40

60

80

100

24-h

r P

M10 (

ug/m

3)

0

20

40

60

80

100

NO

2 (

ppb)

0

20

40

60

80

100

NO

(ppb)

0

20

40

60

80

100

NO

X (

ppb)

0

20

40

60

80

100

O3 (

ppb)

.00

.50

1.00

1.50

2.00

NM

HC

(ppm

)

0

500

1000

1500

2000

TN

MO

C (

ppbC

)

2/1

2/1

2/2

2/2

2/3

2/3

2/4

2/4

2/5

2/5

2/6

2/6

2/7

2/7

2/8

2/8

2/9

2/9

2/1

02/1

0

2/1

12/1

1

2/1

22/1

2

2/1

32/1

3

2/1

42/1

4

2/1

52/1

5

2/1

62/1

6

2/1

72/1

7

2/1

82/1

8

2/1

92/1

9

2/2

02/2

0

2/2

12/2

1

2/2

22/2

2

2/2

32/2

3

2/2

42/2

4

2/2

52/2

5

2/2

62/2

6

2/2

72/2

7

2/2

82/2

8

2/2

92/2

9

Date

Garfield County, CO

Battlement Mesa Site

February 2012

Garfield County 2012 Air Quality Monitoring Summary A-39

0

5

10

15

20

25

30

SW

S (

mph)

0

60

120

180

240

300

360

VW

D (

°)

-20

0

20

40

60

80

100

AT

(°F

)

0

20

40

60

80

100

RH

(%

)

0

20

40

60

80

100

1-h

r P

M2.5

(ug/m

3)

0

20

40

60

80

100

24-h

r P

M2.5

(ug/m

3)

0

20

40

60

80

100

1-h

r P

M10 (

ug/m

3)

0

20

40

60

80

100

24-h

r P

M10 (

ug/m

3)

0

20

40

60

80

100

NO

2 (

ppb)

0

20

40

60

80

100

NO

(ppb)

0

20

40

60

80

100

NO

X (

ppb)

0

20

40

60

80

100

O3 (

ppb)

.00

.50

1.00

1.50

2.00

NM

HC

(ppm

)

0

500

1000

1500

2000

TN

MO

C (

ppbC

)

3/1

3/1

3/2

3/2

3/3

3/3

3/4

3/4

3/5

3/5

3/6

3/6

3/7

3/7

3/8

3/8

3/9

3/9

3/1

03/1

0

3/1

13/1

1

3/1

23/1

2

3/1

33/1

3

3/1

43/1

4

3/1

53/1

5

3/1

63/1

6

3/1

73/1

7

3/1

83/1

8

3/1

93/1

9

3/2

03/2

0

3/2

13/2

1

3/2

23/2

2

3/2

33/2

3

3/2

43/2

4

3/2

53/2

5

3/2

63/2

6

3/2

73/2

7

3/2

83/2

8

3/2

93/2

9

3/3

03/3

0

3/3

13/3

1

Date

Garfield County, CO

Battlement Mesa Site

March 2012

Garfield County 2012 Air Quality Monitoring Summary A-40

0

5

10

15

20

25

30

SW

S (

mph)

0

60

120

180

240

300

360

VW

D (

°)

-20

0

20

40

60

80

100

AT

(°F

)

0

20

40

60

80

100

RH

(%

)

0

20

40

60

80

100

1-h

r P

M2.5

(ug/m

3)

0

20

40

60

80

100

24-h

r P

M2.5

(ug/m

3)

0

20

40

60

80

100

1-h

r P

M10 (

ug/m

3)

0

20

40

60

80

100

24-h

r P

M10 (

ug/m

3)

0

20

40

60

80

100

NO

2 (

ppb)

0

20

40

60

80

100

NO

(ppb)

0

20

40

60

80

100

NO

X (

ppb)

0

20

40

60

80

100

O3 (

ppb)

.00

.50

1.00

1.50

2.00

NM

HC

(ppm

)

0

500

1000

1500

2000

TN

MO

C (

ppbC

)

4/1

4/1

4/2

4/2

4/3

4/3

4/4

4/4

4/5

4/5

4/6

4/6

4/7

4/7

4/8

4/8

4/9

4/9

4/1

04/1

0

4/1

14/1

1

4/1

24/1

2

4/1

34/1

3

4/1

44/1

4

4/1

54/1

5

4/1

64/1

6

4/1

74/1

7

4/1

84/1

8

4/1

94/1

9

4/2

04/2

0

4/2

14/2

1

4/2

24/2

2

4/2

34/2

3

4/2

44/2

4

4/2

54/2

5

4/2

64/2

6

4/2

74/2

7

4/2

84/2

8

4/2

94/2

9

4/3

04/3

0

Date

Garfield County, CO

Battlement Mesa Site

April 2012

Garfield County 2012 Air Quality Monitoring Summary A-41

0

5

10

15

20

25

30

SW

S (

mph)

0

60

120

180

240

300

360

VW

D (

°)

-20

0

20

40

60

80

100

AT

(°F

)

0

20

40

60

80

100

RH

(%

)

0

20

40

60

80

100

1-h

r P

M2.5

(ug/m

3)

0

20

40

60

80

100

24-h

r P

M2.5

(ug/m

3)

0

20

40

60

80

100

1-h

r P

M10 (

ug/m

3)

0

20

40

60

80

100

24-h

r P

M10 (

ug/m

3)

0

20

40

60

80

100

NO

2 (

ppb)

0

20

40

60

80

100

NO

(ppb)

0

20

40

60

80

100

NO

X (

ppb)

0

20

40

60

80

100

O3 (

ppb)

.00

.50

1.00

1.50

2.00

NM

HC

(ppm

)

0

500

1000

1500

2000

TN

MO

C (

ppbC

)

5/1

5/1

5/2

5/2

5/3

5/3

5/4

5/4

5/5

5/5

5/6

5/6

5/7

5/7

5/8

5/8

5/9

5/9

5/1

05/1

0

5/1

15/1

1

5/1

25/1

2

5/1

35/1

3

5/1

45/1

4

5/1

55/1

5

5/1

65/1

6

5/1

75/1

7

5/1

85/1

8

5/1

95/1

9

5/2

05/2

0

5/2

15/2

1

5/2

25/2

2

5/2

35/2

3

5/2

45/2

4

5/2

55/2

5

5/2

65/2

6

5/2

75/2

7

5/2

85/2

8

5/2

95/2

9

5/3

05/3

0

5/3

15/3

1

Date

Garfield County, CO

Battlement Mesa Site

May 2012

Garfield County 2012 Air Quality Monitoring Summary A-42

0

5

10

15

20

25

30

SW

S (

mph)

0

60

120

180

240

300

360

VW

D (

°)

-20

0

20

40

60

80

100

AT

(°F

)

0

20

40

60

80

100

RH

(%

)

0

20

40

60

80

100

1-h

r P

M2.5

(ug/m

3)

0

20

40

60

80

100

24-h

r P

M2.5

(ug/m

3)

0

20

40

60

80

100

1-h

r P

M10 (

ug/m

3)

0

20

40

60

80

100

24-h

r P

M10 (

ug/m

3)

0

20

40

60

80

100

NO

2 (

ppb)

0

20

40

60

80

100

NO

(ppb)

0

20

40

60

80

100

NO

X (

ppb)

0

20

40

60

80

100

O3 (

ppb)

.00

.50

1.00

1.50

2.00

NM

HC

(ppm

)

0

500

1000

1500

2000

TN

MO

C (

ppbC

)

6/1

6/1

6/2

6/2

6/3

6/3

6/4

6/4

6/5

6/5

6/6

6/6

6/7

6/7

6/8

6/8

6/9

6/9

6/1

06/1

0

6/1

16/1

1

6/1

26/1

2

6/1

36/1

3

6/1

46/1

4

6/1

56/1

5

6/1

66/1

6

6/1

76/1

7

6/1

86/1

8

6/1

96/1

9

6/2

06/2

0

6/2

16/2

1

6/2

26/2

2

6/2

36/2

3

6/2

46/2

4

6/2

56/2

5

6/2

66/2

6

6/2

76/2

7

6/2

86/2

8

6/2

96/2

9

6/3

06/3

0

Date

Garfield County, CO

Battlement Mesa Site

June 2012

Garfield County 2012 Air Quality Monitoring Summary A-43

0

5

10

15

20

25

30

SW

S (

mph)

0

60

120

180

240

300

360

VW

D (

°)

-20

0

20

40

60

80

100

AT

(°F

)

0

20

40

60

80

100

RH

(%

)

0

20

40

60

80

100

1-h

r P

M2.5

(ug/m

3)

0

20

40

60

80

100

24-h

r P

M2.5

(ug/m

3)

0

20

40

60

80

100

1-h

r P

M10 (

ug/m

3)

0

20

40

60

80

100

24-h

r P

M10 (

ug/m

3)

0

20

40

60

80

100

NO

2 (

ppb)

0

20

40

60

80

100

NO

(ppb)

0

20

40

60

80

100

NO

X (

ppb)

0

20

40

60

80

100

O3 (

ppb)

.00

.50

1.00

1.50

2.00

NM

HC

(ppm

)

0

500

1000

1500

2000

TN

MO

C (

ppbC

)

7/1

7/1

7/2

7/2

7/3

7/3

7/4

7/4

7/5

7/5

7/6

7/6

7/7

7/7

7/8

7/8

7/9

7/9

7/1

07/1

0

7/1

17/1

1

7/1

27/1

2

7/1

37/1

3

7/1

47/1

4

7/1

57/1

5

7/1

67/1

6

7/1

77/1

7

7/1

87/1

8

7/1

97/1

9

7/2

07/2

0

7/2

17/2

1

7/2

27/2

2

7/2

37/2

3

7/2

47/2

4

7/2

57/2

5

7/2

67/2

6

7/2

77/2

7

7/2

87/2

8

7/2

97/2

9

7/3

07/3

0

7/3

17/3

1

Date

Garfield County, CO

Battlement Mesa Site

July 2012

Garfield County 2012 Air Quality Monitoring Summary A-44

0

5

10

15

20

25

30

SW

S (

mph)

0

60

120

180

240

300

360

VW

D (

°)

-20

0

20

40

60

80

100

AT

(°F

)

0

20

40

60

80

100

RH

(%

)

0

20

40

60

80

100

1-h

r P

M2.5

(ug/m

3)

0

20

40

60

80

100

24-h

r P

M2.5

(ug/m

3)

0

20

40

60

80

100

1-h

r P

M10 (

ug/m

3)

0

20

40

60

80

100

24-h

r P

M10 (

ug/m

3)

0

20

40

60

80

100

NO

2 (

ppb)

0

20

40

60

80

100

NO

(ppb)

0

20

40

60

80

100

NO

X (

ppb)

0

20

40

60

80

100

O3 (

ppb)

.00

.50

1.00

1.50

2.00

NM

HC

(ppm

)

0

500

1000

1500

2000

TN

MO

C (

ppbC

)

8/1

8/1

8/2

8/2

8/3

8/3

8/4

8/4

8/5

8/5

8/6

8/6

8/7

8/7

8/8

8/8

8/9

8/9

8/1

08/1

0

8/1

18/1

1

8/1

28/1

2

8/1

38/1

3

8/1

48/1

4

8/1

58/1

5

8/1

68/1

6

8/1

78/1

7

8/1

88/1

8

8/1

98/1

9

8/2

08/2

0

8/2

18/2

1

8/2

28/2

2

8/2

38/2

3

8/2

48/2

4

8/2

58/2

5

8/2

68/2

6

8/2

78/2

7

8/2

88/2

8

8/2

98/2

9

8/3

08/3

0

8/3

18/3

1

Date

Garfield County, CO

Battlement Mesa Site

August 2012

Garfield County 2012 Air Quality Monitoring Summary A-45

0

5

10

15

20

25

30

SW

S (

mph)

0

60

120

180

240

300

360

VW

D (

°)

-20

0

20

40

60

80

100

AT

(°F

)

0

20

40

60

80

100

RH

(%

)

0

20

40

60

80

100

1-h

r P

M2.5

(ug/m

3)

0

20

40

60

80

100

24-h

r P

M2.5

(ug/m

3)

0

20

40

60

80

100

1-h

r P

M10 (

ug/m

3)

0

20

40

60

80

100

24-h

r P

M10 (

ug/m

3)

0

20

40

60

80

100

NO

2 (

ppb)

0

20

40

60

80

100

NO

(ppb)

0

20

40

60

80

100

NO

X (

ppb)

0

20

40

60

80

100

O3 (

ppb)

.00

.50

1.00

1.50

2.00

NM

HC

(ppm

)

0

500

1000

1500

2000

TN

MO

C (

ppbC

)

9/1

9/1

9/2

9/2

9/3

9/3

9/4

9/4

9/5

9/5

9/6

9/6

9/7

9/7

9/8

9/8

9/9

9/9

9/1

09/1

0

9/1

19/1

1

9/1

29/1

2

9/1

39/1

3

9/1

49/1

4

9/1

59/1

5

9/1

69/1

6

9/1

79/1

7

9/1

89/1

8

9/1

99/1

9

9/2

09/2

0

9/2

19/2

1

9/2

29/2

2

9/2

39/2

3

9/2

49/2

4

9/2

59/2

5

9/2

69/2

6

9/2

79/2

7

9/2

89/2

8

9/2

99/2

9

9/3

09/3

0

Date

Garfield County, CO

Battlement Mesa Site

September 2012

Garfield County 2012 Air Quality Monitoring Summary A-46

0

5

10

15

20

25

30

SW

S (

mph)

0

60

120

180

240

300

360

VW

D (

°)

-20

0

20

40

60

80

100

AT

(°F

)

0

20

40

60

80

100

RH

(%

)

0

20

40

60

80

100

1-h

r P

M2.5

(ug/m

3)

0

20

40

60

80

100

24-h

r P

M2.5

(ug/m

3)

0

20

40

60

80

100

1-h

r P

M10 (

ug/m

3)

0

20

40

60

80

100

24-h

r P

M10 (

ug/m

3)

0

20

40

60

80

100

NO

2 (

ppb)

0

20

40

60

80

100

NO

(ppb)

0

20

40

60

80

100

NO

X (

ppb)

0

20

40

60

80

100

O3 (

ppb)

.00

.50

1.00

1.50

2.00

NM

HC

(ppm

)

0

500

1000

1500

2000

TN

MO

C (

ppbC

)

10/1

10/1

10/2

10/2

10/3

10/3

10/4

10/4

10/5

10/5

10/6

10/6

10/7

10/7

10/8

10/8

10/9

10/9

10/1

010/1

0

10/1

110/1

1

10/1

210/1

2

10/1

310/1

3

10/1

410/1

4

10/1

510/1

5

10/1

610/1

6

10/1

710/1

7

10/1

810/1

8

10/1

910/1

9

10/2

010/2

0

10/2

110/2

1

10/2

210/2

2

10/2

310/2

3

10/2

410/2

4

10/2

510/2

5

10/2

610/2

6

10/2

710/2

7

10/2

810/2

8

10/2

910/2

9

10/3

010/3

0

10/3

110/3

1

Date

Garfield County, CO

Battlement Mesa Site

October 2012

Garfield County 2012 Air Quality Monitoring Summary A-47

0

5

10

15

20

25

30

SW

S (

mph)

0

60

120

180

240

300

360

VW

D (

°)

-20

0

20

40

60

80

100

AT

(°F

)

0

20

40

60

80

100

RH

(%

)

0

20

40

60

80

100

1-h

r P

M2.5

(ug/m

3)

0

20

40

60

80

100

24-h

r P

M2.5

(ug/m

3)

0

20

40

60

80

100

1-h

r P

M10 (

ug/m

3)

0

20

40

60

80

100

24-h

r P

M10 (

ug/m

3)

0

20

40

60

80

100

NO

2 (

ppb)

0

20

40

60

80

100

NO

(ppb)

0

20

40

60

80

100

NO

X (

ppb)

0

20

40

60

80

100

O3 (

ppb)

.00

.50

1.00

1.50

2.00

NM

HC

(ppm

)

0

500

1000

1500

2000

TN

MO

C (

ppbC

)

11/1

11/1

11/2

11/2

11/3

11/3

11/4

11/4

11/5

11/5

11/6

11/6

11/7

11/7

11/8

11/8

11/9

11/9

11/1

011/1

0

11/1

111/1

1

11/1

211/1

2

11/1

311/1

3

11/1

411/1

4

11/1

511/1

5

11/1

611/1

6

11/1

711/1

7

11/1

811/1

8

11/1

911/1

9

11/2

011/2

0

11/2

111/2

1

11/2

211/2

2

11/2

311/2

3

11/2

411/2

4

11/2

511/2

5

11/2

611/2

6

11/2

711/2

7

11/2

811/2

8

11/2

911/2

9

11/3

011/3

0

Date

Garfield County, CO

Battlement Mesa Site

November 2012

Garfield County 2012 Air Quality Monitoring Summary A-48

0

5

10

15

20

25

30

SW

S (

mph)

0

60

120

180

240

300

360

VW

D (

°)

-20

0

20

40

60

80

100

AT

(°F

)

0

20

40

60

80

100

RH

(%

)

0

20

40

60

80

100

1-h

r P

M2.5

(ug/m

3)

0

20

40

60

80

100

24-h

r P

M2.5

(ug/m

3)

0

20

40

60

80

100

1-h

r P

M10 (

ug/m

3)

0

20

40

60

80

100

24-h

r P

M10 (

ug/m

3)

0

20

40

60

80

100

NO

2 (

ppb)

0

20

40

60

80

100

NO

(ppb)

0

20

40

60

80

100

NO

X (

ppb)

0

20

40

60

80

100

O3 (

ppb)

.00

.50

1.00

1.50

2.00

NM

HC

(ppm

)

0

500

1000

1500

2000

TN

MO

C (

ppbC

)

12/1

12/1

12/2

12/2

12/3

12/3

12/4

12/4

12/5

12/5

12/6

12/6

12/7

12/7

12/8

12/8

12/9

12/9

12/1

012/1

0

12/1

112/1

1

12/1

212/1

2

12/1

312/1

3

12/1

412/1

4

12/1

512/1

5

12/1

612/1

6

12/1

712/1

7

12/1

812/1

8

12/1

912/1

9

12/2

012/2

0

12/2

112/2

1

12/2

212/2

2

12/2

312/2

3

12/2

412/2

4

12/2

512/2

5

12/2

612/2

6

12/2

712/2

7

12/2

812/2

8

12/2

912/2

9

12/3

012/3

0

12/3

112/3

1

Date

Garfield County, CO

Battlement Mesa Site

December 2012

Garfield County 2012 Air Quality Monitoring Summary A-49

0

5

10

15

20

25

30

SW

S (

mph)

0

60

120

180

240

300

360

SW

D (

°)

-20

0

20

40

60

80

100

AT

(°F

)

0

20

40

60

80

100

RH

(%

)

0

20

40

60

80

100

O3 (

ppb)

0

20

40

60

80

100

1-h

r P

M2.5

(ug/m

3)

0

20

40

60

80

100

24-h

r P

M2.5

(ug/m

3)

0

20

40

60

80

100

PM

10

0

300

600

900

1200

1500

TN

MO

C (

ppbC

)

3/1

3/1

3/2

3/2

3/3

3/3

3/4

3/4

3/5

3/5

3/6

3/6

3/7

3/7

3/8

3/8

3/9

3/9

3/1

03/1

0

3/1

13/1

1

3/1

23/1

2

3/1

33/1

3

3/1

43/1

4

3/1

53/1

5

3/1

63/1

6

3/1

73/1

7

3/1

83/1

8

3/1

93/1

9

3/2

03/2

0

3/2

13/2

1

3/2

23/2

2

3/2

33/2

3

3/2

43/2

4

3/2

53/2

5

3/2

63/2

6

3/2

73/2

7

3/2

83/2

8

3/2

93/2

9

3/3

03/3

0

3/3

13/3

1

Date

Garfield County, CO

Carbondale Site

March 2012

Garfield County 2012 Air Quality Monitoring Summary A-50

0

5

10

15

20

25

30

SW

S (

mph)

0

60

120

180

240

300

360

SW

D (

°)

-20

0

20

40

60

80

100

AT

(°F

)

0

20

40

60

80

100

RH

(%

)

0

20

40

60

80

100

O3 (

ppb)

0

20

40

60

80

100

1-h

r P

M2.5

(ug/m

3)

0

20

40

60

80

100

24-h

r P

M2.5

(ug/m

3)

0

20

40

60

80

100

PM

10

0

300

600

900

1200

1500

TN

MO

C (

ppbC

)

4/1

4/1

4/2

4/2

4/3

4/3

4/4

4/4

4/5

4/5

4/6

4/6

4/7

4/7

4/8

4/8

4/9

4/9

4/1

04/1

0

4/1

14/1

1

4/1

24/1

2

4/1

34/1

3

4/1

44/1

4

4/1

54/1

5

4/1

64/1

6

4/1

74/1

7

4/1

84/1

8

4/1

94/1

9

4/2

04/2

0

4/2

14/2

1

4/2

24/2

2

4/2

34/2

3

4/2

44/2

4

4/2

54/2

5

4/2

64/2

6

4/2

74/2

7

4/2

84/2

8

4/2

94/2

9

4/3

04/3

0

Date

Garfield County, CO

Carbondale Site

April 2012

Garfield County 2012 Air Quality Monitoring Summary A-51

0

5

10

15

20

25

30

SW

S (

mph)

0

60

120

180

240

300

360

SW

D (

°)

-20

0

20

40

60

80

100

AT

(°F

)

0

20

40

60

80

100

RH

(%

)

0

20

40

60

80

100

O3 (

ppb)

0

20

40

60

80

100

1-h

r P

M2.5

(ug/m

3)

0

20

40

60

80

100

24-h

r P

M2.5

(ug/m

3)

0

20

40

60

80

100

PM

10

0

300

600

900

1200

1500

TN

MO

C (

ppbC

)

5/1

5/1

5/2

5/2

5/3

5/3

5/4

5/4

5/5

5/5

5/6

5/6

5/7

5/7

5/8

5/8

5/9

5/9

5/1

05/1

0

5/1

15/1

1

5/1

25/1

2

5/1

35/1

3

5/1

45/1

4

5/1

55/1

5

5/1

65/1

6

5/1

75/1

7

5/1

85/1

8

5/1

95/1

9

5/2

05/2

0

5/2

15/2

1

5/2

25/2

2

5/2

35/2

3

5/2

45/2

4

5/2

55/2

5

5/2

65/2

6

5/2

75/2

7

5/2

85/2

8

5/2

95/2

9

5/3

05/3

0

5/3

15/3

1

Date

Garfield County, CO

Carbondale Site

May 2012

Garfield County 2012 Air Quality Monitoring Summary A-52

0

5

10

15

20

25

30

SW

S (

mph)

0

60

120

180

240

300

360

SW

D (

°)

-20

0

20

40

60

80

100

AT

(°F

)

0

20

40

60

80

100

RH

(%

)

0

20

40

60

80

100

O3 (

ppb)

0

20

40

60

80

100

1-h

r P

M2.5

(ug/m

3)

0

20

40

60

80

100

24-h

r P

M2.5

(ug/m

3)

0

20

40

60

80

100

PM

10

0

300

600

900

1200

1500

TN

MO

C (

ppbC

)

6/1

6/1

6/2

6/2

6/3

6/3

6/4

6/4

6/5

6/5

6/6

6/6

6/7

6/7

6/8

6/8

6/9

6/9

6/1

06/1

0

6/1

16/1

1

6/1

26/1

2

6/1

36/1

3

6/1

46/1

4

6/1

56/1

5

6/1

66/1

6

6/1

76/1

7

6/1

86/1

8

6/1

96/1

9

6/2

06/2

0

6/2

16/2

1

6/2

26/2

2

6/2

36/2

3

6/2

46/2

4

6/2

56/2

5

6/2

66/2

6

6/2

76/2

7

6/2

86/2

8

6/2

96/2

9

6/3

06/3

0

Date

Garfield County, CO

Carbondale Site

June 2012

Garfield County 2012 Air Quality Monitoring Summary A-53

0

5

10

15

20

25

30

SW

S (

mph)

0

60

120

180

240

300

360

SW

D (

°)

-20

0

20

40

60

80

100

AT

(°F

)

0

20

40

60

80

100

RH

(%

)

0

20

40

60

80

100

O3 (

ppb)

0

20

40

60

80

100

1-h

r P

M2.5

(ug/m

3)

0

20

40

60

80

100

24-h

r P

M2.5

(ug/m

3)

0

20

40

60

80

100

PM

10

0

300

600

900

1200

1500

TN

MO

C (

ppbC

)

7/1

7/1

7/2

7/2

7/3

7/3

7/4

7/4

7/5

7/5

7/6

7/6

7/7

7/7

7/8

7/8

7/9

7/9

7/1

07/1

0

7/1

17/1

1

7/1

27/1

2

7/1

37/1

3

7/1

47/1

4

7/1

57/1

5

7/1

67/1

6

7/1

77/1

7

7/1

87/1

8

7/1

97/1

9

7/2

07/2

0

7/2

17/2

1

7/2

27/2

2

7/2

37/2

3

7/2

47/2

4

7/2

57/2

5

7/2

67/2

6

7/2

77/2

7

7/2

87/2

8

7/2

97/2

9

7/3

07/3

0

7/3

17/3

1

Date

Garfield County, CO

Carbondale Site

July 2012

Garfield County 2012 Air Quality Monitoring Summary A-54

0

5

10

15

20

25

30

SW

S (

mph)

0

60

120

180

240

300

360

SW

D (

°)

-20

0

20

40

60

80

100

AT

(°F

)

0

20

40

60

80

100

RH

(%

)

0

20

40

60

80

100

O3 (

ppb)

0

20

40

60

80

100

1-h

r P

M2.5

(ug/m

3)

0

20

40

60

80

100

24-h

r P

M2.5

(ug/m

3)

0

20

40

60

80

100

PM

10

0

300

600

900

1200

1500

TN

MO

C (

ppbC

)

8/1

8/1

8/2

8/2

8/3

8/3

8/4

8/4

8/5

8/5

8/6

8/6

8/7

8/7

8/8

8/8

8/9

8/9

8/1

08/1

0

8/1

18/1

1

8/1

28/1

2

8/1

38/1

3

8/1

48/1

4

8/1

58/1

5

8/1

68/1

6

8/1

78/1

7

8/1

88/1

8

8/1

98/1

9

8/2

08/2

0

8/2

18/2

1

8/2

28/2

2

8/2

38/2

3

8/2

48/2

4

8/2

58/2

5

8/2

68/2

6

8/2

78/2

7

8/2

88/2

8

8/2

98/2

9

8/3

08/3

0

8/3

18/3

1

Date

Garfield County, CO

Carbondale Site

August 2012

Garfield County 2012 Air Quality Monitoring Summary A-55

0

5

10

15

20

25

30

SW

S (

mph)

0

60

120

180

240

300

360

SW

D (

°)

-20

0

20

40

60

80

100

AT

(°F

)

0

20

40

60

80

100

RH

(%

)

0

20

40

60

80

100

O3 (

ppb)

0

20

40

60

80

100

1-h

r P

M2.5

(ug/m

3)

0

20

40

60

80

100

24-h

r P

M2.5

(ug/m

3)

0

20

40

60

80

100

PM

10

0

300

600

900

1200

1500

TN

MO

C (

ppbC

)

9/1

9/1

9/2

9/2

9/3

9/3

9/4

9/4

9/5

9/5

9/6

9/6

9/7

9/7

9/8

9/8

9/9

9/9

9/1

09/1

0

9/1

19/1

1

9/1

29/1

2

9/1

39/1

3

9/1

49/1

4

9/1

59/1

5

9/1

69/1

6

9/1

79/1

7

9/1

89/1

8

9/1

99/1

9

9/2

09/2

0

9/2

19/2

1

9/2

29/2

2

9/2

39/2

3

9/2

49/2

4

9/2

59/2

5

9/2

69/2

6

9/2

79/2

7

9/2

89/2

8

9/2

99/2

9

9/3

09/3

0

Date

Garfield County, CO

Carbondale Site

September 2012

Garfield County 2012 Air Quality Monitoring Summary A-56

0

5

10

15

20

25

30

SW

S (

mph)

0

60

120

180

240

300

360

SW

D (

°)

-20

0

20

40

60

80

100

AT

(°F

)

0

20

40

60

80

100

RH

(%

)

0

20

40

60

80

100

O3 (

ppb)

0

20

40

60

80

100

1-h

r P

M2.5

(ug/m

3)

0

20

40

60

80

100

24-h

r P

M2.5

(ug/m

3)

0

20

40

60

80

100

PM

10

0

300

600

900

1200

1500

TN

MO

C (

ppbC

)

10/1

10/1

10/2

10/2

10/3

10/3

10/4

10/4

10/5

10/5

10/6

10/6

10/7

10/7

10/8

10/8

10/9

10/9

10/1

010/1

0

10/1

110/1

1

10/1

210/1

2

10/1

310/1

3

10/1

410/1

4

10/1

510/1

5

10/1

610/1

6

10/1

710/1

7

10/1

810/1

8

10/1

910/1

9

10/2

010/2

0

10/2

110/2

1

10/2

210/2

2

10/2

310/2

3

10/2

410/2

4

10/2

510/2

5

10/2

610/2

6

10/2

710/2

7

10/2

810/2

8

10/2

910/2

9

10/3

010/3

0

10/3

110/3

1

Date

Garfield County, CO

Carbondale Site

October 2012

Garfield County 2012 Air Quality Monitoring Summary A-57

0

5

10

15

20

25

30

SW

S (

mph)

0

60

120

180

240

300

360

SW

D (

°)

-20

0

20

40

60

80

100

AT

(°F

)

0

20

40

60

80

100

RH

(%

)

0

20

40

60

80

100

O3 (

ppb)

0

20

40

60

80

100

1-h

r P

M2.5

(ug/m

3)

0

20

40

60

80

100

24-h

r P

M2.5

(ug/m

3)

0

20

40

60

80

100

PM

10

0

300

600

900

1200

1500

TN

MO

C (

ppbC

)

11/1

11/1

11/2

11/2

11/3

11/3

11/4

11/4

11/5

11/5

11/6

11/6

11/7

11/7

11/8

11/8

11/9

11/9

11/1

011/1

0

11/1

111/1

1

11/1

211/1

2

11/1

311/1

3

11/1

411/1

4

11/1

511/1

5

11/1

611/1

6

11/1

711/1

7

11/1

811/1

8

11/1

911/1

9

11/2

011/2

0

11/2

111/2

1

11/2

211/2

2

11/2

311/2

3

11/2

411/2

4

11/2

511/2

5

11/2

611/2

6

11/2

711/2

7

11/2

811/2

8

11/2

911/2

9

11/3

011/3

0

Date

Garfield County, CO

Carbondale Site

November 2012

Garfield County 2012 Air Quality Monitoring Summary A-58

0

5

10

15

20

25

30

SW

S (

mph)

0

60

120

180

240

300

360

SW

D (

°)

-20

0

20

40

60

80

100

AT

(°F

)

0

20

40

60

80

100

RH

(%

)

0

20

40

60

80

100

O3 (

ppb)

0

20

40

60

80

100

1-h

r P

M2.5

(ug/m

3)

0

20

40

60

80

100

24-h

r P

M2.5

(ug/m

3)

0

20

40

60

80

100

PM

10

0

300

600

900

1200

1500

TN

MO

C (

ppbC

)

12/1

12/1

12/2

12/2

12/3

12/3

12/4

12/4

12/5

12/5

12/6

12/6

12/7

12/7

12/8

12/8

12/9

12/9

12/1

012/1

0

12/1

112/1

1

12/1

212/1

2

12/1

312/1

3

12/1

412/1

4

12/1

512/1

5

12/1

612/1

6

12/1

712/1

7

12/1

812/1

8

12/1

912/1

9

12/2

012/2

0

12/2

112/2

1

12/2

212/2

2

12/2

312/2

3

12/2

412/2

4

12/2

512/2

5

12/2

612/2

6

12/2

712/2

7

12/2

812/2

8

12/2

912/2

9

12/3

012/3

0

12/3

112/3

1

Date

Garfield County, CO

Carbondale Site

December 2012

Garfield County 2012 Air Quality Monitoring Summary A-59

APPENDIX B

Garfield County

2012 SNMOC Concentrations

Garfield County 2012 Air Quality Monitoring Summary B-1

Table B-1 Garfield County SNMOC Monitoring

Parachute (PACO)1/5/2012-12/11/2012 (every sixth day)

Detected Compound (CAS Number)

Concentration (ppbV)

Minimum Maximum Average*

Sample Count

# Detects# Samples

0.01 0.06 0.01251,2,3-Trimethylbenzene (526-73-8) 470.02 0.28 0.08471,2,4-Trimethylbenzene (95-63-6) 470.01 0.10 0.03371,3,5-Trimethylbenzene (108-67-8) 470.02 0.13 0.04331,3-Butadiene (106-99-0) 470.01 0.10 0.0271-Dodecene (112-41-4) 470.04 0.34 0.09301-Heptene (592-76-7) 470.01 0.07 0.03131-Hexene (592-41-6) 470.01 0.05 0.02201-Nonene (124-11-8) 470.02 0.08 0.03261-Octene (111-66-0) 470.02 0.15 0.04401-Pentene (109-67-1) 470.01 0.01 0.0111-Tridecene (2437-56-1) 470.01 0.02 0.0121-Undecene (821-95-4) 470.02 0.04 0.02122,2,3-Trimethylpentane (564-02-3) 470.01 0.12 0.0172,2,4-Trimethylpentane (540-84-1) 470.02 0.33 0.11452,2-Dimethylbutane (75-83-2) 470.01 0.04 0.02272,3,4-Trimethylpentane (565-75-3) 470.04 0.36 0.13352,3-Dimethylbutane (79-29-8) 470.02 0.22 0.08462,3-Dimethylpentane (565-59-3) 470.01 0.17 0.06452,4-Dimethylpentane (108-08-7) 470.77 0.77 0.0412-Ethyl-1-butene (760-21-4) 470.02 0.14 0.04222-Methyl-1-butene (563-46-2) 470.02 0.18 0.04242-Methyl-2-butene (513-35-9) 470.01 0.33 0.10472-Methylheptane (592-27-8) 470.08 0.67 0.27472-Methylhexane (591-76-4) 470.18 2.58 0.85472-Methylpentane (107-83-5) 470.03 0.09 0.0333-Methyl-1-butene (563-45-1) 470.02 0.25 0.08473-Methylheptane (589-81-1) 470.05 0.66 0.24453-Methylhexane (589-34-4) 470.09 1.46 0.46473-Methylpentane (96-14-0) 470.09 1.48 0.4947Acetylene (74-86-2) 470.02 0.03 0.012a-Pinene (80-56-8) 470.14 0.93 0.3945Benzene (71-43-2) 470.02 0.26 0.0420b-Pinene (127-91-3) 470.02 0.54 0.0632cis-2-Butene (590-18-1) 470.01 0.01 0.031cis-2-Hexene (7688-21-3) 470.02 0.06 0.0214cis-2-Pentene (627-20-3) 470.13 1.92 0.5847Cyclohexane (110-82-7) 470.04 0.38 0.1347Cyclopentane (287-92-3) 470.02 0.25 0.035Cyclopentene (142-29-0) 476.10 138.00 41.9547Ethane (74-84-0) 470.01 0.10 0.0445Ethylbenzene (100-41-4) 470.51 6.70 1.5247Ethylene (74-85-1) 47

*Samples reported as non-detects (ND) were included in averages as 1/2 minimum detection limits.

Garfield County 2012 Air Quality Monitoring Summary B-2

Table B-1 (continued)Garfield County SNMOC Monitoring

Parachute (PACO)1/5/2012-12/11/2012 (every sixth day)

Detected Compound (CAS Number)

Concentration (ppbV)

Minimum Maximum Average*

Sample Count

# Detects# Samples

0.55 14.15 4.0547Isobutane (75-28-5) 471.12 1.30 0.072Isobutene/1-Butene (115-11-7 / 106-98-9) 470.53 7.98 2.1028Isopentane (78-78-4) 470.02 0.41 0.1131Isoprene (78-79-5) 470.01 0.03 0.0112Isopropylbenzene (98-82-8) 470.01 0.58 0.0316m-Diethylbenzene (141-93-5) 470.23 3.30 1.0447Methylcyclohexane (108-87-2) 470.10 1.61 0.5047Methylcyclopentane (96-37-7) 470.01 0.25 0.0644m-Ethyltoluene (620-14-4) 470.07 0.82 0.2647m-Xylene/p-Xylene (108-38-3 / 106-42-3) 470.86 14.52 4.2347n-Butane (106-97-8) 470.02 0.24 0.0747n-Decane (124-18-5) 470.01 0.06 0.0343n-Dodecane (112-40-3) 470.09 1.22 0.4147n-Heptane (142-82-5) 470.18 2.85 0.8747n-Hexane (110-54-3) 470.03 0.38 0.1147n-Nonane (111-84-2) 470.07 0.84 0.2646n-Octane (111-65-9) 470.37 5.90 1.8447n-Pentane (109-66-0) 470.01 0.08 0.0226n-Propylbenzene (103-65-1) 470.00 0.02 0.0120n-Tridecane (629-50-5) 470.01 0.13 0.0446n-Undecane (1120-21-4) 470.01 0.06 0.0227o-Ethyltoluene (611-14-3) 470.02 0.14 0.0647o-Xylene (95-47-6) 470.01 0.04 0.016p-Diethylbenzene (105-05-5) 470.01 0.15 0.0439p-Ethyltoluene (622-96-8) 472.71 51.33 15.4347Propane (74-98-6) 470.14 2.19 0.4047Propylene (115-07-1) 470.16 2.76 0.3615Styrene (100-42-5) 470.20 4.24 1.0947Toluene (108-88-3) 470.02 0.60 0.0733trans-2-Butene (624-64-6) 470.01 0.12 0.0329trans-2-Pentene (646-04-8) 47

*Samples reported as non-detects (ND) were included in averages as 1/2 minimum detection limits.

Garfield County 2012 Air Quality Monitoring Summary B-3

Table B-2 Garfield County SNMOC Monitoring

Rifle (RICO)1/5/2012-12/29/2012 (every sixth day)

Detected Compound (CAS Number)

Concentration (ppbV)

Minimum Maximum Average*

Sample Count

# Detects# Samples

0.01 0.11 0.02361,2,3-Trimethylbenzene (526-73-8) 600.03 0.43 0.10601,2,4-Trimethylbenzene (95-63-6) 600.01 0.10 0.03531,3,5-Trimethylbenzene (108-67-8) 600.02 0.26 0.08561,3-Butadiene (106-99-0) 600.01 0.25 0.02111-Dodecene (112-41-4) 600.03 0.34 0.06361-Heptene (592-76-7) 600.02 0.07 0.03211-Hexene (592-41-6) 600.01 0.42 0.02181-Nonene (124-11-8) 600.01 0.07 0.02341-Octene (111-66-0) 600.02 0.18 0.07591-Pentene (109-67-1) 600.01 0.01 0.0111-Tridecene (2437-56-1) 600.01 0.03 0.0131-Undecene (821-95-4) 600.01 0.05 0.02272,2,3-Trimethylpentane (564-02-3) 600.01 0.69 0.04422,2,4-Trimethylpentane (540-84-1) 600.03 0.30 0.10602,2-Dimethylbutane (75-83-2) 600.01 0.09 0.03522,3,4-Trimethylpentane (565-75-3) 600.05 0.40 0.14482,3-Dimethylbutane (79-29-8) 600.03 0.26 0.09602,3-Dimethylpentane (565-59-3) 600.02 0.18 0.06602,4-Dimethylpentane (108-08-7) 600.03 0.28 0.07512-Methyl-1-butene (563-46-2) 600.01 0.01 0.0312-Methyl-1-pentene (763-29-1) 600.03 0.35 0.08542-Methyl-2-butene (513-35-9) 600.02 0.26 0.07602-Methylheptane (592-27-8) 600.08 0.70 0.25592-Methylhexane (591-76-4) 600.26 2.92 0.89602-Methylpentane (107-83-5) 600.03 0.16 0.0353-Methyl-1-butene (563-45-1) 600.02 0.19 0.06603-Methylheptane (589-81-1) 600.06 0.71 0.22593-Methylhexane (589-34-4) 600.14 1.58 0.47603-Methylpentane (96-14-0) 600.02 0.02 0.0354-Methyl-1-pentene (691-37-2) 600.31 3.30 1.0260Acetylene (74-86-2) 600.01 0.05 0.0114a-Pinene (80-56-8) 600.12 0.96 0.3160Benzene (71-43-2) 600.02 0.44 0.0323b-Pinene (127-91-3) 600.03 0.63 0.1057cis-2-Butene (590-18-1) 600.01 0.01 0.031cis-2-Hexene (7688-21-3) 600.02 0.15 0.0348cis-2-Pentene (627-20-3) 600.13 1.72 0.4860Cyclohexane (110-82-7) 600.05 0.43 0.1460Cyclopentane (287-92-3) 600.02 0.09 0.035Cyclopentene (142-29-0) 605.75 113.00 28.4760Ethane (74-84-0) 600.02 0.16 0.0660Ethylbenzene (100-41-4) 60

*Samples reported as non-detects (ND) were included in averages as 1/2 minimum detection limits.

Garfield County 2012 Air Quality Monitoring Summary B-4

Table B-2 (continued)Garfield County SNMOC Monitoring

Rifle (RICO)1/5/2012-12/29/2012 (every sixth day)

Detected Compound (CAS Number)

Concentration (ppbV)

Minimum Maximum Average*

Sample Count

# Detects# Samples

0.73 6.30 2.0460Ethylene (74-85-1) 600.92 15.30 3.8960Isobutane (75-28-5) 600.82 1.38 0.062Isobutene/1-Butene (115-11-7 / 106-98-9) 600.73 10.74 2.3537Isopentane (78-78-4) 600.02 0.58 0.1153Isoprene (78-79-5) 600.01 0.02 0.0122Isopropylbenzene (98-82-8) 600.01 0.69 0.0420m-Diethylbenzene (141-93-5) 600.18 2.57 0.6760Methylcyclohexane (108-87-2) 600.14 1.53 0.4460Methylcyclopentane (96-37-7) 600.01 0.22 0.0760m-Ethyltoluene (620-14-4) 600.08 0.77 0.2560m-Xylene/p-Xylene (108-38-3 / 106-42-3) 601.30 17.40 4.6260n-Butane (106-97-8) 600.01 0.13 0.0560n-Decane (124-18-5) 600.00 0.08 0.0255n-Dodecane (112-40-3) 600.10 1.17 0.3260n-Heptane (142-82-5) 600.23 3.17 0.8760n-Hexane (110-54-3) 600.02 0.19 0.0660n-Nonane (111-84-2) 600.05 0.56 0.1660n-Octane (111-65-9) 600.59 6.98 2.0560n-Pentane (109-66-0) 600.01 0.11 0.0245n-Propylbenzene (103-65-1) 600.00 0.03 0.0111n-Tridecane (629-50-5) 600.01 0.06 0.0258n-Undecane (1120-21-4) 600.01 0.06 0.0241o-Ethyltoluene (611-14-3) 600.03 0.20 0.0860o-Xylene (95-47-6) 600.01 0.02 0.019p-Diethylbenzene (105-05-5) 600.01 0.13 0.0457p-Ethyltoluene (622-96-8) 602.56 51.00 12.7960Propane (74-98-6) 600.15 1.48 0.5760Propylene (115-07-1) 600.02 1.66 0.1620Styrene (100-42-5) 600.18 1.63 0.5760Toluene (108-88-3) 600.03 0.67 0.1257trans-2-Butene (624-64-6) 600.01 0.03 0.035trans-2-Hexene (4050-45-7) 600.02 0.28 0.0756trans-2-Pentene (646-04-8) 60

*Samples reported as non-detects (ND) were included in averages as 1/2 minimum detection limits.

Garfield County 2012 Air Quality Monitoring Summary B-5

Table B-3Garfield County SNMOC Monitoring

Bell-Melton (BRCO)1/5/2012-12/29/2012 (every sixth day)

Detected Compound (CAS Number)

Concentration (ppbV)

Minimum Maximum Average*

Sample Count

# Detects# Samples

0.01 0.03 0.01131,2,3-Trimethylbenzene (526-73-8) 580.01 0.19 0.04541,2,4-Trimethylbenzene (95-63-6) 580.01 0.07 0.01271,3,5-Trimethylbenzene (108-67-8) 580.01 0.12 0.04231,3-Butadiene (106-99-0) 580.02 0.04 0.0251-Dodecene (112-41-4) 580.02 0.26 0.06351-Heptene (592-76-7) 580.02 0.06 0.03131-Hexene (592-41-6) 580.01 0.05 0.02181-Nonene (124-11-8) 580.01 0.12 0.03321-Octene (111-66-0) 580.02 0.12 0.04391-Pentene (109-67-1) 580.01 0.03 0.0141-Undecene (821-95-4) 580.01 0.03 0.0172,2,3-Trimethylpentane (564-02-3) 580.01 0.06 0.0162,2,4-Trimethylpentane (540-84-1) 580.02 0.26 0.09572,2-Dimethylbutane (75-83-2) 580.01 0.05 0.01212,3,4-Trimethylpentane (565-75-3) 580.02 0.48 0.13462,3-Dimethylbutane (79-29-8) 580.02 0.19 0.07572,3-Dimethylpentane (565-59-3) 580.02 0.14 0.05552,4-Dimethylpentane (108-08-7) 580.02 0.08 0.0392-Methyl-1-butene (563-46-2) 580.01 0.13 0.03132-Methyl-2-butene (513-35-9) 580.01 0.16 0.07552-Methylheptane (592-27-8) 580.04 0.54 0.21582-Methylhexane (591-76-4) 580.12 2.80 0.84582-Methylpentane (107-83-5) 580.02 0.23 0.0323-Methyl-1-butene (563-45-1) 580.01 0.11 0.04553-Methylheptane (589-81-1) 580.05 0.54 0.18543-Methylhexane (589-34-4) 580.05 1.48 0.43583-Methylpentane (96-14-0) 580.02 0.02 0.0344-Methyl-1-pentene (691-37-2) 580.08 2.58 0.4958Acetylene (74-86-2) 580.01 0.06 0.0213a-Pinene (80-56-8) 580.05 0.47 0.2157Benzene (71-43-2) 580.01 0.40 0.0321b-Pinene (127-91-3) 580.02 0.30 0.0319cis-2-Butene (590-18-1) 580.02 0.07 0.029cis-2-Pentene (627-20-3) 580.06 1.64 0.5258Cyclohexane (110-82-7) 580.05 0.41 0.1357Cyclopentane (287-92-3) 580.02 0.05 0.032Cyclopentene (142-29-0) 584.42 101.00 35.2858Ethane (74-84-0) 580.01 0.09 0.0245Ethylbenzene (100-41-4) 580.35 3.48 1.0158Ethylene (74-85-1) 580.50 14.02 4.4958Isobutane (75-28-5) 581.27 1.27 0.041Isobutene/1-Butene (115-11-7 / 106-98-9) 58

*Samples reported as non-detects (ND) were included in averages as 1/2 minimum detection limits.

Garfield County 2012 Air Quality Monitoring Summary B-6

Table B-3 (continued)Garfield County SNMOC Monitoring

Bell-Melton (BRCO)1/5/2012-12/29/2012 (every sixth day)

Detected Compound (CAS Number)

Concentration (ppbV)

Minimum Maximum Average*

Sample Count

# Detects# Samples

0.80 8.34 2.1739Isopentane (78-78-4) 580.03 0.45 0.0728Isoprene (78-79-5) 580.01 0.02 0.0111Isopropylbenzene (98-82-8) 580.01 0.12 0.0219m-Diethylbenzene (141-93-5) 580.11 2.30 0.7958Methylcyclohexane (108-87-2) 580.06 1.40 0.4358Methylcyclopentane (96-37-7) 580.01 0.15 0.0344m-Ethyltoluene (620-14-4) 580.03 0.36 0.1158m-Xylene/p-Xylene (108-38-3 / 106-42-3) 580.57 15.90 5.0557n-Butane (106-97-8) 580.01 0.11 0.0355n-Decane (124-18-5) 580.01 0.04 0.0238n-Dodecane (112-40-3) 580.05 1.06 0.3458n-Heptane (142-82-5) 580.13 3.28 0.9458n-Hexane (110-54-3) 580.01 0.13 0.0558n-Nonane (111-84-2) 580.03 0.43 0.1658n-Octane (111-65-9) 580.26 6.94 2.1258n-Pentane (109-66-0) 580.01 0.07 0.0125n-Propylbenzene (103-65-1) 580.00 0.02 0.015n-Tridecane (629-50-5) 580.01 0.04 0.0243n-Undecane (1120-21-4) 580.01 0.06 0.0122o-Ethyltoluene (611-14-3) 580.01 0.11 0.0353o-Xylene (95-47-6) 580.01 0.02 0.0110p-Diethylbenzene (105-05-5) 580.01 0.10 0.0240p-Ethyltoluene (622-96-8) 581.92 49.67 16.5158Propane (74-98-6) 580.10 0.94 0.2258Propylene (115-07-1) 580.02 2.56 0.2122Styrene (100-42-5) 580.09 1.04 0.3758Toluene (108-88-3) 580.02 0.33 0.0313trans-2-Butene (624-64-6) 580.02 0.11 0.0224trans-2-Pentene (646-04-8) 58

*Samples reported as non-detects (ND) were included in averages as 1/2 minimum detection limits.

Garfield County 2012 Air Quality Monitoring Summary B-7

Table B-4Garfield County SNMOC Monitoring

Battlement Mesa (BMCO)1/5/2012-12/29/2012 (every sixth day)

Detected Compound (CAS Number)

Concentration (ppbV)

Minimum Maximum Average*

Sample Count

# Detects# Samples

0.01 0.06 0.02261,2,3-Trimethylbenzene (526-73-8) 530.01 0.20 0.07531,2,4-Trimethylbenzene (95-63-6) 530.02 0.06 0.03461,3,5-Trimethylbenzene (108-67-8) 530.02 0.20 0.05281,3-Butadiene (106-99-0) 530.01 0.12 0.02101-Dodecene (112-41-4) 530.01 0.22 0.07361-Heptene (592-76-7) 530.01 0.07 0.03111-Hexene (592-41-6) 530.01 0.02 0.01101-Nonene (124-11-8) 530.01 0.06 0.03311-Octene (111-66-0) 530.02 0.23 0.06471-Pentene (109-67-1) 530.01 0.01 0.0111-Undecene (821-95-4) 530.01 0.05 0.02232,2,3-Trimethylpentane (564-02-3) 530.01 0.08 0.02152,2,4-Trimethylpentane (540-84-1) 530.03 0.22 0.10512,2-Dimethylbutane (75-83-2) 530.01 0.04 0.02392,3,4-Trimethylpentane (565-75-3) 530.02 0.40 0.14422,3-Dimethylbutane (79-29-8) 530.02 0.15 0.08532,3-Dimethylpentane (565-59-3) 530.02 0.11 0.06512,4-Dimethylpentane (108-08-7) 530.02 0.21 0.05342-Methyl-1-butene (563-46-2) 530.03 0.28 0.06392-Methyl-2-butene (513-35-9) 530.01 0.18 0.09522-Methylheptane (592-27-8) 530.07 0.57 0.25532-Methylhexane (591-76-4) 530.13 1.77 0.79532-Methylpentane (107-83-5) 530.03 0.10 0.0333-Methyl-1-butene (563-45-1) 530.01 0.15 0.07523-Methylheptane (589-81-1) 530.03 0.47 0.22523-Methylhexane (589-34-4) 530.06 0.96 0.43533-Methylpentane (96-14-0) 530.02 0.02 0.0354-Methyl-1-pentene (691-37-2) 530.10 6.50 0.6053Acetylene (74-86-2) 530.01 0.03 0.017a-Pinene (80-56-8) 530.08 0.74 0.3453Benzene (71-43-2) 530.01 0.23 0.0420b-Pinene (127-91-3) 530.02 0.61 0.0646cis-2-Butene (590-18-1) 530.01 0.12 0.0326cis-2-Pentene (627-20-3) 530.04 1.28 0.5253Cyclohexane (110-82-7) 530.05 0.28 0.1351Cyclopentane (287-92-3) 530.03 0.08 0.035Cyclopentene (142-29-0) 531.98 94.50 31.5453Ethane (74-84-0) 530.01 0.09 0.0453Ethylbenzene (100-41-4) 530.46 2.67 1.0453Ethylene (74-85-1) 530.13 9.70 3.1553Isobutane (75-28-5) 530.66 1.12 0.052Isobutene/1-Butene (115-11-7 / 106-98-9) 53

*Samples reported as non-detects (ND) were included in averages as 1/2 minimum detection limits.

Garfield County 2012 Air Quality Monitoring Summary B-8

Table B-4 (continued)Garfield County SNMOC Monitoring

Battlement Mesa (BMCO)1/5/2012-12/29/2012 (every sixth day)

Detected Compound (CAS Number)

Concentration (ppbV)

Minimum Maximum Average*

Sample Count

# Detects# Samples

0.53 8.12 2.0735Isopentane (78-78-4) 530.02 0.64 0.0830Isoprene (78-79-5) 530.01 0.02 0.0110Isopropylbenzene (98-82-8) 530.01 0.10 0.0222m-Diethylbenzene (141-93-5) 530.15 2.14 0.8951Methylcyclohexane (108-87-2) 530.05 1.06 0.4653Methylcyclopentane (96-37-7) 530.01 0.17 0.0551m-Ethyltoluene (620-14-4) 530.07 0.43 0.2453m-Xylene/p-Xylene (108-38-3 / 106-42-3) 530.31 10.42 3.7853n-Butane (106-97-8) 530.01 0.12 0.0653n-Decane (124-18-5) 530.01 0.05 0.0249n-Dodecane (112-40-3) 530.03 0.84 0.3653n-Heptane (142-82-5) 530.07 1.95 0.8253n-Hexane (110-54-3) 530.01 0.19 0.0853n-Nonane (111-84-2) 530.02 0.50 0.2253n-Octane (111-65-9) 530.18 10.36 1.8953n-Pentane (109-66-0) 530.01 0.06 0.0232n-Propylbenzene (103-65-1) 530.01 0.01 0.0113n-Tridecane (629-50-5) 530.01 0.07 0.0351n-Undecane (1120-21-4) 530.01 0.06 0.0239o-Ethyltoluene (611-14-3) 530.02 0.11 0.0653o-Xylene (95-47-6) 530.01 0.02 0.017p-Diethylbenzene (105-05-5) 530.01 0.11 0.0346p-Ethyltoluene (622-96-8) 531.40 36.33 11.6553Propane (74-98-6) 530.12 0.84 0.2653Propylene (115-07-1) 530.05 3.09 0.3618Styrene (100-42-5) 530.16 5.20 1.0853Toluene (108-88-3) 530.02 0.68 0.0746trans-2-Butene (624-64-6) 530.01 0.02 0.033trans-2-Hexene (4050-45-7) 530.02 0.23 0.0442trans-2-Pentene (646-04-8) 53

*Samples reported as non-detects (ND) were included in averages as 1/2 minimum detection limits.

Garfield County 2012 Air Quality Monitoring Summary B-9

Table B-5Garfield County SNMOC Monitoring

Carbondale (RFCO)6/9/2012-12/17/2012 (every sixth day)

Detected Compound (CAS Number)

Concentration (ppbV)

Minimum Maximum Average*

Sample Count

# Detects# Samples

0.01 0.05 0.02121,2,3-Trimethylbenzene (526-73-8) 170.02 0.16 0.07171,2,4-Trimethylbenzene (95-63-6) 170.01 0.04 0.02101,3,5-Trimethylbenzene (108-67-8) 170.03 0.14 0.06121,3-Butadiene (106-99-0) 170.13 0.13 0.0211-Dodecene (112-41-4) 170.01 0.18 0.0251-Heptene (592-76-7) 170.03 0.05 0.0331-Hexene (592-41-6) 170.01 0.04 0.02101-Nonene (124-11-8) 170.01 0.06 0.02141-Octene (111-66-0) 170.02 0.14 0.07151-Pentene (109-67-1) 170.01 0.03 0.0122,2,3-Trimethylpentane (564-02-3) 170.01 0.04 0.02122,2,4-Trimethylpentane (540-84-1) 170.02 0.11 0.0362,2-Dimethylbutane (75-83-2) 170.01 0.03 0.0192,3,4-Trimethylpentane (565-75-3) 170.02 0.26 0.05162,3-Dimethylbutane (79-29-8) 170.02 0.11 0.04162,3-Dimethylpentane (565-59-3) 170.01 0.08 0.0272,4-Dimethylpentane (108-08-7) 170.02 0.07 0.0482-Methyl-1-butene (563-46-2) 170.04 0.08 0.05152-Methyl-2-butene (513-35-9) 170.01 0.14 0.0242-Methylheptane (592-27-8) 170.05 0.57 0.11172-Methylhexane (591-76-4) 170.10 1.36 0.24172-Methylpentane (107-83-5) 170.01 0.07 0.02103-Methylheptane (589-81-1) 170.04 0.28 0.0573-Methylhexane (589-34-4) 170.04 0.69 0.12173-Methylpentane (96-14-0) 170.01 0.02 0.0324-Methyl-1-pentene (691-37-2) 170.13 1.01 0.4417Acetylene (74-86-2) 170.02 0.19 0.0614a-Pinene (80-56-8) 170.06 0.34 0.1416Benzene (71-43-2) 170.06 0.07 0.022b-Pinene (127-91-3) 170.02 0.19 0.0613cis-2-Butene (590-18-1) 170.02 0.04 0.026cis-2-Pentene (627-20-3) 170.03 0.82 0.1017Cyclohexane (110-82-7) 170.04 0.18 0.047Cyclopentane (287-92-3) 171.37 37.05 6.3217Ethane (74-84-0) 170.01 0.04 0.0215Ethylbenzene (100-41-4) 170.56 2.12 1.0717Ethylene (74-85-1) 170.15 5.70 0.8517Isobutane (75-28-5) 171.12 1.12 0.081Isobutene/1-Butene (115-11-7 / 106-98-9) 170.34 6.90 0.656Isopentane (78-78-4) 170.02 0.98 0.2717Isoprene (78-79-5) 170.01 0.02 0.013Isopropylbenzene (98-82-8) 17

*Samples reported as non-detects (ND) were included in averages as 1/2 minimum detection limits.

Garfield County 2012 Air Quality Monitoring Summary B-10

Table B-5 (continued)Garfield County SNMOC Monitoring

Carbondale (RFCO)6/9/2012-12/17/2012 (every sixth day)

Detected Compound (CAS Number)

Concentration (ppbV)

Minimum Maximum Average*

Sample Count

# Detects# Samples

0.01 0.07 0.029m-Diethylbenzene (141-93-5) 170.03 1.26 0.1215Methylcyclohexane (108-87-2) 170.04 0.71 0.1116Methylcyclopentane (96-37-7) 170.02 0.16 0.0717m-Ethyltoluene (620-14-4) 170.03 0.14 0.0717m-Xylene/p-Xylene (108-38-3 / 106-42-3) 170.28 6.85 1.1917n-Butane (106-97-8) 170.02 0.15 0.0517n-Decane (124-18-5) 170.01 0.09 0.0315n-Dodecane (112-40-3) 170.03 0.58 0.0817n-Heptane (142-82-5) 170.09 1.62 0.2417n-Hexane (110-54-3) 170.01 0.06 0.0216n-Nonane (111-84-2) 170.02 0.30 0.0617n-Octane (111-65-9) 170.19 2.86 0.5617n-Pentane (109-66-0) 170.01 0.05 0.0213n-Propylbenzene (103-65-1) 170.00 0.08 0.024n-Tridecane (629-50-5) 170.01 0.04 0.0113n-Undecane (1120-21-4) 170.01 0.06 0.0212o-Ethyltoluene (611-14-3) 170.01 0.05 0.0317o-Xylene (95-47-6) 170.01 0.02 0.012p-Diethylbenzene (105-05-5) 170.01 0.10 0.0415p-Ethyltoluene (622-96-8) 170.93 19.47 3.4917Propane (74-98-6) 170.14 0.49 0.2817Propylene (115-07-1) 170.08 1.20 0.308Styrene (100-42-5) 170.13 4.21 1.0217Toluene (108-88-3) 170.03 0.24 0.0611trans-2-Butene (624-64-6) 170.02 0.07 0.0415trans-2-Pentene (646-04-8) 17

*Samples reported as non-detects (ND) were included in averages as 1/2 minimum detection limits.

Garfield County 2012 Air Quality Monitoring Summary B-11

APPENDIX C

Garfield County

2012 Carbonyl Concentrations

Garfield County 2012 Air Quality Monitoring Summary C-1

Table C-1Garfield County Carbonyl Monitoring

Parachute (PACO)1/5/2012-12/29/2012 (every twelfth day)

Compound (CAS Number)

Concentration (ppbV)

Minimum Maximum Average*

Sample Count

# Detects# Samples

ND ND 0.0002,5-Dimethylbenzaldehyde (5779-94-2) 27

0.01 0.69 0.29242-Butanone (78-93-3) 27

0.02 0.86 0.3827Acetaldehyde (75-07-0) 27

0.08 1.71 0.9627Acetone (67-64-1) 27

0.00 0.04 0.0226Benzaldehyde (100-52-7) 27

0.01 0.06 0.0225Butyraldehyde (123-72-8) 27

0.01 0.12 0.0223Crotonaldehyde (123-73-9) 27

0.03 1.88 0.9827Formaldehyde (50-00-0) 27

0.00 0.03 0.0125Hexaldehyde (66-25-1) 27

ND ND 0.000Isovaleraldehyde (590-86-3) 27

0.00 0.06 0.0326Propionaldehyde (123-38-6) 27

0.01 0.05 0.0220Tolualdehydes (NA) 27

0.00 0.03 0.0121Valeraldehyde (110-62-3) 27

*Samples reported as non-detects (ND) are included in averages as 1/2 minimum detection limits.

Garfield County 2012 Air Quality Monitoring Summary C-2

Table C-2Garfield County Carbonyl Monitoring

Rifle (RICO)1/5/2012-12/29/2012 (every twelfth day)

Compound (CAS Number)

Concentration (ppbV)

Minimum Maximum Average*

Sample Count

# Detects# Samples

ND ND 0.0002,5-Dimethylbenzaldehyde (5779-94-2) 28

0.06 0.68 0.33252-Butanone (78-93-3) 28

0.06 1.31 0.5828Acetaldehyde (75-07-0) 28

0.25 2.25 1.1028Acetone (67-64-1) 28

0.01 0.06 0.0328Benzaldehyde (100-52-7) 28

0.01 0.11 0.0325Butyraldehyde (123-72-8) 28

0.01 0.14 0.0425Crotonaldehyde (123-73-9) 28

0.08 2.28 1.1328Formaldehyde (50-00-0) 28

0.00 0.04 0.0228Hexaldehyde (66-25-1) 28

0.01 0.01 0.001Isovaleraldehyde (590-86-3) 28

0.01 0.11 0.0427Propionaldehyde (123-38-6) 28

0.01 0.08 0.0324Tolualdehydes (NA) 28

0.00 0.06 0.0226Valeraldehyde (110-62-3) 28

*Samples reported as non-detects (ND) are included in averages as 1/2 minimum detection limits.

Garfield County 2012 Air Quality Monitoring Summary C-3

Table C-3Garfield County Carbonyl Monitoring

Bell-Melton (BRCO)1/5/2012-12/29/2012 (every twelfth day)

Compound (CAS Number)

Concentration (ppbV)

Minimum Maximum Average*

Sample Count

# Detects# Samples

ND ND 0.0002,5-Dimethylbenzaldehyde (5779-94-2) 28

0.04 0.57 0.26262-Butanone (78-93-3) 28

0.09 0.90 0.3428Acetaldehyde (75-07-0) 28

0.26 1.80 0.9628Acetone (67-64-1) 28

0.00 0.05 0.0227Benzaldehyde (100-52-7) 28

0.01 0.04 0.0227Butyraldehyde (123-72-8) 28

0.00 0.18 0.0325Crotonaldehyde (123-73-9) 28

0.22 2.53 0.8328Formaldehyde (50-00-0) 28

0.00 0.03 0.0127Hexaldehyde (66-25-1) 28

ND ND 0.000Isovaleraldehyde (590-86-3) 28

0.01 0.07 0.0327Propionaldehyde (123-38-6) 28

0.01 0.04 0.0121Tolualdehydes (NA) 28

0.00 0.02 0.0124Valeraldehyde (110-62-3) 28

*Samples reported as non-detects (ND) are included in averages as 1/2 minimum detection limits.

Garfield County 2012 Air Quality Monitoring Summary C-4

Table C-4Garfield County Carbonyl Monitoring

Battlement Mesa (BMCO)1/5/2012-12/29/2012 (every twelfth day)

Compound (CAS Number)

Concentration (ppbV)

Minimum Maximum Average*

Sample Count

# Detects# Samples

ND ND 0.0002,5-Dimethylbenzaldehyde (5779-94-2) 27

0.01 0.74 0.25242-Butanone (78-93-3) 27

0.02 0.78 0.3027Acetaldehyde (75-07-0) 27

0.08 3.85 1.2027Acetone (67-64-1) 27

0.00 0.12 0.0323Benzaldehyde (100-52-7) 27

0.01 0.04 0.0223Butyraldehyde (123-72-8) 27

0.00 0.13 0.0221Crotonaldehyde (123-73-9) 27

0.02 1.47 0.7127Formaldehyde (50-00-0) 27

0.00 0.06 0.0223Hexaldehyde (66-25-1) 27

ND ND 0.000Isovaleraldehyde (590-86-3) 27

0.00 0.06 0.0324Propionaldehyde (123-38-6) 27

0.01 0.05 0.0219Tolualdehydes (NA) 27

0.00 0.03 0.0121Valeraldehyde (110-62-3) 27

*Samples reported as non-detects (ND) are included in averages as 1/2 minimum detection limits.

Garfield County 2012 Air Quality Monitoring Summary C-5

Table C-5Garfield County Carbonyl Monitoring

Carbondale (RFCO)6/20/2012-12/17/2012 (every twelfth day)

Compound (CAS Number)

Concentration (ppbV)

Minimum Maximum Average*

Sample Count

# Detects# Samples

ND ND 0.0002,5-Dimethylbenzaldehyde (5779-94-2) 16

0.06 0.58 0.21122-Butanone (78-93-3) 16

0.02 1.35 0.3116Acetaldehyde (75-07-0) 16

0.04 1.49 0.7016Acetone (67-64-1) 16

0.01 0.06 0.0213Benzaldehyde (100-52-7) 16

0.00 0.06 0.0210Butyraldehyde (123-72-8) 16

0.01 0.39 0.0510Crotonaldehyde (123-73-9) 16

0.02 2.57 0.6716Formaldehyde (50-00-0) 16

0.00 0.05 0.0215Hexaldehyde (66-25-1) 16

ND ND 0.000Isovaleraldehyde (590-86-3) 16

0.01 0.10 0.0315Propionaldehyde (123-38-6) 16

0.01 0.09 0.0210Tolualdehydes (NA) 16

0.00 0.03 0.0111Valeraldehyde (110-62-3) 16

*Samples reported as non-detects (ND) are included in averages as 1/2 minimum detection limits.

Garfield County 2012 Air Quality Monitoring Summary C-6

EPAC Rebuttal Exhibit 2: Garfield County Air Monitoring Program Design Details Continuing into 2013, the monitoring network in Garfield County consisted of five monitoring locations. Since 208 the County has invested > $1,000,000 plus 1.5 fulltime staff (FTE) for air quality monitoring and air quality management and improvement programs. Annual program O&M exceeds $250,000 per year plus 1.5 FTE. The scientific data produced by this program was omitted from the Division’s analysis as they developed a proposal for statewide rules. • Parachute (PACO): Parachute is a small urban center of approximately 1,300 people within very close

proximity to oil and development and production activities. The town is located along Interstate 70 and is the transportation hub for heavily traveled roads which service the surrounding canyons. This site is bounded by extensive oil and gas development to the North, South, East and West.

• Rifle (RICO): Rifle is a rapidly growing urban center on the Interstate 70 corridor with estimated population of about 9,200 people. Rifle is in close proximity to oil and gas development activities, and is also central to industrial support for the oil and gas industry. The site is downwind of extensive oil and gas development and infrastructure to the South, East and West.

• Bell-Melton (BRCO): The Bell-Melton site is a rural homestead approximately four miles south of the town of Silt, in close proximity to moderate oil and gas development and heavy natural gas production to the North, South, East and West.

• Battlement Mesa (BMCO): Battlement Mesa is a residential community located about 1.5 miles southeast of Parachute. This site began operation in September 2010 in response to a proposed large natural gas development within to community, and to begin developing baseline data in advance of the project. The site originally monitored VOC and meteorological parameters, and in November 2012, the site was augmented with a mobile air quality monitoring station, which added the collection of continuous gaseous (NOx and ozone) and particulate measurements to existing VOC measurements. The site is bounded by significant oil and gas activity to the South, East and West.

• Carbondale (RFCO): Carbondale is a rural and urban community located about 12.5 miles southeast of Glenwood Spring at the confluence of the Roaring Fork and Crystal River valleys. The Carbondale, or Roaring Fork, monitor began monitoring in March 2012 to characterize air quality in the area and also to gather data downwind of the Colorado valley sites.

Figure 1 is a map of the monitoring sites and Table 1 lists the parameters monitored. Real-time data,

including camera images, are displayed on the Garfield County Air Quality Monitoring website (http://www.garfieldcountyaq.net).

Figure 1. Map of Garfield County Monitoring Sites.

kwynn
Highlight

Table 1: Garfield County Parameters Monitored by Site Component Period EPA Method Sampling Frequency

Rifle, Colorado (RICO) SNMOCs1 2008-current TO-12 24-hour (~60 samples/year, one every 6th day) Carbonyls2 2008-current TO-11A 24-hour (~30 samples/year, one every 12th day) PM10 2008-current FRM 24-hour (~120 samples/year, one every 3rd day) PM10 2008-current TEOM Hourly PM2.5 2008-current TEOM Hourly Ozone 2008-current 42C Hourly Meteorology 2008-current Various Hourly Visibility Web Camera 2008-current Digital 15-min

Parachute, Colorado (PACO) SNMOCs1 2008-current TO-12 24-hour (~60 samples/year, one every 6th day) Carbonyls2 2008-current TO-11A 24-hour (~30 samples/year, one every 12th day) PM10 2008-current FRM 24-hour (~120 samples/year, one every 3rd day) Meteorology 2008-current Various Hourly

Bell-Melton, Colorado (BRCO)

SNMOCs1 2008-current TO-12 24-hour (~60 samples/year, one every 6th day) Carbonyls2 2008-current TO-11A 24-hour (~30 samples/year, one every 12th day) Meteorology 2008-current Various Hourly

Battlement Mesa, Colorado (BMCO) SNMOCs1 9/2011-current TO-12 24-hour (~60 samples/year, one every 6th day) Carbonyls2 9/2011-current TO-11A 24-hour (~30 samples/year, one every 12th day) PM10 11/2012-current BAM Hourly PM2.5 11/2012-current BAM Hourly Ozone 11/2012-current API Hourly NO/NO2/NOX 11/2012-current API Hourly Methane/Non-Methane VOCs 11/2012-current Baseline

MOCON Hourly

Meteorology 11/2012-current Various Hourly Carbondale, Colorado (RFCO)

SNMOCs1 6/2012-current TO-12 24-hour (~60 samples/year, one every 6th day) Carbonyls2 6/2012-current TO-11A 24-hour (~30 samples/year, one every 12th day) PM10 6/2012-current FRM 24-hour (~120 samples/year, one every 3rd day) PM2.5 6/2012-current E-BAM Hourly Ozone 6/2012-current 2B Hourly Meteorology 6/2012-current Various Hourly

1 80 SNMOC compounds monitored using method TO-12: 1,2,3-Trimethylbenzene, 1,2,4-Trimethylbenzene, 1,3,5-Trimethylbenzene, 1,3-Butadiene, 1-Butene, 1-Decene, 1-Dodecene, 1-Heptene, 1-Hexene, 1-Nonene, 1-Octene, 1-Pentene, 1-Tridecene, 1-Undecene, 2,2,3-Trimethylpentane, 2,2,4-Trimethylpentane, 2,2-Dimethylbutane, 2,3,4-Trimethylpentane, 2,3-Dimethylbutane, 2,3-Dimethylpentane, 2,4-Dimethylpentane, 2-Ethyl-1-butene, 2-Methyl-1-butene, 2-Methyl-1-pentene, 2-Methyl-2-butene, 2-Methylheptane, 2-Methylhexane, 2-Methylpentane, 3-Methyl-1-butene, 3-Methylheptane, 3-Methylhexane, 3-Methylpentane, 4-Methyl-1-pentene, Acetylene, a-Pinene, Benzene, b-Pinene, cis-2-Butene, cis-2-Hexene, cis-2-Pentene, Cyclohexane, Cyclopentane, Cyclopentene, Ethane, Ethylbenzene, Ethylene, Isobutane, Isobutene/1-Butene, Isobutylene, Isopentane, Isoprene, Isopropylbenzene, m-Diethylbenzene, Methylcyclohexane, Methylcyclopentane, m-Ethyltoluene, m-Xylene/p-Xylene, n-Butane, n-Decane, n-Dodecane, n-Heptane, n-Hexane, n-Nonane, n-Octane, n-Pentane, n-Propylbenzene, n-Tridecane, n-Undecane, o-Ethyltoluene, o-Xylene, p-Diethylbenzene, p-Ethyltoluene, Propane, Propylene, Propyne, Styrene, Toluene, trans-2-Butene, trans-2-Hexene, trans-2-Pentene 213 Carbonyl compounds monitored using method TO-11A: 2,5-Dimethylbenzaldehyde, 2-Butanone, Acetaldehyde, Acetone, Benzaldehyde, Butyraldehyde, Crotonaldehyde, Formaldehyde, Hexaldehyde, Isovaleraldehyde, Propionaldehyde, Tolualdehydes, Valeraldehyde

TO: Kirby Wynn; GCPHD

FROM: Cassie Archuleta

SUBJECT: Garfield County Monitoring Data Summary Reports

DATE: January 29, 2014

Mr. Wynn,

This letter is in response to a request to provide a written statement documenting the source of

air quality data summaries provided by Air Resource Specialists (ARS) under contract with the

Garfield County Public Health Department (GCPHD).

Specific to this request, since 2008, ARS has provided GCPHD with annual summaries of

Volatile Organic Compounds (VOCs) measured in the area. To acquire VOC data, GCPHD

contracts separately with the Eastern Research Group (ERG) to facilitate the deployment and

analysis of canisters that collect 24-hour samples once every 6 days for several monitoring sites

in the County. For sample collection and analysis, ERG uses EPA approved methods consistent

with EPA’s larger Urban Air Toxics Monitoring Network (UATMN).

Validated VOC data are provided to ARS on a monthly basis, and aggregated annually into an

annual report. These summaries are publically available in annual reports online at

http://www.garfield-county.com/air-quality/documents.aspx. Some specific data summary

products recently provided by ARS to GCPHD are described briefly below.

Figure 1 presents an example of a VOC summary from an annual report where all speciated

compounds (80 specific compounds as per EPAs TO-12 method) are aggregated into larger

groups to show the magnitude of total speciated VOCs measured between 2008 and 2012.

Descriptions of these parameter groupings are provided in the annual reports. Figures 2 and 3

present species specific plots for individual parameters measured.

Table 1 presents trends statistics that were calculated based on annual averages of measured

Hazardous Air Pollutants (HAPs), which are a subset of the VOCs collected. Annual trends were

calculated by ARS for the years 2008-2012, with a trend defined as the slope derived using Theil

statistics, which is a nonparametric regression technique that is commonly applied to

environmental data to determine statistically significant trends, consistent with Theil statistics

1901 Sharp Point Drive Suite E Fort Collins, Colorado 80525 970-484-7941 FAX: 970-484-3423

kwynn
Typewritten Text
EPAC Rebuttal Exhibit 4

used in EPA’s National Air EPA’s National Air Quality Trends Reports

(http://www.epa.gov/airtrends/).

Please feel free to address any additional questions about this information to myself at 970/484-

7941 or [email protected].

Sincerely,

Cassie Archuleta

Project Scientist

Air Resource Specialists, Inc.

Figure 1

Figure 2

Figure 3

0

10

20

30

40

50

60

70

80

90

Parachute Rifle Bell-Melton

Co

nc

en

tra

tio

n (

pp

bv)

Garfield County Annual Average Trends Ethane

2008 2009 2010 2011 2012

*Prelminary 2013 average only includes data through November 2013

0

0.1

0.2

0.3

0.4

0.5

0.6

0.7

0.8

0.9

Parachute Rifle Bell-Melton

Co

nc

en

tra

tio

n (

pp

bv)

Garfield County Annual Average Trends Benzene

2008 2009 2010 2011 2012

*Prelminary 2013 average only includes data through November 2013

Table 1

Parachute Site

Annual Average Mass Trends (HAPs Parameters)

2008-2012

HAP Average Mass (µg/m

3) Slope

(µg/m3 per

year) p-Value

2008 2009 2010 2011 2012

1,2,4-Trimethylbenzene 0.91 0.62 0.42 0.43 0.39 -0.11 0.04

1,3,5-Trimethylbenzene 0.61 0.51 0.40 0.22 0.18 -0.11 0.01

1,3-Butadiene 0.08 0.12 0.10 0.10 0.09 0.00 0.59

Acetaldehyde 1.11 0.99 0.92 0.90 0.75 -0.08 0.01

Acetone 3.42 3.28 2.67 2.79 2.34 -0.26 0.04

Benzene 2.31 2.69 1.74 1.44 1.31 -0.28 0.04

Crotonaldehyde 0.10 0.10 0.12 0.09 0.08 -0.01 0.24

Cyclohexane 3.92 3.77 2.90 2.22 1.99 -0.54 0.01

Ethylbenzene 0.59 0.44 1.04 0.32 0.17 -0.10 0.12

Formaldehyde 1.74 1.73 1.53 1.64 1.27 -0.11 0.04

Isopropylbenzene 0.09 0.08 0.07 0.08 0.06 -0.01 0.04

Methylcyclohexane 9.24 9.43 6.41 4.65 4.19 -1.47 0.04

m-Xylene/p-Xylene 3.91 3.63 2.20 1.11 1.15 -0.84 0.04

n-Hexane 5.78 5.64 3.93 3.34 3.01 -0.75 0.01

n-Nonane 2.20 2.01 1.13 0.97 0.61 -0.40 0.01

n-Propylbenzene 0.18 0.15 0.13 0.10 0.10 -0.02 0.01

o-Xylene 0.77 0.65 0.43 0.40 0.27 -0.13 0.01

Propionaldehyde 0.12 0.09 0.09 0.09 0.07 -0.01 0.04

Propylene 0.57 0.57 0.62 0.55 0.69 0.03 0.41

Styrene 0.12 0.08 0.12 0.13 1.56 0.04 0.04

Toluene 9.86 5.83 3.96 5.79 4.27 -1.38 0.12


Recommended