BEFORE THE POSTAL REGULATORY COMMISSION WASHINGTON, D.C. 20268-0001 MAIL PROCESSING NETWORK RATIONALIZATION SERVICE CHANGES, 2012 DOCKET NO. N2012-1 DIRECT TESTIMONY OF MICHAEL D. BRADLEY ON BEHALF OF THE UNITED STATES POSTAL SERVICE (USPS-T-10) Postal Regulatory Commission Submitted 12/5/2011 2:49:28 PM Filing ID: 78318 Accepted 12/5/2011
Transcript
BEFORE THE POSTAL REGULATORY COMMISSION
WASHINGTON, D.C. 20268-0001 MAIL PROCESSING NETWORK RATIONALIZATION SERVICE CHANGES, 2012
DOCKET NO. N2012-1
DIRECT TESTIMONY OF MICHAEL D. BRADLEY
ON BEHALF OF THE UNITED STATES POSTAL SERVICE
(USPS-T-10)
Postal Regulatory CommissionSubmitted 12/5/2011 2:49:28 PMFiling ID: 78318Accepted 12/5/2011
TABLE OF CONTENTS
AUTOBIOGRAPHICAL SKETCH………………………………………………………i PURPOSE AND SCOPE……………………………………………………………….v ASSOCIATED LIBRARY REFERENCES…………………………………………....vi I. DETERMINING THE METHODOLOGY FOR MEASURING THE COST
CHANGES CAUSED BY A CHANGE IN SERVICE STANDARDS .......... 1 II. MAIL PROCESSING LABOR COST CHANGES ARISING FROM THE
CHANGE IN SERVICE STANDARDS ...................................................... 4 A. Transfer of Workload ....................................................................... 5 B. Productivity Increases ................................................................ …11 C. Restructuring of Management, Supervision, and Technical Support ............................................................... …18 D. Reduction in Premium Pay ......................................................... …23 E. Reduction in Indirect Costs ........................................................ …27 III. TRANSPORTATION COST CHANGES ARISING FROM THE CHANGE IN SERVICE STANDARDS .................................................................... 29 A. Cost Changes in Air Transportation ........................................... …29 B. Cost Changes in Highway Transportation. ................................. …30 IV. CALCULATING THE OVERALL CHANGE IN COST ............................. 39
i
1 2
AUTOBIOGRAPHCIAL SKETCH 3 4
My name is Michael D. Bradley and I am Professor of Economics at 5
George Washington University. I have been teaching economics there since 6
1982 and I have published many articles using both economic theory and 7
econometrics. Postal economics is one of my major areas of research and my 8
work on postal economics has been cited by researchers around the world. I 9
have presented my research at professional conferences and I have given invited 10
lectures at both universities and government agencies. I also have extensive 11
experience directing research as I have served as the primary or secondary 12
advisor on over fifty dissertations. 13
Beyond my academic work, I have extensive experience investigating 14
real-world economic problems, as I have served as a consultant to financial and 15
manufacturing corporations, trade associations, and government agencies. 16
I received a B.S. in economics with honors from the University of 17
Delaware and as an undergraduate was awarded Phi Beta Kappa, Phi Kappa Phi 18
and Omicron Delta Epsilon for academic achievement in the field of economics. I 19
earned a Ph.D. in economics from the University of North Carolina and as a 20
graduate student I was an Alumni Graduate Fellow. While being a professor, I 21
have won both academic and nonacademic awards, including the Richard D. 22
Irwin Distinguished Paper Award, the American Gear Manufacturers ADEC 23
Award, a Banneker Award and the Tractenberg Prize. 24
ii
I have been studying postal economics for over twenty-five years, and I 1
have participated in many Postal Rate Commission proceedings. I have studied 2
and presented testimony on the costs of all of the major areas of Postal Service 3
activity: retail, transportation, processing and delivery. In Docket No. R84-1, I 4
helped in the preparation of testimony about purchased transportation and in 5
Docket No. R87-1, I testified on behalf of the Postal Service concerning the costs 6
of purchased transportation. In Docket No. R90-1, I presented rebuttal testimony 7
in the area of city carrier load time costs. In the Docket No. R90-1 remand, I 8
presented testimony concerning the methods of city carrier costing. 9
I returned to transportation costing in Docket No. MC91-3. There, I 10
presented testimony on the existence of a distance taper in postal transportation 11
costs. In Docket No. R94-1, I presented both direct and rebuttal testimony on an 12
econometric model of access costs. More recently, in Docket R97-1, I presented 13
three pieces of testimony. I presented both direct and rebuttal testimony in the 14
area of mail processing costs. I also presented direct testimony on the costs of 15
purchased highway transportation. In Docket No. R2000-1, I again presented 16
three pieces of testimony. I presented direct testimony on the theory and 17
methods of calculating incremental cost, and I presented direct and rebuttal 18
testimony on the econometric estimation of purchased highway transportation 19
variabilities. In Docket No. R2001-1, I presented testimony on city carrier costs. 20
In Docket No. R2005-1, I presented three pieces of testimony. I presented direct 21
and rebuttal testimony in the area of city carrier costs and I presented direct 22
iii
testimony that covered the analytical foundations of the attribution of both 1
purchased transportation costs and window service costs. 2
In Docket No. R2006-1, I again presented three pieces of testimony. I 3
presented two pieces of direct testimony, one on window service costs and one 4
on transportation costs and piece of rebuttal testimony on window service costs. 5
Finally, in Docket No. N2010-1 I presented testimony that calculated and 6
presented the cost savings created by moving to five-day delivery in the areas of 7
city carrier delivery, rural carrier delivery, and transportation. 8
In addition to my appearances before the Commission, I have presented 9
testimony on postal matters to the President’s Commission on the United States 10
Postal Service, to the Canada Post Mandate Review, to the NAFTA Tribunal on 11
Claims by United Parcel Service against the Government of Canada, and to 12
United States District Court. 13
The following is a sampling of my published research on postal 14
economics: 15
"Measuring Canada Post's Costs: Lessons from the U.S. Experience,” Canadian 16 Transportation Research Forum
18 , May 1988, with A. R. Robinson 17
"Measuring Product Costs for Ratemaking: The U.S. Postal Service," in 19 Regulation and the Evolving Nature of Postal and Delivery Services
23
, M. 20 Crew and P. Kleindorfer, eds. Kluwer Academic Publisher, 1992, with J. 21 Colvin and M. Smith 22
"Measuring Performance of a Multiproduct Firm: An Application to the U.S.Postal 24 System," Operations Research
26 , June 1993, with D.M. Baron 25
"An Econometric Model of Postal Delivery,” in Competition in Postal and 27 Delivery Services: National and International Perspective
30
, M. Crew and P. 28 Kleindorfer, eds. Kluwer Academic Publisher, 1995, with J. Colvin. 29
iv
“Issues in Measuring Incremental Cost in a Multi-Function Enterprise,” in 1 Managing Change in the Postal and Delivery Industries,
5
M. Crew and P. 2 Kleindorfer, eds. Kluwer Academic Publisher, 1997 with J. Colvin and J.C. 3 Panzar 4
“On Setting Prices and Testing Cross-Subsidy with Accounting Data,” Journal of 6 Regulatory Economics
8 , July 1999, with J. Colvin and J.C. Panzar 7
“The Role of the Monopoly Product in the Cost of Universal Service,” Future 9 Directions in Postal Reform
12
, M. Crew and P. Kleindorfer, eds. Kluwer 10 Academic Publisher, 2001 with J. Colvin 11
“Testing for Anti-Competitive Behavior in Public Enterprises,” in Topics in 13 Regulatory Economics and Policy
16
, Vol. 46, November 2004, pp 159-171., 14 with J. Colvin 15
Should We Teach an Old Economy Dog New Economy Tricks? The Role of the 17 Postal Service in the New Economy,” in The New Economy: How New? How 18 Resilient?
20 , Edward Elgar, 2006, 174-196 with D.W. Jansen. 19
“Measuring Scale and Scope Economies with A Structural Model of Postal 21 Delivery,” in Liberalizing the Postal and Delivery Sector, Advances in 22 Regulatory Economics Series,
24 2007, with J.Colvin 23
“An Economic Model of the Regulatory Structure Created by the Postal 25 Accountability and Enhancement Act of 2006,” in Handbook of Worldwide 26 Postal Reform
28 , 2008, with J Colvin and M.K. Perkins 27
“Estimating the Impact of a Uniform Price Rule in a Liberalized Postal 29 Environment: the Case of the United States Postal Service,” in Advances in 30 Regulatory Economics: “Heightening Competition in the Postal and Delivery 31 Sector
34
” Michael Crew and Paul Kliendorfer, (eds.), 2010, with J Colvin, N. 32 Nieto, and D.Tobias. 33
Do Volume Increases and Decreases Have the Same Effect on Labor Hours?* in 35 Multi-Modal Competition And The Future Of Mail
38
, M Crew and P. 36 Kliendorfer, (eds.), forthcoming, 2012, J Colvin and M.K. Perkins. 37
39
v
1 PURPOSE AND SCOPE 2
3 4
The purposes of my testimony are to discuss the methodology the Postal 5
Service will employ in identifying the changes in cost that would be caused by the 6
proposed change in service standards, to calculate the resulting cost changes in 7
the areas of mail processing labor and transportation and to compute and to 8
present the overall change in cost. 9
10
vi
1
ASSOCIATED LIBRARY REFERENCES 2
I am sponsoring the following Library References which are associated with this 3
1 I. DETERMINING THE METHODOLOGY FOR MEASURING THE COST 2
CHANGES CAUSED BY A CHANGE IN SERVICE STANDARDS 3 4 As explained by witnesses Williams, Martin, and Neri, the proposed 5
service standard changes will instigate a substantial restructuring of the Postal 6
Service’s mail processing and transportation networks.1
Because changes in these activities are the source of the cost changes, it 14
is appropriate to begin the cost change measurement with an analysis of the 15
activity changes. The reorganization of the mail processing and transportation 16
networks and the activities within them were carefully studied by the Postal 17
Service. The study process is described by witness Rosenberg and the 18
operational changes are described in detail by witnesses Bratta, Martin, and 19
Neri.
These structural 7
changes will allow the Postal Service to gain efficiencies and reduce cost in 8
some areas, but will cause it to incur additional cost in other areas. When 9
making these structural changes, the Postal Service will be changing its 10
organization and use of the various activities required to sort and transport mail 11
and, as a result of these changes, the cost of sorting and transporting that mail 12
will change. 13
2
1 See, “Direct Testimony David E. Williams on Behalf of the United States Postal Service,” Docket No. N2012-1,USPS-T-1, at Section IV, “Direct Testimony Frank Neri on Behalf of the United States Postal Service,” at Sections V and VI, Docket No. N2012-1, USPS-T-4, and “Direct Testimony Cheryl D. Martin on Behalf of the United States Postal Service,” Docket No. N2012-1, USPS-T-6, at Sections II and III.
20
2 See, “Direct Testimony Emily R. Rosenberg on Behalf of the United States Postal Service,” Docket No. N2012-1, USPS-T-5, at Section III, Direct Testimony Dominic L. Bratta on Behalf of the United States Postal Service,” Docket No.
2
It is important to note that this operational analysis also serves as the 1
basis for the actual planning and implementation of the realigned networks. This 2
means that the operational analysis is not just a speculative “what if,” but is 3
developed with actual implementation in mind. As a result, it must be accurate, 4
reasonable, and feasible. 5
An important part of an overall analysis of the proposed change in service 6
standards is the calculation of the cost changes caused by the resulting activity 7
changes. For this costing exercise, as well as the operational analyses 8
described above, the volume of mail being sorted and transported is held 9
constant.3
More generally, a methodology must be formulated that will guide the 12
calculation of cost changes. This methodology should reflect sound economic 13
costing principles and should be based upon the operational reality that guides 14
the Postal Service’s use of resources. Fortunately, there is a well established set 15
of costing principles and methods that have been developed and can be applied 16
to this costing exercise. This set of principles and methods were originally 17
developed by the Postal Service and Postal Rate Commission, under the Postal 18
Reorganization Act, in a series of rate cases. More recently they have been 19
refined and improved by the Postal Regulatory Commission (PRC) through a 20
This approach is essential to avoid confounding two potential sources 10
of cost changes, the change in service standards and volume reductions. 11
N2012-1, USPS-T-5, at Section IV, “Direct Testimony Frank Neri on Behalf of the United States Postal Service,” Docket No. N2012-1, USPS-T-4 at Sections IV-IX, and “Direct Testimony Cheryl D. Martin on Behalf of the United States Postal Service,” Docket No. N2012-1,USPS-T-6, at Sections II and III. 3 The FY2010 volumes are used at the basis for calculating the cost savings.
3
series of rulemakings in its Annual Compliance Determination (ACD) process. 1
These principles are followed by the Postal Service in calculating the cost 2
changes caused by the proposed change in service standards. In some 3
instances, the application is straightforward because the change in activities falls 4
within the types of costing changes routinely contemplated by the ACD process. 5
In these cases, the established ACD costing relationships can be directly applied. 6
However, the ACD process is focused on product costing, not operational 7
costing, so there are some instances in which an anticipated operational change 8
falls outside the costing relationships employed in the ACD. In these instances 9
the ACD structure and principles can be applied, but they must be refined and 10
adapted to appropriately analyze the activity changes. Nevertheless, in all 11
instances, the Postal Service has been guided by the Postal Regulatory 12
Commission’s established costing principles and assumptions when analyzing 13
cost changes. 14
Finally, the calculated cost savings represent the reduction in processing 15
and transportation costs that the Postal Service would achieve once the network 16
restructuring was fully implemented. As such, it does not include transition or 17
adjustment costs. 18
19 20 21
4
II. MAIL PROCESSING LABOR COST CHANGES ARISING FROM A 1 CHANGE IN SERVICE STANDARDS 2
3 As explained in the testimonies of witnesses Rosenberg and Neri, the 4
proposed change in service standards will have a significant impact on the 5
organization of mail processing.4
Among other changes, the change in service standard permits the Postal 8
Service to extend many of its operating windows and, as a result, transfer 9
workload among facilities.
These include both changes in where mail 6
processing activities take place and how those activities are operated. 7
5 More generally, these operational changes will 10
provide an opportunity for the Postal Service to increase the efficiency of its 11
resource use, better plan and schedule for the workload, and reduce the mail 12
processing labor costs of handling a given amount of volume.6
Clearly, improvement in the efficiency of resource use will provide the 14
Postal Service with the opportunity to reduce the cost of sorting a given volume 15
of mail. Witness Smith addresses the facility and equipment cost savings and 16
the workload reduction cost savings created by the operational changes flowing 17
13
4 See, “Direct Testimony Emily R. Rosenberg on Behalf of the United States Postal Service,” Docket No. N2012-1, USPS-T-3 at Section III, and “Direct Testimony Frank Neri on Behalf of the United States Postal Service,” Docket No. N2012-1,USPS-T-4, at Sections V and VI. 5 See, “Direct Testimony of Emily R. Rosenberg on Behalf of the United States Postal Service,” Docket No. N2012-1,USPS-T-3 at Section III. 6 See, “Direct Testimony Frank Neri on Behalf of the United States Postal Service,” Docket No. N2012-1,USPS-T-4, at Section VIII.
5
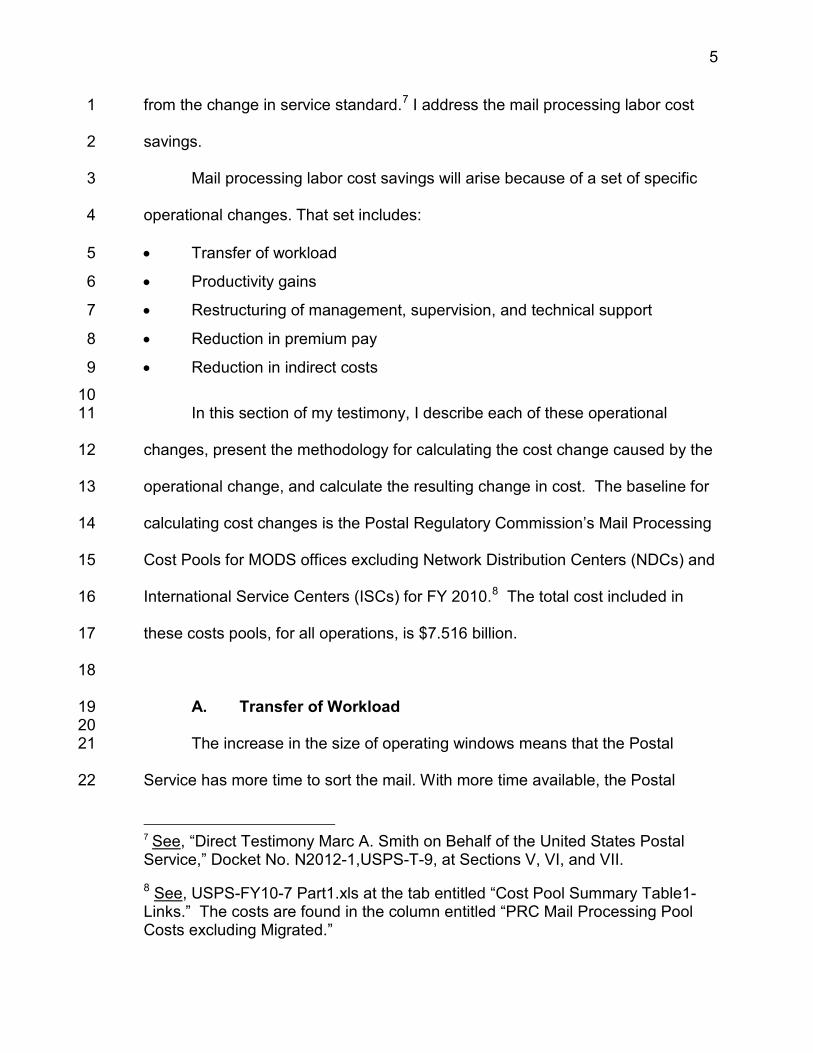
from the change in service standard.7
Mail processing labor cost savings will arise because of a set of specific 3
operational changes. That set includes: 4
I address the mail processing labor cost 1
savings. 2
• Transfer of workload 5
• Productivity gains 6
• Restructuring of management, supervision, and technical support 7
• Reduction in premium pay 8
• Reduction in indirect costs 9
10 In this section of my testimony, I describe each of these operational 11
changes, present the methodology for calculating the cost change caused by the 12
operational change, and calculate the resulting change in cost. The baseline for 13
calculating cost changes is the Postal Regulatory Commission’s Mail Processing 14
Cost Pools for MODS offices excluding Network Distribution Centers (NDCs) and 15
International Service Centers (ISCs) for FY 2010.8
18
The total cost included in 16
these costs pools, for all operations, is $7.516 billion. 17
A. Transfer of Workload 19 20
The increase in the size of operating windows means that the Postal 21
Service has more time to sort the mail. With more time available, the Postal 22
7 See, “Direct Testimony Marc A. Smith on Behalf of the United States Postal Service,” Docket No. N2012-1,USPS-T-9, at Sections V, VI, and VII. 8 See, USPS-FY10-7 Part1.xls at the tab entitled “Cost Pool Summary Table1-Links.” The costs are found in the column entitled “PRC Mail Processing Pool Costs excluding Migrated.”
6
Service can consolidate its workload and increase its machine run times.9
As a result of this reorganization, the Postal Service will be transferring 5
workload from a larger number of facilities to a smaller number of facilities. This 6
means that it will be sorting the mail at a smaller number of locations across the 7
country. In other words, within each mail processing technology, (e.g. Delivery 8
Barcode Sorter(DBCS), Small Parcel and Bundle Sorter (SPBS), Cancelling) the 9
Postal Service will be reducing the number of places at which and the amount of 10
equipment on which operations are run, but will be running those operations 11
longer. The reduction in the number of locations, by technology, has implications 12
for the cost of sorting mail. 13
1
Longer machine run times means the Postal Service needs fewer machines to 2
sort the same amount of mail, and, consequently, fewer facilities to hold those 3
machines. 4
In calculating the cost impact of this workload transfer, I utilized the 14
existing ACD methodology. Specifically, when analyzing mail processing costs, 15
the PRC has determined that certain costs in individual cost pools (e.g. DBCS 16
operations, AFSM 100 operations, pouching operations) are “institutional costs” 17
and thus not related to the amount of workload handled in the cost pools. 18
Because the institutional costs are associated with the establishment of an 19
operation at a location, not the workload in the operation, a reduction in the total 20
number of locations will reduce the total institutional cost for the associated cost 21
9 See, “Direct Testimony of Emily R. Rosenberg on Behalf of the United States Postal Service,” Docket No. N2012-1,USPS-T-3, at Section III.
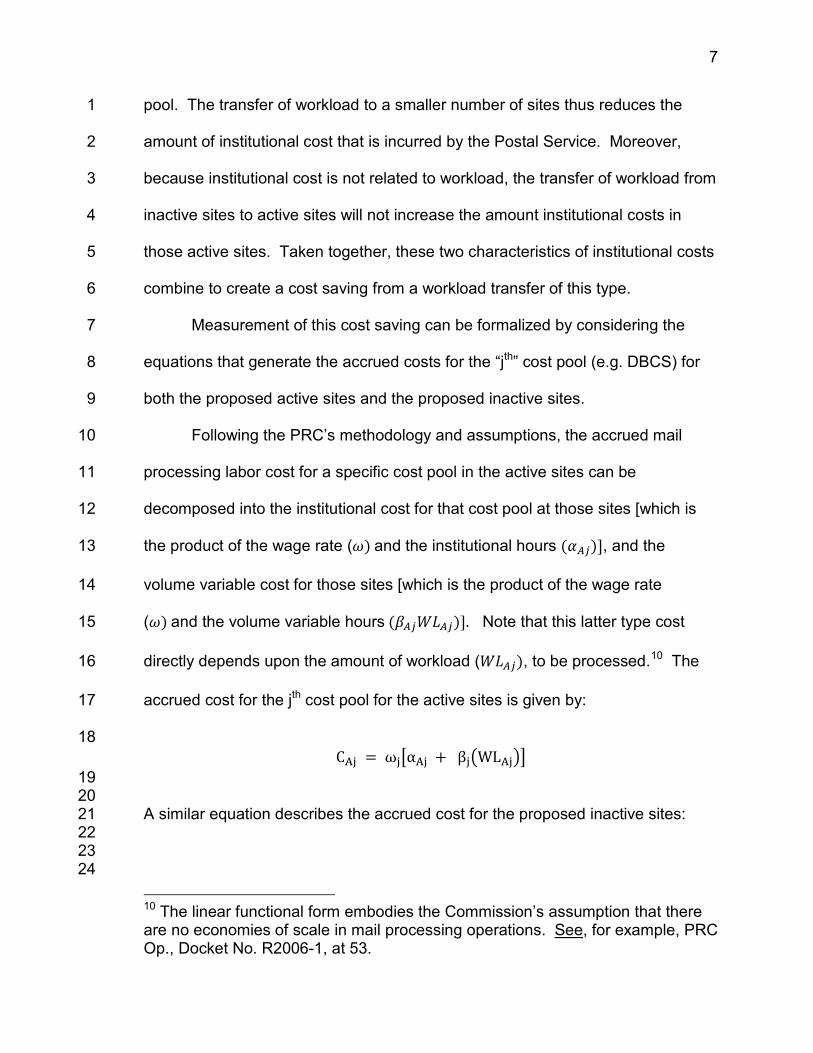
7
pool. The transfer of workload to a smaller number of sites thus reduces the 1
amount of institutional cost that is incurred by the Postal Service. Moreover, 2
because institutional cost is not related to workload, the transfer of workload from 3
inactive sites to active sites will not increase the amount institutional costs in 4
those active sites. Taken together, these two characteristics of institutional costs 5
combine to create a cost saving from a workload transfer of this type. 6
Measurement of this cost saving can be formalized by considering the 7
equations that generate the accrued costs for the “jth” cost pool (e.g. DBCS) for 8
both the proposed active sites and the proposed inactive sites. 9
Following the PRC’s methodology and assumptions, the accrued mail 10
processing labor cost for a specific cost pool in the active sites can be 11
decomposed into the institutional cost for that cost pool at those sites [which is 12
the product of the wage rate (𝜔) and the institutional hours (𝛼𝐴𝑗)], and the 13
volume variable cost for those sites [which is the product of the wage rate 14
(𝜔) and the volume variable hours (𝛽𝐴𝑗𝑊𝐿𝐴𝑗)]. Note that this latter type cost 15
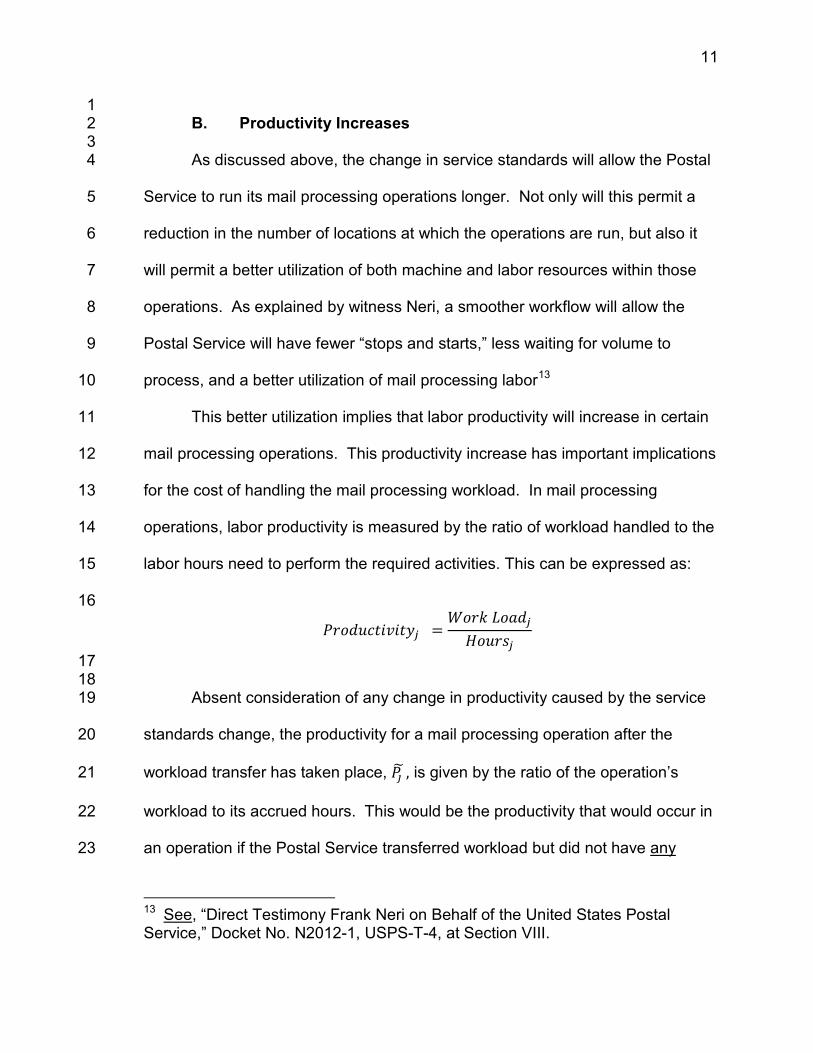
directly depends upon the amount of workload (𝑊𝐿𝐴𝑗), to be processed.10
18 CAj = ωj�αAj + βj�WLAj��
The 16
accrued cost for the jth cost pool for the active sites is given by: 17
19 20 A similar equation describes the accrued cost for the proposed inactive sites: 21 22 23 24 10 The linear functional form embodies the Commission’s assumption that there are no economies of scale in mail processing operations. See, for example, PRC Op., Docket No. R2006-1, at 53.
8
CIj = ωj�αIj + βj�WLIj�� 1 2 These equations can be combined to produce the equation for the cost pool’s 3
accrued mail processing labor cost required for handling the cost pool’s FY2010 4
workload in the current network: 5
6 Cj = ωj�αIj + βj�WLIj� + αAj + βj�WLAj��
7 8
Note that this cost just equals the Commission’s accrued cost for the cost pool in 9
the FY2010 ACD model. 10
The cost of handling the same FY 2010 workload in the realigned network 11
is the cost that will occur at active sites. This is the sum of the cost pool’s 12
institutional costs at the active sites plus the cost pool’s volume variable costs at 13
active sites. This latter cost includes the hours required to handle both the 14
workload that was already at the active sites plus the workload transferred from 15
the inactive sites. In sum, a cost pool’s total cost of handling the FY2010 16
workload in the realigned network is given by the following equation. 17
18 Cȷ� = ωj�αAj + βj�WLAj + WLIj��
19 20 The workload transfer change in cost is the difference between the cost of 21
handling the workload in the current network and the cost of handling that same 22
workload in the realigned network. The cost saving equation is therefore the 23
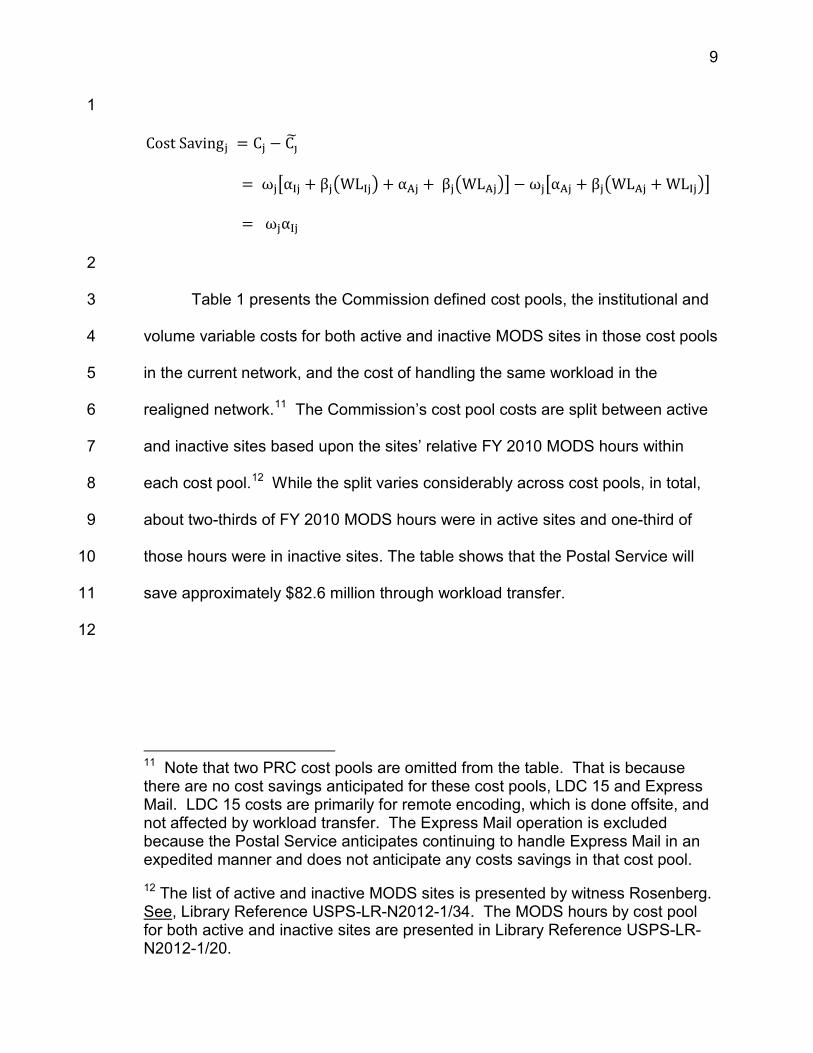
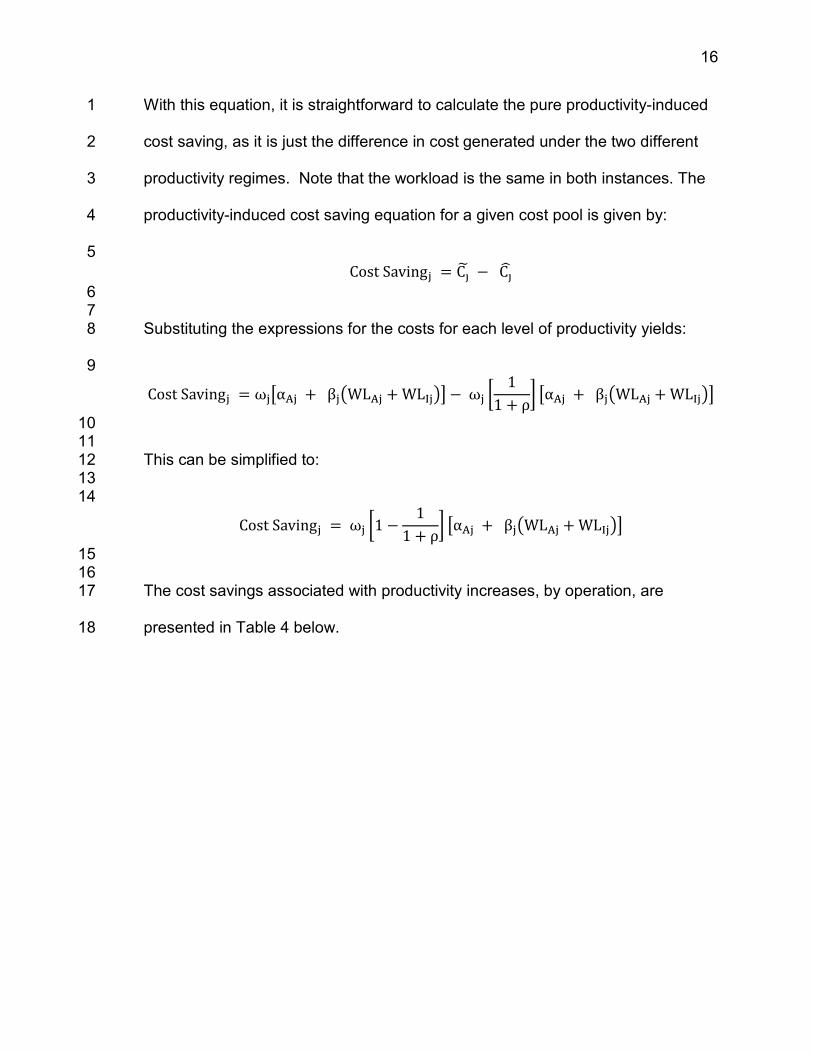
difference between the two previously presented equations: 24
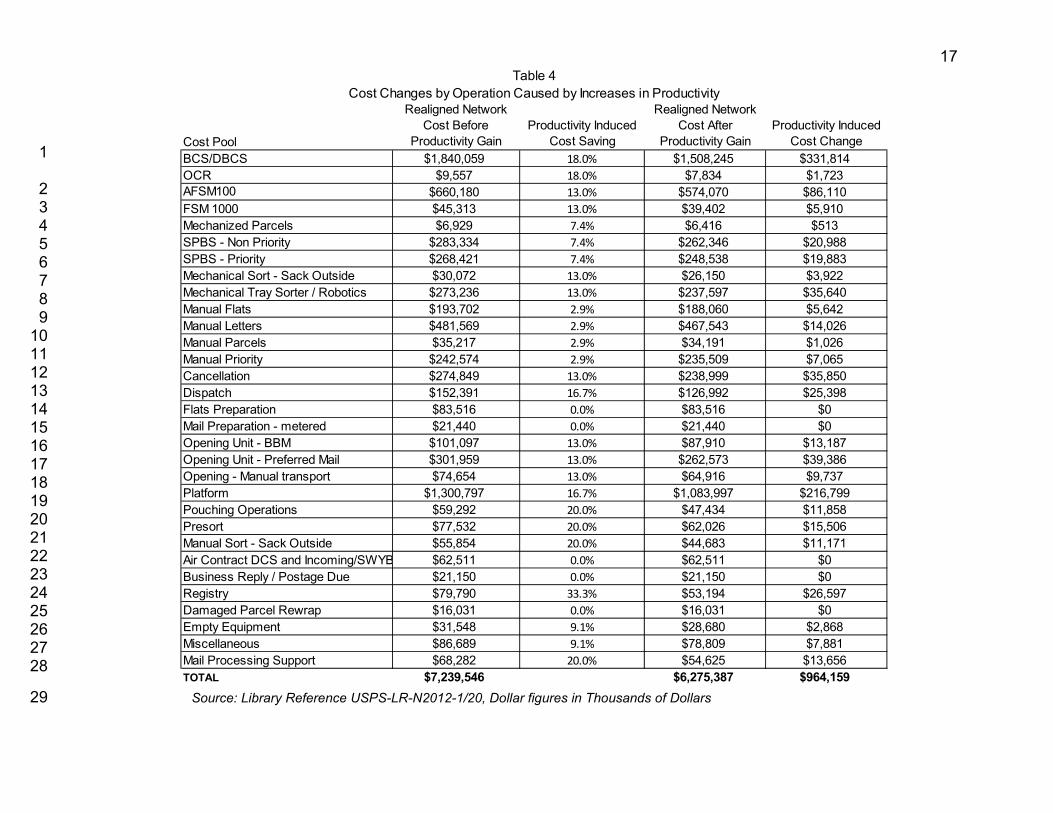
Table 1 presents the Commission defined cost pools, the institutional and 3
volume variable costs for both active and inactive MODS sites in those cost pools 4
in the current network, and the cost of handling the same workload in the 5
realigned network.11 The Commission’s cost pool costs are split between active 6
and inactive sites based upon the sites’ relative FY 2010 MODS hours within 7
each cost pool.12
12
While the split varies considerably across cost pools, in total, 8
about two-thirds of FY 2010 MODS hours were in active sites and one-third of 9
those hours were in inactive sites. The table shows that the Postal Service will 10
save approximately $82.6 million through workload transfer. 11
11 Note that two PRC cost pools are omitted from the table. That is because there are no cost savings anticipated for these cost pools, LDC 15 and Express Mail. LDC 15 costs are primarily for remote encoding, which is done offsite, and not affected by workload transfer. The Express Mail operation is excluded because the Postal Service anticipates continuing to handle Express Mail in an expedited manner and does not anticipate any costs savings in that cost pool. 12 The list of active and inactive MODS sites is presented by witness Rosenberg. See, Library Reference USPS-LR-N2012-1/34. The MODS hours by cost pool for both active and inactive sites are presented in Library Reference USPS-LR-N2012-1/20.
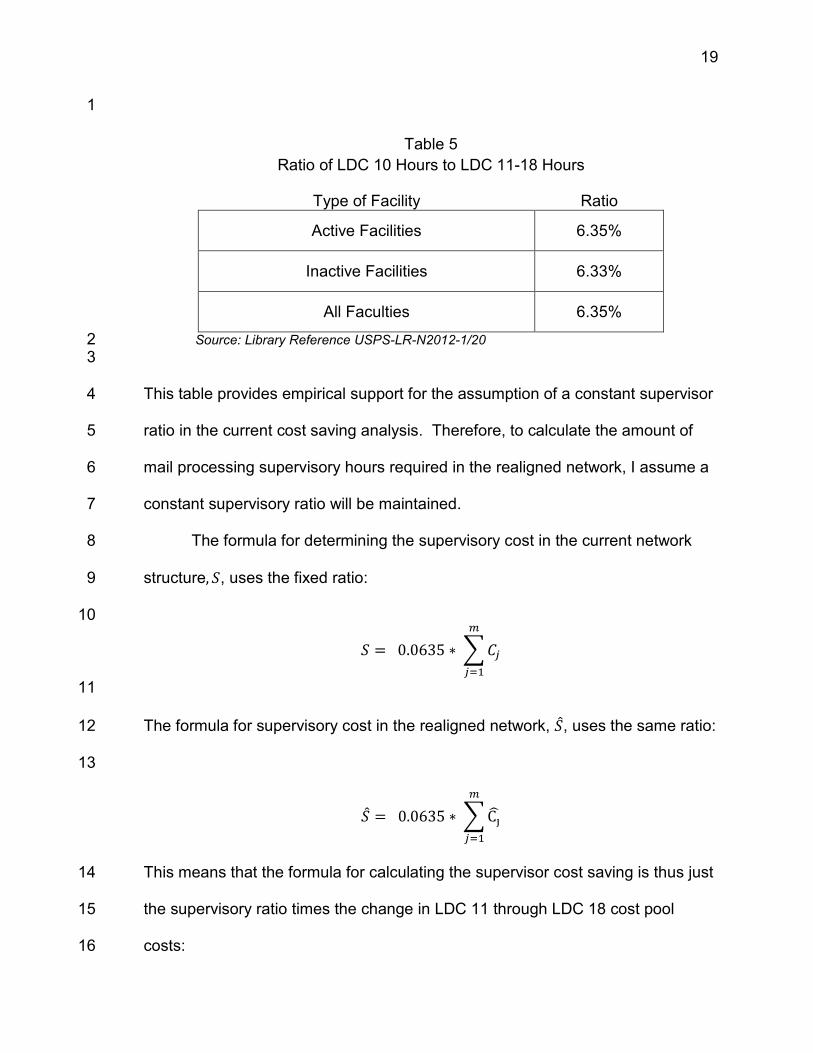
While a facility’s supervisor costs are directly proportional to the amount of 11
direct hours being supervised, the hours for a plant manager are not. Each 12
facility has only one plant manager regardless of the number of employees 13
working in the facility, and a reduction in the number of facilities necessarily 14
implies a reduction in the number of plant managers. This also means that there 15
will be a reduction in total plant manager hours. 16
The cost savings caused by this change in the structure of plant 17
management are calculated by first identifying the amount of plant management 18
hours (LDC 80) in the inactive sites and then multiplying those hours by the 19
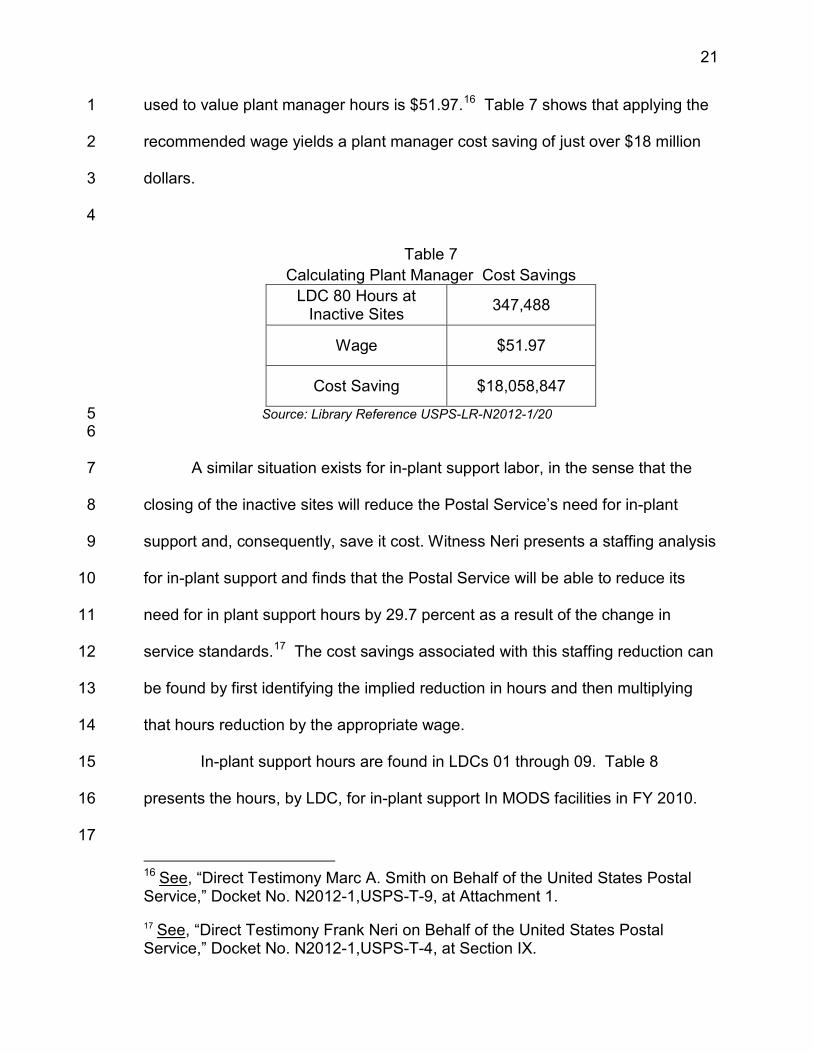
appropriate wage rate. Witness Smith explains that the wage that should be 20
21
used to value plant manager hours is $51.97.16
4
Table 7 shows that applying the 1
recommended wage yields a plant manager cost saving of just over $18 million 2
dollars. 3
Table 7 Calculating Plant Manager Cost Savings
LDC 80 Hours at Inactive Sites 347,488
Wage $51.97
Cost Saving $18,058,847
Source: Library Reference USPS-LR-N2012-1/20 5 6
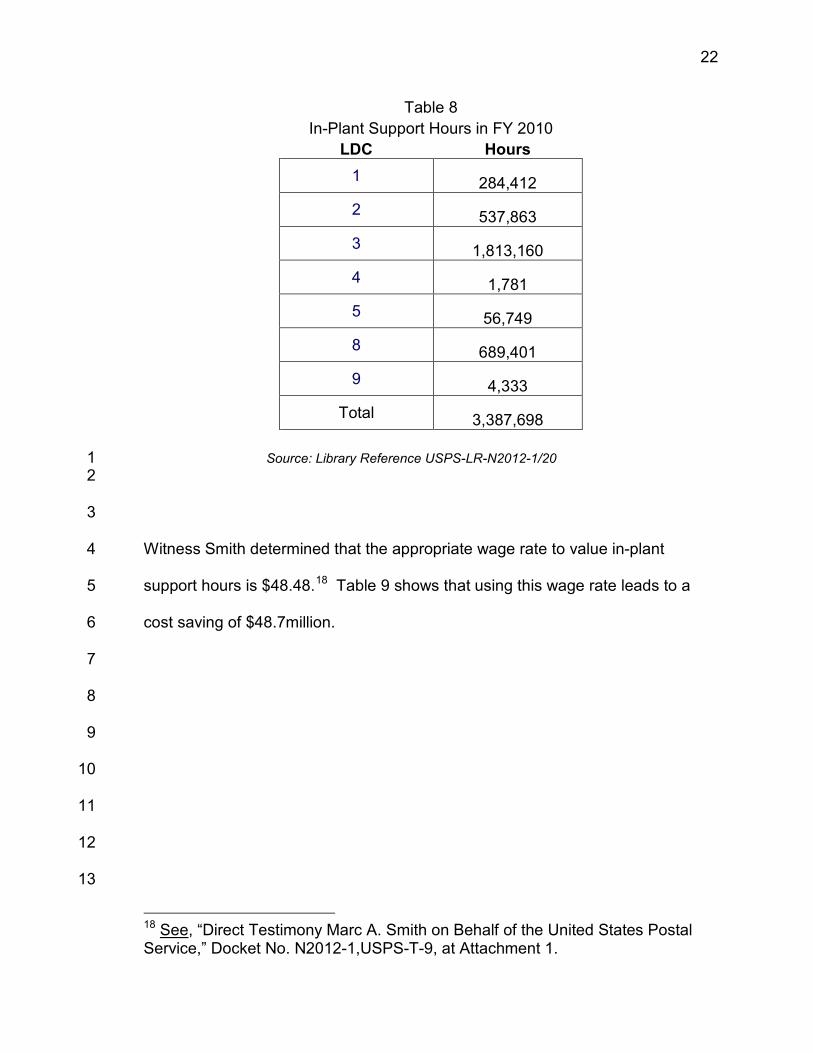
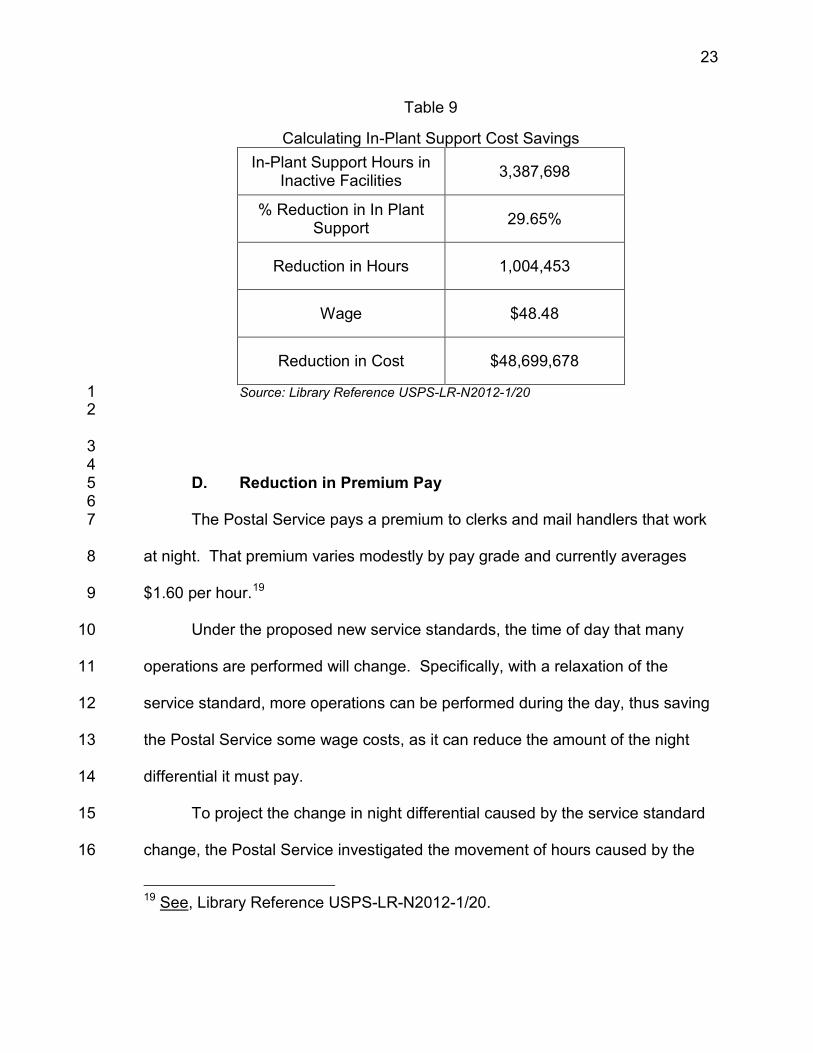
A similar situation exists for in-plant support labor, in the sense that the 7
closing of the inactive sites will reduce the Postal Service’s need for in-plant 8
support and, consequently, save it cost. Witness Neri presents a staffing analysis 9
for in-plant support and finds that the Postal Service will be able to reduce its 10
need for in plant support hours by 29.7 percent as a result of the change in 11
service standards.17
In-plant support hours are found in LDCs 01 through 09. Table 8 15
presents the hours, by LDC, for in-plant support In MODS facilities in FY 2010. 16
The cost savings associated with this staffing reduction can 12
be found by first identifying the implied reduction in hours and then multiplying 13
that hours reduction by the appropriate wage. 14
17 16 See, “Direct Testimony Marc A. Smith on Behalf of the United States Postal Service,” Docket No. N2012-1,USPS-T-9, at Attachment 1. 17 See, “Direct Testimony Frank Neri on Behalf of the United States Postal Service,” Docket No. N2012-1,USPS-T-4, at Section IX.
Witness Smith determined that the appropriate wage rate to value in-plant 4
support hours is $48.48.18
7
Table 9 shows that using this wage rate leads to a 5
cost saving of $48.7million. 6
8
9
10
11
12
13
18 See, “Direct Testimony Marc A. Smith on Behalf of the United States Postal Service,” Docket No. N2012-1,USPS-T-9, at Attachment 1.
23
Table 9
Calculating In-Plant Support Cost Savings In-Plant Support Hours in
Inactive Facilities 3,387,698
% Reduction in In Plant Support 29.65%
Reduction in Hours 1,004,453
Wage $48.48
Reduction in Cost $48,699,678
Source: Library Reference USPS-LR-N2012-1/20 1 2
3 4 D. Reduction in Premium Pay 5 6 The Postal Service pays a premium to clerks and mail handlers that work 7
at night. That premium varies modestly by pay grade and currently averages 8
$1.60 per hour.19
Under the proposed new service standards, the time of day that many 10
operations are performed will change. Specifically, with a relaxation of the 11
service standard, more operations can be performed during the day, thus saving 12
the Postal Service some wage costs, as it can reduce the amount of the night 13
differential it must pay. 14
9
To project the change in night differential caused by the service standard 15
change, the Postal Service investigated the movement of hours caused by the 16
19 See, Library Reference USPS-LR-N2012-1/20.
24
resulting operational window shift. To do so, the Postal Service examined mail 1
processing labor hours both by operation and hour of the day and divided those 2
into two categories.20
The Postal Service then examined how the timing of operations will 9
change under the revised operating plan. For example, with the new operating 10
windows, incoming primary operations will shift from night-time work to day-time 11
work. This analysis of the pattern of hours under the revised operating plan 12
resulted in a projection of the proportion of hours by operation that will receive 13
the night differential under the new operating plan.
The first category covered hours from 0600 through1800, 3
the period for which night differential is not paid. The second category included 4
hours from 1800 through 2400 and from 0000 through 0600 during which night 5
differential is paid. Analysis of the current pattern of hours across these two 6
groups, by operation, shows that under the current operating plan 58.6 percent of 7
hours receive the night differential premium. 8
21
16
Those ratios are presented 14
in Table 10. 15
17
18
19
20
21
20 See, “Direct Testimony Frank Neri on Behalf of the United States Postal Service,” Docket No. N2012-1,USPS-T-4, at Section VII. 21 The analysis is presented in Library Reference USPS-LR-N2012-1/20
25
Table 10 Change in Percentage of Hours Receiving the Night
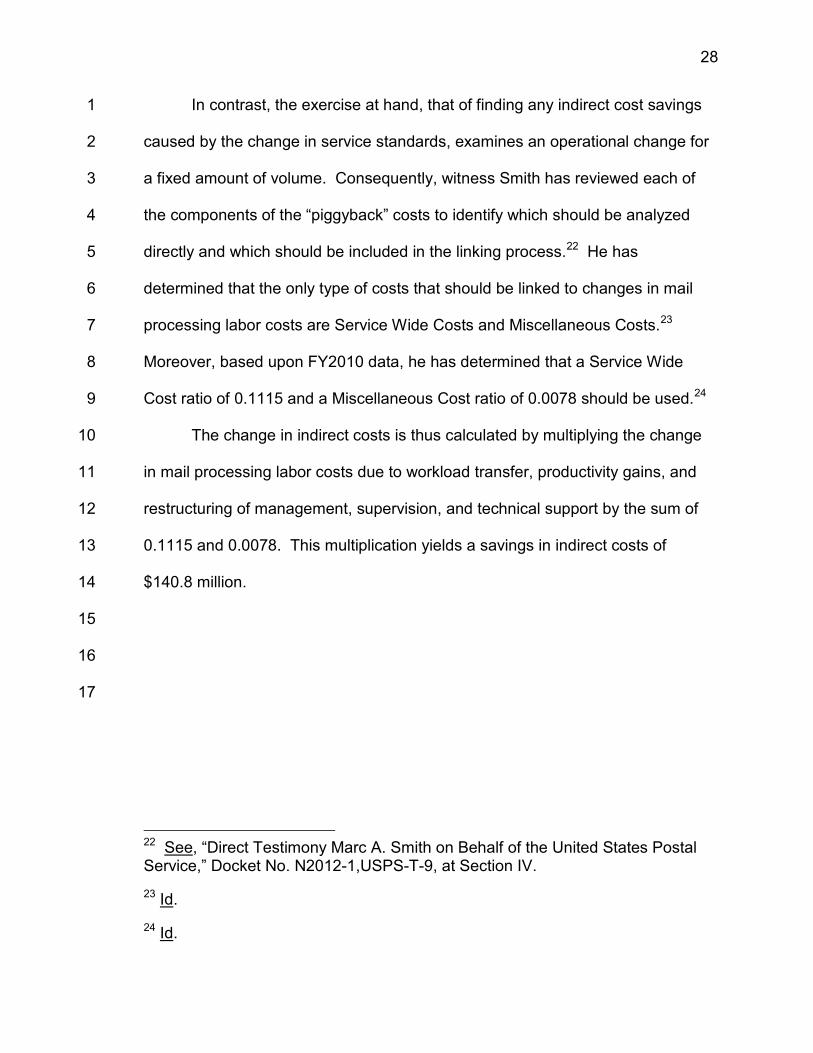
In contrast, the exercise at hand, that of finding any indirect cost savings 1
caused by the change in service standards, examines an operational change for 2
a fixed amount of volume. Consequently, witness Smith has reviewed each of 3
the components of the “piggyback” costs to identify which should be analyzed 4
directly and which should be included in the linking process.22 He has 5
determined that the only type of costs that should be linked to changes in mail 6
processing labor costs are Service Wide Costs and Miscellaneous Costs.23 7
Moreover, based upon FY2010 data, he has determined that a Service Wide 8
Cost ratio of 0.1115 and a Miscellaneous Cost ratio of 0.0078 should be used.24
The change in indirect costs is thus calculated by multiplying the change 10
in mail processing labor costs due to workload transfer, productivity gains, and 11
restructuring of management, supervision, and technical support by the sum of 12
0.1115 and 0.0078. This multiplication yields a savings in indirect costs of 13
$140.8 million. 14
9
15
16
17
22 See, “Direct Testimony Marc A. Smith on Behalf of the United States Postal Service,” Docket No. N2012-1,USPS-T-9, at Section IV. 23 Id. 24 Id.
29
III. TRANSPORTATION COST CHANGES ARISING FROM THE CHANGE 1 IN SERVICE STANDARDS 2
3
The proposed change in service standards will alter the way the Postal 4
Service configures portions of both its air transportation network and its highway 5
transportation network. These alternations will cause the Postal Service’s 6
transportation costs to change and I describe the nature and amounts of those 7
cost changes in this section of my testimony. 8
9
A. Cost Changes in Air Transportation. 10
As explained by witness Martin, an important transportation change is the 11
movement of three-day First Class Mail from highway transportation to air 12
transportation.25 This change will occur in response to the change in operating 13
windows caused by the service standard changes. Moreover, witness Martin 14
calculated how much additional mail, in pounds, the Postal Service expects to 15
move from surface to air.26
However, when paying for air transportation, the Postal Service must also 17
pay for the tare weight of the containers it uses to transport the mail. That is, the 18
Postal Service pays the air carriers for both the transportation of the mail and for 19
the transportation of the containers holding mail. This means to calculate the 20
additional air transportation cost of the mail moving from highway to air, the mail 21
weight must be increased to account for the additional weight of the containers. 22
16
25 See “Direct Testimony Cheryl D. Martin on Behalf of the United States Postal Service,” Docket No. N2012-1,USPS-T-6, at Section III. 26 Id.
30
I account for the additional container weight in the following steps.27 First, 1
the TRACS Inter-SCF distribution key for First Class mail is used to distribute to 2
the additional volume (by weight) to shape. Next, it is assumed that letters and 3
cards will be transported in letter trays, flats will be transported in flat tubs and 4
parcels will be transported in sacks. This assumption is then used to “fill” 5
containers with the additional mail. That is, the average mail
Multiplying the additional pounds, including tare weight for each carrier by 12
the rate per pound for that carrier produces the additional air transportation cost. 13
Moving the mail from surface transportation to air transportation will cause the 14
Postal Service to incur an additional $124.9 million dollars in air transportation 15
cost. 16
weight per 6
container for letter trays, flat trays, and sacks is used to calculate the number of 7
additional containers, by each type that will be needed to transport the additional 8
mail. Finally, the tare weigh for each type of container is multiplied by the number 9
of additional containers to find the additional container weight required to 10
transport the additional mail. 11
17
B. Cost Changes in Highway Transportation. 18
As explained by witness Martin, two portions of the highway network will 19
be affected by the proposed change in service standards, the “plant-to-plant” 20
network that moves mail among P&DCs and the “plant-to-post office” network 21
27 The details of this calculation are presented in the non-public Library Reference USPS-LR-N2012-1/NP6. The public version is presented in Library Reference USPS-LR-N2012-21.
31
that moves mail among the post offices and other local facilities within each 1
plant’s service area.28 The former part of the network has sometimes been 2
referred to as the “Inter-SCF” network and the latter part has sometimes been 3
referred to as the “Intra-SCF” network.29
7
Note that transportation involving NDCs 4
will not be affected and the “Inter-BMC” and “Intra-BMC” portions of the 5
transportation network will not be included in this analysis. 6
1.
Witness Martin has analyzed the impact of the change in service 9
standards in the plant-to-plant potion of the HCR network and has determined 10
that the longer operating windows and reduction in mail processing facilities will 11
have an impact on plant-to-plant transportation.
Cost Changes in the Plant-to-Plant Highway Network 8
30 These two changes will allow 12
the Postal Service to more efficiently utilize its transportation and thus carry the 13
same amount of mail with less capacity. Witness Martin estimates that through 14
better utilization, the Postal Service will be able to reduce its capacity in the 15
plant-to-plant portion of the network by 24.7 percent and still transport the same 16
volume of mail.31
28 See, “Direct Testimony Cheryl D. Martin on Behalf of the United States Postal Service,” Docket No. N2012-1,USPS-T-6, at Section II.
17
29 The “Inter-SCF” portion of the network is actually made of three types of highway transportation accounts: Inter-Area transportation, Inter-Cluster transportation, and Inter P&DC transportation. The “Intra-SCF” portion of the network is covered by the Intra P&DC account. 30 See, “Direct Testimony Cheryl D. Martin on Behalf of the United States Postal Service,” Docket No. N2012-1,USPS-T-6, at Section II A. 31 Id.
32
This reduction in transportation capacity can be used to find the reduction 1
in cost. The relationship between cost and capacity has been studied both by 2
the Postal Regulatory Commission and by the Postal Service and the result of 3
this research is an established methodology that is used in the ACD process to 4
determine attributable costs. I apply this established methodology here to 5
calculate the cost savings created by the capacity reduction. 6
The established methodology specifies that the relationship between cost 7
and capacity is given by: 8
9 %Δ Costi = εi %Δ Capacityi, 10
11
where ε is known as the “capacity variability” and capacity is measured by cubic 12
foot-miles of provided transportation. Capacity variabilities have been estimated 13
by the Postal Service and approved by the Postal Regulatory Commission.32
16 𝐶𝑜𝑠𝑡
𝑆𝑎𝑣𝑖𝑛𝑔𝑠𝑖 = 𝜀𝑖 ∗ [% ∆ 𝐶𝐹𝑀] ∗ 𝐵𝑎𝑠𝑒𝑙𝑖𝑛𝑒𝐶𝑜𝑠𝑡𝑖
14
With this formulation the annual cost savings are given by the following equation: 15
17 18 The baseline cost for the plant-to-plant portion of the HCR network is accrued 19
cost in the three contract types that make up that part of the network, Inter-Area, 20
Inter-Cluster, and Inter-P&DC. Table 12 provides the baseline costs, variabilites 21 32 In the approved methodology in the ACD process, the capacity variabilities for inter-Area, inter-Cluster, and inter-P&DC are the cost-weighted averages of the variabilities for tractor-trailer and van contract cost segments within those accounts. See Appendix A: Calculation of Variabilities for Split Cost Accounts, Direct Testimony of Michael D. Bradley on Behalf of the United States Postal Service, Docket No. 2000-1, USPS-T-18.
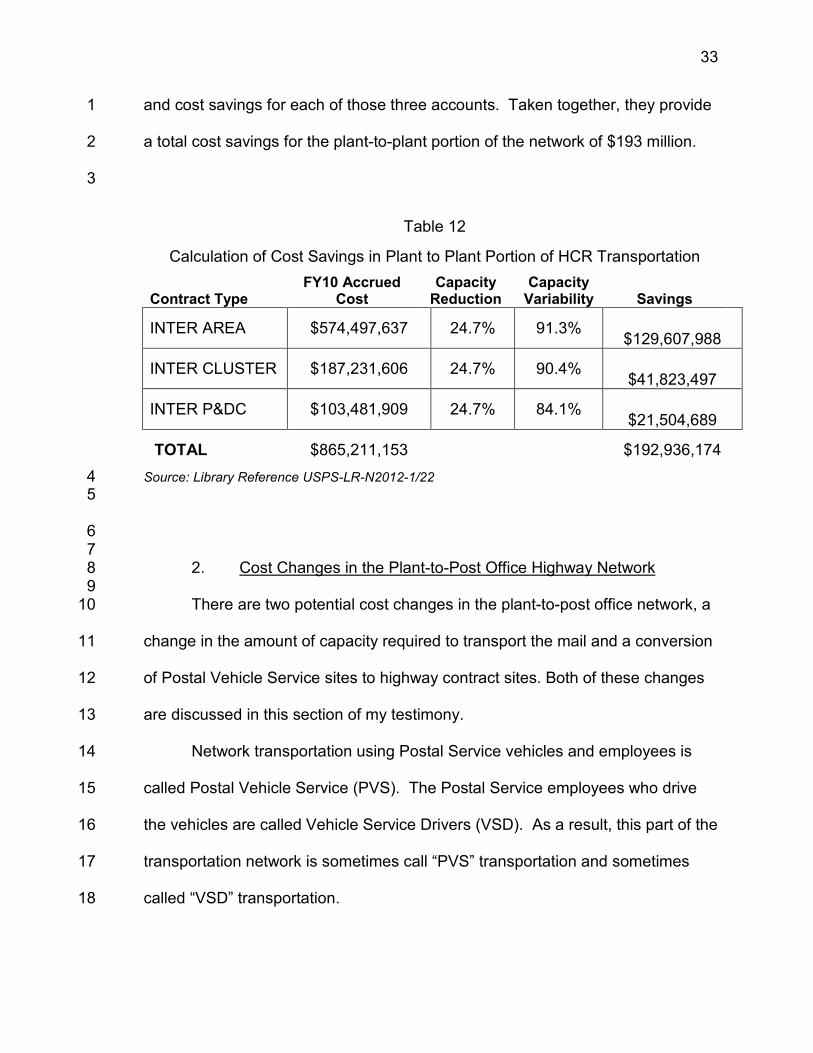
33
and cost savings for each of those three accounts. Taken together, they provide 1
a total cost savings for the plant-to-plant portion of the network of $193 million. 2
3
Table 12
Calculation of Cost Savings in Plant to Plant Portion of HCR Transportation
Contract Type FY10 Accrued
Cost Capacity
Reduction Capacity
Variability Savings
INTER AREA $574,497,637 24.7% 91.3% $129,607,988
INTER CLUSTER $187,231,606 24.7% 90.4% $41,823,497
INTER P&DC $103,481,909 24.7% 84.1% $21,504,689
TOTAL $865,211,153 $192,936,174 Source: Library Reference USPS-LR-N2012-1/22 4 5
6 7 2. Cost Changes in the Plant-to-Post Office Highway Network 9
8
There are two potential cost changes in the plant-to-post office network, a 10
change in the amount of capacity required to transport the mail and a conversion 11
of Postal Vehicle Service sites to highway contract sites. Both of these changes 12
are discussed in this section of my testimony. 13
Network transportation using Postal Service vehicles and employees is 14
called Postal Vehicle Service (PVS). The Postal Service employees who drive 15
the vehicles are called Vehicle Service Drivers (VSD). As a result, this part of the 16
transportation network is sometimes call “PVS” transportation and sometimes 17
called “VSD” transportation. 18
34
The Postal Service has identified 40 PVS sites that will close when their 1
associated P&DC is closed.33
PVS costs arise in two areas, labor costs and vehicle costs. Labor costs 10
are tracked in three different activities, LDC 30 which records hours for the 11
supervision for vehicle service drivers, LDC 31 which records hours for the 12
administration of vehicle service drivers, and LDC 34 which records hours for 13
vehicle service drivers. The total labor cost saved by closing the 40 PVS sites is 14
just the sum of the LDC 30, 31, and 34 hours for those sites, with each multiplied 15
by its respective wage.
It has also determined that this transportation 2
responsibility will be transferred to Highway Contract Routes (HCR) instead of 3
other PVS transportation. To the extent the HCRs can provide the needed 4
transportation at a lower cost than PVS transportation, the Postal Service will 5
save cost through this transfer. To calculate the change in cost associated with 6
this conversion, one must calculate both the reduction in cost associated with 7
closing the PVS sites and the addition of cost from adding the new contract 8
transportation. 9
34
33 See, “Direct Testimony Cheryl D. Martin on Behalf of the United States Postal Service,” Docket No. N2012-1,USPS-T-6, at Section II B.
The following table presents the labor cost that would 16
be saved by closing the 40 PVS sites. 17
34 The wages for LDCs 30, 31 and 34 are the FY2010 productive hourly rates used in the ACR for Supervisors, Clerks, and Vehicle Drivers respectively. See, “Direct Testimony Marc A. Smith on Behalf of the United States Postal Service,” Docket No. N2012-1,USPS-T-9, at Attachment 1. These wage categories are the same as those used by the Postal Service and accepted by the Commission in the analysis of PVS costs in Docket No. N2010-1. See, PRC Op.,Docket No. N2010-1 at 100.
35
1
Table 13 Labor Costs at 40 Inactive Postal Vehicle Service Sites
LDC 30 LDC 31 LDC 34 Total
Hours 236,823 174,979 2,435,902 2,847,704
Wage $48.48 $41.04 $43.07
Direct Labor Cost $11,481,174 $7,181,141 $104,914,319 $123,576,634
In addition to labor costs, PVS sites also incur vehicle costs which include 4
fuel costs, parts costs and maintenance costs. In FY2010, these vehicle costs 5
were $19.6 million for the 40 inactive PVS sites.35
Because of the nature of transportation involved, PVS transportation will 10
be converted to Intra P&DC HCR transportation. To calculate the additional HCR 11
costs, I took the average cost per mile from that account ($2.05 per mile) and 12
This means that the total 6
Postal Service cost of operating these sites was approximately $158 million. 7
However, the cost savings will be smaller than this amount, because the Postal 8
Service will incur additional cost in HCR transportation. 9
35 The costs were derived from the Postal Service’s VMAS system. The Vehicle Management Accounting System (VMAS) is a cost-accounting system providing operating costs per vehicle. Also reported is the cost of maintenance and repair, vehicle depreciation, parts, and fuel usage. Additional information is provided on vehicle use and inventories.
36
multiplied by the number of miles driven at the PVS sites being converted 1
(27,403,820).36
Table 14 presents the cost savings from PVS conversion. It shows that 3
the additional HCR costs will be $56.1 million, leading to a cost saving of $101.8 4
million. 5
2
Table 14 Calculating the Cost Savings from Converting PVS
Sites to HCR Transportation
Total Labor Costs $138,325,709
Total Vehicle Costs $19,630,079
Total Miles 27,403,820
HCR Cost Per Mile $2.05
Additional HCR Cost $56,131,910
Cost Savings $101,823,878
Source: Library Reference USPS-LR-N2012-1/22 6 7
8
The Postal Service also anticipates that the change in service standards will 9
impact the plant-to-post office portion of its HCR network. Witness Martin 10
36 The average cost per mile was calculated by dividing the sum of Intra-P&DC accrued costs by the miles driven on the contracts in that account. See, Library Reference USPS-LR-N2012-1/22. The total miles driven at the 40 inactive PVS sites were derived from VMAS.
37
analyzed the impact of the change in service standard on this part of the network 1
and found:37
By reducing the number of plant-to-Post Office links 3 within a defined geographic area and collapsing two 4 service areas into one, the Postal Service will be able 5 to reduce the number of operating miles within that 6 area. Additionally, an expanded mail-processing 7 window, combined with a reduction in the number of 8 plants, would enable the Postal Service to decrease 9 the number of surface transportation trips required to 10 service a particular area. 11
2
12 13
Witness Martin estimated that, on balance, these changes would lead to a 14
13.7 percent reduction in capacity in the plant-to-post office portion of the 15
network. The cost savings associated with this reduction can be calculated by 16
applying the same methodology that I applied to the change in the plant-to-plant 17
portion of the network. 18
The baseline for calculating these savings is the cost of operating the 19
plant-to-post office part of the HCR network in FY2010. To calculate the baseline 20
I start with the FY 2010 costs for Intra-P&DC transportation, which provides 21
plant-to-post office transportation. That cost is augmented by the additional HCR 22
cost created by the conversion of PVS sites to HCR transportation. The baseline 23
cost is thus the sum of the FY2010 Intra P&DC cost of $991.8 million and the 24
additional HCR cost from conversion of $56.1 million. The cost savings in this 25
part of the transportation network are presented in Table 15. 26
27 37 See, “Direct Testimony Cheryl D. Martin on Behalf of the United States Postal Service,” Docket No. N2012-1, USPS-T-6, at 11.
38
1
2
Table 15
Calculating Cost Savings in the Plant-to-Post Office Portion of the HCR Network
Baseline Cost $1,047,912,940
Capacity Reduction 13.7%
Capacity Variability 70.2%
Savings $100,664,029
Source: Library Reference USPS-LR-N2012-1/22 3 4
5
6
39
IV. CALCULATING THE OVERALL CHANGE IN COST 1
The Postal Service has analyzed the operational changes that would 2
occur in response to proposed change in service standards. The testimonies of 3
witnesses Brata, Neri, Martin, and Rosenberg have described that response and 4
have provided explanations of how that response would alter the Postal Service’s 5
use productive resources. The operational changes will cause changes in the 6
Postal Services use of labor, facilities, equipment, supplies, and utilities as it 7
restructures its mail processing and transportation networks and will cause a 8
change in the cost of handling a given volume of mail. Witness Smith and the 9
earlier portions of my testimony present the cost changes associated with each 10
of the operational changes. 11
This section of my testimony presents the estimated gross cost savings 12
flowing from the service standard change. Gross cost savings do not account for 13
any changes in mail volume that might occur as a result of the service standard 14
change. They are the “full up” costs savings in the sense they are derived from 15
comparing the cost of handling FY 2010 volume in the existing mail processing 16
and transportation networks with the cost of handling the same volume in the 17
reconfigured mail processing and transportation networks. As such, they do not 18
include any transition or implementation costs. 19
The baselines for calculating the change in cost are the FY 2010 Annual 20
Compliance Determination costs for mail processing and transportation. The 21
methodology followed in estimating the cost savings is that applied by the Postal 22
Regulatory Commission in ACD process. 23
40
The cost changes occur in five areas, mail processing labor cost changes, 1
transportation cost changes, facility related cost changes, mail processing 2
equipment cost changes, and workload reduction cost changes. The cost 3
changes for the first two areas are presented and explained in this testimony; the 4
cost changes for the last three are presented in the testimony of Witness Smith, 5
USPS-T-9. Table 16 presents the cost savings for each of these five areas along 6
with the total cost savings. 7
8
41
1
Table 16 Cost Savings Flowing from by the Proposed Service Standard
Change (In millions of dollars)
Mail Processing Labor Cost Changes Workload Transfer $82.6
Productivity Gains $964.2 Premium Pay Reductions $71.8 Supervision and Plant Management Reductions $84.5 In Plant Support Reductions $48.7 Indirect Cost Reductions $140.8
Subtotal $1,392.5 Transportation Cost Changes
Air Transportation Additions -$124.9 Plant-to-Plant HCR Network Restructuring $192.9 PVS to HCR Conversions $101.8 Plant-to-PO Network Restructuring $100.7
Subtotal $270.6 Facility Related Costs Changes
Building Maintenance and Custodial Labor $231.5 Utilities $74.4 Supplies and Contractor Costs $19.4 Rents or Rental Opportunity Costs $49.5
Subtotal $374.8 Mail Processing Equipment Cost Changes
Maintenance Labor $379.9 Parts and Supplies $82.0
Subtotal $461.9 Workload Reduction Cost Changes
Reduction in Outgoing Secondary Sorting $22.8 Replacement of CSBCS and USFM10000 $15.4 Additional DPS Sorting $36.0