+ All Categories
Home > Documents > BEFORE THE SECURITIES AND EXCHANGE BOARD OF INDIA CORAM

BEFORE THE SECURITIES AND EXCHANGE BOARD OF INDIA CORAM

Date post: 12-Feb-2022
Category:
Upload: others
View: 0 times
Download: 0 times
Share this document with a friend
44
1 WTM/TCN/91/IVD2/03/2008 BEFORE THE SECURITIES AND EXCHANGE BOARD OF INDIA CORAM: Dr. T.C. NAIR, WHOLE TIME MEMBER IN THE MATTER OF ZEE TELEFILMS LTD. (SINCE CHANGED TO ZEE ENTERTAINMENT ENTERPRISES LTD.)AND ITS PROMOTER ENTITIES VIZ., CHURU TRADING CO. PVT. LTD., BRIGGS TRADINGS CO. PVT. LTD., PRAJATMA TRADING CO. PVT. LTD., GANJAM TRADING CO. PVT. LTD., PREMIER FINANCE AND TRADING CO. PVT. LTD., DIGITAL SUPER HIGHWAY PVT. LTD. IN THE SCRIP OF ZEE TELEFILMS LTD. Date of hearing: Appearances: For noticee: Shri Laksaminarayanan, Company Secretary, Zee Entertainment Enterprises Ltd. Shri R. Sethuraman, Guru & Ram, Chartered Accountant Shri A. Janakiraman, Guru & Ram, Chartered Accountant For SEBI: Shri P.K. Bindlish, Chief General Manager Shri Ansuman Dev Pradhan, Manager Ms. Sakkeena P.V, Asst. Legal Advisor Ms. Kshama Wagherkar, Legal Officer Ms. Divya Thota, Legal Officer ORDER UNDER SECTION 11 AND 11B OF THE SEBI ACT, 1992 1. Zee Telefilms Ltd. (since changed to Zee Entertainment Enterprises Ltd., (hereinafter referred to as “Zee or ZTL”) is a company interalia promoted by Churu Trading Co. Pvt. Ltd., Briggs Trading Co. Pvt. Ltd., Prajatma Trading Co. Pvt. Ltd., Ganjam Trading Co. Pvt. Ltd., Premier Finance and Trading Co. Pvt. Ltd. and Digital Super Highway Pvt. Ltd. (hereinafter referred to as “Essel group”). ZTL has its registered office
Transcript

1

WTM/TCN/91/IVD2/03/2008

BEFORE THE SECURITIES AND EXCHANGE BOARD OF INDIA

CORAM: Dr. T.C. NAIR, WHOLE TIME MEMBER

IN THE MATTER OF ZEE TELEFILMS LTD. (SINCE CHANGED TO ZEE ENTERTAINMENT ENTERPRISES LTD.)AND ITS PROMOTER ENTITIES VIZ., CHURU TRADING CO. PVT. LTD., BRIGGS TRADINGS CO. PVT. LTD., PRAJATMA TRADING CO. PVT. LTD., GANJAM TRADING CO. PVT. LTD., PREMIER FINANCE AND TRADING CO. PVT. LTD., DIGITAL SUPER HIGHWAY PVT. LTD. IN THE SCRIP OF ZEE TELEFILMS LTD. Date of hearing:

Appearances:

For noticee: Shri Laksaminarayanan, Company Secretary, Zee Entertainment Enterprises Ltd.

Shri R. Sethuraman, Guru & Ram, Chartered Accountant Shri A. Janakiraman, Guru & Ram, Chartered Accountant

For SEBI: Shri P.K. Bindlish, Chief General Manager Shri Ansuman Dev Pradhan, Manager Ms. Sakkeena P.V, Asst. Legal Advisor Ms. Kshama Wagherkar, Legal Officer Ms. Divya Thota, Legal Officer

ORDER

UNDER SECTION 11 AND 11B OF THE SEBI ACT, 1992 1. Zee Telefilms Ltd. (since changed to Zee Entertainment Enterprises

Ltd., (hereinafter referred to as “Zee or ZTL”) is a company interalia

promoted by Churu Trading Co. Pvt. Ltd., Briggs Trading Co. Pvt. Ltd.,

Prajatma Trading Co. Pvt. Ltd., Ganjam Trading Co. Pvt. Ltd., Premier

Finance and Trading Co. Pvt. Ltd. and Digital Super Highway Pvt. Ltd.

(hereinafter referred to as “Essel group”). ZTL has its registered office

2

at 135 Continental Building, Dr. A B Road, Worli, Mumbai-400 018. The

shares of Zee are listed on Bombay Stock Exchange Ltd. (BSE), National

Stock Exchange of India Ltd. (NSE) and Kolkata Stock Exchange (CSE).

2. There was a significant rise in the price and volume of various scrips

including Zee during the period October 1999 – March 2001 (hereinafter

referred to as the “investigation period”). During the said period, the

scrip of ZTL witnessed build-up of large volumes and subsequent

liquidation at major exchanges. The scrip also witnessed wide

fluctuations in prices. In view of the above, SEBI conducted

investigation into the buying, selling and dealings into scrip of Zee for

the aforesaid period.

3. The investigation revealed that the price of the scrip of Zee moved

from Rs. 476 as on October 1, 1999 to Rs. 1555 as on February 24, 2000

and then came down to Rs. 121 as on March 30, 2001. Investigation

further revealed that the entities related / connected/ associated with

Shri Ketan Parekh (hereinafter referred to as “KP entities/ KP Group”)

were involved in market manipulation in the scrip of Zee in violation of

SEBI (Prohibition of Fraudulent and Unfair Trade Practices Relating to

Securities Market) Regulations, 1995 {hereinafter referred to as “SEBI

(PFUTP) Regulations”}. The manipulative transactions of entities

related/ connected/ associated with Shri Ketan Parekh can be

summarised as below:

i. Synchronized trades;

ii. Financing transactions giving the semblance of purchase and sale

of shares at the Exchanges;

3

iii. Circular trading and creation of artificial volume; and

iv. Benchmarking of the prices of certain scrips by executing non-

genuine transactions.

4. Investigation further revealed that during the period April 2000 to March

2001, the Essel group companies i.e the notices herein had advanced

money worth Rs. 706.40 crore to the following KP entities namely: [

i. Classic Share and Stock Brokers

ii. Chitrakut Computers Pvt Ltd.

iii. Nakshatra Software Pvt Ltd.

iv. Goldfish Computers Pvt Ltd.

v. Classic Credit Ltd.

vi. Panther Fincap and Management Ltd.

vii. Panther Investrade

viii. Saimangal Investrade

Out of the said Rs.706.40 crore, it was found that Rs.251.10 crore was

returned back by KP entities to Essel group and the balance of Rs. 455.3

crore remained unpaid.

5. Investigation further revealed that during the said period Ketan Parekh

entities indulged in manipulative trading in various scrips by using these

funds given by Essel group, the promoters of Zee. It was further found

that during the period when Essel group provided funds to KP entities.

Zee provided funds to the Essel group and these funds were found to

have been routed to KP entities. It was therefore found that the

promoters of Zee aided and abetted KP entities in the manipulation inter

4

alia in the scrip of Zee and thereby disturbed the market equilibrium by

creating artificial demand and supply. These transactions distorted the

price discovery mechanism and created false and misleading appearance

of price and trading in the scrip of Zee.

6. On the basis of the above findings, two show cause notices dated

February 11, 2005 and March 22, 2005 were issued to Zee and its

promoters advising them to show cause as to why suitable directions

under Section 11 and 11B of the SEBI Act, 1992 read with SEBI

(Prohibition of Fraudulent and Unfair Trade Practices relating to

Securities Markets) Regulations (hereinafter referred to as “PFUTP

Regulations”) including restraining them from accessing the capital

market and prohibiting them from dealing in securities market for a

particular duration should not be issued against them.

7. The show cause notices interalia alleged as under:

i. Promoters of Zee (Essel group) provided Rs.706.40 crore without

any collateral to KP entities (at various stages) who manipulated

interalia the price of Zee during the relevant period.

ii. Though the reason for providing huge money was stated to

acquire the shares of media and entertainment companies, it was

observed that Zee and its promoters continued to provide crores of

rupees to KP entities inspite of the failure of KP entities to deliver

the shares or return the money back which was advanced to them.

iii. As Delgrada, a company owned by Shri Subash Chandra,

Chairman of Zee, wanted to off load 2.59 crore shares of Zee

during the relevant time, the promoters of Zee tried and ensured

5

that the price of Zee should not fall from a particular level and

apparently advanced money without any collateral to KP entities

for maintaining the price.

iv. Another reason for promoter’s involvement in price manipulation

of Zee was that Zee had made preferential allotment of 80 lakh to

Goldman Sachs an FII @ Rs.1000 per shares. It was alleged that

promoters of Zee gave money to KP with a tactical understanding

that KP entities would ensure that as against the global

phenomenon at the relevant time when prices were generally

falling, the fall of price of Zee be arrested and price be maintained

to make it attractive for the preferential allottees.

v. Essel group admittedly took loan of Rs. 125 crore from GTB in

March 2001, which was arranged by Shri Ketan Parekh, and

transferred the said funds to KP entities for the aforesaid purposes

which supports the charge that they were acting in close nexus.

8. Zee and its promoters vide letters dated March 29, 2005 and April 13,

2005 respectively replied to the said show cause notices and requested

for inspection of documents submitted by SEBI to the Joint

Parliamentary Committee (JPC) set up in the wake of Securities Market

Scam 2001. SEBI vide letters dated April 12, 2005 and April 20, 2005,

informed Zee and its promoters that investigation reports submitted to

JPC cannot be provided to them as the relevant findings of investigation

along with supporting documents have already been provided to them

vide respective show cause notices. Vide letters dated April 21, 2005 and

April 27, 2005, Zee and its promoters again requested for the reports

submitted to JPC and submitted that the same are relevant for their reply

6

to the show cause notice issued by SEBI. While rejecting their demand

for reports submitted to JPC for the reasons stated above, SEBI vide its

letter dated June 2, 2005 granted inspection of documents to the noticees

on June 7, 2005. The notices however vide letters dated June 7, 2005

requested for adjournment and accordingly another opportunity for

inspection of relevant documents was provided to them on June 10, 2005.

Authorised representatives of noticees inspected the documents on June

10, 2005 and subsequently, vide letters dated June 14, 2005 and June 24,

2005, stated that the inspection provided by SEBI could not be completed

due to non grant of inspection of SEBI investigation report and SEBI’s

failure to provide full statements of CSFB Securities. SEBI vide letter

dated July 11, 2005 clarified that findings of investigation along with

supporting documents which were relevant for them had already been

provided to them along with the respective show cause notices. As

regards alleged failure to furnish full statements of CSFB Securities in

original, it was clarified that that relevant extracts of statements of CSFB

Securities pertaining to the case of noticees was annexed to the show

cause notice and accordingly inspection for the same was provided to

them. Acceding to their request, SEBI also provided copies of the same

and advised them to file their reply to the show cause notice. Zee and its

promoters, vide letter dated August 2, 2005 once again requested for

inspection of investigation reports and also for the cross examination of

witnesses.

9. SEBI vide letter dated December 29, 2005, provided opportunity of

hearing to Zee and its promoters on January 17, 2006. The noticees vide

letters dated January 9 and 10, 2006, respectively replied that they

7

would attend the personal haring granted to them and make submission

only on their request for inspection of documents and not on substantive

issues raised in the show cause notice as a meaningful and

comprehensive reply would be made only after inspection of documents.

On the scheduled date of hearing, the authorised representatives of Zee

and its promoters appeared and reiterated their request for inspection of

documents and cross examination of witnesses as mentioned in the letter

dated August 2, 2005. SEBI, vide letter dated January 31, 2006 addressed

all the contentions raised by Zee and its promoters in their letter dated

August 2, 2005 that the reports submitted by SEBI to JPC only quoted the

findings of DCA and also that reports submitted to JPC were interim in

nature. It was further clarified that the scope of investigation carried out

by SEBI was to find out possible violations of SEBI Act, 1992 and Rules

and Regulations made thereunder and SEBI had issued the show cause

notice based on the findings and conclusions of investigation which was

completed after the publication of JPC report. It further informed that

their request for inspection of investigation report cannot be acceded to

as the relevant portion of the same along with the supporting documents

had already been provided to them vide SEBI show cause notice dated

February 11, 2005 and March 22, 2005. They were also advised to make

full and complete submissions including the merits of the case. The

noticees vide their letters dated February 3 and 6, 2006 requested for

grant of time till February 28, 2006 for replying the aforesaid show cause

notice. Essel group and Zee vide letters dated March 17, 2006 and 31,

2006 respectively submitted reply to the aforesaid two show cause

notices submitting interalia as under:

8

(i) As regards the use of funds provided by the Essel group to KP entities to

manipulate the price of the shares of ZTL, SEBI had informed JPC quoting the

DCA investigation report, which stated that the investigation by DCA did not

reveal that the Essel companies have given funds to broking entities for buying or

selling the shares of ZTL and that Essel group did not deal directly or indirectly

in the shares of ZTL.

(ii) On the basis of SEBI report, JPC had exonerated the Essel group from the charge

of violation of any of its Regulations and/ or the Companies Act. SEBI has not

carried out any further investigation necessitating its change of stand as evident

from the show cause notice. Under the circumstances, legally and factually, the

show cause notice is groundless and is additionally not a bonafide exercise of

statutory powers by SEBI. In any event, either the SEBI findings reported to the

JPC is correct and show cause notice is groundless, or the show cause notice is

prima facie correct and SEBI is in contempt of the Parliament.

(iii) JPC report interalia stated that the available data of financial dealings between

Essel group and entities related to KP, indicate that the flow of funds between the

two groups started only when the price of the scrip was on a descending trend

and not during the period of price rise.

(iv) Till March 2000, the Essel group had no financial relationship, whatsoever with

KP entities. Initially, it started in April 2000 with the investment companies of the

Essel group beginning to use the broking outfits of KP for their regular

investment business. In May and June 2000 Essel group provided ICDs to KP

group companies on commercial terms which were duly returned on due dates

with interest, except for a small portion..

(v) By May 2000 when the Essel Group had the first monetary transaction with KP,

the share price of ZTL had already reached the peak. Therefore, the funds

provided by the Essel group could never had been utilized for rigging or

manipulating or ramping up the share price of ZTL

(vi) KP entities did not deliver the shares as promised by them with the exception of

12 lakh shares of Crane Software International Ltd. equivalent to Rs.7.80 crore.

When the Essel group tried to obtained delivery of the shares, KP said that they

were pledged and would be delivered soon. However, he later said that he was in

possession of further shares of those companies. For this purpose, Essel group

took loan from GTB. Essel group entered into loan agreements with GTB for 125

crore, which were utilized for purchase of media related shares. The entire

transaction was within the knowledge of GTB.

(vii) What Essel group contemplated at the time of entering into the transactions with

KP was that since KP was in liquidity problems, Essel Group could make a

double bargain of helping out someone who has substantial stakes in ZTL shares

with which he could cause considerable instability to the company’s share in the

market and at the same time taking advantage of by acquiring certain investment

9

of him at attractive valuations. However, the subsequent events showed that Essel

group had underestimated the extent of problems of KP at the time of entering

into the transactions.

(viii) The Essel group did not purchase a single share of ZTL during the period

January 1999 to March 2001 from the stock market In contrast, Delgrada a

company belonging to the Essel group had sold 1,16,75,000 equity shares of ZTL

during the period between September and December 2000. If the common

objective of Essel group and KP group were to artificially raise or maintain the

price of shares of ZTL, the selling of such large number of shares would be

directly opposed to the objective.

10. Subsequently, vide letter dated July 17, 2006, opportunity for personal

hearing was granted to Zee and its promoters on August 23, 2006. Vide

letter dated August 12, 2006, Zee informed that their company secretary

in his personal capacity has filed an application dated August 3, 2006

under Right to Information Act, 2005 (RTI) for copies of documents

which were earlier denied by SEBI and requested to keep the quasi

judicial proceedings in abeyance till the completion of the proceedings

under RTI. The Essel group, vide letter dated August 14, 2006, made

similar request. SEBI, vide letter dated August 22, 2006, informed Zee

and its promoters that the hearing will be held as per schedule. Zee and

its promoters, vide letters both dated August 23, 2006 again requested to

keep the proceedings in abeyance till the proceedings initiated under RTI

are concluded.

11. As per the direction of Appellate Authority of SEBI under Right to

Information Act, 2005 (RTI Act) three investigation reports of SEBI were

provided to the applicant noticees. The Appellate Authority however

rejected the request for providing the DCA report. They filed an appeal

with Central Information Commission (CIC) against the order of

Appellate Authority of SEBI and the said appeal was rejected by the CIC.

10

12. SEBI vide letter dated February 15, 2007, gave another opportunity of

hearing on February 22, 2007 to Zee and its promoters which was later

postponed to March 21, 2007 as per their request vide letter dated

February 20, 2007. Zee and its promoters vide letter dated March 19 and

20, 2007 requested SEBI to keep the proceedings in abeyance since they

were in the process of making an application under RTI Act to DCA to

obtain a copy of DCA report. Zee and its promoters vide letters dated

March 27 and 28, 2007 respectively informed SEBI that they had filed

application under RTI Act to Ministry of Corporate Affairs (MCA) on

March 23, 2007. SEBI vide letter dated April 16, 2007 gave another

opportunity of hearing on April 26, 2007. Vide letters dated April 19,

2007, Zee and its promoters requested for further adjournment of the

proceedings since the application made under RTI to MCA was yet to be

disposed of. SEBI vide letter dated May 9, 2007 gave one more

opportunity of hearing on June 5, 2007. Vide letters dated May 24, 2007

and May 25, 2007, Zee and its promoters requested to keep the hearing in

abeyance. SEBI vide letter dated June 22, 2007 gave another opportunity

of personal hearing July 19, 2007. In the meanwhile, as per the

information provided by Zee and its promoters, their application under

RTI to MCA seems to have been rejected by MCA. Zee and its

promoters vide letters dated July 17, 2007 and July 28, 2007 informed

SEBI about their decision to file an application for settlement of the

matter in terms of SEBI Circular no. EFD/ED/CIR-1/2007 dated April

20, 2007 and requested to keep the proceedings in abeyance. The High

Power Advisory Committee (HPAC) however did not recommend the

case for settlement and the same was communicated to Zee and its

11

promoters vide letter dated December 19, 2007. Subsequently, SEBI vide

letter dated December 20, 2007 provided opportunity of personal hearing

to Zee and its promoters on January 4, 2008. The authorized

representatives of Zee and its promoter entities except Digital Super

Highway appeared for the hearing appeared for the said hearing and

made written submissions dated January 4, 2008 interalia as under:

(i) SEBI had submitted three investigation reports to the JPC. In the final report in September 2002, SEBI had exonerated Zee /Essel group from the charge of manipulation. Further, the report emphatically stated that the Essel group had not directly or indirectly traded in the shares of Zee.

(ii) At the material time, SEBI had no jurisdiction for inspection of records

which were under the domain of the Companies Act, 1956 and hence SEBI had advised DCA to carry out inspection and to furnish report on Zee and other Essel Group companies. Those reports of DCA were relied on by SEBI in formulating their reports submitted to JPC.

(iii) On the basis of observation and conclusion of SEBI and other regulatory

agencies in the respective investigation reports, JPC, in the report dated December 19, 2002 submitted to the Parliament, came to the conclusion that the Essel group companies did not deal in the shares of ZTL during the period 1.4.1999 to 31.3.2001.

(iv) In the JPC report, SEBI confirmed that majority of the funds were provided

by Zee group to KP entities during the period when the prices were falling and that the fall in prices appeared to be worldwide phenomenon.

(v) SEBI after its investigation and considering the financial transactions

between Essel Group companies and KP entities had come to the conclusion that Essel Group and ZTL had not manipulated their stocks.

(vi) ZTL neither entered into any transactions for purchase of its own shares

nor had any financial transactions /dealings with KP entities. There were no allegations to that effect in the SCN. ZTL had, in the course of this business, provided Inter Corporate Deposits (ICD) to certain entities of the Essel group on commercial terms and in compliance of all applicable laws including Companies Act. DCA has confirmed that ZTL had not violated

12

any laws in its transactions with Essel Group. ZTL cannot be held liable even if the Essel Group had misused the ICDs.

(vii) The reasons given in the SCN for the interest of Essel group and ZTL in

maintaining the share price of ZTL were as follows:

Reasons given in SCN Factual Position The price were falling globally It was a global phenomenon and

Essel group could not control it. The need for maintaining the prices to enable Delgrada to off load its holding

Delgrada sold substantial portion of its shares during the period October 2000 to December 2000, when the Essel Group did not have any transaction with KP entities. The sale during the period January to March 2001 was less. If indeed Essel group was involved in maintaining the price of ZTL as alleged, Delgrada would have sold the shares at a high price.

Preferential allotment to Goldman Sachs

The preferential allotment to Goldman Sachs was approved in the extra ordinary general meeting in October 1999 and completed by ZTL on January 24, 2000 and the first transaction between Essel Group and KP entities as stated in the SCN itself is only on April 25, 2000. Hence there can’t be any correlation between these transactions and the alleged transactions in the SCN.

(vii) The only reason that applies to ZTL in the above table is the preferential

allotment to Goldman Sachs. But that reason is patently erroneous as the preferential allotment had long been completed before the first of the financial transaction between Essel group and KP entities.

13

(viii) The financial relationship even between the Essel promoter companies and Ketan Parekh entities (KP entities) was posterior and not anterior to the KP entities building a significant stake in ZTL and also posterior to the rise and peaking of the price of ZTL shares in the stock market and this has been confirmed in the SEBI investigation reports and JPC reports.

(ix) It is an admitted fact that the documents and agreements between Essel group and KP entities are genuine, valid and effectual and bind the parties to the agreement and therefore the investigation into the end use of money is not relevant for the Essel Group.

(x) Even assuming the charges made in the SCN are legally tenable, the undisputed fact show that the transactions entered into by the KP entities did not have the effect of manipulating the market price of ZTL shares and synchronized trading per se is not violative of the SEBI Fraudulent Regulations.

13. I have carefully considered the facts of the case, the investigation report,

material relied upon and referred to in the show cause notices, the oral

and written submissions made by the noticees and other material

available on record.

13.1 I note that during the period October 1, 1999 to March 31, 2001, the price

of the scrip of Zee moved from Rs. 476 as on October 1, 1999 to reach a

high of Rs. 1555 as on February 25, 2000 and declined to Rs.121 as on

March 30, 2001. During this period, Ketan Parekh along with his related/

connected entities manipulated the stock market in a big way. In the

process, Ketan Parekh was found to have received large sums of money

from various banks as well as corporate houses when the stock indices

were falling rapidly. The buying and selling pattern of KP entities

suggested that they were involved in large scale creation of artificial

trading volumes and manipulation of price of various scrips including

Zee.

14

13.2 As mentioned earlier, the promoter companies of Zee had given an

amount of Rs.706.40 crore to the entities related to Ketan Parekh during

the period from May 2, 2000 to April 25, 2001. The flow of funds between

Essel group and Ketan Parekh Group is provided as below:

Date Essel Group

Co. KP entities

Amount (Rs. Crore)

Repaid Amt (Rs. Crore)

Repaid Date

Balance O/s (Rs. Crore)

25-Apr-00 Prajatma Classic Share

6.40 0.00 Not Applicable

6.40

25-Apr-00 Churu Trading Co. Pvt. Ltd.

Classic Share

6.40 0.00 Not Applicable

6.40

25-Apr-00 Briggs Trading Co. Pvt. Ltd.

Classic Share

6.40 0.00 Not Applicable

6.40

25-Apr-00 Ganjam Trading Co. Pvt. Ltd.

Classic Share

6.40 0.00 Not Applicable

6.40

25-Apr-00 Premier Fin Classic Share

6.40 0.00 Not Applicable

6.40

2-May-00 Ganjan Trading Co.

Classic Share

6.60 6.60 8Sep00-4.9, 13Oct00-1.70

0.00

2-May-00 Briggs Classic Share

6.60 6.60 15-Sep-00 0.00

2-May-00 Premier Fin Classic Share

6.60 6.60 12-Sep-00 0.00

2-May-00 Prajatma Classic Share

6.60 6.60 12Sep00-3.40, 15Sep00-3.20

0.00

2&4 May00 Churu Trading Classic Share

8.20 8.20 15Sep00-0.30, 3Oct00-7.90

0.00

23-May-00 Churu Trading Chitrakut Comp.

50.00 50.00 30-May-00 0.00

23-May-00 Premier Fin Nakshatra Soft

75.00 75.00 30-May-00 0.00

23-May-00 Ganjan Trading Co.

Goldfish Comp.

50.00 50.00 30-May-00 0.00

30-May-00 Premier Fin Chitrakut Comp.

40.00 23.50 3Jan01-16.00,

16.50

15

Date Essel Group Co.

KP entities

Amount (Rs. Crore)

Repaid Amt (Rs. Crore)

Repaid Date

Balance O/s (Rs. Crore)

4Jan01-7.50

31-May-00 Churu Trading Nakshatra Soft

30.00 18.00 4Oct00-8.00, 5Oct00-10.00

12.00

31-May-00 Ganjan Trading Co.

Goldfish Comp.

30.00 0.00 Not Applicable

30.00

18-Jan-01 Ganjan Trading Co.

Panther Investrade

25.00 0.00 Not Applicable

25.00

19-Jan-01 Prajatma Saimangal Investrade

25.00 0.00 Not Applicable

25.00

22-Jan-01 Churu Trading Saimangal Investrade

20.00 0.00 Not Applicable

20.00

22-Jan-01 Churu Trading Panther Investrade

20.00 0.00 Not Applicable

20.00

8-Mar-01 Digital Superhighway

Classic Credit

99.90 0.00 Not Applicable

99.90

8-Mar-01 Briggs Trading Co.

Classic Credit

49.90 0.00 Not Applicable

49.90

9-Mar-01 Briggs Trading Co.

Classic Credit

25.00 0.00 Not Applicable

25.00

9-Mar-01 Digital Superhighway

Classic Credit

50.00 0.00 Not Applicable

50.00

9-Mar-01 Prajatma Panther Fincap

50.00 0.00 Not Applicable

50.00

Total 706.40 251.10 455.30

13.3 From the above, it can be seen that during the period April 25, 2000 to

March 9, 2001, out of Rs.706.40 crore provided by Essel group to KP

entities, the Essel group received back Rs.251.10 crore with net

outstanding of 455.30 crore. The break up for the said financing as

provided by the Essel group is as follows - Rs.396.80 crore repeatedly

for purchase of shares and Rs. 309.80 crore as ICDs. It is pertinent to

note that Essel group companies did not receive any shares from the KP

entities whom they have provided finance from time to time for

purchase of shares.

16

13.4 I find that out of Rs. 309.60 crore provided by the promoter of Zee to KP

entities as ICDs all but Rs.58.5 crore was received back by the

promoters of Zee. Therefore majority of ICD amount was received back

by the Promoter companies of Zee while the whole amount provided

by them to KP entities for purchase of shares remained unpaid. To

illustrate, on April 25, 2000, 5 Promoter companies of Zee provided Rs.

32 crore to KP entity namely, Classic Share and Stock Brokers. However

Classic Share and Stock Brokers neither delivered the shares nor

returned the funds. After the aforesaid date i.e during May 2, 2000 to

May 31, 2000, the promoter companies of Zee provided Rs. 309.60 crore

to KP entities as ICDs, out of which they received back Rs. 251.10 crore.

Inspite of not receiving any shares for the Rs. 32 crore provided by

them to the aforesaid KP entity, the promoter companies of Zee

provided another Rs.364.80 crore during January to March 2001 to KP

entities for purchase of shares. I note that the promoter companies of

Zee had even taken a loan of Rs. 125 crore from GTB in March 2001,

which is admittedly arranged by KP entities and the whole amount was

transferred to KP entities. I note that at this point of time promoter

companies of Zee had neither got the shares for the funds provided to

KP entities nor they had received back the funds. Therefore, it is really

astonishing to find that the promoter companies of Zee even had taken

such a huge loan from GTB only to route the funds to Ketan Parekh

who had a large outstanding in the market as on that date. This gives a

strong indication that the said funds were provided by the promoters of

Zee to KP entities not for purchase of shares but for providing financial

assistance to KP entities.

17

13.5 Period wise summary of payment of funds by Essel group to the KP

entities are as follows:

Sl. No.

Date / Period Amount paid (in Rs. crore)

1. April 25, 2000 32.0

2. May 2 to 31, 2000 309.6

3. January 18 to 22, 2001 90.0

4. March 8 to 9, 2001 274.8

Total 706.40

From the above it can be seen that Essel Group provided Rs. 364.8 crore

to KP entities during the period January 18, 2001 to March 9, 2001 when

the liquidity problems of Shri Ketan Parekh was well known to every

one in the market. Despite the same, the Essel Group provided such

huge amount of funds to KP entities.

Entity wise break-up of the funds provided by the aforesaid six promoter entities is as follows:

Sl. No.

Name of the entity Amount financed to KP entities (in Rs. crore)

1. Briggs Trading Co. Pvt. Ltd. 87.9

2. Churu Trading Co. Pvt. Ltd. 134.6

3. Ganjam Trading Co. Pvt. Ltd. 118.0

4. Prajatma Trading Co. Pvt. Ltd. 88.0

5. Premier Finance 128.0

6. Digital Superhighway 149.9 Total 706.40

13.6 Zee was found to have given inter-corporate deposits (ICDs) to its

promoter companies to the tune of Rs. 496 crore when they were

advancing funds to KP entities. It was observed that on one hand Zee

18

was raising funds by preferential allotment of shares and on the other

hand, it was giving funds to the promoter entities. The promoter

entities advanced funds to KP entities claiming that they were helping

KP entities in their difficult times, as KP entities had substantial stakes

in the shares of Zee.

13.7 The summary of the said financing by Zee to Essel group is as follows

Sl. No.

Name of the Essel group entity Amount of ICD given by Zee

1. Briggs Trading Co. (P) Ltd Rs.106.75 crore

2. Ganjam Trading Co. Pvt. Ltd. Rs.102.84 crores

3. Prajatma Trading Co. Pvt. Ltd. Rs.116.31 crore

4. Premier Finance & Investment Co. Ltd.

Rs.170.04 crore

It was noticed that Zee had given an ICD of Rs.49.95 crore to Briggs on

March 8, 2001. Out of the said Rs. 49.95 crore received by Briggs from

Zee, it transferred almost the whole amount i.e. Rs. 49.90 crore to

Classic Credit Ltd., a KP entity. Shri Ashok Sanghvi, director of Briggs

Trading Company, in his statement to SEBI stated that the source of

funds for Briggs in giving the advance to KP entities was loan from Zee.

From the above, it appears that funds of Zee were routed to KP entities

through the above promoter companies of Zee and it appears that

instead of directly giving money to KP entities, Zee used its promoter

companies to fund KP entities in their manipulative design.

13.8 I note that there were financial dealings between KP group and

promoter companies of Zee, who have interalia submitted that they had

advanced the funds to KP entities related to Shri Ketan Parekh, either as

ICDs or under specific agreements to purchase shares of certain media

19

and broadcasting companies. While advancing under ICDs, they took a

firm undertaking from KP group to the effect that they would not

utilize the funds for purchasing shares of ZTL and Essel Packing Ltd.,

the listed company of Essel group. I further note that Ketan Parekh

admitted that companies belonging to his group had taken ICDs for

meeting their working capital requirement from Essel group companies

as well as received funds for acquisition of shares in media / software

companies as per specific agreements entered into between them.

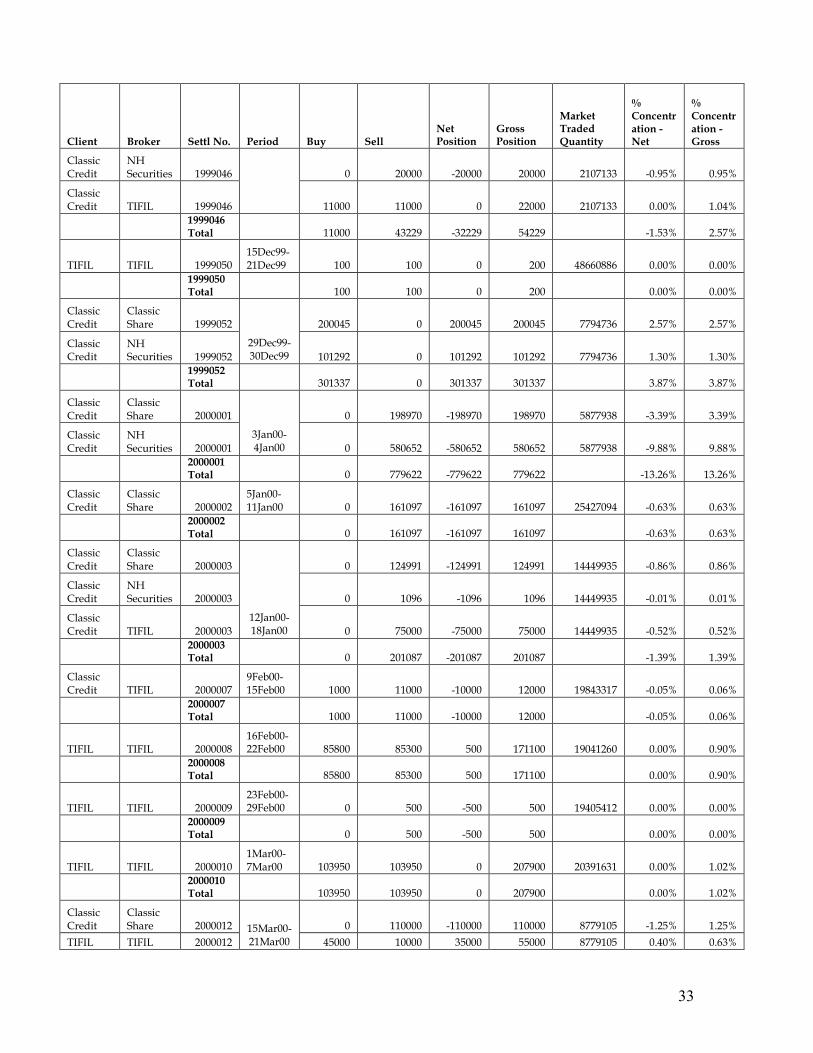
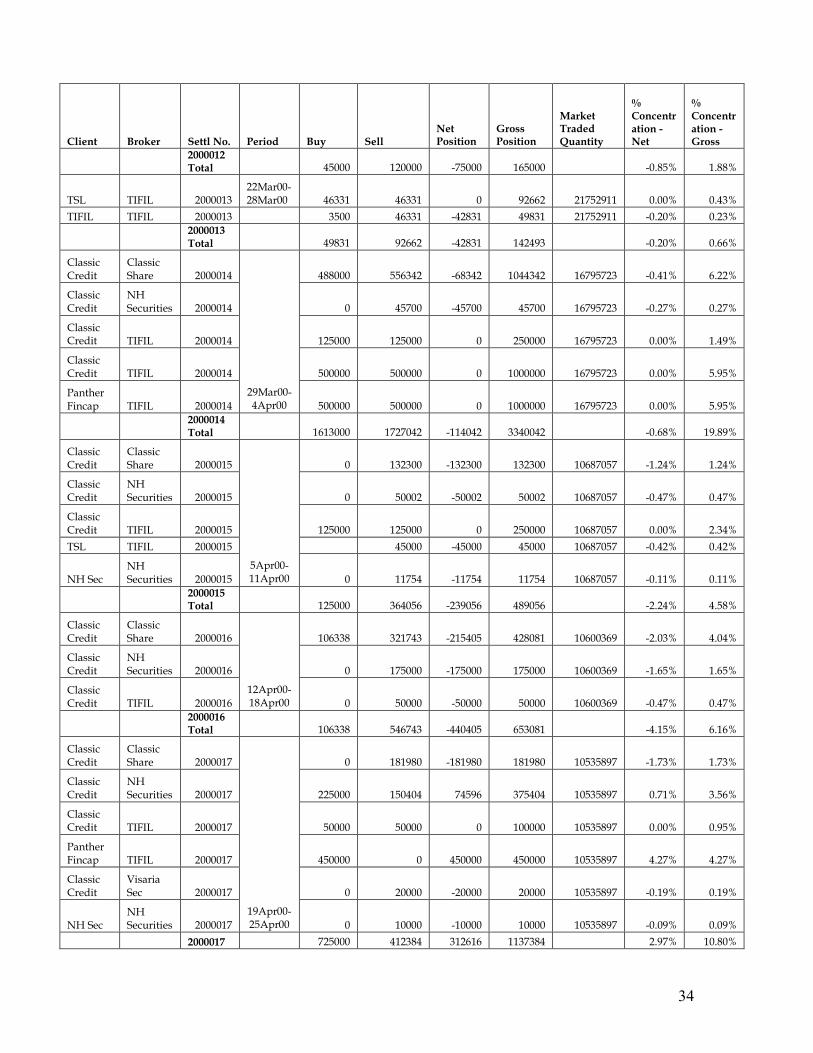
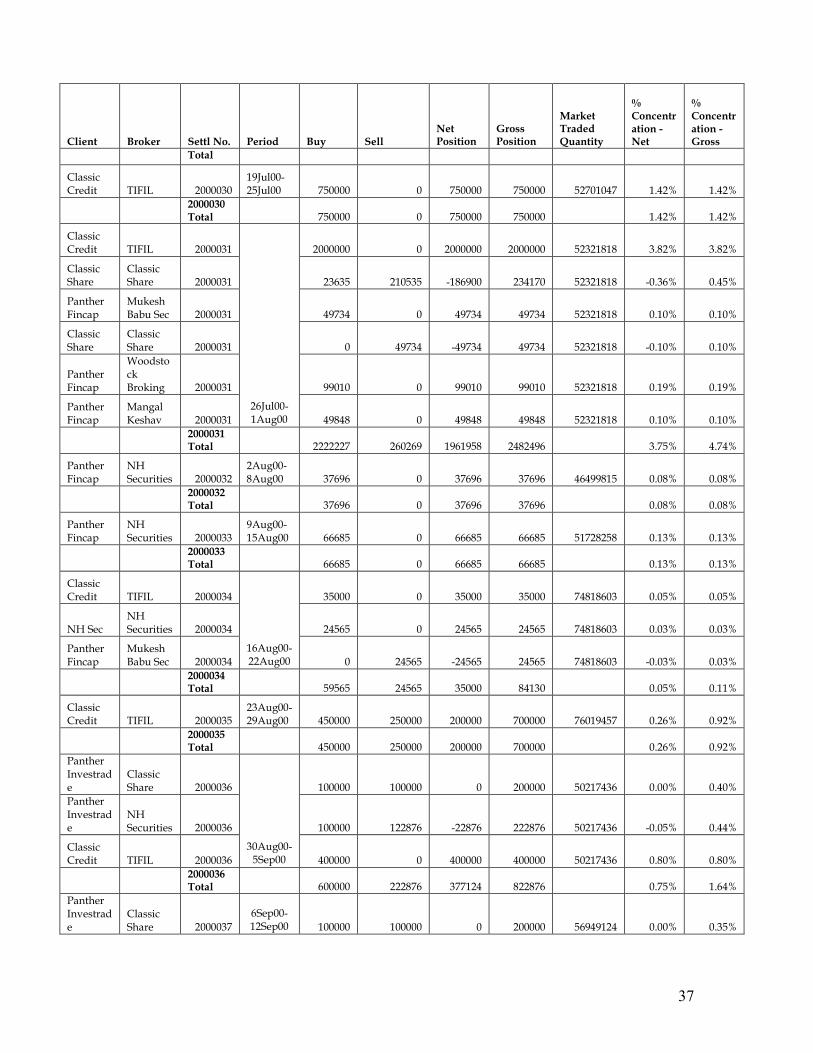
13.9 The details of the trading conducted by KP entities in Zee are not being

reproduced in the body of this order. However, for the sake of clarity,

the same is being attached herewith as Annexure ‘A’ which should be

treated as part of this order.

From the analysis of table provided in Annexure ‘A’, it is seen that

majority of the transactions were carried out after the scrip of Zee

reached a high of Rs. 1555 on February 25, 2000, thus making it actually

difficult to prove the promoters motive to manipulate the price of Zee.

This coupled with the fact that Delgrada Limited, one of the major

shareholders of Zee, off loaded large amount of shares of Zee which

makes it all the more difficult to accept the view that the promoters of

Zee made attempts to maintain its price.

13.10 Delgrada Limited, having its office at 6th floor Cerni House, Chausee,

Port Louise, Mauritius is one of the major shareholders of Zee. Mr.

Subhas Chandra, Chairman of Zee is the 100% beneficiary of Delgrada

20

Limited. It is noted that from March 31, 2001 to September 25, 2001,

Delgrada Ltd. offloaded 2.59 crore shares of Zee in the market.

a. Details of off-loading of shares by Delgrada during the

aforementioned period are as under :

Market price (BSE) (in Rs.) Sl. No.

Date High Low Close

No. of shares sold

1. 25/09/2000 443.80 423.55 442.50 475000

2. 29/09/2000 455.00 436.55 448.95 2000000

3. 16/10/2000 384.80 358.15 360.50 1450000

4. 27/10/2000 315.25 301.00 308.55 1500000

5. 07/11/2000 328.50 320.00 326.75 1500000

6. 21/12/2000 298.20 272.70 276.90 3500000

7. 26/12/2000 269.95 254.00 259.55 7500000

8. 27/12/2000 272.90 258.00 269.10 1250000

9. 12/02/2001 234.75 225.00 232.90 3750000

10. 08/03/2001 147.35 128.00 129.35 3000000 Total 2,59,05,000

I note that Zee and its promoter companies have contended that

Delgrada sold substantial portion of its shares during the period

September 2000 to December 2000, when the Essel Group did not have

any transaction with KP entities. They further submitted that if indeed

Essel group was involved in maintaining the price of ZTL as alleged,

Delgrada would have sold the shares at a high price. From the above

table, Delgrada had infact sold 1.91 crore shares of Zee during the

period September 2000 to December 2000. During the said period Essel

group did not provide any funds to KP entities when the price of the

scrip was in the range of Rs. 443 to Rs. 254. However, Essel Group

provided funds to KP entities during the period January 2001 to March

2001 when Delgrada offloaded total of 67 lakh shares of Zee.. It is

21

pertinent to note the fact that these sale transaction by Delgrada

between January 2001 to March 2001 were the price of the scrip of Zee

was in the range of Rs. 129 to Rs. 234. Therefore, the charge that funds

were provided to KP entities by Essel Group for maintaining the prices

when Delgrada offloaded the shares is difficult to prove.

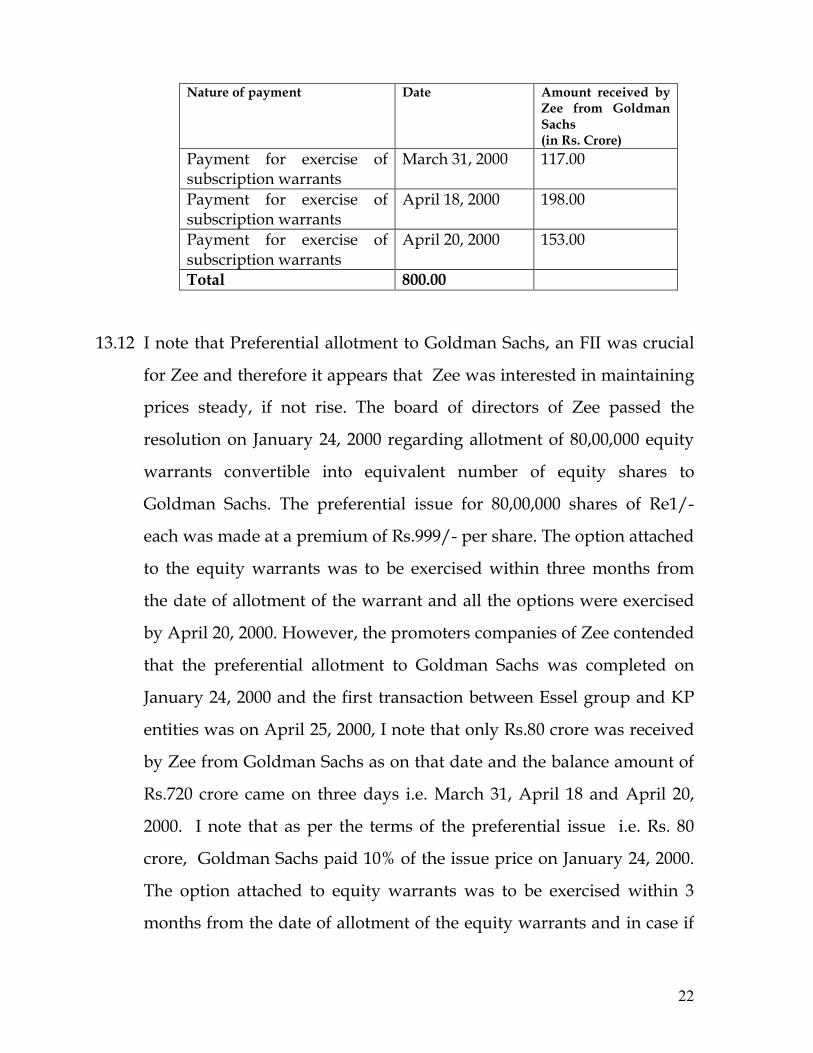
13.11 Further, it is alleged that the board of directors of Zee passed the

resolution on January 24, 2000 regarding allotment of equity warrants

to Goldman Sachs Investment (Mauritius) I Limited. It is also seen that

80,00,000 equity share warrants convertible into equivalent number of

equity shares were allotted to Goldman Sachs (Mauritius) I Limited.

On January 24, 2000, Goldman Sachs International (GSI), acting through

Goldman Sachs Asia LLC (GSALLC) as its placing agent, agreed to

issue to a client of GSALLC at a future date and the client agreed to

buy cash settled equity linked notes – participation certificates (PCs)

which referenced 8 million Zee shares. It was informed that the relevant

client was an international financial institution located in

Hong Kong. It is also necessary for the company to be performing well

in the market for the successful allotment to an FII.

b. Details of payments received from Goldman Sachs towards the

preferential issue of shares were as follows:

Nature of payment Date Amount received by

Zee from Goldman Sachs (in Rs. Crore)

Premium paid for subscription of warrants

January 24, 2000 80.00

Payment for exercise of subscription warrants

March 31, 2000 252.00

22

Nature of payment Date Amount received by Zee from Goldman Sachs (in Rs. Crore)

Payment for exercise of subscription warrants

March 31, 2000 117.00

Payment for exercise of subscription warrants

April 18, 2000 198.00

Payment for exercise of subscription warrants

April 20, 2000 153.00

Total 800.00

13.12 I note that Preferential allotment to Goldman Sachs, an FII was crucial

for Zee and therefore it appears that Zee was interested in maintaining

prices steady, if not rise. The board of directors of Zee passed the

resolution on January 24, 2000 regarding allotment of 80,00,000 equity

warrants convertible into equivalent number of equity shares to

Goldman Sachs. The preferential issue for 80,00,000 shares of Re1/-

each was made at a premium of Rs.999/- per share. The option attached

to the equity warrants was to be exercised within three months from

the date of allotment of the warrant and all the options were exercised

by April 20, 2000. However, the promoters companies of Zee contended

that the preferential allotment to Goldman Sachs was completed on

January 24, 2000 and the first transaction between Essel group and KP

entities was on April 25, 2000, I note that only Rs.80 crore was received

by Zee from Goldman Sachs as on that date and the balance amount of

Rs.720 crore came on three days i.e. March 31, April 18 and April 20,

2000. I note that as per the terms of the preferential issue i.e. Rs. 80

crore, Goldman Sachs paid 10% of the issue price on January 24, 2000.

The option attached to equity warrants was to be exercised within 3

months from the date of allotment of the equity warrants and in case if

23

the holder fails to do so the amount paid as deposit for exercise of the

option under warrant was to be forfeited. Therefore, though the balance

of Rs. 720 crore was received in March and April 2000, Goldman Sachs

was unlikely to withdraw from the issue as they had already paid Rs 80

crore and in case of their withdrawal from the issue they would have

lost the said amount.

13.13 I further note that Essel Group had produced copies of agreements to

contend that moneys advanced through ICDs to Ketan Parekh entities

with the clear understanding that the same should not be utilized for

the purchase of shares of Zee and Essel Packaging Ltd. (a group

company)

13.14 As regards the contention of the noticees that SEBI had relied upon the

investigation reports of DCA which had exonerated Zee and its

promoters from the charge of manipulation in the scrip of Zee, I agree

with the fact that the scope of DCA investigation was to find out

possible violation of Companies Act, 1956. The alleged financing by

Zee and its promoters to KP entities as mentioned in the show cause

notices are not covered under the provisions of Companies Act, 1956

and are to be examined under the provisions of SEBI (PFUTP)

Regulations. The findings of DCA which has examined the matter from

the angle of Companies Act has no bearing on the alleged violations of

SEBI(PFUTP) Regulations.

13.15 I am conscious of the fact that there is no direct evidence of the

involvement of Zee and its promoter companies in manipulation of the

scrip of Zee. I also note the contention of Zee that the transactions

24

entered into between them and KP entities did not have the effect of

manipulating the market price of Zee and synchronised trading per se

is not violative of SEBI (PFUTP) Regulations. However I am also

conscious of the fact that in almost all manipulation cases, considering

the market dynamics involved, it is always difficult to prove the

intention and the same has to be inferred from the mass of factual

details, sequence of events, accompanying circumstances, conduct of

the parties and the overall impact of such transactions etc. When seen

from this angle, on balance it is difficult to infer that Zee group entered

into transactions with KP entities with the intention of manuplating or

maintaining the price of Zee at a particular level.

13.16 As stated earlier, as proof of manipulation almost always depends on

inferences drawn from a mass of factual details. It is a matter of record

that by February-March 2001 it was in public domain that KP entities

were having huge positions and payment obligations. KP admittedly

was in financial difficulty. Still the noticees, for the reasons best known

to them only, but apparently for purchasing the media shares,

continued to give huge advances to KP entities. As KP and his entities

have now been established to have manipulated the securities market

in a big way, the entities who had facilitated KP entities in their design

to manipulate those scrips would definitely be considered having a

direct or indirect role in market manipulation. However, in the present

25

case, it is exceedingly difficult to prove facts which are especially within

the knowledge of parties concerned.

13.17 A cumulative view of the aforesaid findings, therefore, persuades me to

conclude that though the noticees were not involved directly in

manipulating the scrip of Zee but their conduct and actions give an

impression that they aided and abetted KP entities in large scale market

manipulation of various scrips including Zee.

14. Now therefore, I in exercise of powers conferred upon me under

Section 11 and 11B read with Section 19 of the SEBI Act, 1992, hereby

warn Zee Telefilms Ltd. (since changed to Zee Entertainment

Enterprises Ltd. ) and its promoters viz., Churu Trading Co. Pvt. Ltd.,

Briggs Tradings Co. Pvt. Ltd., Prajatma Trading Co. Pvt. Ltd., Ganjam

Trading Co. Pvt. Ltd., Premier Finance and Trading Co. Pvt. Ltd.,

Digital Super Highway Pvt. Ltd. I also direct Zee Telefilms and its

promoters to note that any similar activity and/or instances of

violations or non-compliance of the provisions of Securities and

Exchange Board of India Act and the Rules and Regulations framed

there under, in future, shall be dealt with stringently.

Date: March 19, 2008 T.C. Nair

Place: Mumbai Whole Time Member

Securities and Exchange Board of India

26

Annexure-A

Trading at BSE

Broker Settl No. Period Buy Sell Net Position

Gross Position

Market Traded Qty

% Concentration - Net

% Concentration - Gross

TSL 1999029 17500 0 17500 17500 2842667 0.62% 0.62%

Latin Manharlal 1999029 0 17500 -17500 17500 2842667 -0.62% 0.62%

Hem Securities 1999029 5500 9000 -3500 14500 2842667 -0.12% 0.51%

Hem Securities 1999029 500 500 0 1000 2842667 0.00% 0.04%

C J Dalal 1999029 36033 21933 14100 57966 2842667 0.50% 2.04%

Milan Mahendra 1999029 30100 16900 13200 47000 2842667 0.46% 1.65%

Vyomit 1999029 5000 15000 -10000 20000 2842667 -0.35% 0.70%

Woodstock Sec 1999029 5950 10950 -5000 16900 2842667 -0.18% 0.59%

Pravin V Shah 1999029 20000 13085 6915 33085 2842667 0.24% 1.16%

Consortium Sec 1999029

4Oct99-8Oct99 12000 0 12000 12000 2842667 0.42% 0.42%

1999029 Total 132583 104868 27715 237451 0.97% 8.35%

C J Dalal 1999030 5000 5000 0 10000 1707892 0.00% 0.59%

Pravin V Shah 1999030 5000 0 5000 5000 1707892 0.29% 0.29%

Consortium Sec 1999030

11Oct99-15Oct99 0 12000 -12000 12000 1707892 -0.70% 0.70%

1999030 Total 10000 5000 -7000 27000 -0.41% 1.58%

Hem Securities 1999031 1200 0 1200 1200 1671353 0.07% 0.07%

C J Dalal 1999031 2999 2999 0 5998 1671353 0.00% 0.36%

Milan Mahendra 1999031

18Oct99-22Oct99 5000 0 5000 5000 1671353 0.30% 0.30%

1999031 Total 9199 2999 6200 12198 0.37% 0.73%

Hem Securities 1999032

25Oct99-29Oct99 4633 0 4633 4633 2391439 0.19% 0.19%

27

Broker Settl No. Period Buy Sell Net Position

Gross Position

Market Traded Qty

% Concentration - Net

% Concentration - Gross

C J Dalal 1999032 12499 10249 2250 22748 2391439 0.09% 0.95%

Milan Mahendra 1999032 7500 0 7500 7500 2391439 0.31% 0.31%

Vyomit 1999032 4000 0 4000 4000 2391439 0.17% 0.17%

Pravin V Shah 1999032

3000 0 3000 3000 2391439 0.13% 0.13%

1999032 Total 31632 10249 21383 41881 0.89% 1.75%

Hem Securities 1999033 1000 0 1000 1000 2423463 0.04% 0.04%

Hem Securities 1999033 180 180 0 360 2423463 0.00% 0.01%

C J Dalal 1999033 15251 15051 200 30302 2423463 0.01% 1.25%

Pravin V Shah 1999033 5000 5000 0 10000 2423463 0.00% 0.41%

Consortium Sec 1999033

1Nov99-5Nov99 5000 0 5000 5000 2423463 0.21% 0.21%

1999033 Total 26431 20231 6200 46662 0.26% 1.93%

Hem Securities 1999034 7871 7000 871 14871 1371772 0.06% 1.08%

C J Dalal 1999034 13658 10400 3258 24058 1371772 0.24% 1.75%

Milan Mahendra 1999034 976 4500 -3524 5476 1371772 -0.26% 0.40%

Vyomit 1999034 0 2000 -2000 2000 1371772 -0.15% 0.15%

Pravin V Shah 1999034 0 3500 -3500 3500 1371772 -0.26% 0.26%

Consortium Sec 1999034

7Nov99-12Nov99 0 10000 -10000 10000 1371772 -0.73% 0.73%

1999034 Total 22505 27400 -14895 59905 -1.09% 4.37%

C J Dalal 1999035 2100 2100 0 4200 2380529 0.00% 0.18%

Consortium Sec 1999035

15Nov99-19Nov99 0 5000 -5000 5000 2380529 -0.21% 0.21%

1999035 Total 2100 7100 -5000 9200 -0.21% 0.39%

Hem Securities 1999036 2045 8549 -6504 10594 2191502 -0.30% 0.48%

Hem Securities 1999036 300 900 -600 1200 2191502 -0.03% 0.05%

C J Dalal 1999036 1400 1400 0 2800 2191502 0.00% 0.13%

Milan Mahendra 1999036 0 4476 -4476 4476 2191502 -0.20% 0.20%

Vyomit 1999036 0 2000 -2000 2000 2191502 -0.09% 0.09%

Pravin V Shah 1999036

22Nov99-26Nov99 0 4500 -4500 4500 2191502 -0.21% 0.21%

1999036 3745 21825 -18080 25570 -0.83% 1.17%

28

Broker Settl No. Period Buy Sell Net Position

Gross Position

Market Traded Qty

% Concentration - Net

% Concentration - Gross

Total

Hem Securities 1999037

29Nov99-3Dec99 0 300 -300 300 3125282 -0.01% 0.01%

1999037 Total 0 300 -300 300 -0.01% 0.01%

Hem Securities 1999038

6Dec99-10Dec99 1200 1200 0 2400 11027817 0.00% 0.02%

1999038 Total 1200 1200 0 2400 0.00% 0.02%

Hem Securities 1999039 98337 98337 0 196674 23181186 0.00% 0.85%

Hem Securities 1999039 7600 5100 2500 12700 23181186 0.01% 0.05%

C J Dalal 1999039 50000 50000 0 100000 23181186 0.00% 0.43%

Milan Mahendra 1999039 50000 50000 0 100000 23181186 0.00% 0.43%

Pravin V Shah 1999039

13Dec99-17Dec99 5363 5363 0 10726 23181186 0.00% 0.05%

1999039 Total 211300 208800 2500 420100 0.01% 1.81%

Hem Securities 1999040 75000 49550 25450 124550 28249606 0.09% 0.44%

Hem Securities 1999040 17400 17200 200 34600 28249606 0.00% 0.12%

C J Dalal 1999040 192133 192133 0 384266 28249606 0.00% 1.36%

Milan Mahendra 1999040 50000 30000 20000 80000 28249606 0.07% 0.28%

Woodstock Sec 1999040 25000 25000 0 50000 28249606 0.00% 0.18%

Pravin V Shah 1999040 50000 20000 30000 70000 28249606 0.11% 0.25%

Consortium Sec 1999040

20Dec99-24Dec99 40000 0 40000 40000 28249606 0.14% 0.14%

1999040 Total 409533 333883 115650 783416 0.41% 2.77%

TSL 1999041 25000 0 25000 25000 18795382 0.13% 0.13%

Hem Securities 1999041 365225 284743 80482 649968 18795382 0.43% 3.46%

Hem Securities 1999041 5100 5100 0 10200 18795382 0.00% 0.05%

C J Dalal 1999041 273352 201558 71794 474910 18795382 0.38% 2.53%

Milan Mahendra 1999041 110000 65000 45000 175000 18795382 0.24% 0.93%

Woodstock Sec 1999041 65000 30000 35000 95000 18795382 0.19% 0.51%

Pravin V Shah 1999041

27Dec99-30Dec99

30000 50000 -20000 80000 18795382 -0.11% 0.43%

29

Broker Settl No. Period Buy Sell Net Position

Gross Position

Market Traded Qty

% Concentration - Net

% Concentration - Gross

Consortium Sec 1999041

0 40000 -40000 40000 18795382 -0.21% 0.21%

1999041 Total 873677 676401 197276 1550078 1.05% 8.25%

TSL 1999042 0 25000 -25000 25000 15857717 -0.16% 0.16%

TSL 1999042 0 50 -50 50 15857717 0.00% 0.00%

Latin Manharlal 1999042 0 15000 -15000 15000 15857717 -0.09% 0.09%

Hem Securities 1999042 0 105932 -105932 105932 15857717 -0.67% 0.67%

Hem Securities 1999042 15000 29700 -14700 44700 15857717 -0.09% 0.28%

C J Dalal 1999042 128263 198263 -70000 326526 15857717 -0.44% 2.06%

Milan Mahendra 1999042 20000 85000 -65000 105000 15857717 -0.41% 0.66%

Woodstock Sec 1999042 0 35000 -35000 35000 15857717 -0.22% 0.22%

Pravin V Shah 1999042

3Jan00-7Jan00 0 99000 -99000 99000 15857717 -0.62% 0.62%

1999042 Total 163263 592945 -429682 756208 -2.71% 4.77%

TSL 1999043 1150 1000 150 2150 17228233 0.00% 0.01%

Hem Securities 1999043 0 43312 -43312 43312 17228233 -0.25% 0.25%

Hem Securities 1999043 8635 5000 3635 13635 17228233 0.02% 0.08%

C J Dalal 1999043 21000 34305 -13305 55305 17228233 -0.08% 0.32%

Pravin V Shah 1999043

10Jan00-14Jan00 44032 14032 30000 58064 17228233 0.17% 0.34%

1999043 Total 74817 97649 -22832 172466 -0.13% 1.00%

TSL 1999044 0 100 -100 100 15023821 0.00% 0.00%

Hem Securities 1999044 0 38737 -38737 38737 15023821 -0.26% 0.26%

Hem Securities 1999044 4000 5635 -1635 9635 15023821 -0.01% 0.06%

C J Dalal 1999044 0 50000 -50000 50000 15023821 -0.33% 0.33%

Milan Mahendra 1999044 0 26000 -26000 26000 15023821 -0.17% 0.17%

Pravin V Shah 1999044

17Jan00-21Jan00 0 44000 -44000 44000 15023821 -0.29% 0.29%

1999044 Total 4000 164472 -160472 168472 -1.07% 1.12%

Hem Securities 1999045 5481 5481 0 10962 13918439 0.00% 0.08%

Hem Securities 1999045

24Jan00-28Jan00

8000 3200 4800 11200 13918439 0.03% 0.08%

30

Broker Settl No. Period Buy Sell Net Position

Gross Position

Market Traded Qty

% Concentration - Net

% Concentration - Gross

C J Dalal 1999045 11328 11328 0 22656 13918439 0.00% 0.16%

1999045 Total 24809 20009 4800 44818 0.03% 0.32%

Hem Securities 1999046 100000 100000 0 200000 18708504 0.00% 1.07%

Hem Securities 1999046 9050 9240 -190 18290 18708504 0.00% 0.10%

C J Dalal 1999046 26748 26748 0 53496 18708504 0.00% 0.29%

Milan Mahendra 1999046 20000 20000 0 40000 18708504 0.00% 0.21%

Pravin V Shah 1999046 25000 25000 0 50000 18708504 0.00% 0.27%

Consortium Sec 1999046

31Jan00-4Feb00 1105 0 1105 1105 18708504 0.01% 0.01%

1999046 Total 181903 180988 915 362891 0.00% 1.94%

Hem Securities 1999047 37400 37400 0 74800 17283514 0.00% 0.43%

Hem Securities 1999047 0 2000 -2000 2000 17283514 -0.01% 0.01%

C J Dalal 1999047 145000 145000 0 290000 17283514 0.00% 1.68%

Milan Mahendra 1999047 41827 41827 0 83654 17283514 0.00% 0.48%

Pravin V Shah 1999047 35000 35000 0 70000 17283514 0.00% 0.41%

Consortium Sec 1999047

7Feb00-11Feb00 0 35500 -35500 35500 17283514 -0.21% 0.21%

1999047 Total 259227 261227 -37500 555954 -0.22% 3.22%

Hem Securities 1999048 0 15000 -15000 15000 17122383 -0.09% 0.09%

Hem Securities 1999048 10200 10600 -400 20800 17122383 0.00% 0.12%

C J Dalal 1999048 10000 20000 -10000 30000 17122383 -0.06% 0.18%

Consortium Sec 1999048

14Feb00-18Feb00 13500 13500 0 27000 17122383 0.00% 0.16%

1999048 Total 33700 59100 -25400 92800 -0.15% 0.54%

TSL 1999049 1000 1000 0 2000 18066437 0.00% 0.01%

Hem Securities 1999049 103800 95000 8800 198800 18066437 0.05% 1.10%

Hem Securities 1999049 2234 6044 -3810 8278 18066437 -0.02% 0.05%

C J Dalal 1999049 121831 130631 -8800 252462 18066437 -0.05% 1.40%

Milan Mahendra 1999049 115000 115000 0 230000 18066437 0.00% 1.27%

Pravin V 1999049

21Feb00-25Feb00 110000 110000 0 220000 18066437 0.00% 1.22%

31

Broker Settl No. Period Buy Sell Net Position

Gross Position

Market Traded Qty

% Concentration - Net

% Concentration - Gross

Shah

1999049 Total 453865 457675 -3810 911540 -0.02% 5.05%

Hem Securities 1999050 25000 25000 0 50000 16439000 0.00% 0.30%

Hem Securities 1999050 6300 1800 4500 8100 16439000 0.03% 0.05%

C J Dalal 1999050 70000 70000 0 140000 16439000 0.00% 0.85%

Milan Mahendra 1999050 25000 25000 0 50000 16439000 0.00% 0.30%

Pravin V Shah 1999050

28Feb00-3Mar00 15000 15000 0 30000 16439000 0.00% 0.18%

1999050 Total 141300 136800 4500 278100 0.03% 1.69%

TSL 1999051 3000 3000 0 6000 14415393 0.00% 0.04%

Hem Securities 1999051 8400 5400 3000 13800 14415393 0.02% 0.10%

C J Dalal 1999051

6Mar00-10Mar00 12225 12225 0 24450 14415393 0.00% 0.17%

1999051 Total 23625 20625 3000 44250 0.02% 0.31%

TSL 1999052 26854 0 26854 26854 14067217 0.19% 0.19%

Hem Securities 1999052 220000 20000 200000 240000 14067217 1.42% 1.71%

C J Dalal 1999052 220840 220840 0 441680 14067217 0.00% 3.14%

Milan Mahendra 1999052 100000 16000 84000 116000 14067217 0.60% 0.82%

Vyomit 1999052 16000 0 16000 16000 14067217 0.11% 0.11%

Woodstock Sec 1999052 40000 10000 30000 50000 14067217 0.21% 0.36%

Pravin V Shah 1999052

13Mar00-16Mar00 100000 11500 88500 111500 14067217 0.63% 0.79%

1999052 Total 723694 278340 445354 1002034 3.17% 7.12%

Hem Securities 1999053 20000 0 20000 20000 10914288 0.18% 0.18%

Hem Securities 1999053 2000 2000 0 4000 10914288 0.00% 0.04%

C J Dalal 1999053

21Mar00-24Mar00 68960 53330 15630 122290 10914288 0.14% 1.12%

1999053 Total 90960 55330 35630 146290 0.33% 1.34%

32

Trading at NSE

Client Broker Settl No. Period Buy Sell Net Position

Gross Position

Market Traded Quantity

% Concentration - Net

% Concentration - Gross

Classic Credit

NH Securities 1999039 0 2753 -2753 2753 3242326 -0.08% 0.08%

Classic Credit TIFIL 1999039

29 Sep 99 - 5Oct99 39000 10000 29000 49000 3242326 0.89% 1.51%

1999039 Total 39000 12753 26247 51753 0.81% 1.60%

Classic Credit

NH Securities 1999040 2753 0 2753 2753 2960536 0.09% 0.09%

Classic Credit TIFIL 1999040 14076 14076 0 28152 2960536 0.00% 0.95%

TIFIL TIFIL 1999040

6 Oct99 - 12Oct99 2900 2900 0 5800 2960536 0.00% 0.20%

1999040 Total 19729 16976 2753 36705 0.09% 1.24%

Classic Credit

NH Securities 1999041 710 0 710 710 1300779 0.05% 0.05%

Classic Credit TIFIL 1999041

13 Oct99-19 Oct99 11000 11000 0 22000 1300779 0.00% 1.69%

1999041 Total 11710 11000 710 22710 0.05% 1.75%

Classic Credit

NH Securities 1999042 0 14512 -14512 14512 2428471 -0.60% 0.60%

Classic Credit TIFIL 1999042

20 Oct99-26 Oct99 20000 20000 0 40000 2428471 0.00% 1.65%

1999042 Total 20000 34512 -14512 54512 -0.60% 2.24%

Classic Credit

NH Securities 1999043 0 8595 -8595 8595 2497528 -0.34% 0.34%

Classic Credit TIFIL 1999043

27 Oct99-2 Nov99 11000 11000 0 22000 2497528 0.00% 0.88%

1999043 Total 11000 19595 -8595 30595 -0.34% 1.23%

Classic Credit

NH Securities 1999044 0 1401 -1401 1401 2219212 -0.06% 0.06%

Classic Credit TIFIL 1999044

3 Nov99-9 Nov99 13500 13500 0 27000 2219212 0.00% 1.22%

1999044 Total 13500 14901 -1401 28401 -0.06% 1.28%

Classic Credit

NH Securities 1999045

10 Nov99-16 Nov99 15000 0 15000 15000 2799179 0.54% 0.54%

1999045 Total 15000 0 15000 15000 0.54% 0.54%

Classic Credit

Classic Share 1999046

17Nov99-23Nov99 0 12229 -12229 12229 2107133 -0.58% 0.58%

33

Client Broker Settl No. Period Buy Sell Net Position

Gross Position

Market Traded Quantity

% Concentration - Net

% Concentration - Gross

Classic Credit

NH Securities 1999046 0 20000 -20000 20000 2107133 -0.95% 0.95%

Classic Credit TIFIL 1999046

11000 11000 0 22000 2107133 0.00% 1.04%

1999046 Total 11000 43229 -32229 54229 -1.53% 2.57%

TIFIL TIFIL 1999050 15Dec99-21Dec99 100 100 0 200 48660886 0.00% 0.00%

1999050 Total 100 100 0 200 0.00% 0.00%

Classic Credit

Classic Share 1999052 200045 0 200045 200045 7794736 2.57% 2.57%

Classic Credit

NH Securities 1999052

29Dec99-30Dec99 101292 0 101292 101292 7794736 1.30% 1.30%

1999052 Total 301337 0 301337 301337 3.87% 3.87%

Classic Credit

Classic Share 2000001 0 198970 -198970 198970 5877938 -3.39% 3.39%

Classic Credit

NH Securities 2000001

3Jan00-4Jan00 0 580652 -580652 580652 5877938 -9.88% 9.88%

2000001 Total 0 779622 -779622 779622 -13.26% 13.26%

Classic Credit

Classic Share 2000002

5Jan00-11Jan00 0 161097 -161097 161097 25427094 -0.63% 0.63%

2000002 Total 0 161097 -161097 161097 -0.63% 0.63%

Classic Credit

Classic Share 2000003 0 124991 -124991 124991 14449935 -0.86% 0.86%

Classic Credit

NH Securities 2000003 0 1096 -1096 1096 14449935 -0.01% 0.01%

Classic Credit TIFIL 2000003

12Jan00-18Jan00 0 75000 -75000 75000 14449935 -0.52% 0.52%

2000003 Total 0 201087 -201087 201087 -1.39% 1.39%

Classic Credit TIFIL 2000007

9Feb00-15Feb00 1000 11000 -10000 12000 19843317 -0.05% 0.06%

2000007 Total 1000 11000 -10000 12000 -0.05% 0.06%

TIFIL TIFIL 2000008 16Feb00-22Feb00 85800 85300 500 171100 19041260 0.00% 0.90%

2000008 Total 85800 85300 500 171100 0.00% 0.90%

TIFIL TIFIL 2000009 23Feb00-29Feb00 0 500 -500 500 19405412 0.00% 0.00%

2000009 Total 0 500 -500 500 0.00% 0.00%

TIFIL TIFIL 2000010 1Mar00-7Mar00 103950 103950 0 207900 20391631 0.00% 1.02%

2000010 Total 103950 103950 0 207900 0.00% 1.02%

Classic Credit

Classic Share 2000012 0 110000 -110000 110000 8779105 -1.25% 1.25%

TIFIL TIFIL 2000012

15Mar00-21Mar00 45000 10000 35000 55000 8779105 0.40% 0.63%

34

Client Broker Settl No. Period Buy Sell Net Position

Gross Position

Market Traded Quantity

% Concentration - Net

% Concentration - Gross

2000012 Total 45000 120000 -75000 165000 -0.85% 1.88%

TSL TIFIL 2000013 22Mar00-28Mar00 46331 46331 0 92662 21752911 0.00% 0.43%

TIFIL TIFIL 2000013 3500 46331 -42831 49831 21752911 -0.20% 0.23%

2000013 Total 49831 92662 -42831 142493 -0.20% 0.66%

Classic Credit

Classic Share 2000014 488000 556342 -68342 1044342 16795723 -0.41% 6.22%

Classic Credit

NH Securities 2000014 0 45700 -45700 45700 16795723 -0.27% 0.27%

Classic Credit TIFIL 2000014 125000 125000 0 250000 16795723 0.00% 1.49%

Classic Credit TIFIL 2000014 500000 500000 0 1000000 16795723 0.00% 5.95%

Panther Fincap TIFIL 2000014

29Mar00-4Apr00 500000 500000 0 1000000 16795723 0.00% 5.95%

2000014 Total 1613000 1727042 -114042 3340042 -0.68% 19.89%

Classic Credit

Classic Share 2000015 0 132300 -132300 132300 10687057 -1.24% 1.24%

Classic Credit

NH Securities 2000015 0 50002 -50002 50002 10687057 -0.47% 0.47%

Classic Credit TIFIL 2000015 125000 125000 0 250000 10687057 0.00% 2.34%

TSL TIFIL 2000015 45000 -45000 45000 10687057 -0.42% 0.42%

NH Sec NH Securities 2000015

5Apr00-11Apr00 0 11754 -11754 11754 10687057 -0.11% 0.11%

2000015 Total 125000 364056 -239056 489056 -2.24% 4.58%

Classic Credit

Classic Share 2000016 106338 321743 -215405 428081 10600369 -2.03% 4.04%

Classic Credit

NH Securities 2000016 0 175000 -175000 175000 10600369 -1.65% 1.65%

Classic Credit TIFIL 2000016

12Apr00-18Apr00 0 50000 -50000 50000 10600369 -0.47% 0.47%

2000016 Total 106338 546743 -440405 653081 -4.15% 6.16%

Classic Credit

Classic Share 2000017 0 181980 -181980 181980 10535897 -1.73% 1.73%

Classic Credit

NH Securities 2000017 225000 150404 74596 375404 10535897 0.71% 3.56%

Classic Credit TIFIL 2000017 50000 50000 0 100000 10535897 0.00% 0.95%

Panther Fincap TIFIL 2000017 450000 0 450000 450000 10535897 4.27% 4.27%

Classic Credit

Visaria Sec 2000017 0 20000 -20000 20000 10535897 -0.19% 0.19%

NH Sec NH Securities 2000017

19Apr00-25Apr00 0 10000 -10000 10000 10535897 -0.09% 0.09%

2000017 725000 412384 312616 1137384 2.97% 10.80%

35

Client Broker Settl No. Period Buy Sell Net Position

Gross Position

Market Traded Quantity

% Concentration - Net

% Concentration - Gross

Total

Classic Credit

Classic Share 2000018 141453 853625 -712172 995078 18417863 -3.87% 5.40%

Classic Credit

NH Securities 2000018 0 125000 -125000 125000 18417863 -0.68% 0.68%

Classic Credit TIFIL 2000018 2200000 120000 2080000 2320000 18417863 11.29% 12.60%

Classic Credit

Visaria Sec 2000018

26Apr00-2May00 20000 20000 0 40000 18417863 0.00% 0.22%

2000018 Total 2361453 1118625 1242828 3480078 6.75% 18.90%

Classic Credit

Classic Share 2000019 0 150000 -150000 150000 28026660 -0.54% 0.54%

Classic Credit

NH Securities 2000019 0 100000 -100000 100000 28026660 -0.36% 0.36%

Classic Credit TIFIL 2000019 50000 50000 0 100000 28026660 0.00% 0.36%

Classic Credit

Visaria Sec 2000019

3May00-9May00 20000 20000 0 40000 28026660 0.00% 0.14%

2000019 Total 70000 320000 -250000 390000 -0.89% 1.39%

Classic Credit

Classic Share 2000020 215860 240565 -24705 456425 41673697 -0.06% 1.10%

Classic Credit TIFIL 2000020 50000 50000 0 100000 41673697 0.00% 0.24%

Classic Credit

Visaria Sec 2000020

10May00-

16May00 20000 20000 0 40000 41673697 0.00% 0.10%

2000020 Total 285860 310565 -24705 596425 -0.06% 1.43%

Classic Credit

Classic Share 2000021 282303 282303 0 564606 30876810 0.00% 1.83%

Classic Credit

NH Securities 2000021 182000 0 182000 182000 30876810 0.59% 0.59%

Classic Credit TIFIL 2000021 50000 50000 0 100000 30876810 0.00% 0.32%

Classic Credit

Visaria Sec 2000021

17May00-

23May00 270000 270000 0 540000 30876810 0.00% 1.75%

2000021 Total 784303 602303 182000 1386606 0.59% 4.49%

Classic Credit

Classic Share 2000022 130000 255000 -125000 385000 37282666 -0.34% 1.03%

Classic Credit

NH Securities 2000022 0 125000 -125000 125000 37282666 -0.34% 0.34%

Classic Credit TIFIL 2000022 40000 6340000 -6300000 6380000 37282666 -16.90% 17.11%

Classic Credit

Visaria Sec 2000022

24May00-

30May00 124564 124564 0 249128 33167702 0.00% 0.75%

2000022 Total 294564 6844564 -6550000 7139128 -17.57% 19.23%

Classic Credit

Classic Share 2000023

31May00-6Jun00 163327 163327 0 326654 33167702 0.00% 0.98%

36

Client Broker Settl No. Period Buy Sell Net Position

Gross Position

Market Traded Quantity

% Concentration - Net

% Concentration - Gross

Classic Credit TIFIL 2000023 494394 94394 400000 588788 33167702 1.21% 1.78%

Classic Credit

Visaria Sec 2000023 120000 120000 0 240000 33167702 0.00% 0.72%

Classic Share

Classic Share 2000023

0 10000 -10000 10000 33167702 -0.03% 0.03%

2000023 Total 777721 387721 390000 1165442 1.18% 3.51%

Classic Credit

Classic Share 2000024 152761 47761 105000 200522 34368892 0.31% 0.58%

Classic Credit

NH Securities 2000024 0 92 -92 92 34368892 0.00% 0.00%

Classic Credit TIFIL 2000024 1429394 94394 1335000 1523788 34368892 3.88% 4.43%

Classic Credit

Visaria Sec 2000024

7Jun00-13Jun00 120000 120000 0 240000 34368892 0.00% 0.70%

2000024 Total 1702155 262247 1439908 1964402 4.19% 5.72%

Classic Credit TIFIL 2000025 2514894 114394 2400500 2629288 46315695 5.18% 5.68%

Classic Credit

Visaria Sec 2000025 120000 120000 0 240000 46315695 0.00% 0.52%

Classic Share

Classic Share 2000025 20000 0 20000 20000 46315695 0.04% 0.04%

Classic Credit

Woodstock Broking 2000025 0 65643 -65643 65643 46315695 -0.14% 0.14%

NH Sec NH Securities 2000025

14Jun00-20Jun00 45643 0 45643 45643 46315695 0.10% 0.10%

2000025 Total 2700537 300037 2400500 3000574 5.18% 6.48%

Classic Credit

Classic Share 2000026 110000 700000 -590000 810000 47368102 -1.25% 1.71%

Classic Credit

NH Securities 2000026 0 650000 -650000 650000 47368102 -1.37% 1.37%

Classic Credit TIFIL 2000026

21Jun 00-27Jun00 1650000 0 1650000 1650000 47368102 3.48% 3.48%

2000026 Total 1760000 1350000 410000 3110000 0.87% 6.57%

Classic Credit TIFIL 2000027

28Jun00-4Jul00 342000 2000 340000 344000 43975183 0.77% 0.78%

2000027 Total 342000 2000 340000 344000 0.77% 0.78%

Classic Credit

Classic Share 2000028

5Jul00-11Jul00 0 3977 -3977 3977 46721716 -0.01% 0.01%

2000028 Total 0 3977 -3977 3977 -0.01% 0.01%

Panther Fincap

Classic Share 2000029 249100 0 249100 249100 68046097 0.37% 0.37%

Classic Credit TIFIL 2000029

12Jul00-18Jul00 910000 0 910000 910000 68046097 1.34% 1.34%

2000029 1159100 0 1159100 1159100 1.70% 1.70%

37

Client Broker Settl No. Period Buy Sell Net Position

Gross Position

Market Traded Quantity

% Concentration - Net

% Concentration - Gross

Total

Classic Credit TIFIL 2000030

19Jul00-25Jul00 750000 0 750000 750000 52701047 1.42% 1.42%

2000030 Total 750000 0 750000 750000 1.42% 1.42%

Classic Credit TIFIL 2000031 2000000 0 2000000 2000000 52321818 3.82% 3.82%

Classic Share

Classic Share 2000031 23635 210535 -186900 234170 52321818 -0.36% 0.45%

Panther Fincap

Mukesh Babu Sec 2000031 49734 0 49734 49734 52321818 0.10% 0.10%

Classic Share

Classic Share 2000031 0 49734 -49734 49734 52321818 -0.10% 0.10%

Panther Fincap

Woodstock Broking 2000031 99010 0 99010 99010 52321818 0.19% 0.19%

Panther Fincap

Mangal Keshav 2000031

26Jul00-1Aug00 49848 0 49848 49848 52321818 0.10% 0.10%

2000031 Total 2222227 260269 1961958 2482496 3.75% 4.74%

Panther Fincap

NH Securities 2000032

2Aug00-8Aug00 37696 0 37696 37696 46499815 0.08% 0.08%

2000032 Total 37696 0 37696 37696 0.08% 0.08%

Panther Fincap

NH Securities 2000033

9Aug00-15Aug00 66685 0 66685 66685 51728258 0.13% 0.13%

2000033 Total 66685 0 66685 66685 0.13% 0.13%

Classic Credit TIFIL 2000034 35000 0 35000 35000 74818603 0.05% 0.05%

NH Sec NH Securities 2000034 24565 0 24565 24565 74818603 0.03% 0.03%

Panther Fincap

Mukesh Babu Sec 2000034

16Aug00-22Aug00 0 24565 -24565 24565 74818603 -0.03% 0.03%

2000034 Total 59565 24565 35000 84130 0.05% 0.11%

Classic Credit TIFIL 2000035

23Aug00-29Aug00 450000 250000 200000 700000 76019457 0.26% 0.92%

2000035 Total 450000 250000 200000 700000 0.26% 0.92%

Panther Investrade

Classic Share 2000036 100000 100000 0 200000 50217436 0.00% 0.40%

Panther Investrade

NH Securities 2000036 100000 122876 -22876 222876 50217436 -0.05% 0.44%

Classic Credit TIFIL 2000036

30Aug00-5Sep00 400000 0 400000 400000 50217436 0.80% 0.80%

2000036 Total 600000 222876 377124 822876 0.75% 1.64%

Panther Investrade

Classic Share 2000037

6Sep00-12Sep00 100000 100000 0 200000 56949124 0.00% 0.35%

38

Client Broker Settl No. Period Buy Sell Net Position

Gross Position

Market Traded Quantity

% Concentration - Net

% Concentration - Gross

Classic Credit DKB 2000037 0 750000 -750000 750000 56949124 -1.32% 1.32%

Classic Credit TIFIL 2000037

1762000 0 1762000 1762000 56949124 3.09% 3.09%

2000037 Total 1862000 850000 1012000 2712000 1.78% 4.76%

Classic Credit

Classic Share 2000038 0 59000 -59000 59000 55196278 -0.11% 0.11%

Panther Investrade

Classic Share 2000038 50000 50000 0 100000 55196278 0.00% 0.18%

Classic Credit

NH Securities 2000038 0 34227 -34227 34227 55196278 -0.06% 0.06%

Saimangal Investrade

NH Securities 2000038 150000 150000 0 300000 55196278 0.00% 0.54%

Classic Credit TIFIL 2000038 1650000 0 1650000 1650000 55196278 2.99% 2.99%

NH Sec NH Securities 2000038 22576 0 22576 22576 55196278 0.04% 0.04%

Panther Fincap

Milan Mahendra Sec 2000038

13Sep00-19Sep00 0 22576 -22576 22576 55196278 -0.04% 0.04%

2000038 Total 1872576 315803 1556773 2188379 2.82% 3.96%

Classic Credit DKB 2000039 0 300000 -300000 300000 61417847 -0.49% 0.49%

Classic Credit TIFIL 2000039

20Sep00-26Sep00 675000 0 675000 675000 61417847 1.10% 1.10%

2000039 Total 675000 300000 375000 975000 0.61% 1.59%

Classic Credit

Classic Share 2000040 0 268 -268 268 51258188 0.00% 0.00%

Panther Fincap

NH Securities 2000040 0 761366 -761366 761366 51258188 -1.49% 1.49%

Classic Credit TIFIL 2000040 1450000 0 1450000 1450000 51258188 2.83% 2.83%

Panther Fincap TIFIL 2000040 550000 0 550000 550000 51258188 1.07% 1.07%

Panther Fincap

Visaria Sec 2000040

27Sep00-3Oct00 50000 50000 0 100000 51258188 0.00% 0.20%

2000040 Total 2050000 811634 1238366 2861634 2.42% 5.58%

Panther Fincap

Classic Share 2000041 308446 0 308446 308446 40582966 0.76% 0.76%

Panther Fincap

NH Securities 2000041 231815 0 231815 231815 40582966 0.57% 0.57%

Classic Credit TIFIL 2000041

4Oct00-10Oct00 200000 200000 0 400000 40582966 0.00% 0.99%

2000041 Total 740261 200000 540261 940261 1.33% 2.32%

39

Client Broker Settl No. Period Buy Sell Net Position

Gross Position

Market Traded Quantity

% Concentration - Net

% Concentration - Gross

Classic Credit DKB 2000042 0 200000 -200000 200000 68893557 -0.29% 0.29%

Classic Credit TIFIL 2000042

11Oct00-17Oct00 1450000 0 1450000 1450000 68893557 2.10% 2.10%

2000042 Total 1450000 200000 1250000 1650000 1.81% 2.39%

Classic Credit TIFIL 2000044

25Oct00-31Oct00 1500000 0 1500000 1500000 42409109 3.54% 3.54%

2000044 Total 1500000 0 1500000 1500000 3.54% 3.54%

Classic Credit TIFIL 2000045

1Nov00-7Nov00 625000 0 625000 625000 68308671 0.91% 0.91%

2000045 Total 625000 0 625000 625000 0.91% 0.91%

Classic Credit

NH Securities 2000046 816 0 816 816 65472506 0.00% 0.00%

Classic Credit TIFIL 2000046

8Nov00-14Nov00 1860000 0 1860000 1860000 65472506 2.84% 2.84%

2000046 Total 1860816 0 1860816 1860816 2.84% 2.84%

Panther Fincap

Visaria Sec 2000048

22Nov00-28Nov00 150000 150000 0 300000 55319629 0.00% 0.54%

2000048 Total 150000 150000 0 300000 0.00% 0.54%

Classic Credit TIFIL 2000049

29Nov00-5Dec00 8000 0 8000 8000 46405526 0.02% 0.02%

2000049 Total 8000 0 8000 8000 0.02% 0.02%

Chitrakut Comp

Classic Share 2000052 115000 115000 0 230000 62245721 0.00% 0.37%

Classic Credit DKB 2000052 0 2000000 -2000000 2000000 62245721 -3.21% 3.21%

Chitrakut Comp

NH Securities 2000052 200000 200000 0 400000 62245721 0.00% 0.64%

Classic Credit TIFIL 2000052 3960460 460460 3500000 4420920 62245721 5.62% 7.10%

Panther Fincap

Visaria Sec 2000052

20Dec00-26Dec00 250000 250000 0 500000 62245721 0.00% 0.80%

2000052 Total 4525460 3025460 1500000 7550920 2.41% 12.13%

Classic Infin

Classic Share 2000053 200000 0 200000 200000 58849801 0.34% 0.34%

Panther Fincap Keynote 2000053 50000 0 50000 50000 58849801 0.08% 0.08%

Classic Credit

MK Damani 2000053 100000 0 100000 100000 58849801 0.17% 0.17%

Panther Fincap Sunidhi 2000053 200000 200000 0 400000 58849801 0.00% 0.68%

Classic Credit TIFIL 2000053 2750000 0 2750000 2750000 58849801 4.67% 4.67%

Lunimant Invts TIFIL 2000053

27Dec00-2Jan01

1630000 0 1630000 1630000 58849801 2.77% 2.77%

40

Client Broker Settl No. Period Buy Sell Net Position

Gross Position

Market Traded Quantity

% Concentration - Net

% Concentration - Gross

TIFIL TIFIL 2000053 2300 2300 0 4600 58849801 0.00% 0.01%

Panther Fincap

Visaria Sec 2000053

0 275000 -275000 275000 58849801 -0.47% 0.47%

2000053 Total 4932300 477300 4455000 5409600 7.57% 9.19%

Panther Fincap Keynote 2001001 100000 100000 0 200000 70611718 0.00% 0.28%

Classic Credit

Khandwala Int. 2001001 375000 375000 0 750000 70611718 0.00% 1.06%

Panther Fincap

Mangal Keshav 2001001 150000 150000 0 300000 70611718 0.00% 0.42%

Classic Credit

MK Damani 2001001 0 100000 -100000 100000 70611718 -0.14% 0.14%

Panther Fincap Sunidhi 2001001 200000 200000 0 400000 70611718 0.00% 0.57%

Panther Fincap

Visaria Sec 2001001

3Jan01-9Jan01 595000 595000 0 1190000 70611718 0.00% 1.69%

2001001 Total 1420000 1520000 -100000 2940000 -0.14% 4.16%

Panther Fincap Keynote 2001002 400250 400000 250 800250 66309339 0.00% 1.21%

Classic Credit

Khandwala Int. 2001002 375000 225000 150000 600000 66309339 0.23% 0.90%

Panther Fincap

Mangal Keshav 2001002 150000 150000 0 300000 66309339 0.00% 0.45%

Classic Credit

MK Damani 2001002 100000 0 100000 100000 66309339 0.15% 0.15%

Panther Fincap Sunidhi 2001002 200000 200000 0 400000 66309339 0.00% 0.60%

Panther Fincap

Visaria Sec 2001002 305000 300000 5000 605000 66309339 0.01% 0.91%

Panther Fincap

Milan Mahendra Sec 2001002 181935 0 181935 181935 66309339 0.27% 0.27%

Classic Share

Classic Share 2001002

10Jan01-16Jan01 0 181935 -181935 181935 66309339 -0.27% 0.27%

2001002 Total 1712185 1456935 255250 3169120 0.38% 4.78%

Panther Fincap

Classic Share 2001003 0 79000 -79000 79000 85902136 -0.09% 0.09%

Panther Fincap Keynote 2001003 200000 150000 50000 350000 85902136 0.06% 0.41%

Classic Credit

Khandwala Int. 2001003 375000 375000 0 750000 85902136 0.00% 0.87%

Panther Fincap

Mangal Keshav 2001003 0 150000 -150000 150000 85902136 -0.17% 0.17%

Classic Credit

MK Damani 2001003 0 100000 -100000 100000 85902136 -0.12% 0.12%

Panther Fincap Sunidhi 2001003

17Jan01-23Jan01

200000 200000 0 400000 85902136 0.00% 0.47%

41

Client Broker Settl No. Period Buy Sell Net Position

Gross Position

Market Traded Quantity

% Concentration - Net

% Concentration - Gross

Classic Credit TIFIL 2001003 265000 1254000 -989000 1519000 85902136 -1.15% 1.77%

Panther Fincap

Visaria Sec 2001003 285000 270000 15000 555000 85902136 0.02% 0.65%

NH Sec NH Securities 2001003 39083 21517 17566 60600 85902136 0.02% 0.07%

Panther Fincap

Visaria Sec 2001003

0 39083 -39083 39083 85902136 -0.05% 0.05%

2001003 Total 1364083 2638600 -1274517 4002683 -1.48% 4.66%

Panther Fincap Keynote 2001004 355000 375000 -20000 730000 74587734 -0.03% 0.98%

Classic Credit

Khandwala Int. 2001004 125000 125000 0 250000 74587734 0.00% 0.34%

Panther Fincap

Mangal Keshav 2001004 150000 150000 0 300000 74587734 0.00% 0.40%

Panther Fincap

NH Securities 2001004 0 36370 -36370 36370 74587734 -0.05% 0.05%

Panther Fincap Sunidhi 2001004 200000 200000 0 400000 74587734 0.00% 0.54%

Classic Credit TIFIL 2001004 0 1325000 -1325000 1325000 74587734 -1.78% 1.78%

Panther Fincap

Visaria Sec 2001004

24Jan01-30Jan01 235000 235000 0 470000 74587734 0.00% 0.63%

2001004 Total 1065000 2446370 -1381370 3511370 -1.85% 4.71%

Panther Fincap Keynote 2001005 329500 329000 500 658500 62342950 0.00% 1.06%

Classic Credit

Khandwala Int. 2001005 129000 129000 0 258000 62342950 0.00% 0.41%

Panther Fincap

Mangal Keshav 2001005 90000 180000 -90000 270000 62342950 -0.14% 0.43%

Classic Credit

MK Damani 2001005 100000 0 100000 100000 62342950 0.16% 0.16%

Panther Fincap Sunidhi 2001005 200000 200000 0 400000 62342950 0.00% 0.64%

Classic Credit TIFIL 2001005 200000 1075000 -875000 1275000 62342950 -1.40% 2.05%

Panther Fincap

Visaria Sec 2001005

31Jan01-6Feb01 50000 180000 -130000 230000 62342950 -0.21% 0.37%

2001005 Total 1098500 2093000 -994500 3191500 -1.60% 5.12%

Classic Credit

Classic Share 2001006 0 994363 -994363 994363 78291579 -1.27% 1.27%

Panther Investrade

Classic Share 2001006 994363 0 994363 994363 78291579 1.27% 1.27%

Lunimant Invts CSFB 2001006 0 1500000 -1500000 1500000 78291579 -1.92% 1.92%

Classic Credit DKB 2001006

7Feb01-13Feb01

0 1000000 -1000000 1000000 78291579 -1.28% 1.28%

42

Client Broker Settl No. Period Buy Sell Net Position

Gross Position

Market Traded Quantity

% Concentration - Net

% Concentration - Gross

Classic Credit DKB 2001006 0 1000000 -1000000 1000000 78291579 -1.28% 1.28%

Panther Fincap Keynote 2001006 400000 500000 -100000 900000 78291579 -0.13% 1.15%

Classic Credit

Khandwala Int. 2001006 125000 125000 0 250000 78291579 0.00% 0.32%

Panther Fincap

Mangal Keshav 2001006 290000 290000 0 580000 78291579 0.00% 0.74%

Panther Fincap Sunidhi 2001006 300000 300000 0 600000 78291579 0.00% 0.77%

Classic Credit

Suresh CS Jain 2001006 10500 20000 -9500 30500 78291579 -0.01% 0.04%

Classic Credit TIFIL 2001006 5775000 775000 5000000 6550000 78291579 6.39% 8.37%

Panther Fincap

Visaria Sec 2001006

280000 280000 0 560000 78291579 0.00% 0.72%

2001006 Total 8174863 6784363 1390500 14959226 1.78% 19.11%

Panther Fincap Keynote 2001007 225000 25000 200000 250000 58591472 0.34% 0.43%

Classic Credit

Khandwala Int. 2001007 125000 125000 0 250000 58591472 0.00% 0.43%

Panther Fincap

Mangal Keshav 2001007 200000 200000 0 400000 58591472 0.00% 0.68%

Panther Fincap Sunidhi 2001007 300000 300000 0 600000 58591472 0.00% 1.02%

Classic Credit TIFIL 2001007 825000 825000 0 1650000 58591472 0.00% 2.82%

Panther Fincap

Visaria Sec 2001007

14Feb01-20Feb01 250000 265000 -15000 515000 58591472 -0.03% 0.88%

2001007 Total 1925000 1740000 185000 3665000 0.32% 6.26%

Lunimant Invts CSFB 2001008 0 1600000 -1600000 1600000 10616435 -15.07% 15.07%

Panther Fincap Keynote 2001008 0 100000 -100000 100000 10616435 -0.94% 0.94%

Panther Fincap

Mangal Keshav 2001008 200000 200000 0 400000 10616435 0.00% 3.77%

Classic Credit

MK Damani 2001008 200000 300000 -100000 500000 10616435 -0.94% 4.71%

Panther Fincap Sunidhi 2001008 0 100000 -100000 100000 10616435 -0.94% 0.94%

Classic Credit

Suresh CS Jain 2001008 100000 100000 0 200000 10616435 0.00% 1.88%

Classic Credit TIFIL 2001008 1600000 0 1600000 1600000 10616435 15.07% 15.07%

Panther Fincap

Visaria Sec 2001008 455000 470000 -15000 925000 10616435 -0.14% 8.71%

Classic Share

Classic Share 2001008

21Feb01-27Feb01

1056748 27036 1029712 1083784 10616435 9.70% 10.21%

43

Client Broker Settl No. Period Buy Sell Net Position

Gross Position

Market Traded Quantity

% Concentration - Net

% Concentration - Gross

Panther Fincap

Mukesh Babu Sec 2001008 0 43624 -43624 43624 10616435 -0.41% 0.41%

Panther Fincap

Woodstock Broking 2001008 0 188633 -188633 188633 10616435 -1.78% 1.78%

Panther Fincap

Mangal Keshav 2001008 0 191401 -191401 191401 10616435 -1.80% 1.80%

Panther Fincap

Milan Mahendra Sec 2001008

0 228915 -228915 228915 10616435 -2.16% 2.16%

2001008 Total 3611748 3549609 62139 7161357 0.59% 67.46%

Classic Credit DKB 2001009 0 3000000 -3000000 3000000 66828025 -4.49% 4.49%

Panther Fincap Keynote 2001009 50000 50000 0 100000 66828025 0.00% 0.15%

Panther Fincap

Mangal Keshav 2001009 200000 200000 0 400000 66828025 0.00% 0.60%

Classic Credit

MK Damani 2001009 200040 200040 0 400080 66828025 0.00% 0.60%

Panther Fincap Sunidhi 2001009 150000 0 150000 150000 66828025 0.22% 0.22%

Classic Credit TIFIL 2001009 21800 21800 0 43600 66828025 0.00% 0.07%

Panther Fincap

Visaria Sec 2001009 250000 250000 0 500000 66828025 0.00% 0.75%

Classic Share

Classic Share 2001009 0 26898 -26898 26898 66828025 -0.04% 0.04%

NH Sec NH Securities 2001009

28Feb01-6Mar01 0 25541 -25541 25541 66828025 -0.04% 0.04%

2001009 Total 871840 3774279 -2902439 4646119 -4.34% 6.95%

Panther Fincap

Mangal Keshav 2001010 100000 100000 0 200000 88460334 0.00% 0.23%

Panther Fincap Sunidhi 2001010 0 150000 -150000 150000 88460334 -0.17% 0.17%

Classic Credit TIFIL 2001010 80800 0 80800 80800 88460334 0.09% 0.09%

TIFIL TIFIL 2001010 45 45 0 90 88460334 0.00% 0.00%

Panther Fincap

Visaria Sec 2001010

7Mar01-13Mar01 250000 250000 0 500000 88460334 0.00% 0.57%

2001010 Total 430845 500045 -69200 930890 -0.08% 1.05%

Classic Credit Sunidhi 2001011 0 50000 -50000 50000 34110715 -0.15% 0.15%

TIFIL TIFIL 2001011

14Mar01-20Mar01 45 45 0 90 34110715 0.00% 0.00%

2001011 Total 45 50045 -50000 50090 -0.15% 0.15%

44


Recommended