Read Naturally ® Updated July 2013 Page 1 WWC Intervention Report U.S. DEPARTMENT OF EDUCATION What Works Clearinghouse ™ Beginning Reading Updated July 2013 Read Naturally ® Report Contents Overview p. 1 Program Information p. 3 Research Summary p. 4 Effectiveness Summary p. 5 References p. 8 Research Details for Each Study p. 14 Outcome Measures for Each Domain p. 21 Findings Included in the Rating for Each Outcome Domain p. 24 Supplemental Findings for Each Outcome Domain p. 29 Endnotes p. 30 Rating Criteria p. 31 Glossary of Terms p. 32 Program Description 1 The Read Naturally ® program is a supplemental reading program that aims to improve reading fluency, accuracy, and comprehension of elementary and middle school students using a combination of texts, audio CDs, and computer software. The program uses one of four products that share a common fluency-building strategy: Read Naturally ® Masters Edition, Read Naturally ® Encore, Read Naturally ® Software Edition, and Read Naturally ® Live. The common strategy includes: modeling of story reading, repeated reading of text for developing oral reading fluency, and systematic monitoring of student progress by teachers and the students themselves. Students work at their reading level, progress through the program at their own rate, and work (for the most part) on an independent basis. The program can be delivered in three ways: (1) students use audio CDs with hard- copy reading materials (Read Naturally ® Masters, Read Naturally ® Encore), (2) students use the computer-based version (Read Naturally ® Software Edition), or (3) students use the web-based version (Read Naturally ® Live). This intervention report includes studies of Read Naturally ® Masters Edition and Read Naturally ® Software Edition. Research 2 The What Works Clearinghouse (WWC) identified five studies of Read Naturally ® that both fall within the scope of the Beginning Reading topic area and meet WWC evidence standards. Four studies meet standards with- out reservations, and one study meets WWC evidence standards with reservations. Together, these studies included 484 beginning readers in grades 2–4 in more than 14 locations. The WWC considers the extent of evidence for Read Naturally ® on the reading skills of beginning readers to be small for two outcome domains—alphabetics and general reading achievement—and medium to large for two outcome domains—comprehension and reading fluency. (See the Effectiveness Summary on p. 5 for further description of all domains.) Effectiveness Read Naturally ® was found to have no discernible effects on alphabetics and comprehension, mixed effects on reading fluency, and potentially positive effects on general reading achievement for beginning readers.
Transcript
Read Naturally® Updated July 2013 Page 1
WWC Intervention Report U.S. DEPARTMENT OF EDUCATION
What Works Clearinghouse™
Beginning Reading Updated July 2013
Read Naturally® Report Contents
Overview p. 1
Program Information p. 3
Research Summary p. 4
Effectiveness Summary p. 5
References p. 8
Research Details for Each Study p. 14
Outcome Measures for Each Domain p. 21
Findings Included in the Rating for Each Outcome Domain p. 24
Supplemental Findings for Each Outcome Domain p. 29
Endnotes p. 30
Rating Criteria p. 31
Glossary of Terms p. 32
Program Description1 The Read Naturally® program is a supplemental reading program that aims to improve reading fluency, accuracy, and comprehension of elementary and middle school students using a combination of texts, audio CDs, and computer software. The program uses one of four products that share a common fluency-building strategy: Read Naturally® Masters Edition, Read Naturally® Encore, Read Naturally® Software Edition, and Read Naturally® Live. The common strategy includes: modeling of story reading, repeated reading of text for developing oral reading fluency, and systematic monitoring of student progress by teachers and the students themselves. Students work at their reading level, progress through the program at their own rate, and work (for the most part) on an independent basis. The program can be delivered in three ways: (1) students use audio CDs with hard-copy reading materials (Read Naturally® Masters, Read Naturally® Encore), (2) students use the computer-based version (Read Naturally® Software Edition), or (3) students use the web-based version (Read Naturally® Live). This intervention report includes studies of Read Naturally® Masters Edition and Read Naturally® Software Edition.
Research2 The What Works Clearinghouse (WWC) identified five studies of Read Naturally® that both fall within the scope of the Beginning Reading topic area and meet WWC evidence standards. Four studies meet standards with-out reservations, and one study meets WWC evidence standards with reservations. Together, these studies included 484 beginning readers in grades 2–4 in more than 14 locations.
The WWC considers the extent of evidence for Read Naturally® on the reading skills of beginning readers to be small for two outcome domains—alphabetics and general reading achievement—and medium to large for two outcome domains—comprehension and reading fluency. (See the Effectiveness Summary on p. 5 for further description of all domains.)
EffectivenessRead Naturally® was found to have no discernible effects on alphabetics and comprehension, mixed effects on reading fluency, and potentially positive effects on general reading achievement for beginning readers.
Read Naturally® Updated July 2013 Page 2
WWC Intervention Report
Table 1. Summary of findings3
Improvement index (percentile points)
Outcome domain Rating of effectiveness Average RangeNumber of
studiesNumber of students
Extent of evidence
Alphabetics No discernible effects +2 –2 to +5 2 264 Small
Reading fluency Mixed effects +7 +1 to +18 4 440 Medium to large
Comprehension No discernible effects 0 –16 to +9 4 439 Medium to large
General reading achievement
Potentially positive effects +10 +6 to +17 2 126 Small
Read Naturally® Updated July 2013 Page 3
Program Information
3
WWC Intervention Report
BackgroundDeveloped by Candyce Ihnot, the four Read Naturally® products are distributed by Read Naturally, Inc. Address: 2945 Lone Oak Drive, Suite #190, Saint Paul, MN 55121. Email: [email protected]. Web: www.readnaturally.com. Telephone: (651) 425-4058 or (800) 788-4085. Fax: (651) 452-9204.
Program detailsThe Read Naturally® program can be implemented using one of four products: Read Naturally® Masters Edition, Read Naturally® Encore, Read Naturally® Software Edition, and Read Naturally® Live. These products share a common fluency-building strategy and are designed to supplement a school’s core language arts instruction. The program aims to improve fluency, accuracy, and comprehension by increasing the time students spend reading, and can be used during class time as a pull-out intervention during the school day or as part of an after-school program. The core strategy in all Read Naturally® products includes:
• Modeling of story reading. Students listen to, and read along with, a recording of a fluent reader reading a story to help students model correct pronunciation, rate, and expression.
• Repeated reading of text to develop oral reading fluency. Students engage in 1-minute practice readings to build their mastery of the passage. Once students feel they can achieve their reading speed goal, they alert the teacher. The teacher then conducts a “pass timing” during which students are evaluated against four criteria: (1) student reaches goal rate, (2) student makes three or fewer errors, (3) passage is read with appropriate phras-ing, and (4) comprehension questions are answered correctly. If students do not meet these criteria, they spend additional time practicing the reading of the passage, and then the teacher conducts the “pass timing” again.
• Progress monitoring. Students graph their scores to track their progress from the initial reading to the final reading of each story. The graphs also show students’ progress over successive stories. These tools aim to ensure teacher and student awareness of each student’s progress.
The four Read Naturally® products differ in (1) their delivery mode, (2) the specific sequenced texts used, and (3) whether phonics instruction is included. Read Naturally® Masters Edition and Read Naturally® Encore use audio CDs in con-junction with hard-copy reading materials. Read Naturally® Software Edition and Read Naturally® Live are computer- or web-based, respectively. The particular texts vary by product, but all include a series of sequenced texts. Read Naturally® Software Edition, Read Naturally® Encore, and Read Naturally® Live also include instruction in phonics.
Each Read Naturally® product includes a teacher’s manual that includes the rationale for the program, descriptions of materials needed to implement the program, instructions for implementing the program, and lesson plans for introducing the program to students.
Cost Individual Read Naturally® materials vary in price. Products using audio CDs (Read Naturally® Masters Edition or Read Naturally® Encore) cost $129 per set. Read Naturally® Software Edition costs $125 per reading level for one computer and $399 per level for a school network version. Read Naturally® Live, the online software version, is priced per seat, ranging from $149 for one seat to $1,999 for 130 seats. Teacher training is available at an additional cost. Additional materials, including timers, posters, glossaries, crossword puzzles, and assessment materials, are also available.
Research SummaryThe WWC identified 58 studies that investigated the effects of Read Naturally® on the reading skills of beginning readers.
The WWC reviewed 11 of those studies against group design evidence standards. Four studies (Arvans, 2010; Christ & Davie, 2009; Hancock, 2002; Kemp, 2006) are randomized controlled trials that meet WWC evi-dence standards without reservations, and one study (Heistad, 2008) is a quasi-experimental design that meets WWC evidence standards with reservations. Those five studies are summarized in this report. Six studies do not meet WWC evidence standards. The remaining 47 studies do not meet WWC eligibil-ity screens for review in this topic area. Citations for all 58 studies are in the References section, which begins on p. 8.
Table 2. Scope of reviewed research
Grade 2, 3, 4
Delivery method Individual/Small group
Program type Supplement
Summary of studies meeting WWC evidence standards without reservationsArvans (2010) conducted a randomized controlled trial of second- through fourth-grade students from one Mid-western elementary school. Students were randomly assigned to intervention and comparison groups using block randomization procedures. Students were paired based on pretest scores, grade, race, and gender, and then randomly assigned to either the Read Naturally® group or the comparison group. Students in the comparison group received their classroom’s normal reading instruction.4 The final analysis sample consisted of 82 students.
Christ and Davie (2009) randomly assigned 109 third-grade students from six schools in four Midwestern school districts to either a Read Naturally® group or a comparison group. Students were deemed eligible for the study if they scored at or below the 40th percentile on measures of oral reading fluency and reading comprehension. Stu-dents in the comparison group received their classroom’s normal reading instruction, with no supplemental fluency instruction. The analysis sample consisted of 106 students.
Hancock (2002) conducted a randomized controlled trial of second-grade students in five classrooms from one school in Arizona.5 Students were randomly assigned to intervention and comparison groups using block randomization procedures. Students were pretested, matched with a similarly-performing peer in their classroom, and then randomly assigned to either the intervention group or the comparison group. Forty-eight students were in the Read Naturally® group, and 46 students were in the comparison group,6 which received a supplemental mathematics intervention.
Kemp (2006) conducted a randomized controlled trial of third-grade students in three schools in a school district in Orange County, California. From 13 study classrooms, an initial sample of 168 students was randomly assigned to inter-vention and comparison groups using block randomization procedures. Within each classroom, students were assigned to pairs based on their scores from the reading portion of the California Standards Test from the previous spring. One member from each pair was randomly assigned to the intervention group, and the other member was randomly assigned to the comparison group. Comparison students participated in structured sustained silent reading; these reading ses-sions occurred concurrently with sessions of Read Naturally®. The final analysis sample consisted of 158 students.
Summary of study meeting WWC evidence standards with reservationsHeistad (2008) examined the effects of Read Naturally® on the reading achievement of third-grade students who were enrolled in elementary schools in the Minneapolis Public School District. Students in three Read Naturally® elementary schools that were implementing Read Naturally® were matched with comparison students from other schools in the same district based on pretest score, grade, demographic variables, and the Adequate Yearly Prog-ress (AYP) status of their school. Read Naturally® was implemented as a supplemental reading intervention with individual and small groups of students. Two schools implemented Read Naturally® as a pull-out intervention during the school day, while one school used it as part of an after-school program. Students in the comparison group attended schools that were not implementing Read Naturally®. A total of 44 students were included in the study’s analysis, with 22 students in each of the intervention and comparison groups.
Read Naturally® Updated July 2013 Page 5
WWC Intervention Report
Effectiveness SummaryThe WWC review of Read Naturally® for the Beginning Reading topic area includes student outcomes in four domains: alphabetics, reading fluency, comprehension, and general reading achievement. The five studies of Read Naturally® that meet WWC evidence standards reported findings in all four domains. The findings below present the authors’ estimates and WWC-calculated estimates of the size and statistical significance of the effects of Read Naturally® on beginning readers. For a more detailed description of the rating of effectiveness and extent of evidence criteria, see the WWC Rating Criteria on p. 31.
Summary of effectiveness for the alphabetics domainTwo studies that meet WWC standards without reservations reported findings in the alphabetics domain.
Christ and Davie (2009) examined two outcomes in the alphabetics domain: the Test of Word Reading Efficiency (TOWRE) and the Woodcock Reading Mastery Tests–Revised (WRMT-R) Word Identification subtest. The authors found no statistically significant differences between the Read Naturally® and comparison groups on either of these measures. According to WWC criteria, the average effect was not large enough to be considered substantively impor-tant (that is, an effect size of at least 0.25). The WWC characterizes these study findings as an indeterminate effect.
Kemp (2006) examined four outcomes in the alphabetics domain: the TOWRE Sight Word Efficiency and Phonetic Decoding Efficiency subtests, the Rosner Auditory Analysis Test, and the Orthographic Choice Test. The author found no statistically significant differences between the Read Naturally® and comparison groups on any of these four measures. The average effect across the four measures was not large enough to be considered substantively important according to WWC criteria. Thus, the WWC characterizes these study findings as an indeterminate effect.
Thus, for the alphabetics domain, two studies showed an indeterminate effect, with no studies showing a statistically significant or substantively important positive effect, and no studies showing a statistically significant or substantively important negative effect. This results in a rating of no discernible effects, with a small extent of evidence.
Table 3. Rating of effectiveness and extent of evidence for the alphabetics domainRating of effectiveness Criteria met
No discernible effectsNo affirmative evidence of effects.
In the two studies that reported findings, the estimated impact of the intervention on outcomes in the alphabetics domain was neither statistically significant nor large enough to be substantively important.
Extent of evidence Criteria met
Small Two studies that included 264 students in nine schools reported evidence of effectiveness in the alphabetics domain.
Summary of effectiveness for the reading fluency domainFour studies that meet WWC standards without reservations reported findings in the reading fluency domain.
Arvans (2010) did not find a statistically significant effect of Read Naturally® on the Dynamic Indicators of Basic Early Literacy Skills (DIBELS) Oral Reading Fluency subtest. The effect was not large enough to be considered substan-tively important according to WWC criteria. The WWC characterizes this study finding as an indeterminate effect.
Christ and Davie (2009) reported, and the WWC confirmed, positive and statistically significant differences between the Read Naturally® group and the comparison group on three measures of reading fluency: the DIBELS Curricu-lum-Based Measurement–Reading (CBM-R) passages, and the Gray Oral Reading Tests, Fourth Edition (GORT-4) Fluency and Accuracy subtests. The WWC characterizes these study findings as a statistically significant positive effect because the effect for at least one measure within the domain is positive and statistically significant, and no effects are negative and statistically significant.
Read Naturally® Updated July 2013 Page 6
WWC Intervention Report
The Hancock (2002) study findings for this domain are based on students’ performance on the Curriculum-Based Measurement: Test of Reading Fluency (TORF). The study author did not find a statistically significant effect of Read Naturally® on the reading fluency measure, and the effect was not large enough to be considered substantively important according to WWC criteria. The WWC characterizes this study finding as an indeterminate effect.
Kemp (2006) did not find a statistically significant effect of Read Naturally® on the DIBELS Oral Reading Fluency subtest, and the effect was not large enough to be considered substantively important according to WWC criteria. The WWC characterizes this study finding as an indeterminate effect.
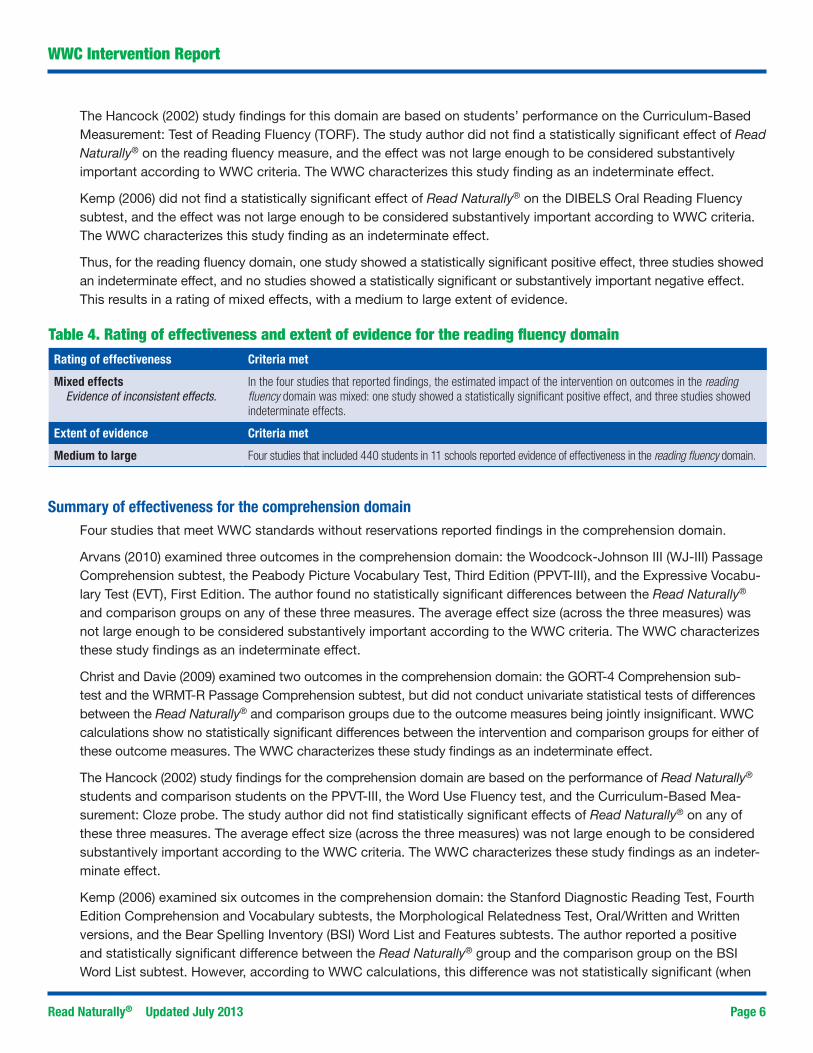
Thus, for the reading fluency domain, one study showed a statistically significant positive effect, three studies showed an indeterminate effect, and no studies showed a statistically significant or substantively important negative effect. This results in a rating of mixed effects, with a medium to large extent of evidence.
Table 4. Rating of effectiveness and extent of evidence for the reading fluency domainRating of effectiveness Criteria met
Mixed effectsEvidence of inconsistent effects.
In the four studies that reported findings, the estimated impact of the intervention on outcomes in the reading fluency domain was mixed: one study showed a statistically significant positive effect, and three studies showed indeterminate effects.
Extent of evidence Criteria met
Medium to large Four studies that included 440 students in 11 schools reported evidence of effectiveness in the reading fluency domain.
Summary of effectiveness for the comprehension domainFour studies that meet WWC standards without reservations reported findings in the comprehension domain.
Arvans (2010) examined three outcomes in the comprehension domain: the Woodcock-Johnson III (WJ-III) Passage Comprehension subtest, the Peabody Picture Vocabulary Test, Third Edition (PPVT-III), and the Expressive Vocabu-lary Test (EVT), First Edition. The author found no statistically significant differences between the Read Naturally® and comparison groups on any of these three measures. The average effect size (across the three measures) was not large enough to be considered substantively important according to the WWC criteria. The WWC characterizes these study findings as an indeterminate effect.
Christ and Davie (2009) examined two outcomes in the comprehension domain: the GORT-4 Comprehension sub-test and the WRMT-R Passage Comprehension subtest, but did not conduct univariate statistical tests of differences between the Read Naturally® and comparison groups due to the outcome measures being jointly insignificant. WWC calculations show no statistically significant differences between the intervention and comparison groups for either of these outcome measures. The WWC characterizes these study findings as an indeterminate effect.
The Hancock (2002) study findings for the comprehension domain are based on the performance of Read Naturally® students and comparison students on the PPVT-III, the Word Use Fluency test, and the Curriculum-Based Mea-surement: Cloze probe. The study author did not find statistically significant effects of Read Naturally® on any of these three measures. The average effect size (across the three measures) was not large enough to be considered substantively important according to the WWC criteria. The WWC characterizes these study findings as an indeter-minate effect.
Kemp (2006) examined six outcomes in the comprehension domain: the Stanford Diagnostic Reading Test, Fourth Edition Comprehension and Vocabulary subtests, the Morphological Relatedness Test, Oral/Written and Written versions, and the Bear Spelling Inventory (BSI) Word List and Features subtests. The author reported a positive and statistically significant difference between the Read Naturally® group and the comparison group on the BSI Word List subtest. However, according to WWC calculations, this difference was not statistically significant (when
Read Naturally® Updated July 2013 Page 7
WWC Intervention Report
adjusted for multiple comparisons), and the average effect across the six outcomes was not large enough to be considered substantively important. The WWC characterizes these study findings as an indeterminate effect.
Thus, for the comprehension domain, there were four studies showing an indeterminate effect, with no studies showing a statistically significant or substantively important positive effect, and no studies showing a statistically significant or substantively important negative effect. This results in a rating of no discernible effects, with a medium to large extent of evidence.
Table 5. Rating of effectiveness and extent of evidence for the comprehension domainRating of effectiveness Criteria met
No discernible effectsNo affirmative evidence of effects.
In the four studies that reported findings, the estimated impact of the intervention on outcomes in the comprehen-sion domain was neither statistically significant nor large enough to be substantively important.
Extent of evidence Criteria met
Medium to large Four studies that included 439 students in 11 schools reported evidence of effectiveness in the comprehension domain.
Summary of effectiveness for the general reading achievement domainTwo studies that meet WWC standards—one without reservations and one with reservations—reported findings in the general reading achievement domain.
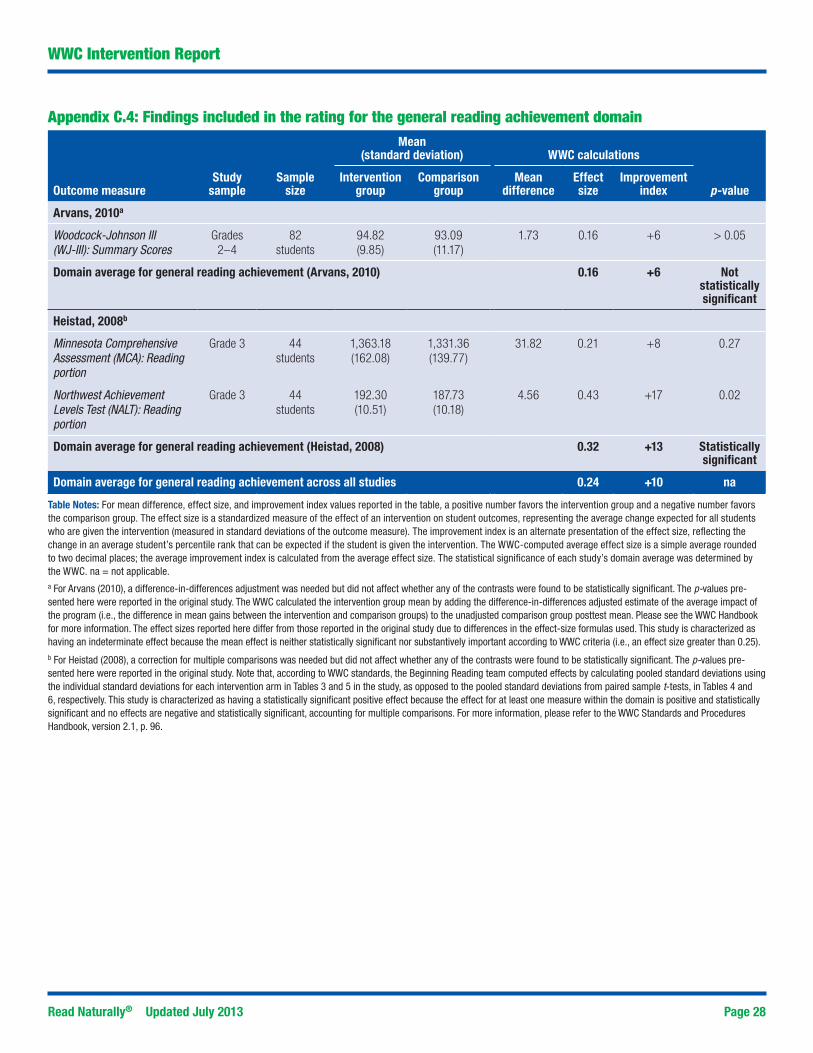
Arvans (2010) did not find statistically significant effects of Read Naturally® on elementary students’ summary scores on the WJ-III. As the WWC-calculated effect was not large enough to be considered substantively impor-tant, the WWC characterizes this study finding as an indeterminate effect.
Heistad (2008) examined two outcomes in the general reading achievement domain, the Northwest Achievement Levels Test (NALT) Reading portion and Minnesota Comprehensive Assessment (MCA) Reading portion. The author reported, and the WWC confirmed, a statistically significant positive effect for the first reading measure. Thus, the WWC char-acterizes these study findings as a statistically significant positive effect, because the effect for at least one measure within the domain is positive and statistically significant, and no effects are negative and statistically significant.
Thus, for the general reading achievement domain, there was one study showing a statistically significant positive effect, one study showing indeterminate effects, and no studies showing a statistically significant or substantively important negative effect. This results in a rating of potentially positive effects, with a small extent of evidence.
Table 6. Rating of effectiveness and extent of evidence for the general reading achievement domainRating of effectiveness Criteria met
Potentially positive effectsEvidence of a positive effect with noverriding contrary evidence.
o In the two studies that reported findings, the estimated impact of the intervention on outcomes in the general reading achievement domain was potentially positive: one study showed a statistically significant positive effect, and one study showed indeterminate effects.
Extent of evidence Criteria met
Small Two studies that included 126 students enrolled in more than four schools reported evidence of effectiveness in the general reading achievement domain.
Read Naturally® Updated July 2013 Page 8
WWC Intervention Report
References
Studies that meet WWC evidence standards without reservationsArvans, R. (2010). Improving reading fluency and comprehension in elementary students using Read Naturally.
Dissertation Abstracts International, 71(01B), 74-649.Christ, T. J., & Davie, J. (2009). Empirical evaluation of Read Naturally effects: A randomized control trial (RCT)
(Unpublished journal article). University of Minnesota, Minneapolis.Additional sources:Read Naturally, Inc. (n.d.). Case 2: University of Minnesota study, Minneapolis, Minn. Retrieved from
http://www.readnaturally.comRead Naturally, Inc. (n.d.). University study of Read Naturally gets top rating from National Center on Response-
to-Intervention. Retrieved from http://www.readnaturally.comHancock, C. M. (2002). Accelerating reading trajectories: The effects of dynamic research-based instruction.
Dissertation Abstracts International, 63(06), 2139A. Kemp, S. C. (2006). Teaching to Read Naturally: Examination of a fluency training program for third grade students.
Study that meets WWC evidence standards with reservationsHeistad, D. (2008). The effects of Read Naturally on grade 3 reading. Unpublished manuscript.
Additional source:Read Naturally, Inc. (n.d.). Case 9: Third-grade students, Minneapolis, Minn. Retrieved from http://www.
readnaturally.com
Studies that do not meet WWC evidence standardsDenton, C. A., Fletcher, J. M., Anthony, J. L., & Francis, D. J. (2006). An evaluation of intensive intervention for
students with persistent reading difficulties. Journal of Learning Disabilities, 39(5), 447–466. The study does not meet WWC evidence standards because the measures of effectiveness cannot be attributed solely to the intervention—the intervention was combined with another intervention.
Harwood, D. (2011). The efficacy of Read Naturally and Voyager programs on fluency within a response-to-interven-tion framework (Unpublished doctoral dissertation). Walden University, Minneapolis, MN. The study does not meet WWC evidence standards because it uses a quasi-experimental design in which the analytic intervention and comparison groups are not shown to be equivalent.
Mesa, C. L. (2004). Effect of Read Naturally software on reading fluency and comprehension (Unpublished master’s the-sis). Piedmont College, Demorest, GA. The study does not meet WWC evidence standards because it uses a quasi-experimental design in which the analytic intervention and comparison groups are not shown to be equivalent.Additional source: Read Naturally, Inc. (n.d.). Case 7: First graders, South Forsyth County, Ga. Retrieved from http://www.
readnaturally.comRead Naturally, Inc. (n.d.). Case 1: Original study, Minneapolis, Minn. Retrieved from http://www.readnaturally.com
The study does not meet WWC evidence standards because it uses a quasi-experimental design in which the analytic intervention and comparison groups are not shown to be equivalent.
Read Naturally, Inc. (n.d.). Case 11: Second graders, Elk River, Minn. Retrieved from http://www.readnaturally.com The study does not meet WWC evidence standards because it uses a quasi-experimental design in which the analytic intervention and comparison groups are not shown to be equivalent.
Wright, S. A. (2006). The effects of Read Naturally on students’ oral reading fluency and reading comprehension (Unpublished master’s thesis). California State University, San Marcos. The study does not meet WWC evidence standards because it only includes outcomes that are overaligned with the interventions or measured in a way that is inconsistent with the protocol. Additional source:Read Naturally, Inc. (n.d.). Case 10: Third graders, Southern California. Retrieved from http://www.readnaturally.com
Studies that are ineligible for review using the Beginning Reading Evidence Review ProtocolArlt, K. L. C. (2001). The effects of Read Naturally on the reading fluency and reading comprehension of students
with mild learning disabilities (Unpublished master’s thesis). Wayne State College, NE. The study is ineligible for review because it does not use a comparison group design or a single-case design.
Baker, D. L., Park, Y., & Baker, S. K. (2012). The reading performance of English learners in grades 1-3: The role of initial status and growth on reading fluency in Spanish and English. Reading and Writing, 25(1), 251–281. The study is ineligible for review because it does not use a sample aligned with the protocol—the sample includes less than 50% general education students.
Baker, D. L., Stoolmiller, M., Good III, R. H., & Baker, S. K. (2011). Effect of reading comprehension on passage fluency in Spanish and English for second-grade English learners. School Psychology Review, 40(3), 331–351. The study is ineligible for review because it does not include an outcome within a domain specified in the protocol.
Berkeley, S., Mastropieri, M. A., & Scruggs, T. E. (2011). Reading comprehension strategy instruction and attribu-tion retraining for secondary students with learning and other mild disabilities. Journal of Learning Disabilities, 44(1), 18–32. The study is ineligible for review because it does not use a sample aligned with the protocol—the sample is not within the specified age or grade range.Additional source:Berkeley, S. (2007). Reading comprehension strategy instruction and attribution retraining for secondary
students with disabilities. Dissertation Abstracts International, 68(3-A), 949.Chavez-Amador, O. (2004). Do computerized software programs improve reading fluency: Read Naturally (Unpub-
lished master’s thesis). California State University, San Marcos. The study is ineligible for review because it does not use a comparison group design or a single-case design.
Chenault, B., Thomson, J., Abbott, R. D., & Berninger, V. W. (2006). Effects of prior attention training on child dyslexics’ response to composition instruction. Developmental Neuropsychology, 29(1), 243–260. The study is ineligible for review because it does not use a sample aligned with the protocol—the sample is not within the specified age or grade range.Additional source:Chenault, B. M. (2004). Effects of prior attention training and a composition curriculum with attention bridges
for students with dyslexia and/or dysgraphia. Dissertation Abstracts International, 65(4-A), 1246. Cheung, A. C. K., & Slavin, R. E. (2012). Effective reading programs for Spanish dominant English language learners
(ELLs) in the elementary grades: A synthesis of research. Baltimore, MD: Johns Hopkins University. Retrieved from http://www.bestevidence.org The study is ineligible for review because it is a secondary analysis of the effective-ness of an intervention, such as a meta-analysis or research literature review.
Coleman, M. B., & Heller, K. W. (2010). The use of repeated reading with computer modeling to promote reading fluency with students who have physical disabilities. Journal of Special Education Technology, 25(1), 29–41. The study is ineligible for review because it does not use a sample aligned with the protocol—the sample includes less than 50% general education students.
Cowden, P. A. (2010). Reading strategies for students with severe disabilities. Reading Improvement, 47(3), 162–165. The study is ineligible for review because it is a secondary analysis of the effectiveness of an intervention, such as a meta-analysis or research literature review.
De la Colina, M. G. (1999). The effectiveness of repeated reading, teacher modeling, and self-monitoring for Spanish beginning readers (Doctoral dissertation). Retrieved from ProQuest Dissertations and Theses. (304563687). The study is ineligible for review because it does not examine an intervention conducted in English.
Denton, C. A., Anthony, J. L., Parker, R., & Hasbrouck, J. E. (2004). Effects of two tutoring programs on the English reading development of Spanish-English bilingual students. The Elementary School Journal, 104(4), 289–305. The study is ineligible for review because it does not use a sample aligned with the protocol—the sample includes less than 50% general education students.
Dubert, L. A., & Laster, B. (2011). Technology in practice: Educators training in reading clinics/literacy labs. Journal of Reading Education, 36(2), 23–29. The study is ineligible for review because it does not use a comparison group design or a single-case design.
Florida Center for Reading Research. (2006). Read Naturally. Tallahassee, FL: Author. The study is ineligible for review because it is a secondary analysis of the effectiveness of an intervention, such as a meta-analysis or research literature review.
Gibson, Jr., L. (2009). The effects of a computer assisted reading program on the oral reading fluency and comprehen-sion of at-risk, urban first grade students. Dissertation Abstracts International, 70(10A), 247-3820. The study is ineligible for review because it does not use a comparison group design or a single-case design.
Graves, A. W., Duesbery, L., Pyle, N. B., Brandon, R. R., & McIntosh, A. S. (2011). Two studies of Tier II literacy development: Throwing sixth graders a lifeline. The Elementary School Journal, 111(4), 641–661. The study is ineligible for review because it does not use a sample aligned with the protocol—the sample is not within the specified age or grade range.Additional source:Graves, A. W., Brandon, R., Duesbery, L., McIntosh, A., & Pyle, N. B. (2011). The effects of Tier 2 literacy
instruction in sixth grade: Toward the development of a response-to-intervention model in middle school. Learning Disability Quarterly, 34(1), 73–86.
Gutman, T. E. (2012). The effects of Read Naturally on reading fluency and comprehension for students of low socioeconomic status (Unpublished doctoral dissertation). Walden University, Minneapolis, MN. The study is ineligible for review because it does not use a sample aligned with the protocol—the sample is not within the specified age or grade range.
Hasbrouck, J. E., Ihnot, C., & Rogers, G. H. (1999). “Read Naturally”: A strategy to increase oral reading fluency. Reading Research and Instruction, 39(1), 27–38. The study is ineligible for review because it is a secondary analysis of the effectiveness of an intervention, such as a meta-analysis or research literature review.
Heise, K. (2004). The effects of the Read Naturally program on fluency, accuracy, comprehension, and student motivation in students with learning disabilities. Masters Abstracts International, 42(06), 70-1957. The study is ineligible for review because it does not use a comparison group design or a single-case design.
Heistad, D. (n.d.). A Minneapolis study of the effects of Read Naturally on fluency and reading comprehension: A supplemental service intervention. Minnesota: Minneapolis Public Schools. The study is ineligible for review because it does not disaggregate findings for the age or grade range specified in the protocol.Additional sources:Heistad, D. (n.d.). A Minneapolis study of the effects of Read Naturally on fluency and reading comprehension:
A supplemental service intervention [Intervention Summary]. Minnesota: Minneapolis Public Schools.Read Naturally, Inc. (n.d.). Case 4: Four-school study, Minneapolis, Minn. Retrieved from http://www.
readnaturally.comRead Naturally, Inc. (n.d.). Case 8: Two-school study, Minneapolis, Minn. Retrieved from http://www.
Jensen, M. (2004). The effects of the Read Naturally program on reading fluency (Unpublished master’s thesis). Graceland University, Cedar Rapids, Iowa. The study is ineligible for review because it does not use a com-parison group design or a single-case design.
Johnsrud, B. L. A. (2005). Impact of the Read Naturally program on elementary students (Unpublished master’s thesis). Minot State University, ND. The study is ineligible for review because it does not use a comparison group design or a single-case design.
Kamps, D., Abbott, M., Greenwood, C., Arreaga-Mayer, C., Wills, H., Longstaff, J., … Walton, C. (2007). Use of evidence-based, small-group reading instruction for English language learners in elementary grades: Secondary-tier intervention. Learning Disability Quarterly, 30(3), 153–168. The study is ineligible for review because it does not use a sample aligned with the protocol—the sample includes less than 50% general education students.
Keyes, S. E. (2010). The effects of a computer-assisted reading program on the oral reading fluency, comprehen-sion, and generalization of at-risk, urban second-grade students (Unpublished doctoral dissertation). Ohio State University, Columbus. The study is ineligible for review because it does not use a comparison group design or a single-case design.
Koehn, J. (2004). The effects of the Read Naturally program on the fluency rate of third graders (Unpublished master’s thesis). Graceland University, Cedar Rapids, IA. The study is ineligible for review because it does not use a comparison group design or a single-case design.
Legere, E. J., & Conca, L. M. (2010). Response-to-intervention by a child with a severe reading disability. Council for Exceptional Children, 43(1), 32–39. The study is ineligible for review because it does not use a sample aligned with the protocol—the sample is not within the specified age or grade range.
Lo, Y., Cooke, N. L., & Starling, A. L. P. (2011). Using a repeated reading program to improve generalization of oral reading fluency. Education & Treatment of Children, 34(1), 115–140. The study is ineligible for review because it does not examine the effectiveness of an intervention.
Mather, N., & Urso, A. (2008). Teaching younger readers with reading difficulties. In R. J. Morris & N. Mather (Eds.), Evidence-based interventions for students with learning and behavioral challenges (pp. 163–192). New York: Routledge/Taylor & Francis Group. The study is ineligible for review because it is a secondary analysis of the effectiveness of an intervention, such as a meta-analysis or research literature review.
Mellard, D. F., Stern, A., & Woods, K. (2011). RTI school-based and evidence-based models. Focus on Exceptional Chil-dren, 43(6), 1–15. The study is ineligible for review because it is a secondary analysis of the effectiveness of an intervention, such as a meta-analysis or research literature review.
Miller, C. (2007). Will the “Read Naturally” program produce better results among elementary-aged students when comparing word per minute fluency probes than a multi-sensory, phonetic approach to reading? (Unpublished master’s thesis). Winona State University, MN. The study is ineligible for review because it does not use a sample aligned with the protocol—the sample is not within the specified age or grade range.
Miller, J. (2010). The effects of an enhanced fluency intervention on fourth and fifth grade struggling readers (Unpub-lished doctoral dissertation). Widener University, Chester, PA. The study is ineligible for review because it does not use a sample aligned with the protocol—the sample is not within the specified age or grade range.
Onken, J. S. (2002). The effects of the Read Naturally program on middle school students’ oral reading fluency and reading comprehension skills in a residential treatment setting (Unpublished master’s thesis). Winona State University, MN. The study is ineligible for review because it does not use a sample aligned with the protocol—the sample is not within the specified age or grade range.
Patel, R., & McNab, C. (2011). Displaying prosodic text to enhance expressive oral reading. Speech Communication, 53(3), 431–441. The study is ineligible for review because it does not include an outcome within a domain speci-fied in the protocol.
Read Naturally® Updated July 2013 Page 12
WWC Intervention Report
Read Naturally, Inc. (n.d.). Case 6: Special education students, Huron County, Mich. Retrieved from http://www.readnaturally.com/ The study is ineligible for review because it does not use a sample aligned with the proto-col—the sample includes less than 50% general education students.
Read Naturally, Inc. (n.d.). National Center on Response-to-Intervention posts statistically significant studies of Read Naturally. Retrieved from http://www.readnaturally.com The study is ineligible for review because it is a sec-ondary analysis of the effectiveness of an intervention, such as a meta-analysis or research literature review.
Read Naturally, Inc. (n.d.). Read Naturally and reading attitudes. Retrieved from http://www.readnaturally.com The study is ineligible for review because it does not include an outcome within a domain specified in the protocol.
Read Naturally, Inc. (2005). Read Naturally: Rationale & research. Retrieved from http://www.readnaturally.com The study is ineligible for review because it does not use a comparison group design or a single-case design.
Reed, J. M., Marchand-Martella, N. E., Martella, R. C., & Kolts, R. L. (2007). Assessing the effects of the reading success level A program with fourth-grade students at a Title I elementary school. Education & Treatment of Children, 30(1), 45–68. The study is ineligible for review because it does not use a sample aligned with the protocol—the sample is not within the specified age or grade range.
Reichrath, E., de Witte, L. P., & Winkens, I. (2010). Interventions in general education for students with disabilities: A systematic review. International Journal of Inclusive Education, 14(6), 563–580. The study is ineligible for review because it is a secondary analysis of the effectiveness of an intervention, such as a meta-analysis or research literature review.
Slavin, R. E., Cheung, A., Groff, C., & Lake, C. (2008). Effective reading programs for middle and high schools: A best-evidence synthesis. Reading Research Quarterly, 43(3), 290–322. The study is ineligible for review because it is a secondary analysis of the effectiveness of an intervention, such as a meta-analysis or research literature review.
Slavin, R. E., Lake, C., Chambers, B., Cheung, A., & Davis, S. (2009). Effective reading programs for the elementary grades: A best-evidence synthesis. Review of Educational Research, 79(4), 1391–1466. The study is ineligible for review because it is a secondary analysis of the effectiveness of an intervention, such as a meta-analysis or research literature review.
Stine-Morrow, E., Noh, S. R., & Shake, M. C. (2010). Age differences in the effects of conceptual integration training on resource allocation in sentence processing. Quarterly Journal of Experimental Psychology, 63(7), 1430–1455. The study is ineligible for review because it does not examine the effectiveness of an intervention.
Trahant, J. (2006). The impact of the use of Read Naturally with junior high students with mild mental impairment (Unpublished master’s thesis). Benedictine University, Lisle, IL. The study is ineligible for review because it does not use a sample aligned with the protocol—the sample is not within the specified age or grade range.
Tucker, C. (2010). Response-to-intervention: Increasing fluency, rate, and accuracy for students at risk for reading failure (Unpublished doctoral dissertation). Walden University, Baltimore, MD. The study is ineligible for review because it does not use a sample aligned with the protocol—the sample is not within the specified age or grade range.
Valentine, S. E. (2003). The effects of Read Naturally on reading fluency in a reading lab with fourth, fifth, and sixth grade students (Unpublished master’s thesis). California State University Stanislaus, Turlock. The study is ineligible for review because it does not use a sample aligned with the protocol—the sample is not within the specified age or grade range.
Vang, K. (2006). The effects of using Read Naturally on reading fluency with struggling readers (Unpublished master’s thesis). California State University Stanislaus, Turlock. The study is ineligible for review because it does not use a comparison group design or a single-case design.
Weiser, B., & Mathes, P. (2011). Using encoding instruction to improve the reading and spelling performances of elementary students at risk for literacy difficulties: A best-evidence synthesis. Review of Educational Research, 81(2), 170–200. The study is ineligible for review because it is a secondary analysis of the effective-ness of an intervention, such as a meta-analysis or research literature review.
Wexler, J., Vaughn, S., Roberts, G., & Denton, C. A. (2010). The efficacy of repeated reading and wide reading practice for high school students with severe reading disabilities. Learning Disabilities Research & Practice, 25(1), 2–10. The study is ineligible for review because it does not use a sample aligned with the protocol— the sample is not within the specified age or grade range.
Read Naturally® Updated July 2013 Page 14
WWC Intervention Report
Appendix A.1: Research details for Arvans, 2010
Arvans, R. (2010). Improving reading fluency and comprehension in elementary students using Read Naturally. Dissertation Abstracts International, 71(01B), 74-649.
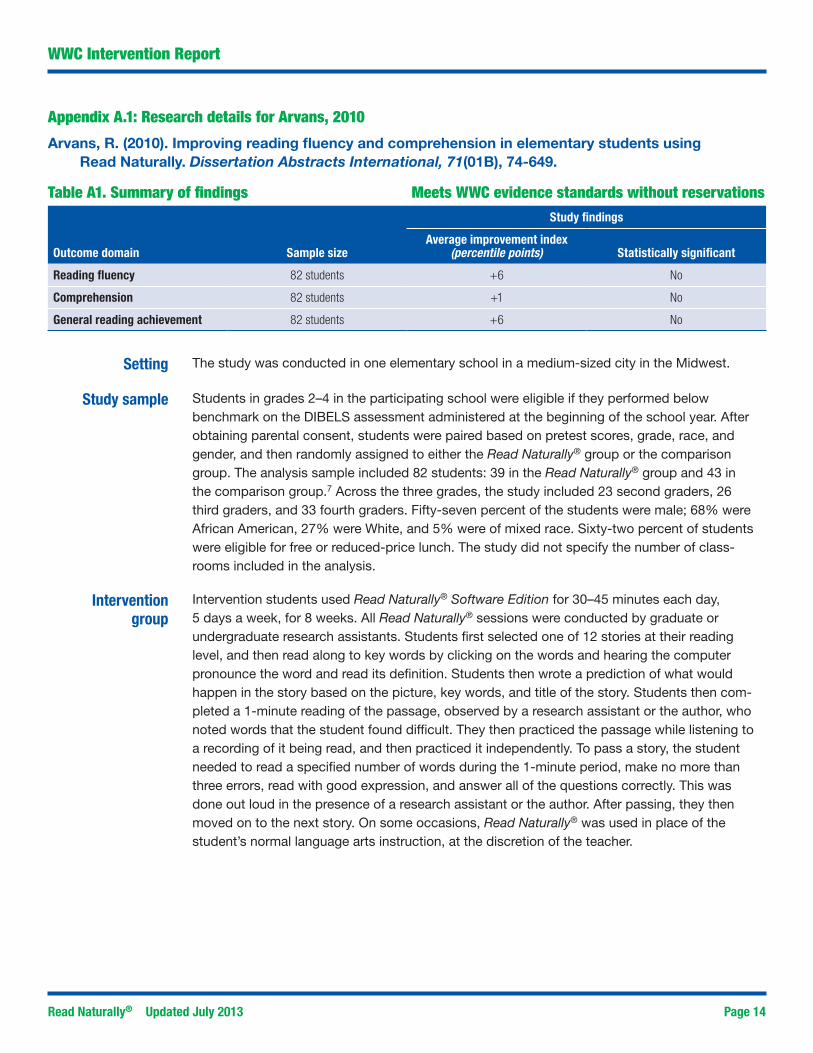
Table A1. Summary of findings Meets WWC evidence standards without reservationsStudy findings
Outcome domain Sample sizeAverage improvement index
(percentile points)
Statistically significant
Reading fluency 82 students +6 No
Comprehension 82 students +1 No
General reading achievement 82 students +6 No
Setting The study was conducted in one elementary school in a medium-sized city in the Midwest.
Study sample Students in grades 2–4 in the participating school were eligible if they performed below benchmark on the DIBELS assessment administered at the beginning of the school year. After obtaining parental consent, students were paired based on pretest scores, grade, race, and gender, and then randomly assigned to either the Read Naturally® group or the comparison group. The analysis sample included 82 students: 39 in the Read Naturally® group and 43 in the comparison group.7 Across the three grades, the study included 23 second graders, 26 third graders, and 33 fourth graders. Fifty-seven percent of the students were male; 68% were African American, 27% were White, and 5% were of mixed race. Sixty-two percent of students were eligible for free or reduced-price lunch. The study did not specify the number of class-rooms included in the analysis.
Intervention group
Intervention students used Read Naturally® Software Edition for 30–45 minutes each day, 5 days a week, for 8 weeks. All Read Naturally® sessions were conducted by graduate or undergraduate research assistants. Students first selected one of 12 stories at their reading level, and then read along to key words by clicking on the words and hearing the computer pronounce the word and read its definition. Students then wrote a prediction of what would happen in the story based on the picture, key words, and title of the story. Students then com-pleted a 1-minute reading of the passage, observed by a research assistant or the author, who noted words that the student found difficult. They then practiced the passage while listening to a recording of it being read, and then practiced it independently. To pass a story, the student needed to read a specified number of words during the 1-minute period, make no more than three errors, read with good expression, and answer all of the questions correctly. This was done out loud in the presence of a research assistant or the author. After passing, they then moved on to the next story. On some occasions, Read Naturally® was used in place of the student’s normal language arts instruction, at the discretion of the teacher.
Read Naturally® Updated July 2013 Page 15
WWC Intervention Report
Comparison group
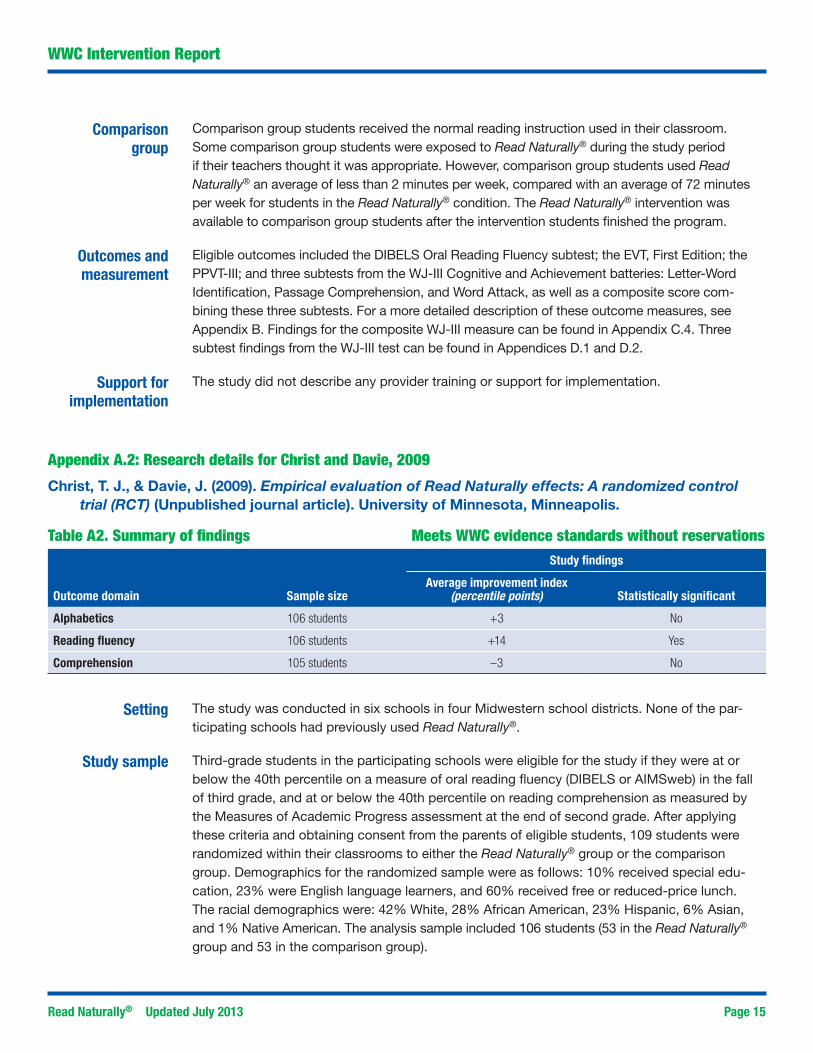
Comparison group students received the normal reading instruction used in their classroom. Some comparison group students were exposed to Read Naturally® during the study period if their teachers thought it was appropriate. However, comparison group students used Read Naturally® an average of less than 2 minutes per week, compared with an average of 72 minutes per week for students in the Read Naturally® condition. The Read Naturally® intervention was available to comparison group students after the intervention students finished the program.
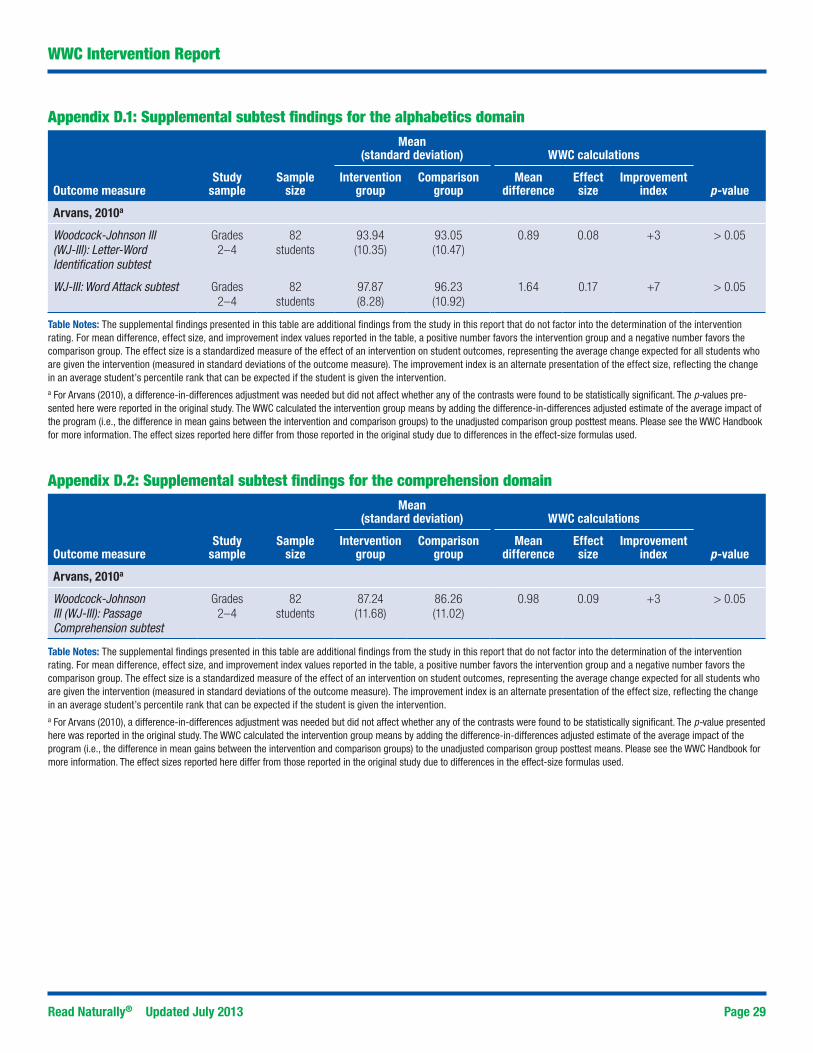
Outcomes and measurement
Eligible outcomes included the DIBELS Oral Reading Fluency subtest; the EVT, First Edition; the PPVT-III; and three subtests from the WJ-III Cognitive and Achievement batteries: Letter-Word Identification, Passage Comprehension, and Word Attack, as well as a composite score com-bining these three subtests. For a more detailed description of these outcome measures, see Appendix B. Findings for the composite WJ-III measure can be found in Appendix C.4. Three subtest findings from the WJ-III test can be found in Appendices D.1 and D.2.
Support for implementation
The study did not describe any provider training or support for implementation.
Appendix A.2: Research details for Christ and Davie, 2009
Christ, T. J., & Davie, J. (2009). Empirical evaluation of Read Naturally effects: A randomized control trial (RCT) (Unpublished journal article). University of Minnesota, Minneapolis.
Table A2. Summary of findings Meets WWC evidence standards without reservationsStudy findings
Outcome domain Sample sizeAverage improvement index
(percentile points) Statistically significant
Alphabetics 106 students +3 No
Reading fluency 106 students +14 Yes
Comprehension 105 students –3 No
Setting The study was conducted in six schools in four Midwestern school districts. None of the par-ticipating schools had previously used Read Naturally®.
Study sample Third-grade students in the participating schools were eligible for the study if they were at or below the 40th percentile on a measure of oral reading fluency (DIBELS or AIMSweb) in the fall of third grade, and at or below the 40th percentile on reading comprehension as measured by the Measures of Academic Progress assessment at the end of second grade. After applying these criteria and obtaining consent from the parents of eligible students, 109 students were randomized within their classrooms to either the Read Naturally® group or the comparison group. Demographics for the randomized sample were as follows: 10% received special edu-cation, 23% were English language learners, and 60% received free or reduced-price lunch. The racial demographics were: 42% White, 28% African American, 23% Hispanic, 6% Asian, and 1% Native American. The analysis sample included 106 students (53 in the Read Naturally® group and 53 in the comparison group).
Read Naturally® Updated July 2013 Page 16
WWC Intervention Report
Intervention group
Read Naturally® Software Edition was the version used and involved 10 weeks of instruction beginning in January 2009. Instruction in Read Naturally® was intended to be daily for 30 min-utes a session. The time of day designated for Read Naturally® instruction varied across teach-ers, but was selected so that it would not conflict with existing reading instruction. Instruction groupings for the intervention consisted of no more than six students, with one teacher super-vising. Analysis of student intervention usage indicated an average of 20 minutes per session using the Read Naturally® software, as opposed to the targeted 30 minutes per session.
Comparison group
Comparison group students continued to receive their classroom’s normal reading instruction, with no supplemental fluency instruction. During the class time designated for Read Naturally® instruction, comparison group students engaged in non-reading related activities.
Outcomes and measurement
In the alphabetics domain, the authors used the WRMT-R Word Identification subtest and the TOWRE. In the reading fluency domain, three outcome measures were included: the GORT-4 Fluency subtest, the GORT-4 Accuracy subtest, and a CBM-R based on three passages from the DIBELS assessment, selected by the authors. In the comprehension domain, the authors used the GORT-4 Comprehension subtest and the WRMT-R Passage Comprehension sub-test. Baseline measures were collected approximately two weeks prior to the beginning of the intervention, and outcomes were collected approximately one week after the conclusion of the intervention. For a more detailed description of these outcome measures, see Appendix B.
Support for implementation
Each teacher attended a 6-hour Read Naturally® training session, which included lecture ses-sions and software practice. Intervention integrity checklists, produced by the developer for both students and teachers, were used to assess and evaluate the implementation of the intervention. Bi-monthly classroom observations were also used to assess implementation fidelity.
Appendix A.3: Research details for Hancock, 2002
Hancock, C. M. (2002). Accelerating reading trajectories: The effects of dynamic research-based instruction. Dissertation Abstracts International, 63(06), 2139A.
Table A3. Summary of findings Meets WWC evidence standards without reservationsStudy findings
Outcome domain Sample sizeAverage improvement index
(percentile points) Statistically significant
Reading fluency 94 students +6 No
Comprehension 94 students +2 No
Setting The study took place in one elementary school in the Kyrene School District in Tempe, Arizona.
Study sample The study involved 94 second-grade students in five classrooms in a single school. The sample included 48 students who received Read Naturally® and 46 who were in the comparison group. Students were randomly assigned into intervention and comparison groups using block ran-domization procedures. Students completed several initial measures of aptitude and reading achievement; scores were rank-ordered within each classroom, and then each student was
Read Naturally® Updated July 2013 Page 17
WWC Intervention Report
matched with a similarly-performing student. Students were then randomly assigned to either the intervention group or the comparison group within matched pairs. No information was reported regarding student ethnicity or gender, but 11% of the students in the school qualified for free or reduced-price lunch. The study author did not report any attrition of the sample.
Intervention group
In addition to the regular curriculum (including reading instruction), the intervention group received 25 minutes of supplemental instruction using Read Naturally® materials four times a week for 11 weeks. In each lesson, the first 5 minutes were spent on oral reading of a selected passage with a teaching assistant. The reading was timed for 1 minute, and the total number of words read correctly was recorded on a graph. The last 20 minutes involved repeated oral reading of curriculum stories either individually or with a cassette tape. Once students practiced a passage eight times (three times with a cassette and five times individually), they did a timed reading with the teacher. If the student achieved mastery (100 words read correctly with three or fewer errors), the student moved on to another passage. Otherwise, the cycle was repeated. The procedures used in this study excluded Read Naturally®’s pre-reading vocabulary instruction component and the Read Naturally® placement system to individualize instruction.
Comparison group
In addition to their regular curriculum, comparison group students received supplemental instruction using the Connecting Math Concepts curriculum (Level B). This program used worksheets, workbooks, coins, and games to teach basic mathematics skills such as place value, money counting, time, addition, subtraction, and multiplication.
Outcomes and measurement
In the comprehension domain, the author used the PPVT-III, the Word Use Fluency (WUF) test, and the Curriculum-Based Measurement: Cloze probe. In the reading fluency domain, the author used the Curriculum-Based Measurement: TORF. The author used initial reading skills, as measured by the TORF, as a covariate to account for baseline differences between groups. For a more detailed description of these outcome measures, see Appendix B.
Support for implementation
Six teaching assistants were trained over 5 days. Teaching assistants were observed modeling lessons during the training sessions, and then written feedback was provided to them. Teach-ing assistants were also observed once a week during the first phase, and at least once every 3 weeks during the second phase, receiving feedback as necessary.
Appendix A.4: Research details for Kemp, 2006
Kemp, S. C. (2006). Teaching to Read Naturally: Examination of a fluency training program for third grade students. Dissertation Abstracts International, 67(07A), 95-2447.
Table A4. Summary of findings Meets WWC evidence standards without reservationsStudy findings
Outcome domain Sample sizeAverage improvement index
(percentile points) Statistically significant
Alphabetics 158 students +1 No
Reading fluency 158 students +1 No
Comprehension 158 students 0 No
Read Naturally® Updated July 2013 Page 18
WWC Intervention Report
Setting The study was conducted in three schools in a school district in Orange County, California.
Study sample The study included 13 third-grade classrooms spread across three schools. From an initial sample of 168 students, students in each class were assigned to pairs based on the similarity of their scores on the reading portion of the California Standards Test from the previous spring. One member from each pair was then randomly assigned to the intervention group, and the other member of the pair to the comparison group. Students receiving special education services were dropped from the data analysis, leaving an analysis sample size of 158 students (79 in the Read Naturally® group and 79 in the comparison group). Of these, 39 students, or 25%, were classified as English language learners.8
Intervention group
The Read Naturally® program was implemented 4 days per week for 20 minutes a day during the months of October through January. The program consisted of teacher modeling, repeated reading, and progress monitoring for the purpose of promoting fluency. Students were assigned to instructional level reading materials. When participating in the program, students (1) practiced a “cold” reading of a self-selected passage from their assigned reading level, (2) practiced reading the same passage three or four times with an audio recorded model, (3) practiced reading independently until they reached their timed goal, and (4) met with the class-room teacher so a timed reading sample could be documented. After successfully completing a number of passages at a given reading level, the student advanced to the next level.
Comparison group
Comparison group students participated in structured sustained silent reading. They were trained to select material at their reading level, and then read silently for 20 minutes 4 days per week from October to January, while maintaining a log of book titles and number of pages read. These reading sessions occurred concurrently with sessions of Read Naturally®. Teach-ers walked around the room to ensure students were reading.
Outcomes and measurement
Students were assessed using the TOWRE Sight Word Efficiency and Phonetic Decoding Effi-ciency subtests; the DIBELS Oral Reading Fluency subtest; the Stanford Diagnostic Reading Test, Fourth Edition, Vocabulary and Comprehension subtests; the Rosner Auditory Analysis Test; the Morphological Relatedness Test Written and Oral/Written subtests; the BSI Word List and Features subtests; and the Orthographic Choice Test. Tests were administered by the researcher and a research assistant in October before the intervention began, and in January at the conclusion of the study. For a more detailed description of these outcome measures, see Appendix B.
Support for implementation
Classroom teachers in the intervention group received training on the Read Naturally® curricu-lum and implementation. The study author conducted six visits to each classroom during the course of the study and conducted observations to assess fidelity of implementation.
Read Naturally® Updated July 2013 Page 19
WWC Intervention Report
Appendix A.5: Research details for Heistad, 2008
Heistad, D. (2008). The effects of Read Naturally on grade 3 reading. Unpublished manuscript. Additional source: Read Naturally, Inc. (n.d.). Case 9: Third-grade students, Minneapolis, Minn. Retrieved from http://www.readnaturally.com
Table A5. Summary of findings Meets WWC evidence standards with reservationsStudy findings
Outcome domain Sample sizeAverage improvement index
(percentile points) Statistically significant
General reading achievement 44 students +13 Yes
Setting The study took place in the Minneapolis Public School District, in schools that were not on the No Child Left Behind list of schools failing to make adequate yearly progress in 2003.
Study sample Read Naturally® was implemented with third-grade students in three elementary schools in the Minneapolis Public School District.9 Comparison group students were drawn from the same grade in the same school district. The author does not specify the number of schools attended by comparison group students. Students were selected for the Read Naturally® intervention based on parent and teacher recommendations and, according to the author, were generally not considered to be “on course” for proficiency on the state assessments administered in the spring of grade 3. The analysis sample included 44 third-grade students (22 in the Read Naturally® group and 22 in the comparison group). The demographic characteristics of Read Naturally® students were: 41% male, 4% classified as special education, 35% English language learners (ELL), and 50% were receiving free or reduced-price lunch. With respect to race and ethnicity, 39% of the intervention group students were Hispanic, 36% were African American, 22% were White, and 14% were Native American. No similar demographic information for the compari-son sample was presented in the study.
Intervention group
Two schools used the Read Naturally® Masters Edition that employed audio cassettes and hard-copy reading materials, while one school used the Read Naturally® Software Edition. Two schools implemented Read Naturally® as a pull-out intervention during the school day, while one school used it as part of an after-school program.10 No further information was provided in the study regarding how the intervention was implemented.
Comparison group
The study author created a matched comparison group from within the Minneapolis Public Schools using students that were not receiving the Read Naturally® program. Students were first matched by a pretest score on the NALT Reading measure, followed by the following demographic factors: grade, ELL status, special education status, free or reduced-price lunch, race/ethnicity, home language, and gender. Read Naturally® students were only matched to students who attended schools with the same AYP status as their own school.
Eligible outcome measures included the reading portions of two state-based assessments, the NALT and the MCA. Both assessments were administered in the spring, with the prior year’s NALT scores being used as a pretest measure. For a more detailed description of these out-come measures, see Appendix B.
Support for implementation
A Read Naturally® instructor trained one teacher in each school on the Read Naturally® pro-cedures. Training included: initial assessment of student level of instruction using curriculum-based measurement procedures, placement procedures, use of comprehension assessments and strategies, student goal setting, and progress monitoring procedures.
Read Naturally® Updated July 2013 Page 21
WWC Intervention Report
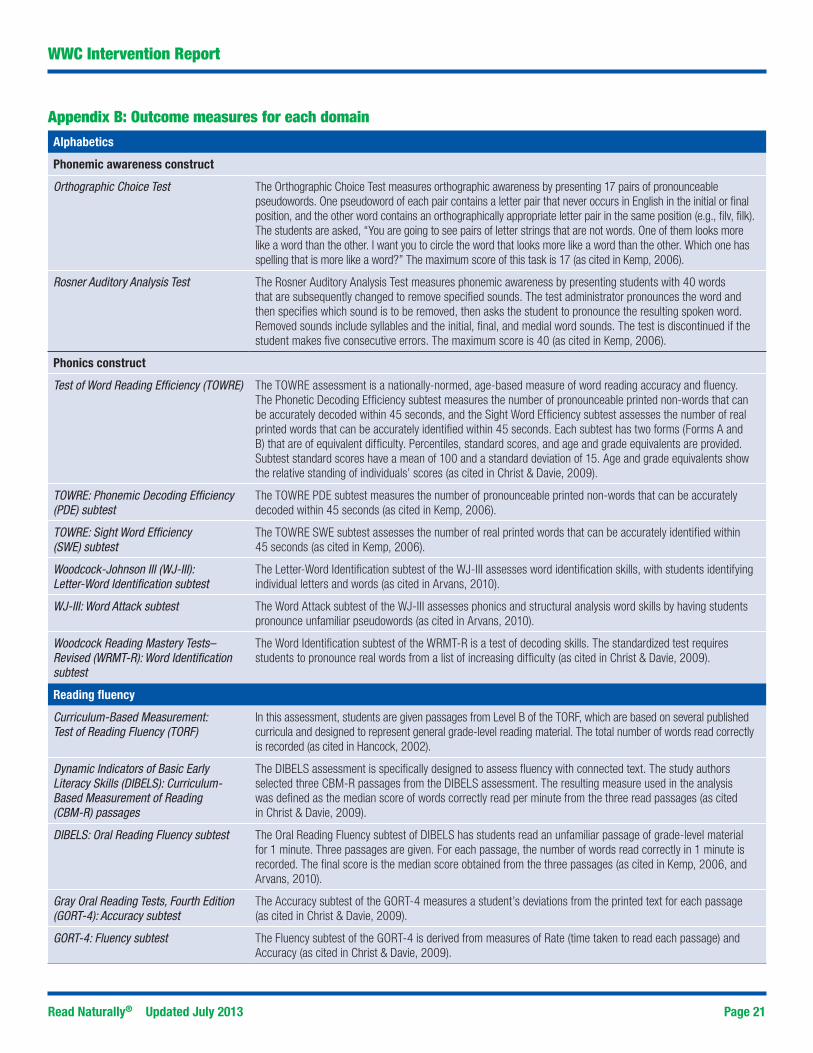
Appendix B: Outcome measures for each domainAlphabetics
Phonemic awareness construct
Orthographic Choice Test The Orthographic Choice Test measures orthographic awareness by presenting 17 pairs of pronounceable pseudowords. One pseudoword of each pair contains a letter pair that never occurs in English in the initial or final position, and the other word contains an orthographically appropriate letter pair in the same position (e.g., filv, filk). The students are asked, “You are going to see pairs of letter strings that are not words. One of them looks more like a word than the other. I want you to circle the word that looks more like a word than the other. Which one has spelling that is more like a word?” The maximum score of this task is 17 (as cited in Kemp, 2006).
Rosner Auditory Analysis Test The Rosner Auditory Analysis Test measures phonemic awareness by presenting students with 40 words that are subsequently changed to remove specified sounds. The test administrator pronounces the word and then specifies which sound is to be removed, then asks the student to pronounce the resulting spoken word. Removed sounds include syllables and the initial, final, and medial word sounds. The test is discontinued if the student makes five consecutive errors. The maximum score is 40 (as cited in Kemp, 2006).
Phonics construct
Test of Word Reading Efficiency (TOWRE) The TOWRE assessment is a nationally-normed, age-based measure of word reading accuracy and fluency. The Phonetic Decoding Efficiency subtest measures the number of pronounceable printed non-words that can be accurately decoded within 45 seconds, and the Sight Word Efficiency subtest assesses the number of real printed words that can be accurately identified within 45 seconds. Each subtest has two forms (Forms A and B) that are of equivalent difficulty. Percentiles, standard scores, and age and grade equivalents are provided. Subtest standard scores have a mean of 100 and a standard deviation of 15. Age and grade equivalents show the relative standing of individuals’ scores (as cited in Christ & Davie, 2009).
TOWRE: Phonemic Decoding Efficiency (PDE) subtest
The TOWRE PDE subtest measures the number of pronounceable printed non-words that can be accurately decoded within 45 seconds (as cited in Kemp, 2006).
TOWRE: Sight Word Efficiency (SWE) subtest
The TOWRE SWE subtest assesses the number of real printed words that can be accurately identified within 45 seconds (as cited in Kemp, 2006).
Woodcock-Johnson III (WJ-III): Letter-Word Identification subtest
The Letter-Word Identification subtest of the WJ-III assesses word identification skills, with students identifying individual letters and words (as cited in Arvans, 2010).
WJ-III: Word Attack subtest The Word Attack subtest of the WJ-III assesses phonics and structural analysis word skills by having students pronounce unfamiliar pseudowords (as cited in Arvans, 2010).
Woodcock Reading Mastery Tests–Revised (WRMT-R): Word Identification subtest
The Word Identification subtest of the WRMT-R is a test of decoding skills. The standardized test requires students to pronounce real words from a list of increasing difficulty (as cited in Christ & Davie, 2009).
Reading fluency
Curriculum-Based Measurement: Test of Reading Fluency (TORF)
In this assessment, students are given passages from Level B of the TORF, which are based on several published curricula and designed to represent general grade-level reading material. The total number of words read correctly is recorded (as cited in Hancock, 2002).
Dynamic Indicators of Basic Early Literacy Skills (DIBELS): Curriculum-Based Measurement of Reading (CBM-R) passages
The DIBELS assessment is specifically designed to assess fluency with connected text. The study authors selected three CBM-R passages from the DIBELS assessment. The resulting measure used in the analysis was defined as the median score of words correctly read per minute from the three read passages (as cited in Christ & Davie, 2009).
DIBELS: Oral Reading Fluency subtest The Oral Reading Fluency subtest of DIBELS has students read an unfamiliar passage of grade-level material for 1 minute. Three passages are given. For each passage, the number of words read correctly in 1 minute is recorded. The final score is the median score obtained from the three passages (as cited in Kemp, 2006, and Arvans, 2010).
The Accuracy subtest of the GORT-4 measures a student’s deviations from the printed text for each passage (as cited in Christ & Davie, 2009).
GORT-4: Fluency subtest The Fluency subtest of the GORT-4 is derived from measures of Rate (time taken to read each passage) and Accuracy (as cited in Christ & Davie, 2009).
Read Naturally® Updated July 2013 Page 22
WWC Intervention Report
Comprehension
Reading comprehension construct
Curriculum-Based Measurement: Cloze probe
In this assessment, students read text passages and fill in key missing words from three choices (as cited in Hancock, 2002).
GORT-4: Comprehension subtest The Comprehension subtest of the GORT-4 is derived from the number of correct responses to the comprehension questions in the assessment (as cited in Christ & Davie, 2009).
The Stanford Diagnostic Reading Test is a nationally norm-referenced test of reading comprehension. It provides criterion-referenced information to help teachers with instructional planning. In the Kemp (2006) study, the Comprehension subtest was administered to the whole class, and raw scores and percentile scores were obtained (as cited in Kemp, 2006).
WJ-III: Passage Comprehension subtest The Passage Comprehension subtest of the WJ-III assesses student symbolic learning by having students provide the appropriate missing words for a passage (as cited in Arvans, 2010).
WRMT-R: Passage Comprehension subtest
For the Passage Comprehension subtest of the WRMT-R, students fill in blanks with the correct words based on the content of surrounding sentences or phrases (as cited in Christ & Davie, 2009).
Vocabulary development construct
Bear Spelling Inventory (BSI): Features subtest
The BSI assessment consists of 25 words read aloud and used in context. Students are asked to spell the word as best they can and write down all the sounds they hear. The Features subtest assesses the students’ spelling using six categories that represent facets of students’ development of spelling aptitude (as cited in Kemp, 2006).
BSI: Word List subtest The BSI assessment consists of 25 words read aloud and used in context. Students were asked to spell the word as best they could and write down all the sounds they heard. The Word List subtest assessed only whether the word was spelled correctly (as cited in Kemp, 2006).
Expressive Vocabulary Test (EVT), First Edition
The EVT is a standardized test that measures word retrieval and expressive vocabulary. It includes two sections, a labeling section and a synonym section. In each case, the test administrator prompts the student for an appropriate word (as cited in Arvans, 2010).
Morphological Relatedness Test (MRT): Oral/Written version
The MRT assessment consists of 40 items divided equally between the Written and the Oral/Written versions. Students determine whether or not the second word in each pair is derived from the first word and circle either “yes” or “no” after each pair. In the Oral/Written version, the experimenter reads each item aloud. The items included in this assessment are pairs of words adopted from Mahony (1993) and some additional pairs that Mann (2000) created. Each version of the test contains 15 related pairs and five unrelated pairs or foils. The maximum score for both versions of the MRT is 20 (as cited in Kemp, 2006).
MRT: Written version The MRT assessment consists of 40 items divided equally between the Written and the Oral/Written versions. Students determine whether or not the second word in each pair is derived from the first word and circle either “yes” or “no” after each pair. In the Written version, students silently read the items before marking their answers. The items included in this assessment are pairs of words adopted from Mahony (1993) and some additional pairs that Mann (2000) created. Each version of the test contains 15 related pairs and five unrelated pairs or foils. The maximum score for both versions of the MRT is 20 (as cited in Kemp, 2006).
Peabody Picture Vocabulary Test, Third Edition (PPVT-III)
The PPVT-III is a standardized, receptive vocabulary test that asks students to choose which one of four pictures corresponds to a test word spoken aloud (as cited in Hancock, 2002, and Arvans, 2010).
The Stanford Diagnostic Reading Test is a nationally norm-referenced test of reading comprehension. It provides criterion-referenced information to help teachers with instructional planning. In the Kemp (2006) study, the Vocabulary subtest was administered to the whole class, and raw scores and percentile scores were obtained (as cited in Kemp, 2006).
Word Use Fluency (WUF) test The WUF test measures students’ expressive language skills. The tester verbally presents words to the student, who is asked to use the words in a sentence. Words are presented one at a time, and the next word is presented once a response is given. The task lasts 1 minute, and the total correct number of responses is provided (as cited in Hancock, 2002).
The MCA Reading is the reading portion of the Minnesota state assessment used under the No Child Left Behind Act. The reading portion includes multiple choice and constructed response items, with a focus on comprehension and vocabulary skills (as cited in Heistad, 2008).
Northwest Achievement Levels Test (NALT) Reading portion
The NALT Reading portion is a multiple-choice, standardized test aligned with state reading standards. The NALT is an “adaptive” assessment, where the version of the test taken by the student is based on their reading achievement level as determined by prior assessment (as cited in Heistad, 2008).
WJ-III: Summary Scores The WJ-III Summary Scores are a composite measure combining the scores on the Letter-Word Identification, Passage Comprehension, and Word Attack subtests of the WJ-III (as cited in Arvans, 2010).
Read Naturally® Updated July 2013 Page 24
WWC Intervention Report
Appendix C.1: Findings included in the rating for the alphabetics domain
Mean
(standard deviation) WWC calculations
Outcome measureStudy
sample
Sample size
Intervention group
Comparison group
Mean difference
Effect size
Improvement index p-value
Christ & Davie, 2009a
Test of Word Reading Efficiency (TOWRE)
Grade 3 106 students
94.90 (10.00)
93.50 (11.00)
1.40 0.13 +5 0.31
Woodcock Reading Mastery Tests-Revised (WRMT-R): Word Identification subtest
Grade 3 105 students
99.00 (7.00)
98.00 (8.00)
1.00 0.04 +2 0.75
Domain average for alphabetics (Christ & Davie, 2009) 0.09 +3 Not statistically significant
Kemp, 2006b
Orthographic Choice Test Grade 3 158 students
13.49 (2.30)
13.41 (2.12)
0.08 0.04 +1 > 0.05
Rosner Auditory Analysis Test Grade 3 158 students
27.52 (8.96)
27.29 (9.05)
0.23 0.03 +1 > 0.05
TOWRE: Phonemic Decoding Efficiency subtest
Grade 3 158 students
35.32 (11.95)
34.63 (11.98)
0.69 0.06 +2 > 0.05
TOWRE: Sight Word Efficiency subtest
Grade 3 158 students
64.29 (12.81)
64.91 (10.24)
–0.62 –0.05 –2 > 0.05
Domain average for alphabetics (Kemp, 2006) 0.02 +1 Not statistically significant
Domain average for alphabetics across all studies 0.05 +2 na
Table Notes: For mean difference, effect size, and improvement index values reported in the table, a positive number favors the intervention group and a negative number favors the comparison group. The effect size is a standardized measure of the effect of an intervention on student outcomes, representing the average change expected for all students who are given the intervention (measured in standard deviations of the outcome measure). The improvement index is an alternate presentation of the effect size, reflecting the change in an average student’s percentile rank that can be expected if the student is given the intervention. The WWC-computed average effect size is a simple average rounded to two decimal places; the average improvement index is calculated from the average effect size. The statistical significance of each study’s domain average was determined by the WWC. na = not applicable.a For Christ and Davie (2009), no corrections for clustering or multiple comparisons and no difference-in-differences adjustments were needed. The p-values and effect sizes pre-sented here were reported in the original study. This study is characterized as having an indeterminate effect because the mean effect is neither statistically significant nor substan-tively important according to WWC criteria (i.e., an effect size greater than 0.25).b For Kemp (2006), a difference-in-differences adjustment was needed but did not affect whether any of the contrasts were found to be statistically significant. The p-values presented here were reported in the original study. The WWC calculated the intervention group means by adding the difference-in-differences adjusted estimate of the average impact of the program (i.e., the difference in mean gains between the intervention and comparison groups) to the unadjusted comparison group posttest means. Please see the WWC Handbook for more information. This study is characterized as having an indeterminate effect because the mean effect is neither statistically significant nor substantively important according to WWC criteria (i.e., an effect size greater than 0.25).
Read Naturally® Updated July 2013 Page 25
WWC Intervention Report
Appendix C.2: Findings included in the rating for the reading fluency domain
Mean
(standard deviation) WWC calculations
Outcome measureStudy
sampleSample
sizeIntervention
groupComparison
groupMean
differenceEffect size
Improvement index p-value
Arvans, 2010a
Dynamic Indicators of Basic Early Literacy Skills (DIBELS): Oral Reading Fluency subtest
Grades 2–4
82 students
66.71 (27.49)
61.98 (31.75)
4.73 0.16 +6 > 0.05
Domain average for reading fluency (Arvans, 2010) 0.16 +6 Not statistically significant
Christ & Davie, 2009b
DIBELS Curriculum-Based Measurement of Reading (CBM-R) passages
Domain average for reading fluency (Christ & Davie, 2009) 0.36 +14 Statistically significant
Hancock, 2002c
Curriculum-Based Measurement: Test of Reading Fluency (TORF)
Grade 2 94 students
117.38 (30.52)
112.38 (30.52)
5.00 0.16 +6 > 0.05
Domain average for reading fluency (Hancock, 2002) 0.16 +6 Not statistically significant
Kemp, 2006d
DIBELS: Oral Reading Fluency subtest
Grade 3 158 students
114.00 (38.62)
113.32 (36.65)
0.68 0.02 +1 > 0.05
Domain average for reading fluency (Kemp, 2006) 0.02 +1 Not statistically significant
Domain average for reading fluency across all studies 0.18 +7 na
Table Notes: For mean difference, effect size, and improvement index values reported in the table, a positive number favors the intervention group and a negative number favors the comparison group. The effect size is a standardized measure of the effect of an intervention on student outcomes, representing the average change expected for all students who are given the intervention (measured in standard deviations of the outcome measure).The improvement index is an alternate presentation of the effect size, reflecting the change in an average student’s percentile rank that can be expected if the student is given the intervention. The WWC-computed average effect size is a simple average rounded to two decimal places; the average improvement index is calculated from the average effect size. The statistical significance of each study’s domain average was determined by the WWC. na = not applicable. a For Arvans (2010), a difference-in-differences adjustment was needed but did not affect whether any of the contrasts were found to be statistically significant. The p-values pre-sented here were reported in the original study. The WWC calculated the intervention group mean by adding the difference-in-differences adjusted estimate of the average impact of the program (i.e., the difference in mean gains between the intervention and comparison groups) to the unadjusted comparison group posttest mean. Please see the WWC Handbook for more information. The effect sizes reported here differ from those reported in the original study due to differences in the effect-size formulas used. This study is characterized as having an indeterminate effect because the mean effect is neither statistically significant nor substantively important according to WWC criteria (i.e., an effect size greater than 0.25).
Read Naturally® Updated July 2013 Page 26
WWC Intervention Report
b For Christ and Davie (2009), a correction for multiple comparisons was needed but did not affect whether any of the contrasts were found to be statistically significant. The p-values and effect sizes presented here were reported in the original study. This study is characterized as having a statistically significant positive effect because the effect size for at least one measure is positive and statistically significant when adjusted for multiple comparisons.c For Hancock (2002), no corrections for clustering or multiple comparisons and no difference-in-differences adjustments were needed. The p-values presented here were reported in the original study. The author used hierarchical linear modeling (HLM) and weekly scores on the TORF outcome measure to estimate Read Naturally ®’s effect on the rate of student growth in reading. However, to determine the overall effect of receiving Read Naturally ® instruction on this outcome measure, the WWC used the adjusted mean TORF score shown in Table 2 of the study. Note that we use comparison group standard deviation for the intervention group, due to an apparent typo in the study. This study is characterized as having an indeterminate effect because the mean effect is neither statistically significant nor substantively important according to WWC criteria (i.e., an effect size greater than 0.25).d For Kemp (2006), a difference-in-differences adjustment was needed but did not affect whether any of the contrasts were found to be statistically significant. The p-values presented here were reported in the original study. The WWC calculated the intervention group mean by adding the difference-in-differences adjusted estimate of the average impact of the program (i.e., the difference in mean gains between the intervention and comparison groups) to the unadjusted comparison group posttest mean. Please see the WWC Handbook for more information. This study is characterized as having an indeterminate effect because the mean effect is neither statistically significant nor substantively important according to WWC criteria (i.e., an effect size greater than 0.25).
Appendix C.3: Findings included in the rating for the comprehension domain
Mean
(standard deviation) WWC calculations
Outcome measureStudy
sampleSample
sizeIntervention
groupComparison
groupMean
differenceEffect size
Improvement index p-value
Arvans, 2010a
Peabody Picture Vocabulary Test, Third Edition (PPVT-III)
Grades 2–4
82 students
93.46 (13.18)
92.44 (12.17)
1.02 0.08 +3 > 0.05
Expressive Vocabulary Test (EVT), First Edition
Grades 2–4
82 students
90.58 (15.68)
90.84 (14.31)
–0.26 –0.02 –1 > 0.05
Domain average for comprehension (Arvans, 2010) 0.03 +1 Not statistically significant
Morphological Relatedness Test (MRT): Oral/Written version
Grade 3 158 students
12.85 (2.38)
13.76 (2.10)
–0.91 –0.40 –16 > 0.05
MRT: Written version Grade 3 158 students
13.15 (2.73)
12.67 (2.66)
0.48 0.18 +7 > 0.05
Bear Spelling Inventory (BSI): Word List subtest
Grade 3 158 students
19.89 (5.38)
18.99 (5.22)
0.90 0.17 +7 < 0.05
BSI: Features subtest Grade 3 158 students
53.85 (7.40)
52.42 (5.05)
1.43 0.22 +9 < 0.05
Domain average for comprehension (Kemp, 2006) –0.01 0 Not statistically significant
Domain average for comprehension across all studies 0 0 na
Table Notes: For mean difference, effect size, and improvement index values reported in the table, a positive number favors the intervention group and a negative number favors the comparison group. The effect size is a standardized measure of the effect of an intervention on student outcomes, representing the average change expected for all students who are given the intervention (measured in standard deviations of the outcome measure). The improvement index is an alternate presentation of the effect size, reflecting the change in an average student’s percentile rank that can be expected if the student is given the intervention. The WWC-computed average effect size is a simple average rounded to two decimal places; the average improvement index is calculated from the average effect size. The statistical significance of each study’s domain average was determined by the WWC. na = not applicable.a For Arvans (2010), a difference-in-differences adjustment was needed but did not affect whether any of the contrasts were found to be statistically significant. The p-values pre-sented here were reported in the original study. The WWC calculated the intervention group means by adding the difference-in-differences adjusted estimate of the average impact of the program (i.e., the difference in mean gains between the intervention and comparison groups) to the unadjusted comparison group posttest means. Please see the WWC Handbook for more information. The effect sizes reported here differ from those reported in the original study due to differences in the effect-size formulas used. This study is characterized as having an indeterminate effect because the mean effect is neither statistically significant nor substantively important according to WWC criteria (i.e., an effect size greater than 0.25).b For Christ and Davie (2009), no corrections for clustering or multiple comparisons and no difference-in-differences adjustments were needed. The authors did not conduct univariate statistical tests for the two outcomes in the comprehension domain because they were not jointly significant; as such, the p-values presented here were calculated by the WWC. WWC calculations show no statistically significant differences between the intervention and comparison groups for either of these outcome measures. This study is characterized as having an indeterminate effect because the mean effect is neither statistically significant nor substantively important according to WWC criteria (i.e., an effect size greater than 0.25).c For Hancock (2002), no corrections for clustering or multiple comparisons and no difference-in-differences adjustments were needed. The p-values presented here were reported in the original study. This study is characterized as having an indeterminate effect because the mean effect is neither statistically significant nor substantively important according to WWC criteria (i.e., an effect size greater than 0.25).d For Kemp (2006), a correction for multiple comparisons was needed and resulted in a WWC-computed critical p-value of 0.008 for the BSI Word List subtest; therefore, the WWC does not find the result to be statistically significant. The p-values presented here were reported in the original study. The WWC calculated the intervention group means by adding the difference-in-differences adjusted estimate of the average impact of the program (i.e., the difference in mean gains between the intervention and comparison groups) to the unad-justed comparison group posttest means. Please see the WWC Handbook for more information. This study is characterized as having an indeterminate effect because the mean effect is neither statistically significant nor substantively important according to WWC criteria (i.e., an effect size greater than 0.25).
Read Naturally® Updated July 2013 Page 28
WWC Intervention Report
Appendix C.4: Findings included in the rating for the general reading achievement domain
Mean
(standard deviation)
WWC calculations
Outcome measureStudy
sampleSample
sizeIntervention
groupComparison
groupMean
differenceEffect size
Improvement index p-value
Arvans, 2010a
Woodcock-Johnson III (WJ-III): Summary Scores
Grades 2–4
82 students
94.82 (9.85)
93.09 (11.17)
1.73 0.16 +6 > 0.05
Domain average for general reading achievement (Arvans, 2010) 0.16 +6 Not statistically significant
Northwest Achievement Levels Test (NALT): Reading portion
Grade 3 44 students
192.30 (10.51)
187.73 (10.18)
4.56 0.43 +17 0.02
Domain average for general reading achievement (Heistad, 2008) 0.32 +13 Statistically significant
Domain average for general reading achievement across all studies 0.24 +10 na
Table Notes: For mean difference, effect size, and improvement index values reported in the table, a positive number favors the intervention group and a negative number favors the comparison group. The effect size is a standardized measure of the effect of an intervention on student outcomes, representing the average change expected for all students who are given the intervention (measured in standard deviations of the outcome measure). The improvement index is an alternate presentation of the effect size, reflecting the change in an average student’s percentile rank that can be expected if the student is given the intervention. The WWC-computed average effect size is a simple average rounded to two decimal places; the average improvement index is calculated from the average effect size. The statistical significance of each study’s domain average was determined by the WWC. na = not applicable. a For Arvans (2010), a difference-in-differences adjustment was needed but did not affect whether any of the contrasts were found to be statistically significant. The p-values pre-sented here were reported in the original study. The WWC calculated the intervention group mean by adding the difference-in-differences adjusted estimate of the average impact of the program (i.e., the difference in mean gains between the intervention and comparison groups) to the unadjusted comparison group posttest mean. Please see the WWC Handbook for more information. The effect sizes reported here differ from those reported in the original study due to differences in the effect-size formulas used. This study is characterized as having an indeterminate effect because the mean effect is neither statistically significant nor substantively important according to WWC criteria (i.e., an effect size greater than 0.25).b For Heistad (2008), a correction for multiple comparisons was needed but did not affect whether any of the contrasts were found to be statistically significant. The p-values pre-sented here were reported in the original study. Note that, according to WWC standards, the Beginning Reading team computed effects by calculating pooled standard deviations using the individual standard deviations for each intervention arm in Tables 3 and 5 in the study, as opposed to the pooled standard deviations from paired sample t-tests, in Tables 4 and 6, respectively. This study is characterized as having a statistically significant positive effect because the effect for at least one measure within the domain is positive and statistically significant and no effects are negative and statistically significant, accounting for multiple comparisons. For more information, please refer to the WWC Standards and Procedures Handbook, version 2.1, p. 96.
Read Naturally® Updated July 2013 Page 29
WWC Intervention Report
Appendix D.1: Supplemental subtest findings for the alphabetics domain
Mean
(standard deviation)
WWC calculations
Outcome measureStudy
sampleSample
sizeIntervention
groupComparison
groupMean
differenceEffect size
Improvement index p-value
Arvans, 2010a
Woodcock-Johnson III (WJ-III): Letter-Word Identification subtest
Grades 2–4
82 students
93.94 (10.35)
93.05 (10.47)
0.89 0.08 +3 > 0.05
WJ-III: Word Attack subtest Grades 2–4
82 students
97.87 (8.28)
96.23 (10.92)
1.64 0.17 +7 > 0.05
Table Notes: The supplemental findings presented in this table are additional findings from the study in this report that do not factor into the determination of the intervention rating. For mean difference, effect size, and improvement index values reported in the table, a positive number favors the intervention group and a negative number favors the comparison group. The effect size is a standardized measure of the effect of an intervention on student outcomes, representing the average change expected for all students who are given the intervention (measured in standard deviations of the outcome measure). The improvement index is an alternate presentation of the effect size, reflecting the change in an average student’s percentile rank that can be expected if the student is given the intervention.a For Arvans (2010), a difference-in-differences adjustment was needed but did not affect whether any of the contrasts were found to be statistically significant. The p-values pre-sented here were reported in the original study. The WWC calculated the intervention group means by adding the difference-in-differences adjusted estimate of the average impact of the program (i.e., the difference in mean gains between the intervention and comparison groups) to the unadjusted comparison group posttest means. Please see the WWC Handbook for more information. The effect sizes reported here differ from those reported in the original study due to differences in the effect-size formulas used.
Appendix D.2: Supplemental subtest findings for the comprehension domainMean
(standard deviation) WWC calculations
Outcome measureStudy
sampleSample
sizeIntervention
groupComparison
groupMean
differenceEffect size
Improvement index p-value
Arvans, 2010a
Woodcock-Johnson III (WJ-III): Passage Comprehension subtest
Grades 2–4
82 students
87.24 (11.68)
86.26 (11.02)
0.98 0.09 +3 > 0.05
Table Notes: The supplemental findings presented in this table are additional findings from the study in this report that do not factor into the determination of the intervention rating. For mean difference, effect size, and improvement index values reported in the table, a positive number favors the intervention group and a negative number favors the comparison group. The effect size is a standardized measure of the effect of an intervention on student outcomes, representing the average change expected for all students who are given the intervention (measured in standard deviations of the outcome measure). The improvement index is an alternate presentation of the effect size, reflecting the change in an average student’s percentile rank that can be expected if the student is given the intervention. a For Arvans (2010), a difference-in-differences adjustment was needed but did not affect whether any of the contrasts were found to be statistically significant. The p-value presented here was reported in the original study. The WWC calculated the intervention group means by adding the difference-in-differences adjusted estimate of the average impact of the program (i.e., the difference in mean gains between the intervention and comparison groups) to the unadjusted comparison group posttest means. Please see the WWC Handbook for more information. The effect sizes reported here differ from those reported in the original study due to differences in the effect-size formulas used.
Read Naturally® Updated July 2013 Page 30
WWC Intervention Report
Endnotes1 The descriptive information for this program was obtained from a publicly available source: the program’s website (www.readnaturally.com; last time downloaded May 2013). The WWC requests distributors review the program description sections for accuracy from their perspec-tive. The program description was provided to the distributor in January 2012, and the WWC incorporated feedback from the distribu-tor. Further verification of the accuracy of the descriptive information for this program is beyond the scope of this review. The literature search reflects documents publicly available by December 2012. 2 The previous report was released in July 2007. This report has been updated to include reviews of 31 studies that have been released since 2007 and 20 studies that were released prior to 2007 but were not included in the earlier report. Of the additional studies, 43 were not within the scope of the review protocol for the Beginning Reading topic area, and four were within the scope of the review protocol but did not meet evidence standards. Four new studies meet WWC evidence standards (with or without reservations): Arvans (2010), Christ and Davie (2009), Heistad (2008), and Kemp (2006). The report also confirms the prior study rating for Hancock (2002) that met standards in the initial report. Additionally, the Mesa (2004) study, which met WWC evidence standards with reservations in the previous report, does not meet WWC evidence standards using version 2.1 standards because it uses a quasi-experimental design in which the analytic intervention and comparison groups are not shown to be equivalent. This revised disposition is due to a change in the review protocol. In particular, in the protocol version 1.0 standards, a statistical adjustment for baseline differences was sufficient to demonstrate equivalence in quasi-experimental studies; in the protocol version 2.1 standards, if differences are too great at baseline, then the study cannot meet standards (even after a statistical adjustment). A complete list and disposition of all studies reviewed are provided in the references. The studies in this report were reviewed using the Evidence Standards from the WWC Procedures and Standards Handbook (version 2.1), along with those described in the Beginning Reading review protocol (version 2.1). The evidence presented in this report is based on available research. Findings and conclusions may change as new research becomes available.3 For criteria used in the determination of the rating of effectiveness and extent of evidence, see the WWC Rating Criteria on p. 31. These improvement index numbers show the average and range of student-level improvement indices for all findings across the studies.4 After the posttest assessment, during the follow-up period, comparison group students received instruction using Read Naturally®. Data from the follow-up period are not included in this intervention report.5 The Hancock (2002) study excluded Read Naturally®’s pre-reading vocabulary instruction component and the Read Naturally® place-ment system to individualize instruction.6 The study author did not explain how the number of students in the intervention and comparison groups differed.7 Six students did not complete posttest assessments; however, the author imputed posttest scores for these cases by using their pretest scores in the analysis. The study does not include a breakdown of the intervention statuses of these six cases.8 Subgroup results for English language learners in Kemp (2006) are reported separately in the WWC English Language Learners inter-vention report (released in July 2010).9 This study was part of a larger study of Read Naturally® conducted in four schools that examined the intervention among students in grades 3–5. The WWC review of interventions for Beginning Reading focuses on students in grades K–3.10 Information provided by the study author at the WWC’s request.
Recommended CitationU.S. Department of Education, Institute of Education Sciences, What Works Clearinghouse. (2013, July).
Beginning Reading intervention report: Read Naturally®. Retrieved from http://whatworks.ed.gov
Criteria used to determine the rating of a studyStudy rating Criteria
Meets WWC evidence standards without reservations
A study that provides strong evidence for an intervention’s effectiveness, such as a well-implemented RCT.
Meets WWC evidence standards with reservations
A study that provides weaker evidence for an intervention’s effectiveness, such as a QED or an RCT with high attrition that has established equivalence of the analytic samples.
Criteria used to determine the rating of effectiveness for an interventionRating of effectiveness Criteria
Positive effects Two or more studies show statistically significant positive effects, at least one of which met WWC evidence standards for a strong design, AND No studies show statistically significant or substantively important negative effects.
Potentially positive effects At least one study shows a statistically significant or substantively important positive effect, AND No studies show a statistically significant or substantively important negative effect AND fewer or the same number of studies show indeterminate effects than show statistically significant or substantively important positive effects.
Mixed effects At least one study shows a statistically significant or substantively important positive effect AND at least one study shows a statistically significant or substantively important negative effect, but no more such studies than the number showing a statistically significant or substantively important positive effect, OR At least one study shows a statistically significant or substantively important effect AND more studies show an indeterminate effect than show a statistically significant or substantively important effect.
Potentially negative effects One study shows a statistically significant or substantively important negative effect and no studies show a statistically significant or substantively important positive effect, OR Two or more studies show statistically significant or substantively important negative effects, at least one study shows a statistically significant or substantively important positive effect, and more studies show statistically significant or substantively important negative effects than show statistically significant or substantively important positive effects.
Negative effects Two or more studies show statistically significant negative effects, at least one of which met WWC evidence standards for a strong design, AND No studies show statistically significant or substantively important positive effects.
No discernible effects None of the studies shows a statistically significant or substantively important effect, either positive or negative.
Criteria used to determine the extent of evidence for an interventionExtent of evidence Criteria
Medium to large The domain includes more than one study, ANDThe domain includes more than one school, ANDThe domain findings are based on a total sample size of at least 350 students, OR, assuming 25 students in a class, a total of at least 14 classrooms across studies.
Small The domain includes only one study, ORThe domain includes only one school, ORThe domain findings are based on a total sample size of fewer than 350 students, AND, assuming 25 students in a class, a total of fewer than 14 classrooms across studies.
Read Naturally® Updated July 2013 Page 32
WWC Intervention Report
Glossary of Terms
Attrition Attrition occurs when an outcome variable is not available for all participants initially assigned to the intervention and comparison groups. The WWC considers the total attrition rate and the difference in attrition rates across groups within a study.
Clustering adjustment If intervention assignment is made at a cluster level and the analysis is conducted at the student level, the WWC will adjust the statistical significance to account for this mismatch, if necessary.
Confounding factor A confounding factor is a component of a study that is completely aligned with one of the study conditions, making it impossible to separate how much of the observed effect was due to the intervention and how much was due to the factor.
Design The design of a study is the method by which intervention and comparison groups were assigned.
Domain A domain is a group of closely related outcomes.
Effect size The effect size is a measure of the magnitude of an effect. The WWC uses a standardized measure to facilitate comparisons across studies and outcomes.
Eligibility A study is eligible for review and inclusion in this report if it falls within the scope of the review protocol and uses either an experimental or matched comparison group design.
Equivalence A demonstration that the analysis sample groups are similar on observed characteristics defined in the review area protocol.
Extent of evidence An indication of how much evidence supports the findings. The criteria for the extent of evidence levels are given in the WWC Rating Criteria on p. 31.
Improvement index Along a percentile distribution of students, the improvement index represents the gain or loss of the average student due to the intervention. As the average student starts at the 50th percentile, the measure ranges from –50 to +50.
Multiple comparison adjustment
When a study includes multiple outcomes or comparison groups, the WWC will adjust the statistical significance to account for the multiple comparisons, if necessary.
Quasi-experimental design (QED)
A quasi-experimental design (QED) is a research design in which subjects are assigned to intervention and comparison groups through a process that is not random.
Randomized controlled trial (RCT)
A randomized controlled trial (RCT) is an experiment in which investigators randomly assign eligible participants into intervention and comparison groups.
Rating of effectiveness The WWC rates the effects of an intervention in each domain based on the quality of the research design and the magnitude, statistical significance, and consistency in findings. The criteria for the ratings of effectiveness are given in the WWC Rating Criteria on p. 31.
Single-case design A research approach in which an outcome variable is measured repeatedly within and across different conditions that are defined by the presence or absence of an intervention.
Standard deviation The standard deviation of a measure shows how much variation exists across observations in the sample. A low standard deviation indicates that the observations in the sample tend to be very close to the mean; a high standard deviation indicates that the observations in the sample tend to be spread out over a large range of values.
Statistical significance Statistical significance is the probability that the difference between groups is a result of chance rather than a real difference between the groups. The WWC labels a finding statistically significant if the likelihood that the difference is due to chance is less than 5% ( p < 0.05).
Substantively important A substantively important finding is one that has an effect size of 0.25 or greater, regardless of statistical significance.
Please see the WWC Procedures and Standards Handbook (version 2.1) for additional details.