BEHAVIOR OF LIGHT-EMITTING POLYMERS: FILM FORMATION, OPTICAL PROPERTIES, AND DEGRADATION By SHYH-CHYANG LUO A DISSERTATION PRESENTED TO THE GRADUATE SCHOOL OF THE UNIVERSITY OF FLORIDA IN PARTIAL FULFILLMENT OF THE REQUIREMENTS FOR THE DEGREE OF DOCTOR OF PHILOSOPHY UNIVERSITY OF FLORIDA 2005
Transcript
BEHAVIOR OF LIGHT-EMITTING POLYMERS: FILM FORMATION, OPTICAL
PROPERTIES, AND DEGRADATION
By
SHYH-CHYANG LUO
A DISSERTATION PRESENTED TO THE GRADUATE SCHOOL OF THE UNIVERSITY OF FLORIDA IN PARTIAL FULFILLMENT
OF THE REQUIREMENTS FOR THE DEGREE OF DOCTOR OF PHILOSOPHY
UNIVERSITY OF FLORIDA
2005
Copyright 2005
by
Shyh-Chyang Luo
This dissertation is dedicated to my parents, my brothers, and Inga for their love, support and encouragement.
ACKNOWLEDGMENTS
First of all, I would like to thank my advisor and my committee chair, Dr. Elliot
Douglas, for lending an unwavering supportive presence to my studies in the United
States throughout these years. Without a doubt, I feel very fortunate to have received the
benefits of his guidance. His welcomed openness and confidence in my ideas have made
working in his group a pleasant and enriching experience. I would like to express sincere
gratitude to my committee members, Dr. Paul Holloway, Dr. Ronald Baney, Dr. David
Norton, and Dr. Kirk Schanze, for their invaluable help and support of my research.
I would like to thank Dr. Valentin Craciun, Dr. Eric Lambers, Andrew Gerger, and
Juhyun Woo in the Major Analytical and Instrumentation Center for their assistance in
the measurements of X-ray reflectivity, Auger electron spectroscopy, and atomic force
microscopy. I also wish to thank Dr. Mark Davidson in Microfabritech for helping with
the photoluminescence measurement. Without their aid and input, this work could not
have been done.
I would like to extend a special “thank you” to all of the members in Dr. Douglas’
and Dr. Holloway’s group and my classmates, especially Dr. Wenling Jia, Lewei Bu,
Brendan Collins, Hsiu-Hsin Chung, Phil Chung, and Jia- Hau Yen, for their help and
support. I am so lucky to have worked with all of them. Many thanks go to Jennifer
Wrighton for her attention to all the details that made my working in this group all the
more enlightening.
iv
I especially thank Ying-Chih Wang. Her support and encouragement enabled me
to overcome the challenges of this project. Finally, I would like to thank my parents and
my younger brothers. They are always there for me. Without them, I could not have
gotten this far.
v
TABLE OF CONTENTS
Page ACKNOWLEDGMENTS ................................................................................................. iv
TABLE OF CONTENTS................................................................................................... vi
LIST OF TABLES............................................................................................................. ix
LIST OF FIGURES .............................................................................................................x
ABSTRACT..................................................................................................................... xvi
2 REVIEW OF LITERATURE.......................................................................................4
2.1 Fundamentals of π-Conjugated Polymers...............................................................4 2.1.1 A Brief History of π-Conjugated Polymers..................................................4 2.1.2 Photophysics.................................................................................................5
5.3 Results and Discussion .........................................................................................57 5.3.1 PL of Polymer Solutions ............................................................................57
5.3.1.1 Solvent effects ..................................................................................57 5.3.1.2 Concentration effects........................................................................64 5.3.1.3 Water effect on PFO in THF solutions............................................66
5.3.2 PL of Polymer Thin films...........................................................................67 5.3.2.1 Solvent effects ..................................................................................67 5.3.2.2 Concentration and spin-speed effects...............................................68 5.3.3.3 Annealing effects..............................................................................72
5.4 Conclusion ............................................................................................................73 6 DEGRAGATION OF METAL CONTACT IN POLYMER LIGHT-EMITTING
Table page 3-1. Characteristic data of solvents at room temperature. ...............................................25
3-2. The Mark-Houwink parameters for PVK at 25oC. ...................................................25
3-3. Characteristics of PVK films obtained from XRR measurements. ..........................35
3-4. Characteristics of MEH-PPV films obtained from XRR measurements..................38
4-1. Roughness of MEH-PPV polymer films prepared from the dried THF and THF/water solutions.................................................................................................48
4-2. PL of MEH-PPV polymer films prepared from the dried THF and THF/water solutions ...................................................................................................................52
5-1. Solubility parameter and polymer solubility. ...........................................................58
ix
LIST OF FIGURES
Figure page 2-1. Structure of conjugated polymers: a) cis-polyacetylene; b) trans-polyacetylene; c)
2-2. General structure of PLEDs........................................................................................7
2-3. The mechanism of EL in PLEDs................................................................................7
2-4. Absorption and PL of MEH-PPV in CB and THF solutions......................................8
2-5. a) PL of CB solution and thin films; b) PL of thin films coated from CB and THF solutions. ....................................................................................................................9
2-6. Characterization of PLEDs: a) I-V curve and b) B-V curve for DCB and THF devices having similar thickness. .............................................................................10
2-7. PL of MEH-PPV films annealed at different temperatures. .....................................11
2-8. EL vs. current of the devices annealed at different temperature after Al deposition.12
2-9. Evolution of black spot formation in air: a) t = 2hrs; b) t = 10 hrs; c) t = 20 hrs; d) t = 30 hrs; e) t = 40hrs. ...............................................................................................14
2-10. Schematic diagram showing dark spot induced by pinholes....................................15
2-11. The linear growth of dark spot with various particles. .............................................15
2-12. Proposed electrochemical half-cell reactions showing the oxidation of metal (M) and the reduction of doped PEDOT. ........................................................................16
2-13. Polystyrene coated from THF solution.....................................................................17
2-14. Polystyrene coated from cyclohexane and acetone mixed solution. ........................18
2-15. The Marangoni convection.......................................................................................18
2-16. Micrograph of different stages of polystyrene dewetting on Si wafer: a) 15 mins and b) 1hr. ................................................................................................................21
x
2-17. The droplets left on the Si wafer. .............................................................................21
2-18. Film structure of dewetted thin films: a) A dewetting pattern centered at a defect (50 x 50 µm) and b) pattern at high magnification (5 x 5 µm).................................22
3-1. Chemical structure of a) PVK and b) MEH-PPV.....................................................24
3-2. Film structure of polymer thin-film observed with optical microscopy: (a) prepared from THF solution, center area; (b) prepared from THF solution, away from center area; (c) prepared from chloroform solution, center area; (d) prepared from chloroform solution, away from center area. Length of scale bar 200µm. ..............27
3-3. 3D tapping mode AFM image of PVK film surface prepared from (a) chloroform solution, cell structure near center area; (b) chloroform solution, striation structure away from center area. .............................................................................................28
3-4. The Marangoni convection model (including composition-gradient-driven and temperature-gradient-driven processes) for the spin-coating process. T1 and C2 represent the temperature and solution concentration near the surface of the solution layer; T2 and C1 represent the temperature and solution concentration near the interface between the solution layer and the ITO substrate. ..............................29
3-5. Film structure of PVK thin film observed with optical microscopy prepared from TCE solution, center area. ........................................................................................30
3-6. 2D tapping mode AFM image of PVK surface prepared from toluene solution......31
3-7. RMS Roughness plotted as a function of evaporation rate of four solvents. ...........32
3-8. MEH-PPV Film structure of polymer thin-film observed with optical microscopy: (a) prepared from THF solution, center area; (b) prepared from THF solution, away from center area; (c) prepared from chloroform solution, center area; (d) prepared from chloroform solution, away from center area; e) prepared from CB solution; prepared from TCE solution.....................................................................................33
3-9. 2D tapping mode AFM image of MEH-PPV film surface prepared from (a) chloroform solution, cell structure near center area; (b) TCE solution, smooth surface near center area. ...........................................................................................34
3-10. X-ray reflectivity spectra acquired from PVK thin films prepared from chloroform, benzene, toluene, and TCE solutions. Experimentally measured data are shown as a solid line; fitted results are shown as a dotted line...................................................35
3-11. X-ray reflectivity spectra acquired from MEH-PPV thin films prepared from chloroform, chlorobenzene, and TCE solutions. Experimentally measured data are shown as a solid line of light color, and fitted results are shown as a solid line with dark color..................................................................................................................37
xi
4-1. SEM image of polymer prepared from THF solution: (a) center area with a low magnification, length of scale bar 200µm; (b) away from center area with a low magnification, length of scale bar 10µm; (c) center area with a high magnification, length of scale bar 200µm; (d) away from center area with a high magnification, length of scale bar 10µm. .........................................................................................41
4-2. SEM image of polymer thin-film prepared from THF solution with different H2O contents: (a and b) THF dried by molecular sieve for 1 day with a low and high magnification, length of scale bar 200 and 10 µm, respectively; (c), (d) 10µL of H2O added in 5 mL of THF with a low and high magnification, length of scale bar 200 and 10 µm respectively; (e), (f) 100µl H2O added in 5mL of THF with a low and high magnification, length of scale bar 200µm and 10 µm, respectively..........43
4-3. PEDOT-PSS film structure on ITO substrate observed with optical microscopy: (a) low magnification, length of scale bar = 200µm; (b) high magnification, showing presence of a hole, length of scale bar = 20µm. .......................................................44
4-4. Structure of ruptured thin films: a) Optical microscopy image of MEH-PPV thin film prepared from 5% H2O in THF, striation structure away from center; b) SEM image of same film with higher magnification. .......................................................46
4-5. Height contrast of polymer thin-films from (a) dried THF solution with polymer concentration of 5 mg/ml; (b) 5% water in THF solution; (c) height profile of film along the line indicated in (a); (d) height profile of film along the line indicated in (b). ............................................................................................................................47
4-6. PL spectra of MEH-PPV polymer thin-films. ..........................................................49
4-7. PL spectra of MEH-PPV in THF solutions (7 mg/ml) with different water concentrations...........................................................................................................50
4-8. PLED based on ruptured thin films: (a) The layer structure of PLED device. (b) The light-emitting output after the device is turned on. ..................................................53
5-1. PL of 0.5% MEH-PPV solutions..............................................................................57
5-2. PFO dissolved in toluene, THF, chloroform, CB, TCE, and cyclohexanone (from left to right)...............................................................................................................58
5-3. PL of PFO in THF, TCE, Chloroform and CB.........................................................59
5-4. The measurement of kinematic viscosities of MEH-PPV in CB, chloroform, and TCE at different concentrations. ..............................................................................61
5-5. ηsp/c plotted as a function of c for MEH-PPV in CB, chloroform, and TCE. ..........62
5-6. PL of MEH-PPV in chloroform in concentrations of 0.1, 1, 5, and 10 mg/mL. ......64
xii
5-7. PL of MEH-PPV in CB and TCE.............................................................................65
5-8. PL of PFO in chloroform..........................................................................................65
5-9. PL of PFO in the THF solution with different water concentrations. ......................67
5-10. Comparison of PL of MEH-PPV in polymer solutions and thin films.....................68
5-11. PL of MEH-PPV thin films from chloroform solutions with concentrations of 2.5, 5, and 7 mg/mL. (Spin-speed = 1000 rpm) ..............................................................69
5-12. PL of MEH-PPV thin films coated from chloroform solution (7 mg/mL) at 1000, 3000, and 5000 rpm..................................................................................................70
5-13. PL of MEH-PPV thin films from CB solutions with concentrations of 2.5, 5, and 7 mg/mL. (Spin-speed = 1000 rpm) ............................................................................71
5-14. PL of MEH-PPV thin films coated from chloroform solutions (7 mg/mL) at 1000, 3000, and 5000 rpm..................................................................................................71
5-15. The PL of MEH-PPV coated from chloroform solution before and after annealing at 120 oC for 3 hrs in a vacuum....................................................................................72
5-16. PL of MEH-PPV coated from CB solution before and after annealing at 120 oC for 3 hrs in a vacuum. ....................................................................................................73
6-1. Schematic of the PLEDs used in this study..............................................................76
6-2. Bubble formation observed with optical microscopy: (a) biased with 7 V, 10-5 A⋅cm-2 for 1 min. within one hour after thermal evaporation of Al; (b) biased with 7 V, 10-5 A⋅cm-2 for 1 min after storage in laboratory air for 1 day (∼60% relative humidity, 27 oC). Note the lower magnification in (b). ...........................................77
6-3. The effects of storage ambient and encapsulation upon bubble formation as a result of electrical bias (8 V for 2 min.). Encapsulated or non-encapsulated devices were stored for four days in argon or air as follows: (a) argon with encapsulation; (b) argon without encapsulation; (c) air with encapsulation; (d) air without encapsulation. Photos on the left and right are before and after the devices were biased, respectively. .................................................................................................79
6-4. The dependence of bubble formation on the type of conjugated polymer and temperature in the absence of electrical bias. Devices consisted of the normal ITO/polymer/Ca/Al structure, where the polymer layer is either PVK or PEDOT-PSS. Devices were examined in real time by optical microscopy while being heated on a hot stage either immediately after deposition of the cathode, or 24 hours after this deposition with storage in air. .........................................................80
xiii
6-5. Formation of bubbles by water droplets in the absence of an electrical bias when a Ca layer is present. The photos are of Al only or normal Ca/Al cathode contacts with water droplets on the surface. Al-only contact (a) immediately after placing a water droplet on the surface, and (b) after a few minutes; no bubbles are observed. Ca/Al contact (c) immediately after placing a water droplet on the surface, and (d) after a few minutes; large bubbles are obvious in (d). .............................................82
6-6. Pinhole structure and composition: (a) SEM image of a pinhole in the Al/Ca cathode dot contact and surrounding bubbles generated by application of an electrical bias; (b) AES spectra from the cathode surface (i) inside the pinhole, and (ii) outside the pinhole..............................................................................................85
6-7. AES sputter depth profile of a normal 10 nm Ca/60 nm Al PLED cathode dot contact (a) before and (b) after an electrical bias was applied. Note the increase of oxygen at the Al/Ca interface after electrical biasing (8 V for 10 min. in laboratory air). ...........................................................................................................................86
7-1. Proposed mechanism for the generation of keto-defect sites. ..................................88
7-2. Images of a low Mw PFO under a polarized optical microscope at (a) 120oC, (b) 150oC, (c) 210oC, and (d) 220oC. .............................................................................90
7-3. X-ray diffraction of low Mw PFO samples at room temperature, 125, 150, 200, and 250oC. Sample was annealed at 250oC for 10 minutes before cooling to the measurement temperature. .......................................................................................91
7-4. X-ray diffraction of high Mw PFO samples at room temperature, 125, 150, 200, and 250oC. Sample was annealed at 250oC for 15 minutes cooling to the measurement temperature...............................................................................................................92
7-5. Characteristic XRD profile for film in N, α, α’, and β phases [114]. .......................93
7-6. XRD profile of low Mw and high Mw PFO samples annealed at 170oC for 3 and 15 hours in Ar................................................................................................................94
7-7. Comparison of X-ray diffraction pattern of high Mw PFO samples annealed at 170oC in Ar and in air for 3 and 15 hours. ...............................................................95
7-8. PL of high Mw PFO samples annealed in air at different temperatures: 170oC for 1 hour (solid line), 200oC for 1 hour (dash dot line), 200oC for 3 hours (dash line), and 240oC for 1 hour. ...............................................................................................96
7-9. The X-ray diffraction pattern of annealed high Mw PFO samples corresponding to the samples shown in Figure 7-8..............................................................................97
7-10. XRR spectra acquired from spin-coated high Mw PFO thin films. Solid line and dash line represent the experimental data and the fitted results (one layer model) respectively...............................................................................................................98
xiv
7-11. XRR spectra acquired from spin-coated low Mw PFO thin films. Solid line and dash line represent the experimental data and the fitted results (one layer model) respectively...............................................................................................................99
7-12. XRR spectra acquired from spin-coated low Mw PFO thin films. Solid line and dash line represent the experimental data and the fitted results (two layer model) respectively.............................................................................................................100
8-1. The proposed model of ruptured polymer film formation during the spin-coating process due to the surface-tension gradient induced by water. ..............................105
8-2. The proposed model of ruptured polymer film formation during the spin-coating process due to phase separation. ............................................................................106
xv
Abstract of Dissertation Presented to the Graduate School of the University of Florida in Partial Fulfillment of the Requirements for the Degree of Doctor of Philosophy
THE BEHAVIOR OF LIGHT-EMITTING POLYMERS: FILM FORMATION, OPTICAL PROPERTIES, AND DEGRADATION
By
Shyh-Chyang Luo
August 2005
Chair: Elliot P. Douglas Major Department: Materials Science and Engineering
The properties of light-emitting polymer thin films prepared via spin coating from
different organic solvents were studied. The surface analysis as observed by atomic force
microscopy, scanning microscopy, and x-ray reflectivity has shown that the structure of
polymer thin-films is controlled by the properties of organic solvents. The
photoluminescence (PL) spectrum of polymer thin-films and polymer solutions has
shown the correlation between the chain conformation and light-emitting properties. A
combination of viscosity measurements is used to illustrate the solvent effects on the
optical properties of light-emitting polymers in solutions and thin films.
The solvent-induced film structure of poly(n-vinyl carbazole) (PVK) and poly(2-
methoxy-5-(2’-ethyl-hexyloxy)-1,4-phenyl vinylene) (MEH-PPV) thin films on indium
tin oxide coated glass was examined. The spin-coated polymer thin films are not in
thermodynamic equilibrium; rather, the film properties are affected by the dynamics of
the spin-coating process. The water in tetrahydrofuran induces rupturing of polymer
xvi
films during the spin-coating process. Solvents with a high-evaporation rate lead to high-
surface roughness due to Bénard-Marangoni convection. Results show that the surface
roughness and structure of the films are dominated by the dynamics of the film-formation
process rather than the thermodynamic interactions between the polymer and solvents.
Two degradation phenomena are studied and discussed in this work. The first
manifestation of degradation is the bubble formation on the polymer light-emitting
diodes. Water can diffuse through pinholes to reach polymer layers. Heat and electrical
bias can induce the reaction between water and metal contacts, which leads to the bubble
formation. The second manifestation of degradation is the thermal-induced oxidation of
poly[9,9-dioctylfluorene] (PFO). The oxidation of PFO can lead to an extra red-shifted
emission and the crosslinking of polymer chains.
xvii
CHAPTER 1 INTRODUCTION
The first report of light-emitting diode devices with conjugated polymers as the
active layer by Burroughes et al. in 1990 [1] resulted in extensive investigation of
polymer light-emitting diodes (PLEDs). The demonstration of PLEDs fabricated by
casting the polymer film from solutions [2] and their successful application onto flexible
substrates both suggest how PLEDs possess a great potential for display technology [3].
These devices show many advantages including low cost of processing, low-power
consumption, and a flexible display. So far, many studies have been done to improve the
device’s efficiency and lifetime [4-12].
The optical properties of light-emitting polymers are determined by their chemical
and physical structures, which are the configuration and conformation respectively of
polymer chains. The light-emitting color can be tuned by changing the chemical structure
of conjugated polymers. Typical examples are poly (p-phenylene vinylene) (PPV) [1,2]
and poly (fluorene) (PF) [13,14]. The photoluminescence (PL) and electroluminescence
(EL) of PPV-related polymers show a red-orange range and PF-related polymers show a
blue-green range. White light PLEDs can be achieved by synthesizing copolymers [15] or
by using polymer-polymer, or polymer-phosphor blend systems [16-18]. More recently,
polysilane-related polymers show EL in the UV and NUV range [19-21]. Different from
PPV or PF, EL from polysilane is due to the σ-conjugation instead of π-conjugation on
the main chain. Additionally, a few non-conjugated polymers, such as poly (9-vinyl
1
2
carbazole) (PVK) can also generate EL [22]. PVK can emit blue light via radiative decay
from carbazole chromophores.
Emission wavelength is also affected by the conformation of the polymer chains.
Steady red-shifted absorption and emission of oligomers have been shown to occur as the
conjugation length increases [23-25]. Change of the polymer chain conformation can
also affect the conjugation length. An extended chain conformation results in a longer
conjugation length. Studies have already shown the emission wavelength as being
affected by solvents [26-29], blending with other polymers [30], and the evaporation
process [31] due to the change of the chain conformation. The quantum efficiency, life
time, and turn-on voltage were also seen as being affected by the morphology of
polymers[28, 32-34].
In this research, three different light-emitting polymers, including two conjugated
and poly[9,9-dioctylfluorenyl-2,7-diyl] (PFO), and one non-conjugated polymer, PVK,
were used. The research topics include film formation, optical properties, and the
degradation mechanisms of polymer and PLEDs. Chapter 2 will begin by providing the
general background of light-emitting polymers, including the physics of light generation
as well as the mechanism and fabrication of PLEDs. Second, previous research about the
relationship between polymer morphology and the PLED performance will be illustrated.
Spin-coating is the most general method for thin-film fabrication. During spin-
coating processes, Marangoni convection can lead to high surface roughness. Details of
the Marangoni effect is additionally delineated in chapter 2, and results of this
phenomenon on light-emitting polymer systems are shown in chapter 3.
3
In chapter 4, the rupture of polymer thin-films during spin-coating processes is
illustrated. Previous studies have shown the dewetting of polymer thin-film after the
annealing process due to the high interface tension between polymers and substrates.
Unlike these studies, we found the formation of rupture of polymer thin-films during
spin-coating processes. Thus, an alternate mechanism of this phenomenon is proposed.
Chapter 5 primarily shows the solvent effect on the optical properties of light-
emitting polymers. Due to the interaction between polymers and solvent molecules, the
chain conformation can be changed by dissolving in different solvents. The change of a
polymer conformation leads to the shift of PL of that polymer solution. According to
previous studies, the conformation of polymer chains after the spin-coating process is
affected by the polymer conformation in solutions, which means the PL of the polymer
thin film is also affected by the solvents. We also show the concentration and annealing
effects on PL in this chapter.
Chapters 6 and 7 present the influence of degradation of the electrode contacts in
PLEDs and the oxidation of light-emitting polymers respectively. The cause of contact
degradation is mainly due to the reaction between metal electrodes, like Ca, and water or
oxygen. The oxidation of PFO leads to an extra emission peak.
Chapter 8 is a summary and some suggestions for future work.
CHAPTER 2 REVIEW OF LITERATURE
2.1 Fundamentals of π-Conjugated Polymers
2.1.1 A Brief History of π-Conjugated Polymers
The first report about doped polyacetylene showing high conductivity in 1977 [35]
opened a new field in polymer applications. Electronic polymers show the same
feature—a backbone consisting of alternating single and double bonds. Polymers with
this bonding structure are called π-conjugated polymers.
Before the 1990s, the main focus of this field had been studies of the mechanism of
charge transport and the synthesis of new conjugated polymers with higher conductivity
and stability. Since the first PLEDs were successfully fabricated in 1990 [1], the
application of semiconducting (undoped) forms of these polymers attracted lots of
attention. These applications include PLEDs, solar cells [36], sensors [37], and thin-film
transistors [38]. Figure 1 shows the structure of the conjugated polymers studied to
examine their conducting and semiconducting properties.
Figure 2-1. Structure of conjugated polymers: a) cis-polyacetylene; b) trans-polyacetylene; c) polythiophene; d) poly(phenylene vinylene); e) poly(pyridyl vinylene); f) poly(fluorene).
4
5
2.1.2 Photophysics
According to molecular orbital theory, a conjugated system contains π and π*
orbitals. By linking these conjugated molecules together, the disparate π and π* orbitals
will merge into continuous bands, which is similar to the valence band and conducting
band in the semiconductor. The energy spacing between the conducting and valence
band is called the band gap. For conjugated polymers, band gaps are determined by their
chemical structures (configurations) and physical structures (conformation).
When a photon is absorbed by conjugated polymers, an electron is excited from the
valence band to the conducting band and a hole is generated in the valence band. Several
possible excited states can generate after that. Generally, an electron-hole pair forms a
singlet exciton, which means the electron and hole are bound on the sample chain by their
electrostatic attraction [39]. Excitons migrate to sites with lower energy (i.e. segment
with longer conjugated length) before decaying and lead to red-shifted emission [40].
An excimer (short for “excited dimer”) is a complex between the excited state of a
molecule and another molecule of the same type that is in its ground state [41]. The ideal
separation is in the range of 0.3 to 0.4 nm. The formation of excimers is accompanied by
a geometry distortion and leads to lower energy [41]. Because of the lower energy in the
excimer state, the emission is strongly red-shift. Different from excimers, aggregate
states mean that the electron is delocalized over two chains [42]. The delocalization then
leads to a lower energy state and a reduced PL efficiency. A lot of examples of
aggregates in conjugated polymers have been shown [27, 28, 43, 44]. Film samples show
strongly red-shifted emissions with much lower quantum efficiency compared to solution
samples.
6
Another related state is polarons. Formation of a polaron requires sufficient
distance between the electron and the hole such that they do not interact to form excitons
[45]. The electron and hole then separate onto different chains. Alternately, the electron
and hole may be captured by an impurity that provides a lower energy state. This process
is fundamental for the application of solar cells.
Since polaron pairs are non-radiative, the formation of these states results in
reduction of quantum efficiency of luminescence. Even if the excimers and aggregates
are radiative, the quantum efficiency also degrades because of a longer lifetime, which
allows for non-radiative decay. Moreover, the emission is strongly red-shifted. To
increase the quantum efficiency of luminescence, the formations of polaron pairs,
excimers, and aggregates have to be reduced. This goal can be achieved by changing the
chemical structures of polymers, including inserting another segment and shortening the
conjugation length [46], to reduce the interchain interaction. The interchain interaction
can also be reduced by using a polymer blend system [47] or by varying the solvents and
thermal treatments [48]. More details will be illustrated in the following section.
2.2 Polymer Light-Emitting Diodes (PLEDs)
Figure 2 shows the general structure of PLEDs. The light-emitting polymer is
sandwiched between an anode and a cathode. Indium-tin-oxide is the most common of
materials for anodes because of its high-work function and its transparency. Several low-
work function metals are used as cathodes, including Mg, Al, or Ca. After PLEDs are
biased, the electrons are injected from the cathode to the conducting band of the polymer,
and the holes are injected from the anode to the valence band of the polymer, as shown in
Figure 2-3.
7
Cathode
Anode Substrate
Polymer
Figure 2-2. General structure of PLEDs.
Afterwards, the electrons and holes recombine in the polymer to form excitons.
The excitons then decay and emit light. Since the cathodes are not transparent, light can
only emit from the anode side of PLEDs.
Electron Injection
Figure 2-3. The mechanism of EL in PLEDs.
- Cathode
Polymer Recombination
Anode +
Hole
8
2.2.1 Solvent Effects
As noted in the previous section, the interchain interactions of conjugated
polymers are of great interests because the PL and EL strongly depend on the chain
conformation of these polymers.
Nguyen et al. [28] measured the PL of MEH-PPV dissolved in two different
solvents, chlorobenzene (CB) and tetrahydrofuran (THF), as shown in Figure 2-4. The
PL of MEH-PPV in the CB solution is red-shifted compared to the THF solution. From
dynamic light scattering, the study showed the MEH-PPV chains in the CB have more of
an extended conformation than in the THF. This result revealed that the degree of
polymer interchain interaction increases when the polymer is dissolved in a better solvent
and is in more of an extended chain structure.
Figure 2-4. Absorption and PL of MEH-PPV in CB and THF solutions.
They further proved [49] the morphology of the cast polymer film is related to the
polymer morphology in solution. In figure 2-5, the film coated from CB shows a red-
shifted emission compared to the film coated from THF at the same concentration and
spin-speed.
9
Figure 2-5. a) PL of CB solution and thin films; b) PL of thin films coated from CB and THF solutions.
That means the degree of interchain interaction in the cast film can be affected by
solvents [50].
Liu et al. [33, 34] also showed the relationship between polymer morphology and
device performance including turn-on voltage, quantum efficiency, and current injection
efficiency, as shown in Figure 2-6.
10
Figure 2-6. Characterization of PLEDs: a) I-V curve and b) B-V curve for DCB and THF devices having similar thickness.
PLEDs prepared from the good solvent, dichlorobenzene (DCB), show a higher
current density and a lower turn-on voltage compared to devices from the poor solvent,
THF. This variance is due to the different chain conformation in the polymer thin-films.
Said result indicates that contacts between anodes and polymers are sensitive to the chain
conformation. Polymer chains with more extended conformation can improve the contact
between polymers and substrates, which lead to lower turn-on voltage and higher
efficiency of charge injection from electrodes.
11
2.2.2 Annealing Effects
Figure 2-7. PL of MEH-PPV films annealed at different temperatures.
Thermal annealing also plays an important role in controlling the chain
conformation and the film morphology. Since the polymer chains in spin-coated thin
12
films are not in thermodynamic equilibrium, thermal annealing can assist in the
movement of polymer chains toward a thermodynamic equilibrium and enhance the
packing of polymer chains, which leads to the increase of interchain interaction.
Therefore, the PL of annealed thin films shows a red-shifted emission due to a generation
of more interchain interaction species such as aggregates and excimers, as shown in
Figure 2-7(a) [51].
In Figure 2-7(b), relative PL quantum efficiency decreases with an increase of the
annealing temperature due to the generation of interchain interaction. However, instead
of showing decreasing EL efficiency, Lee and Park [52] and Liu et al. [51] found the EL
efficiency is much enhanced when devices are annealed as shown in Figure 2-8.
Figure 2-8. EL vs. current of the devices annealed at different temperature after Al deposition.
The annealing at higher temperatures may improve the interfaces between
electrodes and polymers and improve the electron- or hole-injection efficiency, which
13
may lead to higher EL efficiency despite the generation of more chain-chain interactions.
Furthermore, Kim et al. [53] also showed that thermal annealing can improve the life-
time of PLEDs. The annealing of polymer films can improve the packing of polymer
chains and reduce the defects, which leads to higher thermal stability when an electric
field is applied.
2.2.3 Degradation of PLED Devices
The short lifetime and poor durability of PLEDs are critical issues for their
commercial applications. Some degradation mechanisms have been proposed for PLEDs,
especially for devices made using poly(phenylene vinylene) [54-57] and polyfluorene
[58]. The device lifetime may be limited by photo-degradation during its operation
[59,60]. Several other factors have been reported to increase the rate of degradation of
polymer materials, including oxygen exposure [61], photo-irradiation [62], and electrical-
field induced aging. [55,58,63]. In addition to the polymer itself, degradation of its
metallic cathode causes degradation of the device [63-67]. PLED devices have been
reported to exhibit “black spots,” as shown in Figure 2-9.
When PLED devices are operated for two hours, a lot of small black spots emerge
and distribute randomly on the device as shown in Figure (a). These black spots then
expand when the operation of PLED devices continue. Figure 2-9 (e) shows that most of
this PLED device is covered by black spots and can not emit light after 40 hour
operation.
14
Figure 2-9. Evolution of black spot formation in air: a) t = 2hrs; b) t = 10 hrs; c) t = 20 hrs; d) t = 30 hrs; e) t = 40hrs.
Black spots are non-emitting areas that severely reduce the light output. Several
mechanisms have been proposed to explain the formation of black spots, including metal
from the electrode migrating through the polymer layer under electrical stress. A metallic
short is created between the electrodes leading to large currents that carbonize the
polymer, thus forming a black spot [63-65]. Local heating due to large currents was
reported to also stimulate bubble formation due to reactions between metal electrodes and
15
polymers. Pinhole defects in the cathode are commonly founds at the center of black
spots. Indeed, pinholes could form either from particulate contamination during thermal
evaporation or from voids in the granular structure of the metal cathode thin films [64], as
shown in Figure 2-10.
Figure 2-10. Schematic diagram showing dark spot induced by pinholes.
By using uniformly sized silica micro particles Lim et al. made devices with size-
controllable pinholes [66]. The relationship between the growth rates of dark spots and
the pinhole size is shown in Figure 2-11.
Figure 2-11. The linear growth of dark spot with various particles.
16
The growth rates of dark spots are linearly correlated to the pinhole sizes, which
indicate the dark-spot formation is due to the pinholes on the protective layer, which
create a path for water or oxygen.
Kim et al. [67] also pointed out that the transport of water and oxygen through the
pinholes to reach the cathode/polymer interface can lead to oxidation of the metal
cathode and formation of a higher resistance poly(3,4-ethylenedioxythiophene)-poly(4-
styrenesulfonate) (PEDOT-PSS) layer, as shown in Figure 2-12.
Figure 2-12. Proposed electrochemical half-cell reactions showing the oxidation of metal (M) and the reduction of doped PEDOT.
The oxidation of active metal and reduction of PEDOT generate non-conducting
materials near pinholes, which increase the local resistance dramatically and cut off the
current density. These non-emissive areas, specifically the dark spots, then cause a
reduction of device active areas and luminescence outputs.
17
2.3 Defects of Spin-Coated Polymer Thin-Film
The spin-coating process has been studied for many years and many models have
been proposed [70-73] to explain the mechanism of this process. Due to the complexity
of the spin-coating process itself, simplified assumptions have been made in these
models. Most studies have focused on the relationship between film thickness and
various parameters, including the solution concentration, viscosity, evaporation rate, and
spinning speed [70-75]. Some important factors, like the interaction between the
polymers and solvents during evaporation, have been ignored. Recently, the influence of
the type of solvents used on the structure of polystyrene thin films on Si wafer has been
reported [76,77]. Figure 2-13 and 2-14 show the surface structure of polymer thin-films
coated from solvents with a high-evaporation rate.
Figure 2-13. Polystyrene coated from THF solution.
18
Figure 2-14. Polystyrene coated from cyclohexane and acetone mixed solution.
These studies showed that polymer films which were coated from high-
evaporation-rate solvents exhibited a higher roughness surface due to the Marangoni
instability [78].
2.3.1 Bénard-Marangoni Convection
In the classical thermocapillary Marangoni convection, rapid evaporation causes
local cooling at the surface. The temperature difference between the surface (T1) and the
interface (T2) leads to a surface tension gradient and drives convective flows, as shown in
Figure 2-15.
Figure 2-15. The Marangoni convection.
19
The formation of this instability is governed by the competition among surface
tension, thermal diffusion, and viscosity, which can be expressed by the Marangoni
number Ma:
aTHTMa
µσ ∆∂∂−
=)/( Equation 2-1
where )/( T∂∂σ is the temperature derivative of the surface tension; T∆ is the
is temperature difference between the bottom and surface of the liquid; H the film
thickness; and µ and a are the viscosity and the thermal diffusivity of the system,
respectively. The critical value of Ma which can trigger instability is around 80 [79]
However, the classical Marangoni convection is proposed on the assumption that the
temperature gradient is linear through the solution layer. During the spin-coating
process, the rapid evaporation near the solution surface leads to non-uniform temp
gradients. The thermocapillary effects upon this development are expressed as:
.
erature
aTHTσ ∇∂∂− 2)/(Ma
µ= Equation 2-2
More recently Haas et al. [80] have determined the conditions that would lead to
therm
Ma
ient
and is expressed as:
ocapillary convection during the spin-coating process. Due to the squared
dependence of H, the thermocapillary driven convection can be induced within a
sufficiently thick solution layer of high-evaporation rate. For thin-solution films,
would be too small and thermocapillary-induced-convection thus becomes unstable.
Birnie [81] has pointed out that the concentration effects (solutocapillary) are more
important than the temperature gradient (thermocapillary) during the spin-coating
process. The driving force is a composition gradient rather than a temperature grad
20
DaCHTMa ∇∂∂−
=2)/( σ Equation 2-3
where C is the relevant composition variable and D is the diffusion rate of the component
driving the composition dependent s
e
another potential limitation for their use in
-films can be deposited on non-wetting substrates via the
spin-c
silicon
es
at
),
and n
urface-tension change. Evaporation of solvents
during the spin-coating process generates the composition gradient at the solution surface
and leads to convection. All of these instabilities induced by the differences of surfac
tension are called the Marangoni effect.
2.3.2 Dewetting Phenomenon
Dewetting of polymer thin-films is
PLEDs. Although polymer thin
oating process, these polymer films are usually unstable or metastable.
Perturbations, like heat loading, lead to a relaxation towards thermodynamic equilibrium.
Many studies have been done, especially for the system of polystyrene (PS) on
[82-86]. In the beginning, the polymer films tear up and holes form, as shown in Figure
2-16. These holes then expand gradually. The dark part around the holes in these imag
is the rim. Finally, the polymer films are totally dewetted to form polymer droplets,
which are in thermodynamic stability on the Si wafer, as shown in Figure 2-17 [86].
The general mechanisms [84,86,87] to describe the dewetting process due to he
loading include spinodal dewetting (by the amplification of capillary wave fluctuation
ucleation (from defects) and growth.
21
Figure 2-16. Micrograph of different stages of polystyrene dewetting on Si wafer: a) 15 mins and b) 1hr.
Figure 2-17. The droplets left on the Si wafer.
22
Recent research [89] also has shown dewetting when aqueous polymer solutions
were coated on glassy hydrophobic substrates. In these cases, the film dewetting
occurred during evaporation of the solvent. The unstable aqueous films broke up through
the nucleation of holes, and the growth of these holes led to a fingering pattern, as shown
in Figure 2-18.
Figure 2-18. Film structure of dewetted thin films: a) A dewetting pattern centered at a defect (50 x 50 µm) and b) pattern at high magnification (5 x 5 µm).
CHAPTER 3 MARANGONI EFFECTS ON POLYMER THIN FILM STRUCTURE
3.1 Introduction
So far, most studies of polymer thin-film morphology and its instability phenomena
have been limited to polystyrene deposited on silicon. No studies about the instability
during thin-film formation of light-emitting polymers have been reported. Since the
quality of polymer thin-films is a critical factor in the performance of polymer electronic
devices, it is necessary to understand the instability phenomenon in light-emitting
polymer systems. In this chapter, the focus is on the relationship between solvents and
the film structure of poly(n-vinyl carbazole) (PVK) on indium tin oxide (ITO) glass.
Containing the positive charge transporting carbazole pendant groups [90], PVK is now
extensively used as the hole-transport layer in low-molecule weight organic light-
emitting diodes (OLEDs) [91]. Recent studies have also shown that PVK is a candidate
for blue polymer light-emitting diodes (PLEDs) [92,93]. These similar results can also
be observed by using poly(2-methoxy-5-(2’-ethyl-hexyloxy)-1,4-phenyl vinylene)
(MEH-PPV). MEH-PPV, which is a common light-emitting polymer, has attracted much
attention recently due to its high solubility in many organic solvents.
In this chapter, the instability phenomenon induced by Marangoni effects on the
light-emitting polymer thin films is developed. The other instability phenomenon,
rupture of polymer thin-films during the spin-coating process, will be illustrated in
chapter 4. The chemical structures of PVK and MEH-PPV are shown in Figure 3-1.
23
24
Figure 3-1. Chemical structure of a) PVK and b) MEH-PPV.
3.2 Experiment
3.2.1 Sample Preparation
ITO coated glass (CG-51IN, ITO layer = 120~140 nm, Delta Technologies,
Limited) was cleaned in ultrasonic baths of deionized water, ethanol, and acetone
respectively for 15 minutes each before being used. PVK (Mw = 90,000, Polydispersity
= 2.40, Scientific Polymer Product) and MEH-PPV (Mn = 40,000-70,000, Aldrich) were
used as received. PVK solutions with fixed concentration (10 mg/mL) were prepared.
MEH-PPV solutions with lower concentrations (2-7 mg/mL) were prepared due to its
lower solubility. All solutions were filtered (0.2 µm PTFE filter, Fisher) before being
used. The physical properties and Mark-Houwink parameters for the five solvents used
are shown in Tables 1 and 2. Spin coating (time = 30 seconds) was conducted in ambient
laboratory air.
25
Table 3-1. Characteristic data of solvents at room temperature.
Table 3-2. The Mark-Houwink parameters for PVK at 25oC.
Solvent K a
THF 1.55 0.65
Chloroform 1.36 0.67
Benzene 3.35 0.58
Toluene 7.72 0.50
TCE 1.29 0.68
26
3.2.2 Characterization
3.2.2.1 Atomic Force Microscopy (AFM)
The film structure and root mean square (RMS) roughness were measured using
tapping mode AFM (Digital Instruments Nanoscope III). A single silicon probe with a
tip radius of 5-10 nm was used. The cantilever was oscillated at or near its resonance
frequency between 300 to 350 kHz. The set point for the feed-back control was between
0.7 and 4V. Height images, which represent the topography of the sample surface, were
recorded with a scan range from 10 to 100 µm. All AFM images were obtained in
ambient air.
3.2.2.2 X-Ray Reflectivity (XRR)
XRR measurements were performed with a Panalytical X’Pert MRD System. A
ceramic filament tube with a Cu-target was used as the X-ray source (λ = 1.54Ǻ). The
scan rate was 0.02 degree/sec. A parallel plate collimator was attached to the detector to
improve the peak-to-noise ratio. The reflectivity curves provide information about the
film structure perpendicular to the surface [97,98]. The acquired XRR spectra were fitted
using the WinGixa software package from Panalytical to obtain the film thickness,
density profile, surface and interface roughness.
3.3 Results and Discussion
3.3.1 High-Evaporation-Rate Solvents. Table 3-1 shows that THF, chloroform, and
benzene have a relatively higher evaporation rate than toluene and TCE. For PVK, THF
and chloroform are good solvents (a ≈ 2/3), whereas benzene is a poorer solvent, as
shown in Table 3-2.
Figure 3-2 shows the film structure of PVK thin films prepared from THF and
chloroform solutions.
27
Figure 3-2. Film structure of polymer thin-film observed with optical microscopy: (a) prepared from THF solution, center area; (b) prepared from THF solution, away from center area; (c) prepared from chloroform solution, center area; (d) prepared from chloroform solution, away from center area. Length of scale bar 200µm.
The film structure from benzene is similar to the film from chloroform solution.
The film structure near the sample’s center (Fig. 3-2(a) and 3-2(c)) shows a cellular
structure, which is similar to Bénard cells [99] caused by Marangoni convection. The
film structure away from the center shows striations (Fig. 3-2(b) and 3-2(d)) which
commonly occur in spin-on thin films prepared with high-evaporation-rate solvents.
Comparing Fig. 3-2(a) and 3-2(b) or 3-2(c) and 3-2(d), the film prepared from the THF
solution shows a much higher contrast than from the chloroform solution, which indicates
that the polymer film from the THF solution is rougher than from the chloroform solution
Figure 3-3 shows AFM images of thin film surfaces prepared from chloroform.
28
Figure 3-3. 3D tapping mode AFM image of PVK film surface prepared from (a) chloroform solution, cell structure near center area; (b) chloroform solution, striation structure away from center area.
These images show a clear cell structure in the center part of the polymer film
(Fig. 3-3(a)) and striations away from the center (Fig. 3-3(b)) although the polymer films
are locally smooth. These results show that Marangoni convection has changed the
topography of these polymer films. The structure of polymer thin-films from the benzene
29
solution is similar to the films from chloroform. Different from the film structure of
polymer films prepared from the THF solution, the polymer films prepared from the
chloroform and benzene solutions exhibit continuous film surfaces instead of the
formation of holes or polymer droplets. These results show that polymer films from
chloroform and benzene, which are immiscible with water, do not show polymer
dewetting during the spin-coating process.
We can understand these results by considering the effect of Marangoni convection.
During the spin-coating process, the evaporation of the organic solvent induces the
composition and temperature gradients at the same time in the thin solution film, as
shown in Fig. 3-4.
Figure 3-4. The Marangoni convection model (including composition-gradient-driven and temperature-gradient-driven processes) for the spin-coating process. T1 and C2 represent the temperature and solution concentration near the surface of the solution layer; T2 and C1 represent the temperature and solution concentration near the interface between the solution layer and the ITO substrate.
The evaporation of the solvent leaves the solution layer with a higher polymer
concentration near the surface. In addition, the evaporation can also induce cooling near
the surface. Because surface tension is a function of solution concentration and
30
temperature, the concentration and temperature gradients will change the surface tension
during the spin-coating process, inducing flow near the surface of the thin solution film.
The high-surface-tension area pulls the solution from the low-surface-tension area,
leading to Marangoni convection. According to the reviews in Chapter 2, the
concentration effects will be more important for this work due to the film thickness that
results from spin coating. The thickness in our system is smaller than 1 µm, which leads
to a small Ma in equation 2-2 and unstable thermocapillary-induced convection. The
composition-gradient-driven convection from equation 2-3 dominates in our system.
Figure 3-2 shows that this is because the topography of polymer films from THF is
not only affected by the Marangoni convection but also, as illustrated further in chapter 4,
the rupture of the polymer thin film during the spin-coating process.
3.3.2 Low-Evaporation-Rate Solvents.
From Table 1, toluene and TCE show relatively low-evaporation rates. The center part of
the film coated from TCE under the optical microscope is shown in Figure 3-5.
Figure 3-5. Film structure of PVK thin film observed with optical microscopy prepared from TCE solution, center area.
The image shows the film coated from TCE is very smooth without cell structure
and striations. Films coated from toluene also show the same film structure as those
31
coated from TCE. The image from tapping-mode AFM (Figure 3-6) also shows smooth
surfaces.
Figure 3-6. 2D tapping mode AFM image of PVK surface prepared from toluene solution.
These results show that Marangoni convection is minimal in low-evaporation-rate
solutions including both a good solvent (TCE) and a poor solvent (toluene). The low-
evaporation rate decreases the composition gradient near the surface of the solution film,
which leads to a lower Ma value based on equation 2-3, and therefore no Marangoni
convection occurs during the spin-coating process. Figure 3-7 shows the RMS roughness
measured by AFM.
32
0
1
2
3
4
5
6
7
0 2 4 6 8 10 12
Evaporation rate (BuAc=1)
RM
S ro
ughn
ess (
nm)
Chloroform
Benzene
TolueneTCE
Figure 3-7. RMS Roughness plotted as a function of evaporation rate of four solvents.
The roughness of polymer films from the chloroform and benzene solutions shown
here was measured near the cell-structure area. The roughness of the striations is slightly
higher than the cell-structure area. These results clearly show the dependence of surface
roughness on evaporation rate. During spin coating, the solutions with a high
evaporation rate lead to high surface roughness due to the Marangoni effect.
For making MEH-PPV polymer thin-films, chlorobenzene (CB) is substituted due
to the low solubility of MEH-PPV in toluene. The boiling point of CB (132oC) is higher
than toluene, which indicates CB is also a low-evaporation-rate solvent. The structures
of MEH-PPV thin films coated from THF, chloroform, CB and TCE as imaged by optical
microscopy are shown in Figure 3-8. The surface topography of MEH-PPV thin films
from chloroform and TCE are shown in Figure 3-9.
From these results, the structures of MEH-PPV thin films show the same trend as
PVK thin films, which are controlled by the Marangoni effect and dewetting during the
spin-coating process.
33
Figure 3-8. MEH-PPV Film structure of polymer thin-film observed with optical microscopy: (a) prepared from THF solution, center area; (b) prepared from THF solution, away from center area; (c) prepared from chloroform solution, center area; (d) prepared from chloroform solution, away from center area; e) prepared from CB solution; prepared from TCE solution.
34
Figure 3-9. 2D tapping mode AFM image of MEH-PPV film surface prepared from (a) chloroform solution, cell structure near center area; (b) TCE solution, smooth surface near center area.
3.3.3 XRR Measurement. Typical XRR spectra acquired from the polymer films are
shown in Fig. 3-9, while results from the simulations, including RMS roughness,
thickness, and density, are shown in Table 3-3.
35
1 2 3 4 5
TCE
Toluene
Benzene
Chloroform
Log
(Inte
nsity
) (ar
b. u
nit)
θ degree
Figure 3-10. X-ray reflectivity spectra acquired from PVK thin films prepared from chloroform, benzene, toluene, and TCE solutions. Experimentally measured data are shown as a solid line; fitted results are shown as a dotted line.
Table 3-3. Characteristics of PVK films obtained from XRR measurements.
Solvent RMS Roughness
(Å)
Density
(g/cm3)
Thickness
(Å)
Chloroform 24 0.88 151
Benzene 18 0.96 852
Toluene 9 1.23 811
TCE 9 1.29 320
36
The fitting results (dotted line) are in favorable agreement with the measured
spectra (solid line). The surface roughness values displayed in Table 3-3 show the same
trend as the values from AFM measurements.
The polymer films deposited using high-evaporation-rate solvents, such as
chloroform and benzene, lead to significantly higher surface roughness than using low-
evaporation-rate solvents, like toluene and TCE. The densities of polymer films
deposited using the low-evaporation-rate solvents, toluene and TCE, showed values
similar to solid bulk PVK (1.2g/cm3). One possible explanation for a lower density of
polymer films from the chloroform and benzene solutions is the high surface roughness.
The other possibility is due to the trapping of defects or free volume in polymer films
during the fast evaporation of the solvent and the presence of some gas trapped near the
surface of the polymer films due to the Marangoni convection. The film densities did not
show any obvious differences between a good solvent (TCE) and a poor solvent
(toluene).
Comparing the thickness of the polymer films, the films from the chloroform and
TCE solutions show lower thickness compared to other solvents. According to previous
studies [73], the spin-coating process can be divided into three phases. During the first
phase, most of the solution is flung from the substrate. Only a much thinner and uniform
film is left. At this time, the spin speed is high and shear thinning may occur. The film
structure is dominated by the inertia of the solution. The second phase begins when the
inertial effects become negligible and the film thickness is determined by the balance of
viscosity and centrifugal forces. In the final phase, further fluid is lost due to solvent
evaporation. From this model, solutions with higher viscosity will lead to thicker
37
polymer films. From Table 3-2, PVK dissolved in ideal solvents exhibits higher viscosity
than in poor solvents ([η]benzene ~ [η]toluene < [η]chloroform < [η]TCE). However, the higher
density of chloroform and TCE lead to higher centrifugal forces and cause much more
solution to be flung from the substrate in the first and second phases during spin coating.
Our experimental results show that films from benzene and toluene are thicker than from
chloroform and TCE. The lower viscosity of the benzene and toluene solutions would
lead to thinner films, while the lower density would lead to thicker films; comparison of
these predictions to the experimental results indicates that the density of solvents
(centrifugal force) dominates the polymer film thickness in this system.
The XRR results from MEH-PPV films are shown in Figure 3-10 and simulated
values are shown in Table 3-4.
1 2 3 4
2.5 mg/mL, Chloroform
5 mg/mL in Chloroform
7 mg/mL, Chloroform
7 mg/mL, Chlorobenzene
7 mg/mL, TCE
Log
Inte
nsity
(arb
. uni
t)
Figure 3-11. X-ray reflectivity spectra acquired from MEH-PPV thin films prepared from chloroform, chlorobenzene, and TCE solutions. Experimentally measured data are shown as a solid line of light color, and fitted results are shown as a solid line with dark color.
38
Table 3-4. Characteristics of MEH-PPV films obtained from XRR measurements. Solvent Concentration
(mg/mL)
Thickness
(Å)
Density
(g/cm3)
RMS Roughness
(Å)
TCE 7 227 1.32 13
Chlorobenzene 7 391 1.26 15
Chloroform 7 379 0.72 40
Chloroform 5 216 0.70 23
Chloroform 2.5 149 1.28 16
From the results shown in Table 3-4, the MEH-PPV films coated from TCE and
CB show lower roughness and higher density than the films coated from chloroform with
the same polymer concentrations (7mg/mL). Compared to the film coated from
chloroform solutions with different concentrations, films coated from chloroform
solutions with lower concentrations have lower thickness. The thinnest film, which was
coated from chloroform solution with 2.5 mg/mL concentration, has a similar roughness
and density as the films coated from TCE and CB.
We can see these results are coincident to the results of PVK films when MEH-
PPV films are coated from different solvents with the same concentration. The thinnest
film coated from chloroform solution has a similar roughness as films coated from TCE
and CB, which indicates Marangoni convection is not induced in this system. From
equation 2-3, the Ma number is proportional to the height squared of the thin film. It
indicates that when films are too thin, Marangoni convection could not be induced even if
solvents with high-evaporation-rate are used.
39
3.4 Conclusion
The polymer film structure is determined by the dynamics of the spin-coating
process, which is controlled to a large effect by the solvent properties. The chloroform
and benzene solutions, which have a high-evaporation rate, lead to Bénard cell and
striation morphology on polymer films and result in high-surface roughness due to
composition-gradient-driven Marangoni convection. The film structure of polymer films
from good solvents and poor solvents did not exhibit obvious differences, which shows
the interaction between polymer chains and solvents is not an important factor in the
dynamic instabilities. During the spin-coating process, the solvents with higher density
have higher centrifugal forces and lead to more solvent being flung from the substrate
and therefore thinner polymer films.
We expect these differences in film structure to have an important effect on PLED
device performance, depending on the solvent used. In films from THF solution, the
large-scale inhomogeneities in the film will lead to inhomogeneous light emission (More
details will be illustrated in Chapter 4). In addition, according to previous studies
[100,101], one of the intrinsic degradation mechanisms of OLED and PLED devices is
due to the diffusion of the metal from the electrode into the organic layers and the
quenching of luminescence in the emission zone. In our studies, the polymer films from
the chloroform and benzene solutions showed higher roughness and lower density due to
Marangoni convection. We believe the inhomogeneous polymer surface could affect the
durability of the PLED devices by enhancing the possibility of metal diffusion into the
emissive layer.
CHAPTER 4 RUPTURE OF POLYMER THIN FILMS DURING SPIN-COATING PROCESS
4.1 Introduction
As noted in chapter 3, this chapter focuses on another instability phenomenon—the
rupture of polymer thin-films. Although ruptured thin films show a similar film structure
as dewetted thin films, the mechanism is different from the dewetting phenomenon
induced by heat loading after the spin-coating process, because the rupture of polymer
thin films described in this chapter occurs during the spin-coating process. In this
chapter, results show that the water in THF is an important factor for the rupture of
polymer films. Two polymer systems, PVK and MEH-PPV, are used in this chapter. As
noted in chapter 2, MEH-PPV has attracted much attention recently due to its high
solubility in many organic solvents, which is helpful for investigating the relationship
between chain conformation and optical properties. In this chapter, MEH-PPV is used to
study the influence of polymer conformation when ruptured polymer films are formed.
The effect of film rupturing on the performance of devices is also illustrated.
4.2 Experiment
4.2.1 Sample Preparation
Cleaned indium tin oxide (ITO) coated glass (Delta Technologies) was used as the
substrate. PVK solutions with fixed concentration (10 mg/mL) were prepared. MEH-
PPV was dissolved in THF (Aldrich) at three concentrations (2.5, 5, and 7 mg/ml). These
solutions were filtered (0.2 µm PTFE filter) and spin-coated on ITO glass at 1000, 3000,
and 5000 rpm. “Dried” THF means that THF was dried by molecular sieves (4Ǻ, 8-12
40
41
mesh, Aldrich) overnight before being used. To induce dewetting, 2-5% (v/v) water was
added to the polymer solutions. Poly(3,4-ethylenedioxythiophene)-poly(4-
styrenesulfonate) (PEDOT-PSS, Bayer) water solution was filtered before being used.
4.2.2 Characterization
The topology and structure of polymer films were observed by tapping-mode AFM
(Digital Instruments Nanoscope III). The surface root-mean-square (RMS) roughness
was calculated by the software package included with the AFM. PL spectra were
obtained in ambient air with an excitation energy of 490 nm. The emission was collected
by a monochromator (Oriel instrument, Electo-optical systems).
4.3 Results and Discussion
Figure 4-1 shows SEM images of a polymer thin film prepared from THF.
Figure 4-1. SEM image of polymer prepared from THF solution: (a) center area with a low magnification, length of scale bar 200µm; (b) away from center area with a low magnification, length of scale bar 10µm; (c) center area with a high magnification, length of scale bar 200µm; (d) away from center area with a high magnification, length of scale bar 10µm.
42
The images with high magnifications (Fig. 4-1(c), 4-1(d)) show obvious rupturing
of the film. Near the center of the film (Fig. 4-1(c)), many holes formed and few polymer
droplets formed inside these holes. Away from the center area, striations formed
(running from top-left to bottom-right in Fig. 4-1(b)), and polymer droplets formed along
with the striations (Fig. 4-1(d)). Compared with the film structure in chapter 3, only
polymer films prepared from THF show the ruptured thin film structure. Polymer films
from other solutions showed smooth and continuous surfaces. To investigate the basis of
the rupture of polymer films during the spin-coating process from the THF solutions, we
compared the properties of these five solvents and found only THF shows good
miscibility with water (Table 3-1). Since the entire process of solution preparation and
spin coating were done in ambient air, it was believed that a small amount of water was
dissolved in the THF solution during the spin-coating process even when THF was dried
previously. To test the influence of water on the thin-film structure, several THF
solutions with different concentrations of water were prepared for film deposition. The
SEM images of the film structures are shown in Figure 4-2. Figure 4-2(b) shows the
structure of polymer films prepared from dried THF. It shows that many holes formed on
the surface without the presence of polymer droplets. This ruptured film structure is
similar to the beginning of polymer dewetting due to heat loading, although in this case
the rupture occurs due to evaporation of the solvent (discussed further below) rather than
the application of heat. As the water content increased, the structure changed from a
continuous film with holes to isolated polymer droplets (Fig. 4-2(d)). Finally, polymer
droplets replaced the entire polymer film, which is similar to the final stage of polymer
43
dewetting (Fig. 4-2(f)). These results indicate that the degree of polymer rupturing is
related to the concentration of water.
Figure 4-2. SEM image of polymer thin-film prepared from THF solution with different H2O contents: (a and b) THF dried by molecular sieve for 1 day with a low and high magnification, length of scale bar 200 and 10 µm, respectively; (c), (d) 10µL of H2O added in 5 mL of THF with a low and high magnification, length of scale bar 200 and 10 µm respectively; (e), (f) 100µl H2O added in 5mL of THF with a low and high magnification, length of scale bar 200µm and 10 µm, respectively.
Different from the dewetting phenomenon induced by the heat loading after the
spin-coating processes, this polymer rupturing happened during the spin-coating process.
Two proposed mechanisms, spinodal dewetting or nucleation and growth, have been used
to explain the relaxation processes of metastable or unstable polymer films toward
44
thermodynamic equilibrium with heat loading. The polymer film rupturing during spin
coating is dynamic in nature and cannot be explained by these two mechanisms. Gu, et
al. [89] have shown the dewetting of aqueous polymers coated on hydrophobic substrates.
Since the ruptured film structure only occurs when some water is added to the THF
solution, we need to test if the effect between water and ITO is the cause for this ruptured
film structure. We conducted contact angle measurements of water on ITO and found a
contact angle around 90o, indicating that our ITO substrate is hydrophobic. To test the
effect of water during spin coating of a water-soluble polymer on the ITO substrate, we
studied the surface structure of a PEDOT-PSS thin film spin-coated from water solution
(Fig 4-3).
Figure 4-3. PEDOT-PSS film structure on ITO substrate observed with optical microscopy: (a) low magnification, length of scale bar = 200µm; (b) high magnification, showing presence of a hole, length of scale bar = 20µm.
Although there are some holes on the PEDOT-PSS film, the film structure is totally
different from the PVK film from the THF solution shown in Fig 4-1. Recall, as
described previously, that the PVK thin films spin-coated from other water immiscible
organic solvents, like chloroform or chlorobenzene, show smooth surface. These results
45
indicate the substrate effect is not the reason for the formation of the ruptured film
structure.
In our system, polymers are dissolved in THF/water solvent. Comparing the
properties of water and THF, water has a higher surface tension (72.8 dynes/cm) than
THF (24.8 dynes/cm). Furthermore, polymers, including PVK and MEH-PPV, show
poor interaction with water and cannot dissolve in water. Therefore, the process of fast
evaporation in this system is very complicated and can be analyzed as follows: in the
very beginning, during the spin-coating process, the evaporation of THF induces
Marangoni convection which will lead to thicker and thinner parts around the whole
polymer film. Due to the higher evaporation rate of THF than water, the solution layer
near the surface has a higher water concentration and leads to a higher surface tension
gradient, which can potentially drive a substantial convection. Additionally, the
precipitation of PVK or MEH-PPV can potentially occur at the same time due to the
incompatibility between the water and polymers. These phenomena could be important
factors for the formation of ruptured thin films, but the details of the rupture mechanism
are still not clear. Two possible mechanisms for the film rupturing during the spin-
coating process are proposed and discussed further in chapter 8. In the last stage the thin
film develops a few holes in the thick area and small polymer droplets in the thinner area
on the ITO substrate.
The water-induced dewetting phenomenon was also studied by Bonaccurso et al.
[102], who found dewetting of ultrathin polystyrene films induced by saturated water
vapor after spin-coating. More recently, Muller-Buschbaum et al. [103] also showed that
diblock copolymers dewetted on silicon during the spin-coating process. These results
46
show the interaction between the polymers, solvents, and substrate plays a significant role
in the dewetting phenomenon and the rupture of polymer thin films.
Figure 4-4 shows the optical microscopy and the SEM images of dewetted MEH-
PPV film structures.
Figure 4-4. Structure of ruptured thin films: a) Optical microscopy image of MEH-PPV thin film prepared from 5% H2O in THF, striation structure away from center; b) SEM image of same film with higher magnification.
47
Figure 4-4(a) shows a similar striation structure as PVK films under an optical
microscope. Figure 4-4(b) shows the polymer films are ruptured and a lot of polymer
droplets formed on the substrate. The AFM image of MEH-PPV thin films prepared
from dried THF solution and 5% water in THF solution lead to different surface
structures, as shown in Figure 4-5.
Figure 4-5. Height contrast of polymer thin-films from (a) dried THF solution with polymer concentration of 5 mg/ml; (b) 5% water in THF solution; (c) height profile of film along the line indicated in (a); (d) height profile of film along the line indicated in (b).
The thin films from dried THF (Fig. 4-5(a)) are much smoother than from
THF/water solution (Fig. 4-5(c)). Film structures from THF/water solution consist of
polymer droplets instead of a continuous polymer thin film. The height profile of the
polymer film from the THF/water solution clearly shows the presence of polymer
droplets on the ITO substrate (Fig. 4-5(d)). The dewetting of MEH-PPV films is due to
the incompatibility of the water and MEH-PPV. During the spin-coating process, THF
evaporates faster than water due to its high-evaporation rate, leading to phase separation
48
into a water-rich phase and a polymer-rich phase. After the THF and water completely
evaporate, polymer droplets are formed on the ITO substrate (Fig. 4-5(d)).
The RMS roughness of polymer films from dried THF solutions of different
polymer concentrations are similar to each other (<5nm) as shown in Table 4-1.
Table 4-1. Roughness of MEH-PPV polymer films prepared from the dried THF and THF/water solutions
Roughness (nm) Concentration
(mg/mL)
Spin Speed
(rpm) Dried THF 2% H2O 5% H2O
1000 2.7 32.2 *
3000 2.2 14.3 *
7
5000 2.3 12.0 *
5 1000 3.1 15.8 32.1
2.5 1000 2.0 8.1 11.7
For polymer films spin-coated from the THF/water solutions, the film from a high-
polymer concentration solution (7 mg/ml) shows much higher roughness. The roughness
also increases as the water concentration increases in the polymer solutions at the same
polymer concentration (5 mg/ml). In Table 4-1, the roughness of polymer films from the
dried THF solution with different spin-speed is similar. After 2% water is added, the
polymer film from the lowest spin-speed shows the highest roughness. According to the
model of the spin-coating process described previously, higher concentration and low
spin-speed lead to higher thickness. Based on our results, roughness increases
dramatically as the thickness of the polymer film increases.
The PL measurement of these polymer films are shown in Figure 4-7.
49
520 540 560 580 600 620 640 660 680 700
2 mg/ml + 5% H2O
5 mg/ml + 5% H2O
2 mg/ml
5 mg/ml + 2% H2O5 mg/ml
7 mg/ml + 2% H2O
7 mg/ml
Inte
nsity
(Arb
. Uni
t)
Wavelength (nm)
520 540 560 580 600 620 640 660 680 700
5000rpm; 2% H2O added
5000rpm; dried THF
3000rpm; 2% H2O added3000rpm; dried THF
1000rpm; 2% H2O added
1000rpm; dried THF
Inte
nsity
(Arb
. uni
t)
Wavelength (nm)
(a)
(b)
Figure 4-6. PL spectra of MEH-PPV polymer thin-films.
Polymer films with higher thickness caused by higher polymer concentration (Fig.
4-6(a)) or lower spin-speed (Fig. 4-6(b)) show higher PL intensity. Comparing the PL of
non-dewetted and dewetted polymer films, the addition of water not only lowers the PL
intensity, but also leads to red-shifted PL peaks. The red shift is also related to the
50
thickness of the polymer films. The polymer films with higher thickness (higher
concentration or lower spin-speed) show more red shift (Fig. 4-6(a) and (b)) and the
increase of water concentration also leads to more red shift (Fig. 4-6(a)). From previous
studies, the red shift of PL is due to the enhancement of chain interaction and the
formation of aggregates. To identify the cause for this phenomenon in our system, we
measured the PL of MEH-PPV in THF solution (7 mg/ml) with different concentrations
of water, as shown in Figure 4-7.
520 540 560 580 600 620 640 660 680 700
15% H2O12% H2O
10% H2O7.5% H2O
5% H2O3% H2O2% H2O1% H2ODried THF
Inte
nsity
(Arb
. uni
t)
Wavelength (nm)
Figure 4-7. PL spectra of MEH-PPV in THF solutions (7 mg/ml) with different water concentrations.
The emission (~550 nm) from polymer solutions does not show a red shift when
water concentration is increased up to 7.5%. When the water concentration is higher than
7.5%, an additional lower energy emission at 590 nm appears due to the precipitation of
MEH-PPV in the THF solutions. These two separate emissions indicate two different
polymer-chain conformations. According to the description by Hu et al. [104] stiff-chain
51
conjugated polymers can exist in either a non-collapsed defect-coil conformation or a
collapsed defect-cylinder conformation. The collapsed conformation leads to a lower
energy emission due to the enhancement of chain-chain interaction and the formation of
aggregates [105]. Therefore, the emission from 550 nm and 590 nm are assigned to the
non-collapsed defect-coil conformation and the collapsed defect-cylinder conformation
respectively [105], and thus the precipitation of MEH-PPV causes a coil-cylinder
transition. Comparing Figure 4-6 and Figure 4-7, the emission (~570 nm) of the thin
films is located between the emission from solution (550 nm) and precipitate (590 nm).
This indicates that the red-shifted emission from polymer thin films is mainly due to the
enhancement of interchain interaction [106] of polymer chains in the coil conformation
instead of the transition of polymer conformation from the coil to the cylinder. In turn,
the results show that the polymer conformation in the thin films is dominated by the
dynamics of spin-coating rather than thermal equilibrium. Due to the fast evaporation of
solvents during the spin-coating process, most polymer chains remain in the coil
conformation. Some polymer chains collapse to the cylinder conformation. Polymer
chains with the transition conformation between the stable coil and cylinder conformation
could also exist in the polymer thin film. The polymer chains with this complex
conformation lead to a single and broad emission band shown in Figure 4-6. Since the
PL of the polymer solutions does not alter with a change in the water content before
precipitation occurs (Fig. 4-7), the red-shifted emission of the polymer films from the
THF/water polymer solutions (Fig. 4-6) is proposed to occur during the formation of
polymer thin films. The details are discussed as follows:
52
According to our model, due to the incompatibility of MEH-PPV and water,
precipitation of MEH-PPV occurs during the spin-coating process. Higher
concentrations of water can generate higher content of precipitation of MEH-PPV in thin
films. The precipitate has a cylinder conformation, which has a higher interchain
interaction and leads to a red-shifted emission. Because of the fast evaporation rate
during spin coating, the polymer chains cannot be transferred to the cylinder
conformation in thermodynamic equilibrium like the process of precipitation formation
shown in Figure 4-7. Table 4-2 shows the emission peaks as illustrated in Figure 4-6.
Table 4-2. PL of MEH-PPV polymer films prepared from the dried THF and THF/water solutions
Emission peaks (nm) Concentration
(mg/mL)
Spin Speed
(rpm) Dried THF 2% H2O 5% H2O
1000 573 583 *
3000 572 577 *
7
5000 572 573 *
5 1000 572 573 577
2.5 1000 571 571 572
*: Precipitate generation.
The results show that the red shift of these emission peaks is correlated to the water
content in the THF solutions. With increasing water content, the emission peaks are
more red-shifted and the emission peaks are located between 550 nm and 590 nm. These
results are coincident to the proposed model for the formation of ruptured thin films.
Finally, we demonstrate the influence of this dewetting phenomenon on the
performance of PLED devices. Figure 4-8(a) shows the layer structure of this PLED
53
device. A polymer thin-film coated from 2% water in the THF solution (dewetted
polymer thin-film) was used as the light-emitting layer. Figure 4-9(b) shows clear
striation structure after this PLED device was turn on.
Figure 4-8. PLED based on ruptured thin films: (a) The layer structure of PLED device. (b) The light-emitting output after the device is turned on.
4.4 Conclusion
In conclusion, we have found that the rupture of polymer films is related to the
water in THF. The rupture of the polymer solution could be related to the change of the
54
surface-tension gradient caused by the increased content of water near the solution
surface and the incompatibility between the water and polymers, but the workings of this
mechanism are still not so clear and need further study. Compared to smooth polymer
films, the ruptured polymer films show a more red-shifted emission. We also observe
that the conformation of polymer chains in solution and precipitation are of the un-
collapsed and collapsed conformation respectively. The polymer chain undergoes a coil-
cylinder transition during the process of precipitation. Therefore, polymer films coated in
the THF solution with higher concentrations of water can lead to more polymer chains
that have a cylinder conformation and red-shifted emission. These results point out that
the water effect is a critical factor in the performance of polymer thin-film devices.
CHAPTER 5 SOLVENT, CONCENTRATION, AND ANNEALING EFFECTS ON
PHOTOLUMINESCENCE OF POLYMER SOLUTIONS AND THIN FILMS
5.1 Introduction
As noted in chapter 2, the PL and EL of conjugated polymer thin films is related to
fabrication processes, including solvents, concentrations, spin-speeds and annealing
processes. This chapter focuses on the study of the relationship between the PL and
chain conformation in MEH-PPV and PFO.
Some details of the relationship between the PL and the chain conformation in
MEH-PPV are illustrated in chapter 2. From light-scattering experiments [28], MEH-
PPV shows a more-extended chain conformation in the “good solvent,” CB, than in the
“poor solvent,” THF. Polymer chains with a more-extended conformation lead to a red-
shifted emission due to longer resonance length. Therefore, the PL of MEH-PPV in CB
shows a red-shifted emission compared to the PL of MEH-PPV in THF solutions.
Grell et al. [13,14] who worked on the PFO system, define “good solvents” and
“poor solvents” according to solubility parameters. Chloroform and THF are “good
solvents” because of their higher solubility in PFO. Toluene is a “moderately good
solvent” because of its slightly lower solubility, while cyclohexane is a “poor solvent”
because of its low solubility. According to the results, PFO in poor solvents shows an
additional red-shifted peak. Their study proposed that this emission is due to a more
compact polymer chain conformation in poor solvents, which leads to the generation of
aggregates and an additional emission peak. Comparing the results from these two
55
56
research groups, the controversy on the definition of “good solvents” and “poor solvents”
exists, as well as the explanation of solvent effects on photoluminescence.
In this chapter, the first part focuses on the solvent effect on the PL of MEH-PPV
and PFO solutions. The PL of polymers in more than two solvent systems is measured.
Combined with the results from the viscosity measurements, more details about the
polymer conformation in solutions are given and subsequently are used to explain the
relationship between the PL and solvent properties. The second part focuses on the
influences of the solvent, the polymer concentration, and the annealing process on the PL
of polymer thin-films.
5.2 Experiment
5.2.1 Sample Preparation
MEH-PPV (Mn = 40,000-70,000, Aldrich) and PFO (Mw = 52,000, American Dye
Source, Inc) were used as received. MEH-PPV was dissolved in organic solvents at
several concentrations from 0.1 ~ 10 mg/mL. These solutions were filtered (1 µm PTFE
filter) and spin-coated on ITO glass at 1000 rpm for 30 seconds.
5.2.2 PL Measurement
The PL of polymer solutions was measured in a quartz cell with the excitation
energy of 490 nm for MEH-PPV and 380 nm for PFO. The emission was collected by a
monochromator (Oriel instrument, Electo-optical systems) with a range from 530 nm to
700 nm for MEH-PPV and 400 nm to 650 nm for the PFO solutions and thin films.
5.2.3 Viscosity Measurement
The viscosity was measured with a standard Ubbelohde capillary viscometer in a
temperature-controlled water bath at ~ 28 °C. Polymer solutions were filtered through a
1.0 µm PTFE filter to remove dust particles and other impurities. Polymer solutions were
57
held in the temperature bath for approximately 15 minutes to reach thermal equilibrium.
Typically, the measurement was repeated at least three times.
5.3 Results and Discussion
5.3.1 PL of Polymer Solutions
5.3.1.1 Solvent effects
Figure 5-1 shows the PL of the MEH-PPV solutions in four organic solvents:
chloroform, CB, THF, and Tetrachloroethane (TCE).
540 560 580 600 620 640 660 680 700
Nor
mal
ized
PL
Inte
nsity
Wavelength (nm)
0.5% MEH-PPV solutions Chloroform CB THF TCE
Figure 5-1. PL of 0.5% MEH-PPV solutions.
The PL from the CB solutions shows a red-shifted emission compared to the THF
solutions, which is coincident to the results from Nguyen et al. [28]. In addition, the
emission peak of the chloroform solution is located between the peaks of THF and CB.
The PL from the TCE solutions shows the most red-shifted emission.
Figure 5-2 shows results of PFO dissolved in six organic solvents: toluene, THF,
chloroform, CB, TCE, and cyclohexaone (from left to right) with a concentration of 0.5
58
%. From the figure, chloroform shows the highest solubility and cyclohexanone shows
the poorest solubility, which is coincident to the results from Grell et al. [13].
Figure 5-2. PFO dissolved in toluene, THF, chloroform, CB, TCE, and cyclohexanone (from left to right).
Table 5-1. Solubility parameter and polymer solubility. Solvent Solubility Parameter
(cal/cm3)1/2
PFO solubility
(mg/ml)
MEH-PPV solubility
(mg/ml)
Toluene 8.9 <1 <5
THF 9.1 3~5 7~10
Chloroform 9.3 >5 >15
CB 9.5 3~5 7~10
TCE 9.7 ~1 7~10
Cyclohexanone 9.9 <1 <5
Table 5-1 shows the solubility parameters of these organic solvents [107] and the
solubility of PFO and MEH-PPV in these solvents based on our test results. Based on the
solubility of PFO and MEH-PPV, both polymers have similar solubility parameters near
9.3, and chloroform is a better solvent than the other solvents. From these results,
59
chloroform is a good solvent compared to the other organic solvents. This conclusion is
consistent with the result from Grell et al. [13].
Figure 5-3 shows the PL of the PFO solutions.
400 420 440 460 480
Nor
mal
ized
PL
Inte
nsity
Wavelength (nm)
0.05% PFO solution THF TCE Ch CB
Figure 5-3. PL of PFO in THF, TCE, Chloroform and CB.
The figure shows that PL from TCE solution has the most red-shifted emission.
The PL from THF solution shows the most blue shifted emission, which is similar to the
resultsfor MEH-PPV.
From these results, we can see the controversy of the definition of “good” solvents
and “poor” solvents. Assuming that chloroform is the best solvent compared to other
solvents, the chain conformation of MEH-PPV and PFO in chloroform should be more
extended than in the other solvents. Polymer chains with a more-extended conformation
have a longer resonance length and lead to more red-shifted emission, which means the
PL of MEH-PPV and PFO in chloroform should show the most red-shifted emission
compared to other solvents. In Figure 5-1, however, the PL of MEH-PPV in chloroform
solution does not show the most red-shifted emission. In the PFO system shown in
60
Figure 5-3, the PL from the chloroform solutions does not show the most red-shifted
emission, either. Instead, the PL from the “poor” solvent, TCE, shows a more red-shifted
emission compared to the “moderately good” solvent, CB, and the “good” solvents, THF
and chloroform.
To solve this controversy, we need to figure out the chain conformation of these
polymers in different solvent systems. The viscosity of a polymer solution is related to
the dimension of the polymer chains and can be used to estimate the polymer
conformation in solution.
The measurement of the viscosity of a solution is based on capillary flow. The
fluid flowing through a capillary follows Poiseuille’s Law:
VlPtr
8 4 ∆
=πη
where r is the radius of the capillary; t is the flow time; V is the fluid volume between the
two markers on the viscometer; and ∆P is the pressure drop. For a capillary viscometer
in the vertical position, ∆P is generated from gravity:
glP ligρ=∆
where ρliq is the density of the liquid and l is the length between the two markers. The
kinematic viscosity is defined as follows:
kinematic viscosity tV
gr
liq 8 4π
ρη
=≡
where V
gr8 4π is a constant for a given viscometer and can be determined by measuring a
fluid of known viscosity. Therefore, the kinematic viscosity of any polymer solution can
be measured by measuring the flow time, t.
61
Figure 5-4 shows the kinematic viscosities of MEH-PPV in chloroform, CB, and
TCE at different concentrations.
0 1 2 3 4 5 6 7 80
2
4
6
8
10
12
Kin
emat
ic v
isco
sity
(mm
2 /s)
Concentration (mg/mL)
TCE Chloroform Chlorobenze
Figure 5-4. The measurement of kinematic viscosities of MEH-PPV in CB, chloroform, and TCE at different concentrations.
Polymer chains are isolated and do not interact with each other at low-polymer
concentrations. When the polymer concentration is increased, the polymer chains start to
entangle with each other and the slope of the viscosity-concentration curve is changed.
In this figure, the curve for MEH-PPV in TCE changes slope at a lower concentration
compared to CB and chloroform, which indicates that the polymer chains in TCE more
easily interact with each other and form entanglements.
By measuring the viscosity of the pure solvent, ηs, the specific viscosity, ηsp, can be
calculated:
K++=−
≡ 2][ cKc vs
ssp η
ηηη
η
62
where [η] is the intrinsic viscosity, Kv is a second-order coefficient and c is the
concentration. Therefore, the intrinsic viscosity, [η], can be determined by:
csp
c
ηη
0lim][
→=
The intrinsic viscosity is a quantity characteristic of a polymer. A polymer
molecule with a larger dimension has a larger intrinsic viscosity. Figure 5-5 shows ηsp/c
plotted as a function of c for the MEH-PPV solutions.
0.05 0.10 0.15 0.20 0.25 0.30
200
400
600
800
1000
1200
η sp/c
(mL/
g)
Concentration (mg/mL)
TCE Chlorobenzene Chloroform
Figure 5-5. ηsp/c plotted as a function of c for MEH-PPV in CB, chloroform, and TCE.
This figure shows that MEH-PPV has the highest intrinsic viscosity in TCE and the
lowest intrinsic viscosity in chloroform. This indicates that MEH-PPV has a larger
dimension and a more extended chain conformation in TCE. MEH-PPV in chloroform
shows a smaller dimension and a more compact chain conformation. These results are
coincident to the PL shown in figure 5-1. MEH-PPV in TCE shows the most red-shifted
63
emission and MEH-PPV in chloroform shows the most blue-shifted emission among the
three solutions.
Therefore, from the PL results, the MEH-PPV and PFO polymer chains do not
show a longer conjugated length when they are dissolved in solvents in which they are
more soluble. This phenomenon is different from what is seen in traditional polymers.
For traditional polymers, like PS or PMMA, polymer chains show a random-walk
conformation when dissolved in good solvents, and the polymer chains are extended.
When solvents become poorer, the polymer chains contract due to the unfavorable
interaction between the polymer chains and the solvent. Therefore, the polymer chains in
poor solvents are more contracted. The difference in trend between traditional polymers
and conjugated polymers is quite possibly due to the specific chemical structure of the
conjugated polymers. MEH-PPV and PFO have rigid aromatic groups as main chains
and soft alkyl groups as side chains. The solubility of these polymers is mainly
controlled by the side chain groups, whereas the PL is controlled by the resonance length
on the main chains. So far, there are very few studies that have focused on solvent
effects on the chain conformation of conjugated polymers using computer simulation.
Recently, one study [33] was conducted comparing aromatic and non-aromatic solvent
effects on the chain conformation of MEH-PPV. Although the results could be used to
explain the red-shifted emission of the CB solution compared to the chloroform or THF
solutions, it is still not sufficient to explain the red-shifted emission as seen in the TCE
solution. The effect of this solvent on chain conformation could be very complicated and
may not conform to a simple rule.
64
5.3.1.2 Concentration effects
Figure 5-6 shows the PL of MEH-PPV in chloroform at four different
emitting diode (PLED) devices was studied using optical and electron microscopy and
Auger electron spectroscopy (AES). The formation of bubbles is shown to correlate with
pinholes in the metal contact thin film and with excess absorbed water in the presence of
the calcium layer. AES data show oxidation at the Ca/Al interface during this process.
Gas evolution and relaxation of compressive stress when voltage is applied to the PLED
devices are postulated to cause the formation of bubbles.
6.2 Experiment
6.2.1 Device Fabrication
The multilayer PLED device consisted of an indium-tin-oxide (ITO) coated glass
substrate coated with layers of PEDOT-PSS/PVK/Ca/Al, as shown schematically in
Figure 6-1. The 50 nm PEDOT-PSS (Bayer) layer was spin-coated (3000 rpm) on the
cleaned ITO coated glass, then dried at 120oC for 20 minutes. The PVK (Aldrich)
solution was prepared by dissolving 50 mg of the polymer in 5 ml of toluene and spin-
coated (700 rpm) to form a 70 nm layer on the PEDOT-PSS. The 10 nm Ca layer and
75
76
200 nm Al layer were deposited by thermal evaporation in a glass bell jar, an oil-
diffusion-pumped vacuum system with a base pressure of 4x10⁻⁶ Torr.
Figure 6-1. Schematic of the PLEDs used in this study.
To study the contributions of the various layers to bubble formation in the cathode
contact, multilayer devices were prepared as described below without selected layers, e.g.
without the Ca or PEDOT-PSS layers. Encapsulated devices means that the cathode
contact would be covered by epoxy (Quickset™, Loctite), sealing a glass slide (Micro
slide 2947, Corning) over the surface in an atmosphere of argon.
6.2.2 Characterization
Bubble formation was observed by optical microscopy after applying a current to
the devices in ambient laboratory air, or heating in various atmospheres. The chemical
composition of the cathode surface of the PLED device was determined by using a
Perkin-Elmer PHI 660 Auger electron spectrometer (AES). A primary electron beam of
5 keV was used. The Auger electron peaks at energies around 271, 294, 511, and 1398
eV are chosen for the elements C, Ca, O, and Al respectively. The composition through
the cathode and at the polymer/cathode interface was determined by using 1 keV argon
sputter depth profiling on the AES.
77
6.3 Results and Discussion
6.3.1 Bubble Formation Phenomenon and Mechanism
Figure 6-2 shows bubbles that formed in the Ca/Al cathode film on a standard
PEDOT-PSS/PVK PLED upon the application of an electrical bias within one hour after
depositing the Ca/Al cathode (Fig. 6-2(a)), or after depositing the Ca/Al cathode and
storing the device for 24 hours in lab air (Fig. 6-2(b)).
Figure 6-2. Bubble formation observed with optical microscopy: (a) biased with 7 V, 10-5 A⋅cm-2 for 1 min. within one hour after thermal evaporation of Al; (b) biased with 7 V, 10-5 A⋅cm-2 for 1 min after storage in laboratory air for 1 day (∼60% relative humidity, 27 oC). Note the lower magnification in (b).
78
Prior to the application of an electrical bias, no bubbles were observed in either
sample. Both devices were biased at 7 V, which caused a current density of 10-5 A⋅cm-2
to flow through the devices. The small bubbles in Fig. 6-2(a) developed after 15 minutes
of bias, while large bubbles developed after only 1 minute of bias on the device stored in
lab air for 24 hours. Note that in both cases, the bubbles formed around a defect
(pinhole) in the Ca/Al cathode thin film.
Do et al. [69] and McElvain et al. [68] reported that bubbles formed in Mg/Al
cathode thin films on Alq3 emitter layers due to heat, gas evolution and oxidation of the
Al as a result of electrical biasing. Savvate’ev et al. [65] reported that gas evolution
caused delamination of the Al cathode thin films on the PPV layers, resulting in electrical
noise and ultimately a current spike that resulted in carbonized polymer areas. Do et al.
[69] showed that an inert atmosphere inhibited the formation of bubbles. The effects of
the environment and encapsulation on the formation of cathode bubbles in our PEDOT-
PSS/PVK conjugated polymer devices were tested by storing devices for four days under
argon or air with and without epoxy/glass encapsulation, followed by electrical biasing at
8 V for 2 minutes (Figure 6-3). The cathode surfaces of these devices before electrical
biasing, shown on the left, are free of bubbles even when stored without encapsulation.
After electrical biasing, the surface of encapsulated devices stored in argon did not
bubble, but bubbles were observed on the surfaces of the other devices stored in argon or
air without encapsulation, or in air even with encapsulation. The bubbles were larger and
more numerous for devices stored in air (Figs. 6-3(c) and 6-3(d)) versus argon (Figs. 6-
3(a) and 6-3(b)). Devices stored in air without encapsulation formed the greatest amount
of bubbles after biasing (Fig. 6-3(d)).
79
Figure 6-3. The effects of storage ambient and encapsulation upon bubble formation as a result of electrical bias (8 V for 2 min.). Encapsulated or non-encapsulated devices were stored for four days in argon or air as follows: (a) argon with encapsulation; (b) argon without encapsulation; (c) air with encapsulation; (d) air without encapsulation. Photos on the left and right are before and after the devices were biased, respectively.
80
These data are consistent with the results of Do et al. [69] and show that argon
reduced the formation of bubbles, and with their general conclusion that moisture
accelerates their formation. It is interesting to note that bubbles were denser near the
edges of the dot contacts, suggesting that moisture could more easily penetrate into the
devices at the step edges where there was no protective Al layer.
Figure 6-4. The dependence of bubble formation on the type of conjugated polymer and temperature in the absence of electrical bias. Devices consisted of the normal ITO/polymer/Ca/Al structure, where the polymer layer is either PVK or PEDOT-PSS. Devices were examined in real time by optical microscopy while being heated on a hot stage either immediately after deposition of the cathode, or 24 hours after this deposition with storage in air. The samples and temperatures were as follows: (a) PVK, fresh, 120oC; (b) PVK, fresh, 250oC; (c) PVK, 24 hour storage, 120oC; : (d) PEDOT-PSS, fresh, 120oC; (e) PEDOT-PSS, fresh, 250oC; (f) PEDOT-PSS, storage, 120oC. Note that bubbles are observed only when PEDOT-PSS is present. Note also that bubbles were formed by heating alone without an electrical bias.
81
To determine whether PEDOT-PSS or PVK was contributing to the formation of
bubbles, devices were prepared with only a PVK (Figs. 6-4(a) - 6-4(c)) or a PEDOT-PSS
(Figs. 6-4(d) - 6-4(e)) polymer layer, respectively. In addition, to determine if simple
heating without electrical currents would cause bubbles to form, the devices were heated
to either 120oC or 250oC on a hot plate in air. Finally, devices were heated immediately
after the deposition of the cathode (fresh devices) and monitored while hot using the
when heated to 120oC (Figs. 6-4(a) and (d)). When the temperature was raised to 250oC,
only the device with a PEDOT-PSS layer formed bubbles (compare Figs. 6-4(b) and (e)).
While storage in air for 24 hours did not cause bubbles to form at 120oC on PVK devices,
large bubbles were found on PEDOT-PSS devices that were treated in a similar fashion.
These data demonstrate that water is absorbed by and evolved from PEDOT-PSS layers
to form bubbles. They also demonstrate that simple heating without an electrical bias can
result in the formation of bubbles on these devices. This is consistent with the postulate
that local heating can cause gas evolution from some polymers [65]. By real time
observations in the optical microscope, the fresh PEDOT-PSS devices started to evolve
gas and form bubbles at T ∼220oC. While storage of PVK devices in air for 24 hours did
not cause bubbles to emerge (Fig. 6-4(c)), storage accelerated their formation in PEDOT-
PSS devices. After 24 hours in air, PEDOT-PSS devices started to form bubbles at
temperatures of ∼90oC, and they were well-formed by 120oC (Fig. 6-4(f)). Observation
of the bubbles at 90oC after a 24-hour exposure to air supports the conclusion that
PEDOT-PSS layers absorb and evolve water to create bubbles. Because of the low water
content and experience with other hydrophobic polymers, it is believed that the bubbles
82
formed in fresh PEDOT-PSS samples heated to 250oC result from decomposition of the
polymer. Since PEDOT-PSS is soluble in water, it is reasonable that these layers would
absorb water under ambient storage conditions, and evolve water when heated to T~90oC.
Do et al. [69] also suggested that water can lead to formation of Al2O3 with
evolution of H2, which can cause bubbles to form. In our devices, water in the PEDOT-
PSS layer could react either with Ca or Al to form H2, e.g.:
Ca + H2O → CaO + H2
2Al + 3H2O → Al2O3 + 3H2
To evaluate the importance of these reactions, devices were made with either the
normal Ca/Al or with only an Al cathode dot contact to the normal PVK/PEDOT-PSS
bilayer structure. A small water-droplet was placed on the surface of these cathodes,
without an electrical bias being applied. The results are shown in Figure 6-5.
Figure 6-5. Formation of bubbles by water droplets in the absence of an electrical bias when a Ca layer is present. The photos are of Al only or normal Ca/Al cathode contacts with water droplets on the surface. Al-only contact (a) immediately after placing a water droplet on the surface, and (b) after a few minutes; no bubbles are observed. Ca/Al contact (c) immediately after placing a water droplet on the surface, and (d) after a few minutes; large bubbles are obvious in (d).
83
No bubbles are observed immediately after placing the water droplet on either
contact (Figs. 6-5(a) and 6-5(c)). For the cathode consisting of only an Al layer, no
bubbles were observed upon contact after 5 min (Fig. 6-5(b)). By contrast, large bubbles
are observed after <5 minutes on devices with a normal Ca/Al cathode (Fig. 6-5(d)).
Pinholes certainly existed in both the Al and the Ca/Al cathodes, allowing water to
quickly reach the metal/polymer interface. Formation of bubbles in only a few minutes
when the Ca layer was present demonstrates its importance to the formation of bubbles.
Perhaps the Ca reacts rapidly to evolve gas quickly and thereby form a bubble. This is
consistent with the fact that CaO should not form a passivating oxide layer. Conversely,
Al forms a protective Al2O3 layer and would not result in rapid H2 evolution from the
above chemical reaction. A second factor may be the mechanical strength of the
interfacial oxide formed by such reactions. An interfacial layer of CaO may fracture
more easily than Al2O3 and thus allow for a gas pocket to form a bubble.
6.3.2 Surface Composition (AES)
A scanning electron microscope (SEM) in the AES mode was used to examine the
surface for pinholes surrounded by bubbles that were produced by electrical biasing at 7
V for 10 minutes on a device stored in air for 1 day (see Fig. 6-6(a)). The AES spectra
collected from the pinhole and adjacent cathode surface are shown in Fig. 6-6(b). The
spectra from the pinhole (i) contain Auger peaks from only C and O, presumably from
the polymer thin film structure. No Al was detected in the pinhole. The spectrum from
the adjacent cathode surface (ii) contains peaks from C, O and Al. The strong oxygen
signal in (ii) is due to Al2O3 on the Al surface. The C peak is from normal adventitious
contamination due to adsorption of organics and hydrocarbons from laboratory air. Since
pinhole areas lack the protection of a continuous Al layer, they offer paths for transport of
84
water and oxygen to the Ca and polymer layers. The composition versus depth in the
PLED before and after electrical biasing was determined by sputter depth profiling shown
in Figs. 6-7(a) and 6-7(b), respectively.
Both devices showed high oxygen signals at the surface due to the formation of a
few nanometer-thick native oxide films by exposure of freshly deposited Al to air. For
the unbiased sample in Fig. 6-7(a), the oxygen concentration shows a second increase
after sputtering through the Al films and reaching the Ca underlayer. The Ca peak-
intensity rises simultaneously with that of oxygen, suggesting that the Ca was at least
partially oxidized during the thermal-evaporation process or during the delay in switching
the power supply and heating the Al boat for deposition of the Al overlayer. However,
the Ca layer was not completely oxidized to CaO since the device turn-on voltages were
lower (∼4 V) when the Ca was present at the cathode interface. By contrast, when Al
contacted the polymer layers directly, the turn-on voltage increased to ∼12 V.
85
(a) 50 µm
(i) (ii)
500 1000 1500 2000
(b)
(ii)
Figure 6-6. Pinhole structure and composition: (a) SEM image of a pinhole in the Al/Ca
cathode dot contact and surrounding bubbles generated by application of an electrical bias; (b) AES spectra from the cathode surface (i) inside the pinhole, and (ii) outside the pinhole.
Kinetic Energy
(i)
139Al
C O5127
51O
27C
86
Cycle
dN(E
)/dE
(a)
Figure 6-7. AES sputter depth profile of a normal 10 nm Ca/60 nm Al PLED cathode dot
contact (a) before and (b) after an electrical bias was applied. Note the increase of oxygen at the Al/Ca interface after electrical biasing (8 V for 10 min. in laboratory air).
As a result of biasing (Fig. 6-7(b)), the oxygen Auger peak intensity increased
before the Ca Auger peak, suggesting that the electrical bias led to oxidation of Al at the
Al/Ca interface. Based on the data reported above that the Ca layer led to the formation
of bubbles, water that evolved from the PEDOT-PSS layer may have reacted with the Ca
layer to form H2 and bubbles when the devices were biased. Once the Ca layer was
dN(E
)/dE
AlO
Ca
(b) OAl
CaCycle
87
completely converted to CaO, the water would attack the Al layer to form Al2O3 or
Al(OH)3. This interfacial oxide/hydroxide would be expected to have poor mechanical
properties and could lead to loss of interfacial adhesion and the generation of a bubble.
6.4 Conclusion
The formation of bubbles in cathode contacts to Al/Ca/PVK/PEDOT-PSS/ITO-
glass PLEDs was studied using microscopy and Auger electron spectroscopy. The data
showed that bubbles could be generated three ways: 1. by electrical biasing, 2. by simply
heating to T>90 oC without an electrical bias when moisture and PEDOT-PSS were
present, and 3. by the presence of a water droplet without an electrical bias when a Ca
layer (under an Al overlayer film) and PEDOT-PSS were present. Bubbles tended to
form around pinhole defects in the cathode thin films or around the edge of the dot
contact. The mechanism of bubble formation was suggested to be an absorption of
moisture by the PEDOT-PSS layer where the Ca/polymer interface was not protected (i.e.
at pinholes and the edge of the dot contact), and subsequent gas evolution due to
interfacial chemical reactions and/or heating. While the presence of a Ca layer in the
cathode led to significantly lower PLED turn-on voltages, it also led to interfacial
reactions and bubble formation in the presence of water droplets at room temperature
without an electrical bias. The Auger electron sputter depth profile data are consistent
with this mechanism.
CHAPTER 7 EFFECT OF THERMO-INDUCED OXIDATION ON POLYMER STRUCTURE AND
OPTICAL PROPERTIES OF POLYFLUORENE
7.1 Introduction
.Polyfluorenes (PF), which shows a blue light emission of high quantum efficiency,
can be used as the light-emitting layer in blue PLEDs [108]. The formation of a liquid-
crystalline phase further makes PF a potential material for use in polarized polymer light-
emitting devices [14]. Upon device operation, the formation of an additional emission
peak around 535 nm is usually observed. Recently, it has been shown that this emission
is due to the photo- or electro-induced oxidation of polyfluorene chains and the formation
of ketonic defects [11,109-111], as shown in Figure 7-1.
Figure 7-1. Proposed mechanism for the generation of keto-defect sites.
In first part of this chapter, the relationship between the optical properties and the
polymer morphology of poly[9,9-dioctylfluorenyl-2,7-diyl] (PFO) will be illustrated.
Then the thermo-induced oxidation of PFO and its effects on optical properties and
polymer morphology will be discussed.
88
89
7.2 Experiment
7.2.1 Sample Preparation
PFO (Mw = 52,000 and 341,000, American Dye Source, Inc) is used as received.
Polymer solutions were prepared by dissolving PFO in chloroform at concentrations
between 1 to 5mg/mL. These solutions were filtered (1 µm PTFE filter) and spin-coated
on ITO glass and Si wafer to make thin film samples. Thick film samples were prepared
by using a dip-coating process.
7.2.2 Characterization
Polarized Optical Microscopy. Polymer solutions were dropped on a glass slide
and dried in the air. Samples were examined by using an Olympus BX 60 polarized
optical microscopy in the transmission mode. A hot stage was used to control the
temperature. Images were captured by a CCD camera (3CDD, MTI).
X-Ray Diffraction (XRD). XRD was used to identify the crystallinity of the
polymer and orientation of the polymer crystals. A Phillips APD 3720 diffractometer
with a Cu Kα source was used to measure the diffraction pattern from 4 to 27 degrees.
The sample holder was filled with Ar when the measurements were conducted at
temperatures higher than room temperature. Samples were annealed at each temperature
for 10 minutes before measurement. The details of PL and XRR measurements were
already described in chapters 5 and 4.
90
7.3 Results and Discussion
7.3.1 Chain Conformation in PFO Thick Films
7.3.1.1 Molecular weight effect
Figure 7-2 shows the images of low Mw PFO samples under a polarized optical
microscope at several different temperatures.
Figure 7-2. Images of a low Mw PFO under a polarized optical microscope at (a) 120oC, (b) 150oC, (c) 210oC, and (d) 220oC.
Figure 7-2(a) shows the crystalline phase still exists in a polymer sample when the
temperature was increased to 120oC. When the temperature was raised to 150oC (Figure
7-2(b)), the polymer crystal melted and a liquid crystalline phase was revealed. After the
temperature reached 210oC, the liquid crystalline started to transform and the polymer
showed a totally isotropic and amorphous phase at temperatures higher than 210oC
(Figure 7-2(c) and 7-2(d)). This result is coincident to previous studies [14]. Indeed, the
91
PFO crystals melt when the temperature is higher than 150oC; in addition, the liquid
crystalline phase exists when T is between ~150 and 200oC.
The phase transformation can also be observed by X-ray diffraction, as shown in
Figure 7-3. X-ray diffraction of low Mw PFO samples at room temperature, 125, 150, 200, and 250oC. Sample was annealed at 250oC for 10 minutes before cooling to the measurement temperature.
92
5 10 15 20 25
(250)(530)
(520)
(330)
(310)(210)
(200)
(110)
27oC
120oC
150oC
200oC
250oC
Cou
nts/
sec
(Arb
. uni
t)
2θ (degree)
Figure 7-4. X-ray diffraction of high Mw PFO samples at room temperature, 125, 150, 200, and 250oC. Sample was annealed at 250oC for 15 minutes cooling to the measurement temperature.
The polymer samples were first annealed at 250oC in the sample holder filled with
Ar for 15 minutes. Figure 7-3 and Figure 7-4 both show the formation of diffraction
peaks when the temperature is lower than 150oC, which indicates that PFO starts to
crystallize when the temperature is lower than 150oC. Comparing the XRD profiles
measured at room temperature in these two figures, the profile from low Mw PFO shows
a much stronger (200) diffraction peak than other peaks, which is different from the
profile from high Mw PFO. From Chen et al’s work [113], the XRD profile from high
Mw PFO is mostly composed of the α phase crystalline structure with an orthorhombic
unit cell (a = 2.56 nm, b = 2.34 nm, c = 3.32 nm). More recently, their research showed
the formation of a modified α’ form, which is kinetically favored at lower crystallization
temperatures, as shown in Figure 7-5 [114].
93
Figure 7-5. Characteristic XRD profile for film in N, α, α’, and β phases [114].
The change involves a slightly longer b-axis and a preferred orientation of the a-
axis along the film normal. Our XRD profile from low Mw PFO shows the same results
as their profile from the α’ form, which indicates that the low Mw PFO is dominantly
composed of α’ form crystals. Chen et al’s results show that the same PFO sample can
form an α or α’ phase depending on the crystallization temperature. In our experiments,
the PFO of a different Mw shows a different crystalline structure even at the same
crystallization temperature. These results indicate that the molecular weight is a critical
factor for the formation of the crystalline phase. The PFO of low Mw generates more α’
phase crystals compared to the PFO of higher Mw, which tends to form α phase crystals.
As shown in both figures, the positions of the diffraction peaks that were measured
at 125oC occur at slightly lower angles than the peaks that were measured at room
temperature. From Bragg’s Law, λθ nd =sin2 , a smaller value of θ indicates a larger
value of d. The increase in size is due to the thermal expansion of PFO unit cells. The
diffraction patterns which were measured at 150, 200, and 250oC, do not show much
difference. From the images observed using polarized optical microscopy (Figure 7-2),
94
PFO forms a liquid-crystalline phase between 150 and 210oC. The same diffraction
patterns observed in the liquid-crystalline and amorphous phases indicate the PFO has a
nematic liquid-crystalline phase.
Figure 7-6 shows the effect of annealing on the crystallization of PFO.
5 10 15 20 25
Low Mw; 3 hrs
Low Mw; 15 hrs
High Mw; 15 hrs
High Mw; 3 hrs
Cou
nts/
sec
(Arb
. uni
t)
2θ (degree)
Figure 7-6. XRD profile of low Mw and high Mw PFO samples annealed at 170oC for 3 and 15 hours in Ar.
Both low and high Mw PFO samples were annealed at 170oC for 3 to 15 hours and
cooled to room temperature. Based on the results shown in Figure 7-2, 7-3 and 7-4, PFO
forms a liquid-crystalline phase at 170oC. For low Mw PFO samples, the diffraction
patterns for samples with different annealing times do not show much difference. For
high Mw PFO samples, the intensities of the diffraction peaks are much stronger for the
sample with the longer annealing time.
These results indicate that annealing at 170oC can increase the crystallinity due to
the formation of the liquid-crystalline phase, which can improve the order of the polymer
chains. The low Mw PFO samples, which have a higher mobility and diffusion rate, can
95
form a liquid-crystalline phase faster than high Mw PFO samples. Therefore the
diffraction patterns after 3 and 15 hours of annealing for low MW samples do not show
an obvious difference. For high Mw PFO samples, the chain diffusion rate is much
lower. The high Mw PFO sample annealed for15 hours forms a more ordered liquid
crystalline phase than the one annealed for 3 hrs, which leads to higher crystallinity as
shown in the X-ray diffraction pattern.
7.3.1.2 Thermal-oxidation effect
Figure 7-10 shows the XRD diffraction pattern of PFO samples annealed in Ar and
air.
5 10 15 20 25
15 hrs; Ar
3 hrs; Ar
15 hrs; Air
3 hrs; Air
Dipcoating
Cou
nts/
sec
(Arb
. uni
t)
2θ (degree)
Figure 7-7. Comparison of X-ray diffraction pattern of high Mw PFO samples annealed at 170oC in Ar and in air for 3 and 15 hours.
From Figure 7-7, the samples annealed in Ar show clear diffraction peaks, which
means these samples can crystallize. Furthermore, the crystallinity becomes higher as the
annealing time increases. For samples that were annealed in air, the sample annealed for
96
3 hours shows diffraction peaks whereas the sample annealed for 15 hours does not.
Moreover, we also found that the sample which was annealed for 15 hours can not
dissolve in chloroform. This indicates oxidation of polymer chains can induce
crosslinking, which inhibits the formation of polymer crystals. The PFO samples of low
Mw show similar results.
The relationships between the PL and PFO chain conformation have been well
studied by Grell et al. [13,14]. Here we focus on the thermal-induced oxidation effect on
PL and polymer morphology. Figure 7-8 and Figure 7-9 show the PL spectra and XRD
profiles of high Mw PFO samples which were annealed at temperatures higher than
150oC for 1 or 3 hours in the air and cooled down to room temperature. The PFO sample
of low Mw shows similar results.
400 450 500 550 600 650
Annealing in air
Nor
mal
ized
PL
Inte
nsity
(Arb
. uni
t)
Wavelength (nm)
170 oC; 1hr 200 oC; 1hr 200 oC; 3hr 240 oC; 1hr
Figure 7-8. PL of high Mw PFO samples annealed in air at different temperatures: 170oC for 1 hour (solid line), 200oC for 1 hour (dash dot line), 200oC for 3 hours (dash line), and 240oC for 1 hour.
97
From Figure 7-8, the sample annealed at 170oC for 1 hour does not show a clear
emission peak near 550 nm, which indicates only a few ketonic defects exist on the
polymer chains. The sample annealed at 200oC for 1 hour shows emission peaks at both
450nm and 550nm, which indicates the formation of many of ketonic defects on the
polymer chains. The sample annealed at 200oC for 3 hours shows primarily one emission
near 550nm, which indicates most of the polymer repeat units were oxidized. The sample
annealed at 240oC for 1 hour shows similar results as the sample annealed at 200oC for 1
hour.
5 10 15 20 25
240 oC; 1hr
200 oC; 3hr
200 oC; 1hr
170 oC; 1hr
Cou
nts/
sec
(Arb
. uni
t)
2θ (degree)
Figure 7-9. The X-ray diffraction pattern of annealed high Mw PFO samples corresponding to the samples shown in Figure 7-8.
As shown in Figure 7-9, the samples annealed at 170oC for 1 hour and at 200oC for
1 hour show clear diffraction peaks, which indicate that these two samples can
crystallize. The sample annealed at 200oC for 1 hour show higher crystallinity than the
sample annealed at 170oC because a more ordered liquid-crystalline phase can form at
98
higher temperatures for the high Mw PFO sample, which is helpful for the formation of
polymer crystallinity as described in the previous section. The samples annealed at 200oC
for 3 hours and 240oC for 1 hour do not show diffraction peaks, which indicates no
formation of polymer crystals in these two samples. These results show that the thermal-
induced oxidation of PFO can lead to the crosslinking of polymer chains and inhibit the
formation of polymer crystals.
7.3.2 Molecular Effect on PFO Thin Film Structure
In this research, we used XRR to measure the electron density, roughness, and
thickness of polymer thin films. Figure 7-10 shows the XRR spectra and the fitting result
from spin-coated high Mw PFO thin films on ITO glass.
1 2 3 4
Log
(Ref
lect
ivity
)
2θ (degree)
70 75 80 85 90
PFO layer
ITO
Elec
tron
dens
ity (a
rb. u
nit)
Thickness (nm)
Figure 7-10. XRR spectra acquired from spin-coated high Mw PFO thin films. Solid line and dash line represent the experimental data and the fitted results (one layer model) respectively.
99
The fitting result is from one homogenous polymer film of ~ 90 Ǻ. The roughness
is less than 10 Ǻ. The experimental results can be fit well using a one layer model.
Figure 7-11 shows the XRR spectra and the fitting result from the low Mw PFO
thin films on ITO glass. The fitting curve is also from one homogeneous polymer film, in
this case of ~ 130 Ǻ. There is a major difference between the model and experiment in
the region 2θ ~ 1 degree. Figure 7-12 shows the fitting results using a two layer model.
An interface layer of lower density exists between the ITO and PFO thin film of higher
density.
1 2 3 4
Log
(Ref
lect
ivity
)
2θ (degree)
70 75 80 85 90 95
PFO layer
ITO
Elec
tron
dens
ity (A
rb. u
nit)
Thickness (nm)
Figure 7-11. XRR spectra acquired from spin-coated low Mw PFO thin films. Solid line and dash line represent the experimental data and the fitted results (one layer model) respectively.
100
1 2 3 4
Log
(Ref
lect
ivity
)
2θ (degree)
70 75 80 85 90 95
PFO layer
ITO
Elec
tron
dens
ity (A
rb. u
nit)
Thickness (nm)
Figure 7-12. XRR spectra acquired from spin-coated low Mw PFO thin films. Solid line and dash line represent the experimental data and the fitted results (two layer model) respectively.
From Figure 7-12, it can be seen that this model gives a good fit to the data. The
poor fit in Figure 7-11 near 1 degree is corrected, which indicates that an interface layer
exists between the low Mw PFO thin films and ITO glass. In contrast, no interface layer
is observed between the high Mw PFO thin films and ITO glass.
The properties of polymers near solid substrates are critical for numerous
commercial applications and have been studied extensively. For the application of
polymer thin film technologies like PLEDs, the interface behavior is an especially
important factor for the performance of devices. Many studies have shown changes in Tg
for supported thin films due to the interaction of polymers with substrates [115-119].
Several models have been used to interpret the effects of polymer film interfaces on the
change of Tg, including change in film density [120], reduction in the extent of
entanglements [121], and enrichment of chain end-groups within the interface [122,123].
101
In our system, we use PFO of two different molecular weights. From the XRR
results, the high Mw PFO thin-film shows a simple homogeneous polymer layer, whereas
the low Mw PFO shows an interface layer with lower density. Comparing PFO of
different Mw’s, PFO of low Mw has a higher diffusion rate and more chain ends than
PFO of a higher Mw. Mayer [122] has pointed out the chain end effect on the glass
transition of polymers near an interface. A decrease of density near the surface or
interface is caused by chain end segregation. Therefore, the interface layer, which is
observed only in the low Mw PFO system, could be related to the increase in number of
chain ends and the segregation of chain ends near the interface. On the other hand,
Bollinne et al. [124] also examined the interface layer of PS and PMMA on an SiO2
substrate by using XRR, but they did not find a molecular weight effect in their system.
This controversy could be due to the specific polymer chain conformation of PFO
compared to traditional polymers, including PS and PMMA. Compared to PS and
PMMA, PFO is a stiff main-chain polymer and tends to form a gel when the polymer
concentration is increased. In fact, as illustrated previously, PFO of a different Mw tends
to form into a different crystalline-phase under the thermal conditions, which indicates
that Mw is a critical factor in chain conformation. The chain conformation near the
interface in the PFO system needs further study to understand the effects that molecular
weight has on the chain morphology of spin-coated thin films.
7.4 Conclusion
From the XRD results, we found that molecular weight is an important factor in
the crystallization process. High Mw PFO tends to form an α phase crystalline whereas
low Mw PFO tends to form an α’ phase crystalline at the same crystallization
102
temperature. Annealing at 170oC, which induces the formation of a liquid-crystalline
phase, can increase the crystallinity of PFO. The thermal-induced oxidation of PFO
causes the formation of ketonic defects and leads to an extra red-shifted emission. XRD
also shows that oxidized PFO samples cannot crystallize due to crosslinking. From the
fitting of XRR results, the high Mw PFO thin film shows one homogeneous polymer
layer whereas the low Mw PFO thin film shows the existence of an interface layer. This
interface layer is proposed as being related to the enrichment of chain ends near the
interface and needs further study.
CHAPTER 8 CONCLUSIONS AND RECOMMENDATIONS FOR FUTURE WORK
For polymer-based thin film devices, the performance and efficiency are influenced
by the quality of the films, polymer/substrate interfaces, and even the chain conformation
in the polymer thin films. Therefore, the control of the polymer chain conformation as
well as the film quality will be very important. In this work, the physical properties of
three light-emitting polymers, PVK, MEH-PPV, and PFO, were investigated for their
application in polymer thin film devices.
The spin-coating technique is the most common method to make polymer thin
films. The solvents evaporate so fast that the polymers are quenched and smooth thin
films are formed. During spin-coating, evaporation of solvents of a high evaporation rate
leads to temperature and concentration gradients, which can induce Marangoni
convection. In turn, Marangoni convection can then lead to cell and striation structures
near and away from the center area, respectively, of the polymer thin films. Thin films
prepared from THF/water solutions show result in the formation of ruptured films and
polymer droplets on ITO substrates. Due to the incompatibility of water and MEH-PPV,
water in polymer solutions can induce a coil-cylinder transition of the polymer chains and
lead to a red-shifted emission.
Due to fast evaporation, the polymer chains in thin films are not in a state of
thermodynamic equilibrium. Therefore, the conformation of polymer chains in thin films
is determined by a variety of critical factors involved in the spin-coating process,
including solvents used, concentrations, and spin-speeds, or post-processes such as
103
104
annealing. For conjugated polymers, the band gap is related to the conjugation length:
the longer the conjugation length, the smaller the band gap. Polymer chains that have a
more extended conformation show a longer conjugation length and lead to a red-shifted
emission compared to polymer chains that have a more compact chain conformation.
Therefore, solvents which can affect the chain conformation can also influence the
optical properties of conjugated polymers. Likewise, for conjugated polymers the
formation of aggregates in polymer thin films can lower the PL quantum efficiency and
can lead to a red-shifted emission. Therefore, the critical factors for the fabrication of
polymer thin films can also influence the optical properties of those films.
For PLEDs, the short life-time is due to the degradation of both the metal contacts
and the polymer layer. Pinholes give pathways for the diffusion of moisture through the
protection layer. The metal contact, such as Ca, can react with water from air or from
PEDOT-PSS that then generates H2, which leads to the formation of bubbles around
pinholes. The thermal-induced oxidation of PFO can lead to an extra red-shifted peak
due to the generation of ketonic defects. In addition, the thermal-induced oxidation also
causes crosslinking of PFO.
In this study, the details of some interesting phenomenon are still not clear and
need further study. First, the effects of solvents on the chain conformation of conjugated
polymers in solution are still not clear. From chapter 5, although the viscosity results are
coincident with the PL (the polymers with a larger dimension show a more red-shifted
emission), the polymer dimension cannot be explained from the view of polymer
solubility. Generally, solvents that dissolve a polymer well are called “good solvents”
and those which do not dissolve a polymer are called “poor solvents.” Because contact
105
between polymers and good solvents is favorable, the polymer chain tends to adopt a
more expanded random-coil conformation. When the solvent quality becomes poor,
contacts between those polymers and ill-suited solvents become unfavorable, and thus the
polymer chain tends to contract. Therefore, polymers in “good solvents” (from the view
of solubility) should have a red-shifted emission compared to polymers in “poor
solvents.” Nonetheless, the PL results did not show this coincidence. MEH-PPV and
PFO in the “good solvent” chloroform do not show a red-shifted emission compared to
what is seen in other solvents. We believe this is due to the complex chemical structure
of conjugated polymers, which contain rigid aromatic groups in the main chains and soft
alkyl groups as side chains. We suggest that computer simulation is needed to illustrate
the solvent effects on this complex system.
Second, the mechanism of how a ruptured polymer thin film forms from THF/water
solution is not clear. Two speculated mechanisms are proposed, which are based on the
results from this work, as shown in Figure 8-1 and Figure 8-2.
Thicker area
Figure 8-1. The proposed model of ruptured polymer film formation during the spin-coating process due to the surface-tension gradient induced by water.
ITO substrate
Polymer in THF and Trace H2O solution
Thinner area
THF evaporates faster then water
H2O and THF evaporate
High surface tension gradient due to high ontents of waterer c
∆σ
∆σ
Ruptured Polymer thin filmPolymer droplets
106
In Figure 8-1, since water has a lower evaporation rate than THF, the polymer
solution thin films have a higher water concentration near the solution surface during the
evaporation of the solvents. Due to the high surface tension of water, the surface tension
gradient then increases and drives much faster convection near the surface. This
convection then leads to rupture of the polymer solution from the thinner area of the
solution thin films.
For thicker area
THF evaporate faster
Polymer-rich phase H2O-rich phase
H2O and THF evaporate
Figure 8-2. The proposed model of ruptured polymer film formation during the spin-coating process due to phase separation.
On the other hand, due to the incompatibility of water and MEH-PPV, phase
separation may generate water-rich and polymer-rich phases in the solution. The phase
H2O-rich phase
Polymer-rich phase
H2O-rich phase
For thinner area
THF evaporate faster
H2O-rich phase
Polymer-rich phase
Polymerdroplet
H2O and THF evaporate
Polymerdroplet
Ruptured Polymer film
Hole
Ruptured Polymer film
107
separation then leads to rupture of the thin film and the formation of polymer droplets, as
shown in Figure 8-2. Again, these two models are highly speculative and need more data
to prove.
Third, the molecular weight effect of PFO on chain conformation and thin film
structure is not clear. Although a few models, like the chain end effect model, can be
used to explain this phenomenon, more details are still needed to understand the
mechanism. Ultimately, the effect of the interface layer is an important factor on the
performance of thin film devices and is of enormous interest.
LIST OF REFERENCES
1. Burroughes, J. H.; Bradley, D. D. C.; Brown, A. R.; Marks, R. N.; Mackey, K.; Friend, R. H.; Burns, P. L.; and Holmes, A. B. Nature 1990, 347, 539.
2. Braun, D.; Heeger, A. J., Appl. Phys. Lett. 1991, 58, 1982.
3. Gustafsson, G.; Cao, Y.; Treacy, G. M.; Klavetter, F.; Colaneri, N.; Hegger, A. J., Nature 1992, 357, 477.
4. Friend, R. H.; R. W. Gymer, A. B. Holmes, J. H. Burroughes, T. N. Marks, C. Taliani, D. D. C. Bradley, D. A. Dos Santos, J. L. Bredas, M. Lögdluned, and W. R. Salaneck, Nature 1999, 397, 121.
5. Patel, N. K.; Cină, S.; Burroughes J. H. IEEE J. Select. Top. Quant. Elect. 2002, 8, 346.
6. Redecker, M.; Bradley, D. D. C.; Bernius, M. T.; Inbasekaran, M.; Wu, W. W.; Woo, E. P. Appl. Phys. Lett. 1998, 73, 1565.
7. Yu, L. S.; Chen, S. A. Synth. Met. 2002, 132, 81.
8. He, G. F.; Liu, J.; Li, Y. F.; Yang, Y. Appl. Phys. Lett. 2002, 80, 1891.
17. Gao, M. Y.; Richter, B.; Kirstein, S. Adv. Mater. 1997, 9, 802.
18. Thompson, J.; Blyth, R. I. R.; Mazzeo, M.; Anni, M.; Gigli, G.; Cingolani, R. Appl. Phys. Lett. 2001, 79, 560.
19. Suzuki, H.; Hoshino, S.; Yuan, C. H.; Fujiki, M.; Toyoda, S.; Matsumoto, N. Thin Solid Film 1998, 331, 64.
20. Suzuki, H.; Hoshino, S.; Yuan, C. H.; Fujiki, M.; Toyoda, S.; Matsumoto, N. H. IEEE J. Select. Top. Quant. Elect. 1998, 4, 129.
21. Suzuki, H. J. Lumin. 1997, 72-4, 1005.
22. Partridge, R. H. Polymer 1982, 24, 733.
23. Kersting, R.; Lemmer, U.; Mahrt, R. F.; Leo, K.; Kurz, H.; Bassler, H.; Gobel, E. O. Phys. Rev. Lett. 1993, 70, 3820.
24. Hayes, G. R.; Samuel, I. D. W.; Phillips, R. T. Phys. Rev. B 1995, 52, 11569.
25. Kersting, R.; Mollay, B.; Rusch, M.; Wenisch, J.; Leising, G.; Kauffmann, H. F. J. Chem. Phys. 1997, 106, 2850.
26. Zheng, M.; Bai, G. L.; Zhu, D. B. J. Photochem. Photobiol. A 1998, 116, 143.
27. Schwartz, B. J. Ann. Rev. Phys. Chem. 2003, 54, 141.
28. Nguyen, T. Q.; Doan, V.; Schwartz, B. J. J. Chem. Phys. 1999, 110, 4068.
29. Kumar, P.; Mehta, A.; Mahurin, S. M.; Dai, S.; Dadmun, M. D.; Sumpter, B. G.; Barnes, M. D. Macromolecules 2004 37, 6132.
30. Fritz, K. P.; Scholes, G. D. J. Phys. Chem. B. 2003; 107(37); 10141.
31. Amautov, S. A.; Nechvolodova, E. M.; Bakulin, A. A.; Elizarov, S. G.; Khodarev, A.; Martyanov, D. S.; Paraschuk, D. Y. Synth. Met. 2004, 147, 287.
32. He, G. F.; Li, Y. F.; Liu, J.; Yang, Y. Appl. Phys. 2002, 80, 4247.
33. Shi, Y.; Liu, J.; Yang, Y. J. Appl. Phys. 2000, 87, 4254.
34. Liu, J.; Shi, Y.J.; Ma, L.P.; Yang, Y. J. Appl. Phys. 2000, 88, 605.
35. Chiang, C. K.; Fincher, C. R.; Park, Y. W.; Heeger, A. J.; Chirakawa, H.; Louis, E. J.; Gua, S. C.; MacDiarmid, A. G. Phys. Rev. Lett. 1977, 39, 1098
110
36. Antoniadis, H.; Hsieh, B. R.; Abkowitz, M. A.; Jenekhe, S. A.; Stolka, M. Synth. Met. 1994, 62, 265.
37. McQuade, D. T.; Pullen, A. C.; Swager, T. M. Chem. Rev. 2000, 100, 2537.
38. Torsi, L.; Dodabalapur, A.; Rothberg, L. J.; Fung, A. W. P.; Katz, H. E. Science 1996, 272, 1462.
39. Rauscher, U.; Schutz, L.; Greiner, A.; Bassler, H. J. Phys. Condens. Matt. 1989, 1, 9751.
40. Kersting, R.; Lemmer, U.; Mahrt, R. F.; Leo, K.; Kurz, H.; Bassler, H.; Gobel, E. O. Phys. Rev. Lett. 1993, 70, 3820.
41. Birks, J. B. Photophysics of Aromatic Molecules, Wiley Interscience, London, 1970.
42. Pope, M.; Swenberg, C. E. Electronic Processes in Organic Crystals, Oxford University Press, New York, 1999.
43. Blatchford, J. W.; Gustafson, T. L.; Epstein, A. J. J. Chem. Phys. 1996, 105, 9214.
44. Blatchford, J. W.; Jessen, S. W.; Lin, L. -B., Gustafson, T. L.; Fu, D. -K.; Wang, H. L.; Swager, T. M.; MacDiarmid, A. G.; Epstein, A. J. Synth. Met. 1997, 84, 501.
45. Yan, M.; Rothberg, L. J.; Kwock, E. W.l Miller, T. M., Phys. Rev. Lett. 1995, 75, 1992.
46. Hagler, T. W.; Pakbaz, K.; Voss. K. F.; Heeger, A. J. Phys. Rev. B 1991, 44, 8651.
47. Berggren, M.; Inganäs, O.; Gustafsson, G.; Andersson, M. R.; Hjertberg, T.; Wennerström, O. Nature, 1994, 372, 444.
48. Bradley, D. D. C.; Grell, M.; Long, X.; Mellor, H.; Grice, A. SPIE 1997, 254, 3145.
49. Nguyen, T. -Q.; Martini, I. B.; Liu, J.; Schwartz, N. J. J. Phys. Chem. B, 2000, 104, 237.
50. Nguyen, T. -Q.; Schwartz, N. J. J. Chem. Phys, 2002, 116, 8198.
51. Liu, J.; Guo, T. F.; Yang, Y. J. Appl. Phys. 2002, 91, 1595.
52. Lee. T; Park, O. O. Adv. Mater. 2002. 12. 801.
53. Kim, J.; Lee, J.; Han, C. W.; Lee, N. Y.; Chung, I. -J. Appl Phys. Lett. 2003, 82, 4238.
54. Silvestre, G. C. M.; Johnson, M. T.; Giraldo, A.; Shannon, J. M. Appl. Phys. Lett. 2001, 78, 1619.
111
55. Aziz, H.; Xu, G. J. Phys. Chem. B 1997, 101, 4009.
56. Sutherland, D.G. J.; Carlisle, J. A.; Elliker,P.; Fox, G.; Hagler, T. W.; Jimenez, I.; Lee, H. W.; Pakaz, K.; Terminello, L. J.; Williams, S. C. Appl. Phys. Lett. 1996, 68, 2046.
57. Nguyen, T. P.; Speiesser, M.; Garnier, A.; de Kok, M.; Tran, V. H. Mater. Sci. Eng. 1999, B60, 76.
58. Gamerith, S.; Gaal, M.; Romaner, L.; Nothofer, H. -G.; Guntner, R.; Scandiucci de Freitas, P.; Scherf, U.; List, E. J. W. Synth Met. 2003, 139, 855.
59. Cumpston, B. H.; Parker, I. D.; Jensen, K. F. J. Appl. Phys. 1997, 81, 3716.
60. Scherf, U.; List, E. J. W. Adv. Mater. 2002, 14, 477.
61. Andersson, G. G.; de Jong, M. P.; Winands, G. J. J.; Denier van der Gon, A. W.; van IJzendoorn, L. J.; Brongersma, H. H.; de Voigt, M. J. A. J. Phys. D: Appl. Phys. 2002, 35, 1103.
62. Tada, K.; Onoda, M. Appl. Phys. Lett. 2000, 77, 2539.
63. Ke, L.; Zhang, K.; Yakovlev, N.; Chua, S. -J.; Chen, P. Mater. Sci. Eng. 2003, B97, 1.
64. Ke, L.; Chua, S. -J.; Zuang, K.; Yakovlev, N. Appl. Phys. Lett. 2002, 80, 2195.
65. Savvate’ev, V. N.; Yakimov, A. V.; Davidov, D. Appl. Phys. Lett. 1997, 71, 3344.
66. Lim, S. L.; Ke, L.; Wang, W.; Chua, S. J.; Appl. Phys. Lett. 2001, 78, 2116.
67. Kim, J. -S.; Ho, P. K. H.; Murphy, C. E.; Baynes, N.; Friend, R. H. Adv. Mater. 2002, 14, 206.
68. McElvain, J.; Antomiadis, H.; Hueschen, M. R.; Miller, J. N.; Roitman, D. M.; Sheets, J. R.; Moon, R. L. J. Appl. Phys. 1996, 80, 6002.
69. Do, L. -M.; Oyamada, M.; Koike, A.; Han, E. -M.; Yamamoto, N.; Fujihira, M. Thin Solid Films 1996, 273, 209.
70. Emslie, A. G.; Bonner, F. T.; Peck, L. G. J. Appl. Phys. 1958, 29, 858.
71. Meyerhofer, D. J. Appl. Phys. 1978, 49, 3993.
72. Flack, W. W.; Soong, D. S.; Bell, A. T.; Hess, L. E. J. Appl. Phys. 1984, 56, 1199
73. Lawrence, C. J. Phys. Fluids 1988, 31, 2786.
74. Spangler, L. L.; Torkelson, J. M.; Poyal, J. S. Polym. Eng. Sci. 1990, 30, 644.
112
75. Schubert, D. W. Polym. Bull. 1997, 37, 177.
76. Strawhecker, K. E.; Kumar, S. K.; Douglas, J. F.; Karim, A. Macromolecules 2001, 34, 4669.
77. Müller-Buschbaum, P.; Gutmann, J. S.; Wolkenhauer, M.; Kraus, J.; Stamm, M.; Smiligies, D.; Petry, W. Macromolecules 2001, 34, 1369.
78. Scriven, L. E.; Sternling, C. V. Nature 1960, 187, 186.
79. Pearson, J. R. A. Fluid Mech. 1958, 4, 489.
80. Haas, D. E.; Birnie, III, D. P. J. Mater. Sci. 2002, 39, 2100.
81. Birnie, III, D. P. J. Mater. Sci. 2001, 16, 1145.
82. Müller-Buschbaum, P.; Stamm, M. Macromolecules 1998, 31, 3686.
83. Müller-Buschbaum, P.; Gutmann, J. S.; Lorenz, C.; Schmitt, T.; Stamm, M. Macromolecules 2001, 34, 1369.
84. Bollinne, C.; Cuenot, S.; Nysten, B.; Jonas, A. M. Eur. Phys. J. E 2003, 12, 389.
85. Müller-Buschbaum, P. J. Phys.: Condens. Matter 2003, 15, R1549.
86. Bollinne, C.; Stone, V. W.; Carlier, V.; Jonas, A. M. Macromolecules 1999, 32, 4719.
87. Jacobs, K.; Herminghaus, S. Langmuir 1998, 14, 965.
88. Renger, C.; Müller-Buschbaum, P.; Stamm, M.; Hinrichsen, G. Macromolecules 2000, 33, 8388.
89. Gu, X.; Raghavan, D.; Douglas, J. F., Karim, A. J. Polm. Sci. Part B: Polym. Phys. 2002, 40. 2825.
90. Mort, J.; Pfister, G. Electronic Properties of Polymers, Wiley-Interscience, New York, 1982.
91. Mitschke, U.; Bauerle, P. J. Mater. Chem. 2000, 10, 1471.
92. Kido, J.; Hongawa, K.; Okuyama, K.; Nagai, K. Appl. Phys. Lett. 1993, 63, 2627.
93. Peng, J. B.; Yu, B. Y.; Pyun C. H.; Kim, C. H.; Jin, J. I. Jpn. J. Appl. Phys., Part 1 1996, 35, 4379.
94. Linde, D. R. Ed CRC Handbook of Chemistry and Physics, 78th ed. CRC Press Inc., New York, 1999.
113
95. Sitaramaiah, G.; Jacobs, D. Polymer 1970, 11, 165.
96. Kuwahara, N.; Higashida, S.; Nakato, M.; Kaneko, M. J. Poly. Sci,. Part A: Polym. Chem. 1969, 7, 285.
97. Yoneda, Y. Phys. Rev. 1963, 131, 2010.
98. Parrat. L. G. Phys. Rev. 1954, 55, 359.
99. Bénard, H. Rev. Gen. Sci. Pures Appl. 1900, 11, 1261.
100. Lee, S. T.; Gao, Z. Q.; Hung, L. S. Appl. Phys. Lett. 1999, 75, 1900.
101. Ke, L.; Chua, S.-J.; Zuang, K.; Yakovlev, N. Appl. Phys. Lett. 2002, 80, 2195.
102. Bonaccurso, E.; Butt, H. J.; Franz, V.; Graf. K.; Kappl M.; Loi, S.; Niesenhaus, B.; Chemnitz, S.; Bohm, M.; Petrova, B.; Jonas, U.; Spiess, H. W. Langmuir 2002, 18, 8056.
103. Müller-Buschbaum, P.; Hermsdorf, N.; Gutmann, J. S.; Stamm, M.; Cunis, S.; Gehrke, R.; Petry, W. J. Macromol. Sci., Phys. 2004, 43, 29.
104. Hu, D.; Yu, J.; Wong, K.; Bagchi, B.; Rossky, P. J.; Barbara, P. F. Nature 2000, 405, 1030.
105. Yu, J.; Hu, D.; Barbara, P. F. Science 2000, 289, 1327.
106. Jakubiak, R.; Collision, C. J.; Wen, W. C.; Rothberg, L. J.; Hsieh, B. R. J Phys Chem A 1999, 103, 2394.
107. Brandrup, J.; Immergut, E. H.; Grulke, E. A. Ed. Polymer Handbook (4th Ed), Wiley: New York 1999.
108. Grice, A. W.; Bradley, D. D. C; Bernius, M. T.; Inbasekaran, M.; Wu, W. W.; Woo, E. P. Appl. Phys. Lett. 1998, 73, 629.
109. Zojer, E.; Pogantsch, A.; Hennebicq, E.; Beljonne, D.; Bredas, J. L.; de Freitas, P. S.; Scherf, U.; List, E. J. W. J. Chem. Phys. 2002, 117, 6794.
110. Gamerith, S.; Gaal, M.; Romaner, L.; Nothofer, H. G.; Guntner, R.; de Freitas, P. S.; Scherf, U.; List, E. J. W. Synth. Met. 2003, 139, 855.
111. List, E. J. W.; Guentner, R.; de Freitas, P. S.; Scherf, U. Synth. Met. 2003, 139, 759.
112. Yang, X. H.; Jaiser, F.; Neher, D.; Lawson, P. V.; Bredas, J. L.; Zojer, E.; Guentner, R.; de Freitas, P. S.; Forster, M.; Scherf, U. Adv. Funct. Mater. 2004, 14, 1097.
113. Chen, S. H.; Chou, H. L.; Su, A. C.; Chen, S. A. Macromolecules 2004, 37, 6833.
114
114. Chen, S. H.; Su, A. C.; Su. C. H.; Chen, S. A. Macromolecules 2005, 38, 379.
115. Keddie, J. L.; Jones, R. A. L.; R. A. Cory, Faraday Discuss. Chem. Soc. 1994, 98, 219.
116. Keddie, J. L.; Jones, R. A. L.; R. A. Cory, Europhy. Lett 1994, 27, 59.
117. Forrest, J. A.; Dalnoki-Veress, K.; Dutcher J. R. Phys. Rev. E 1997, 56, 5705.
118. van Zanten, J. H.; Wallace, W. E.; Wu, W. -L. Phys. Rev. E 1996, 53, R2053.
119. Tsui, O. K. C.; Russell, T. P.; Hawker, C. J. Macromolecules 2001, 34, 5535.
120. Reiter, G. Macromolecules 1994, 27, 3046.
121. Brown H.; Russell, T. P. Macromolecules 1996, 29, 798.


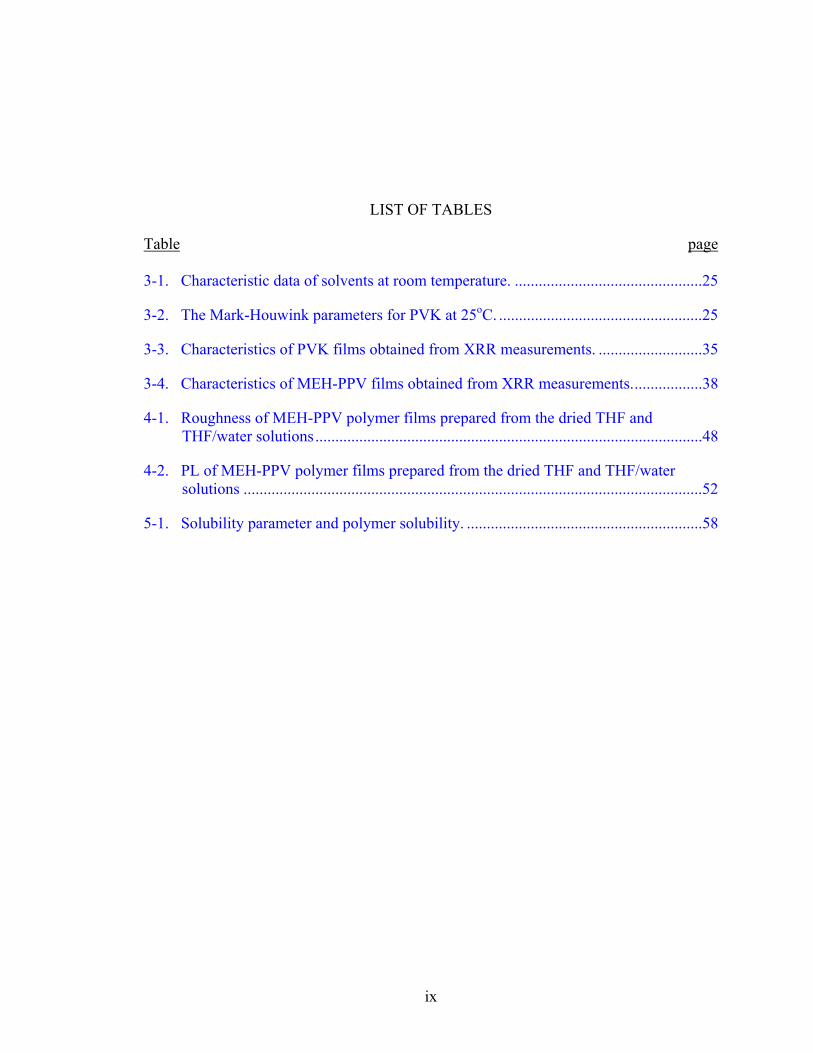
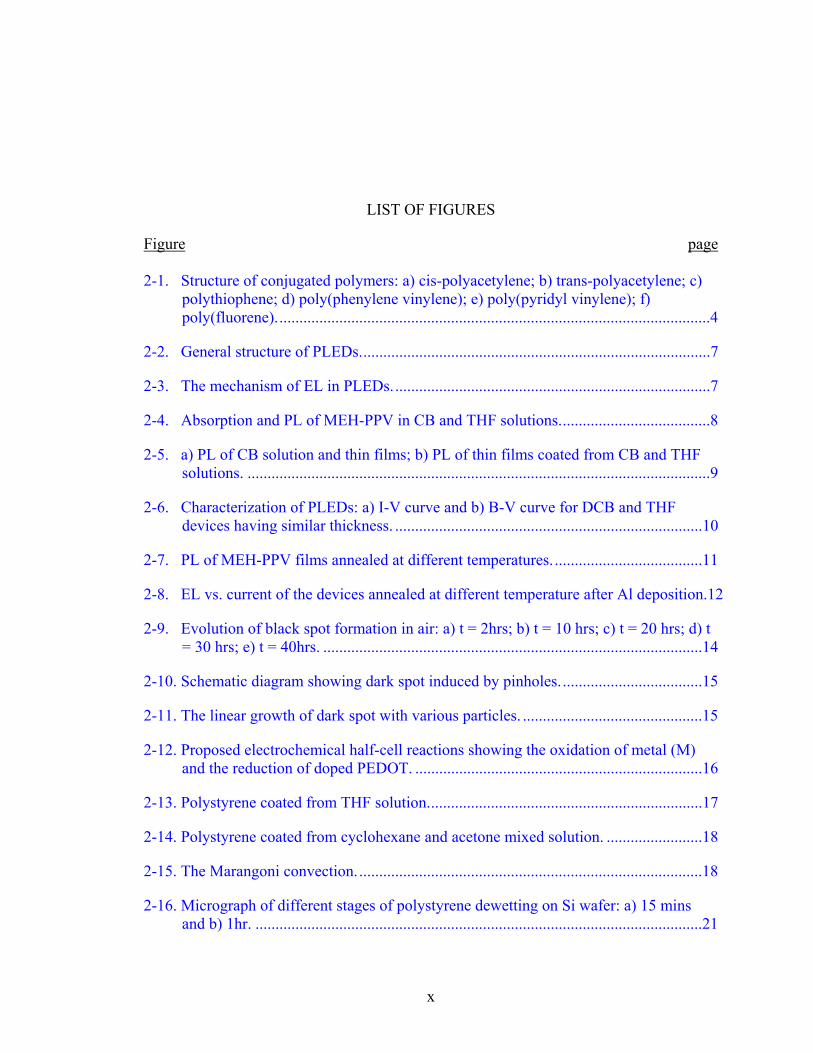
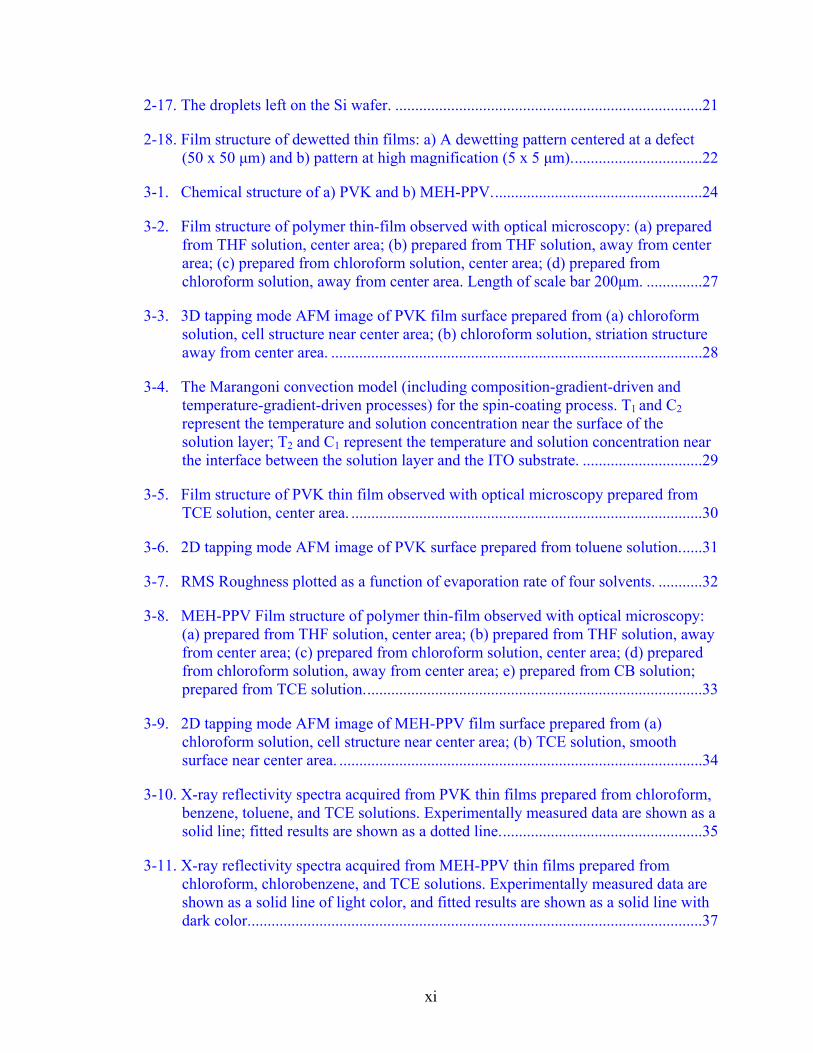
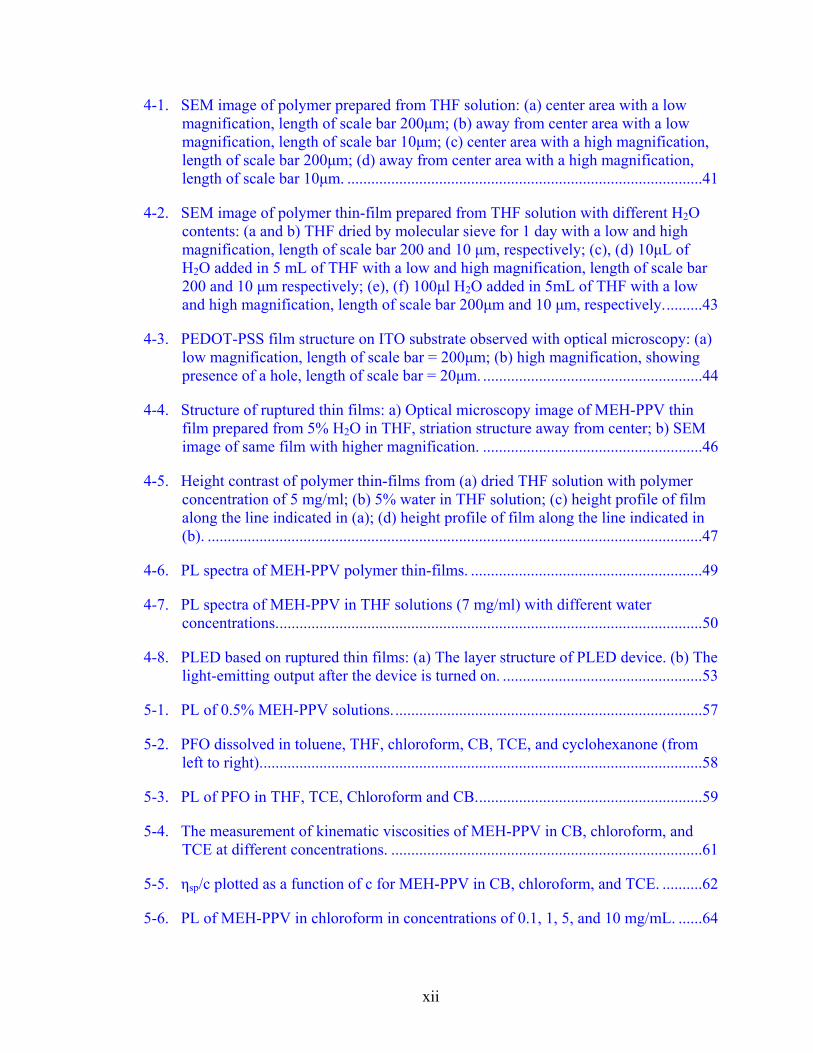
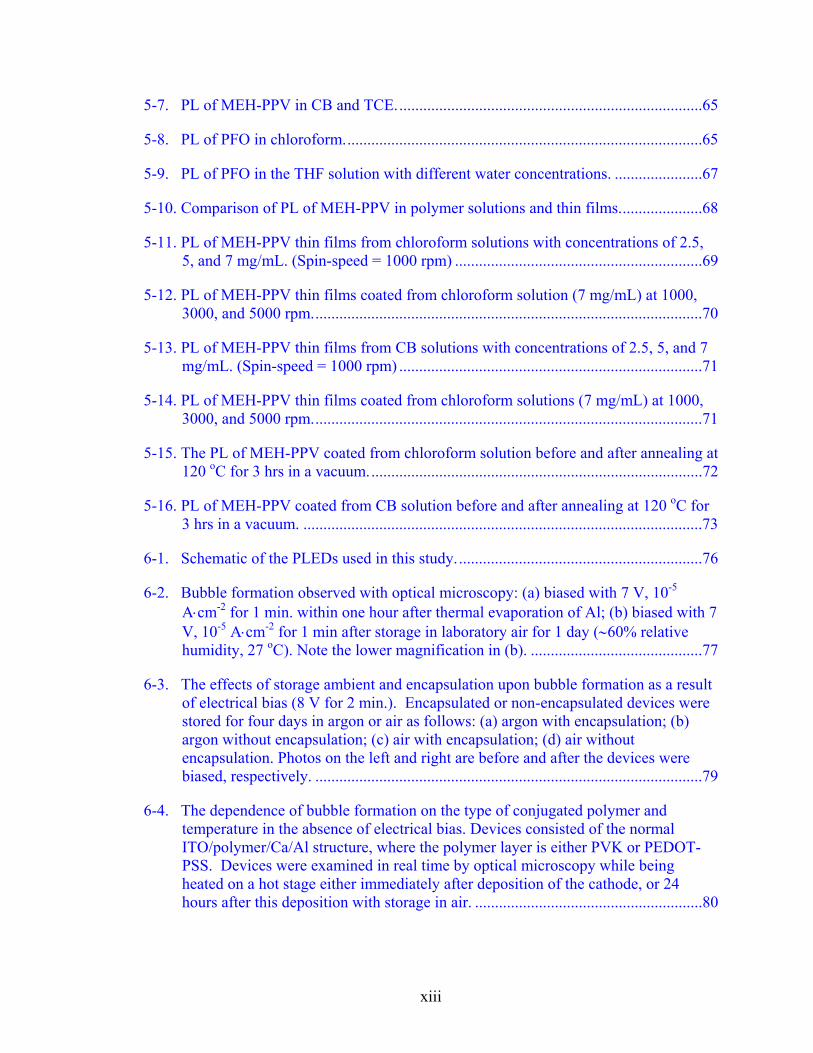
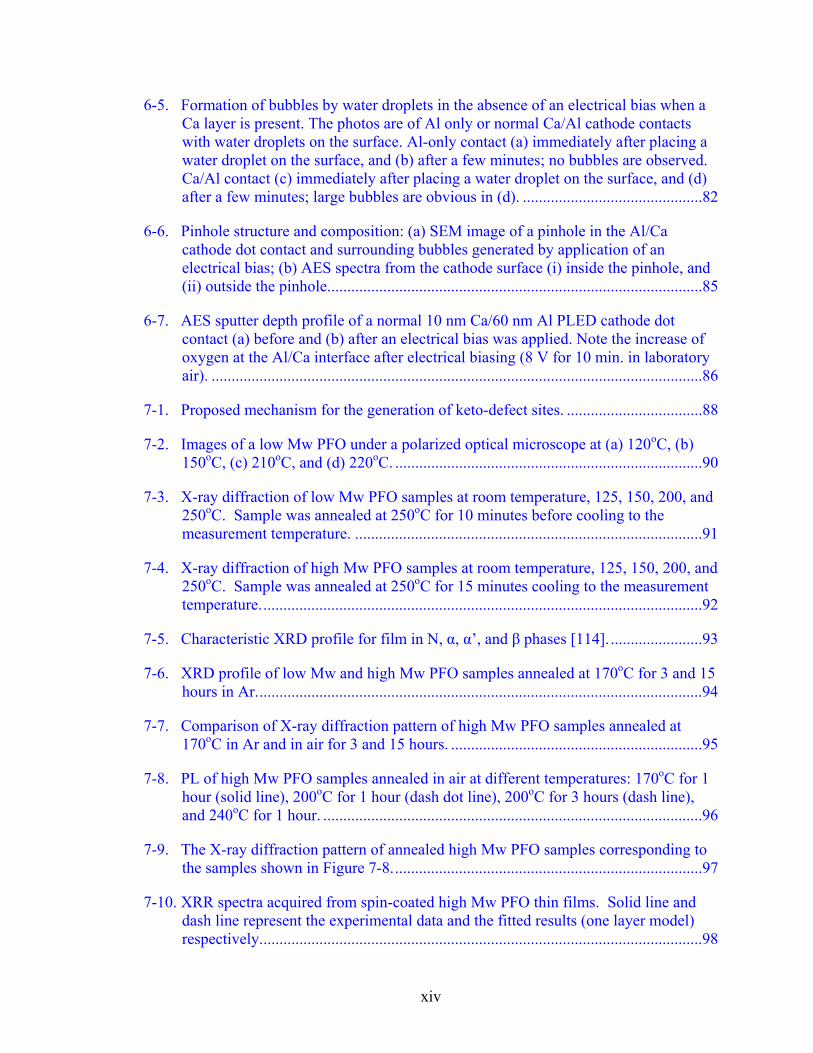
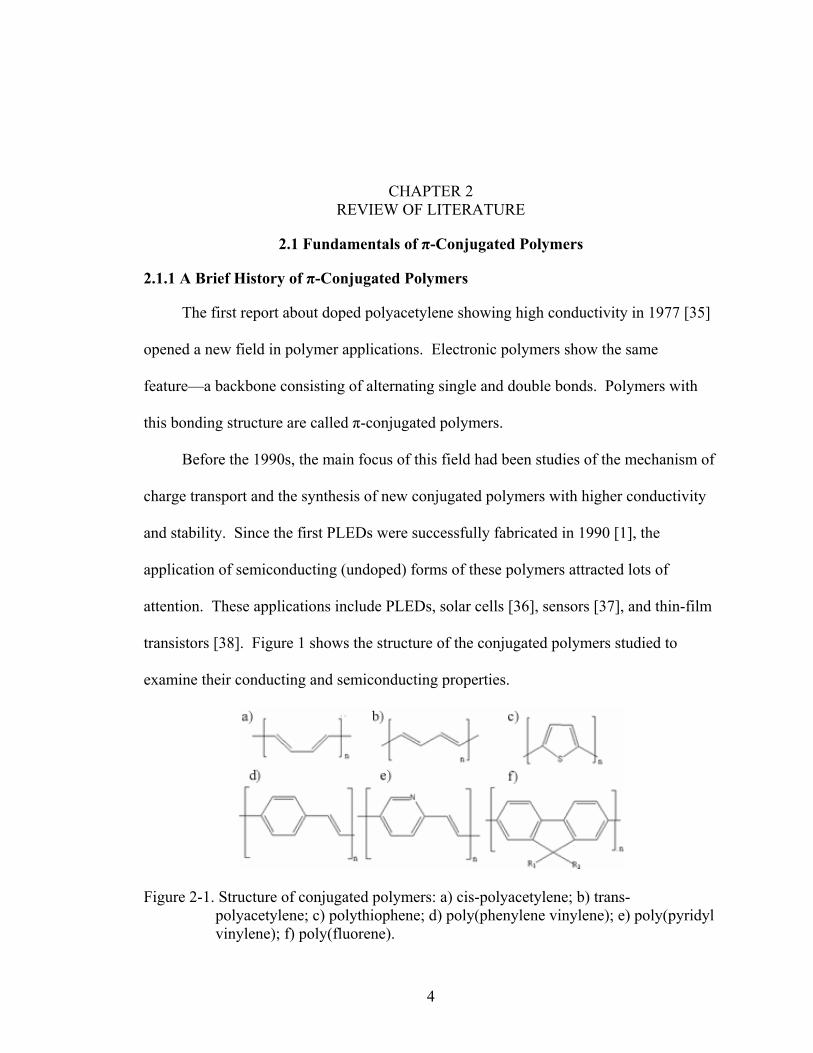
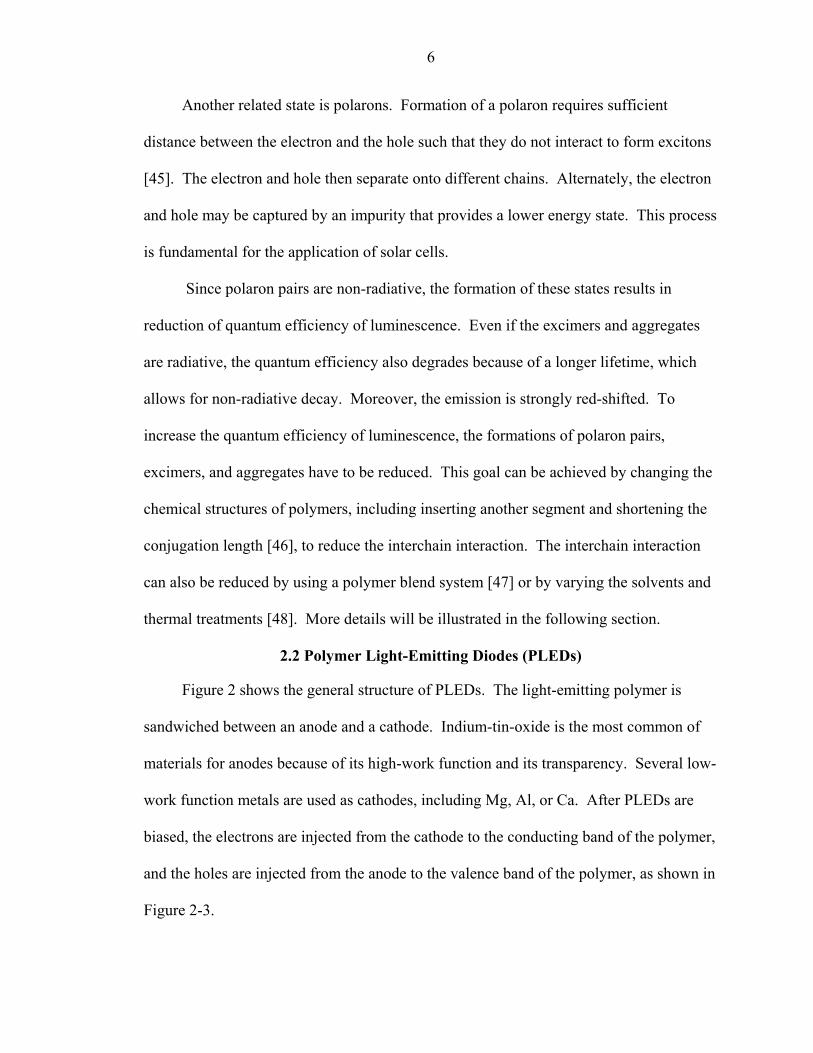
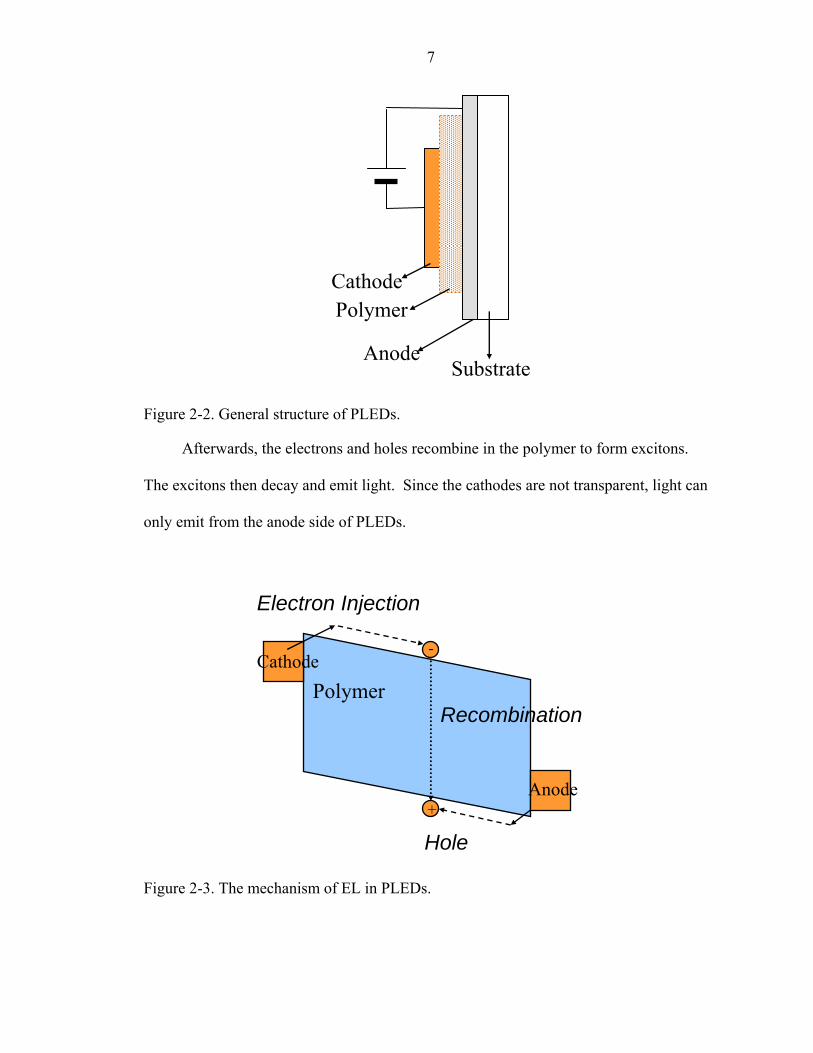
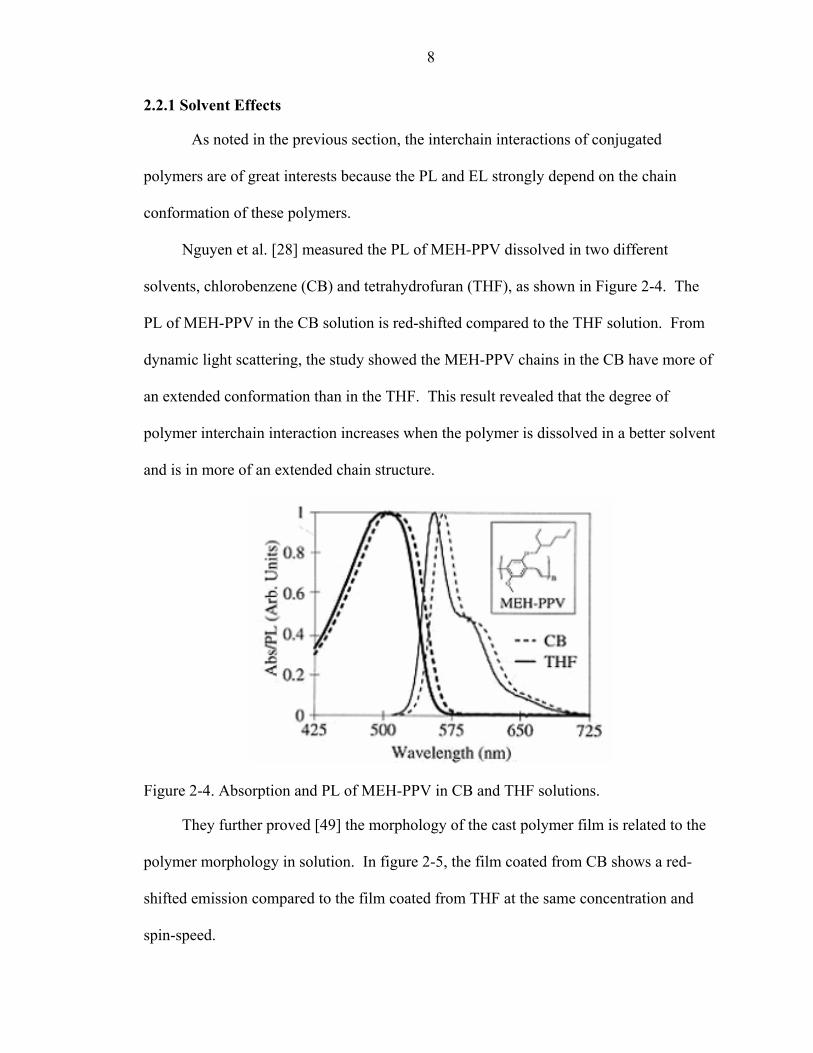
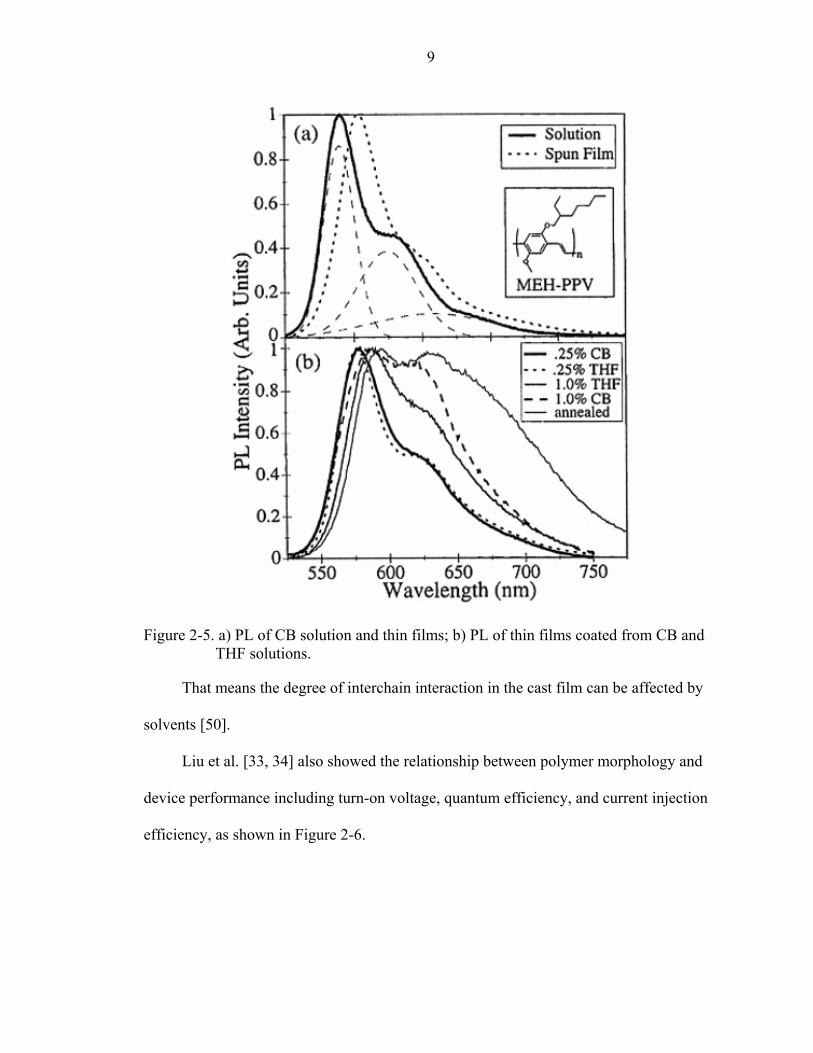
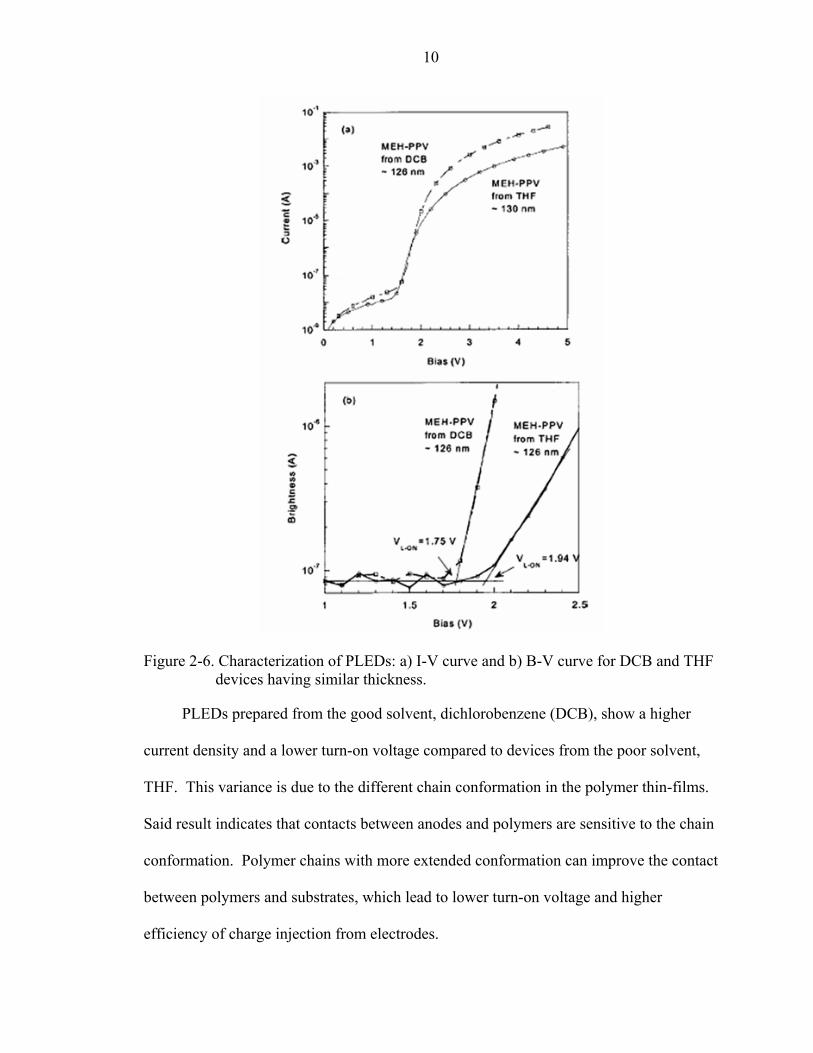
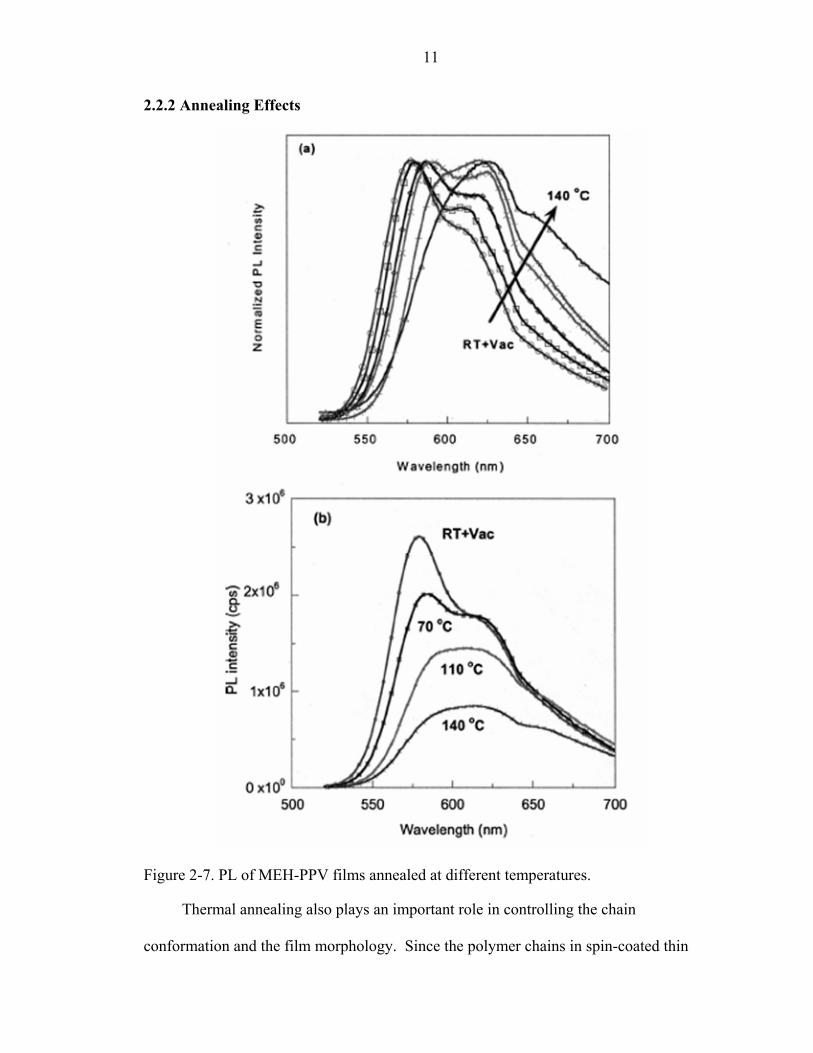
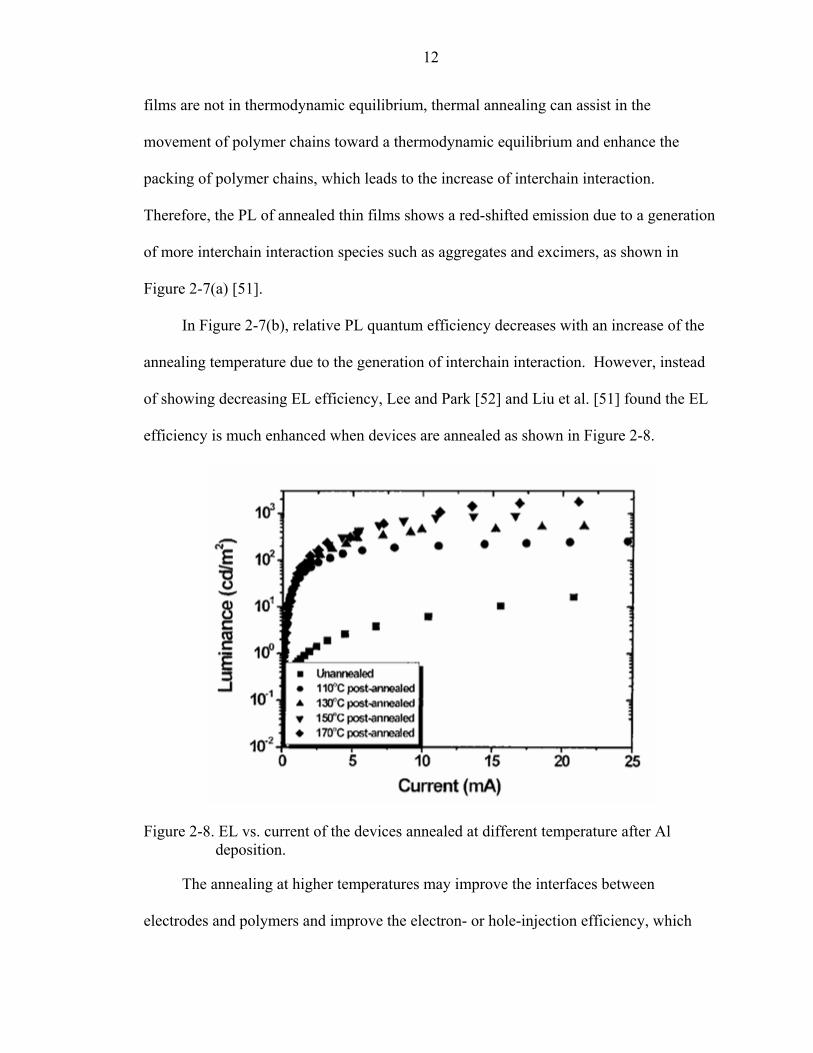
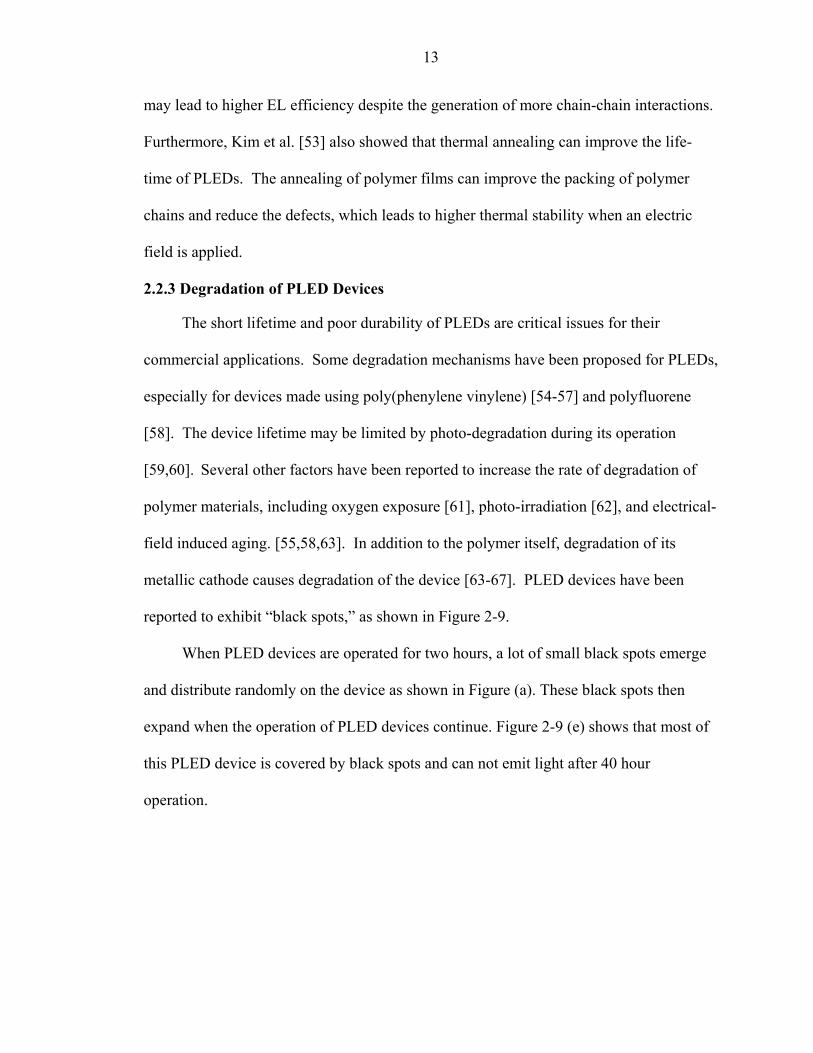
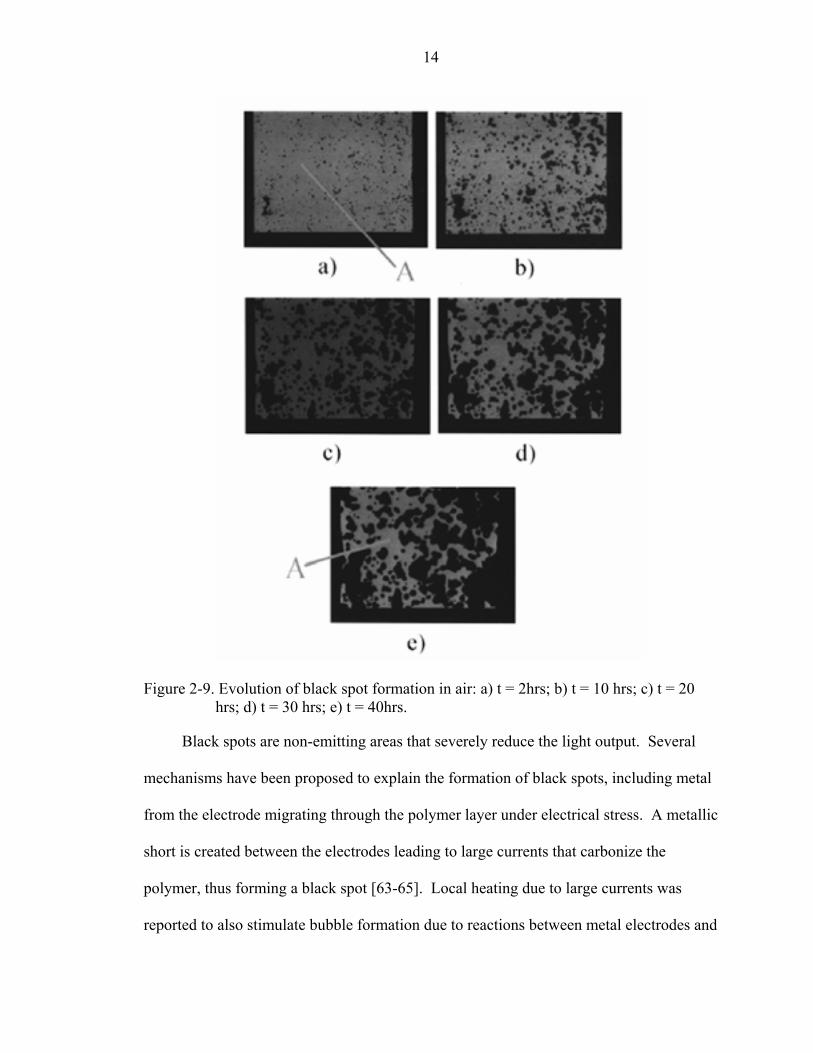
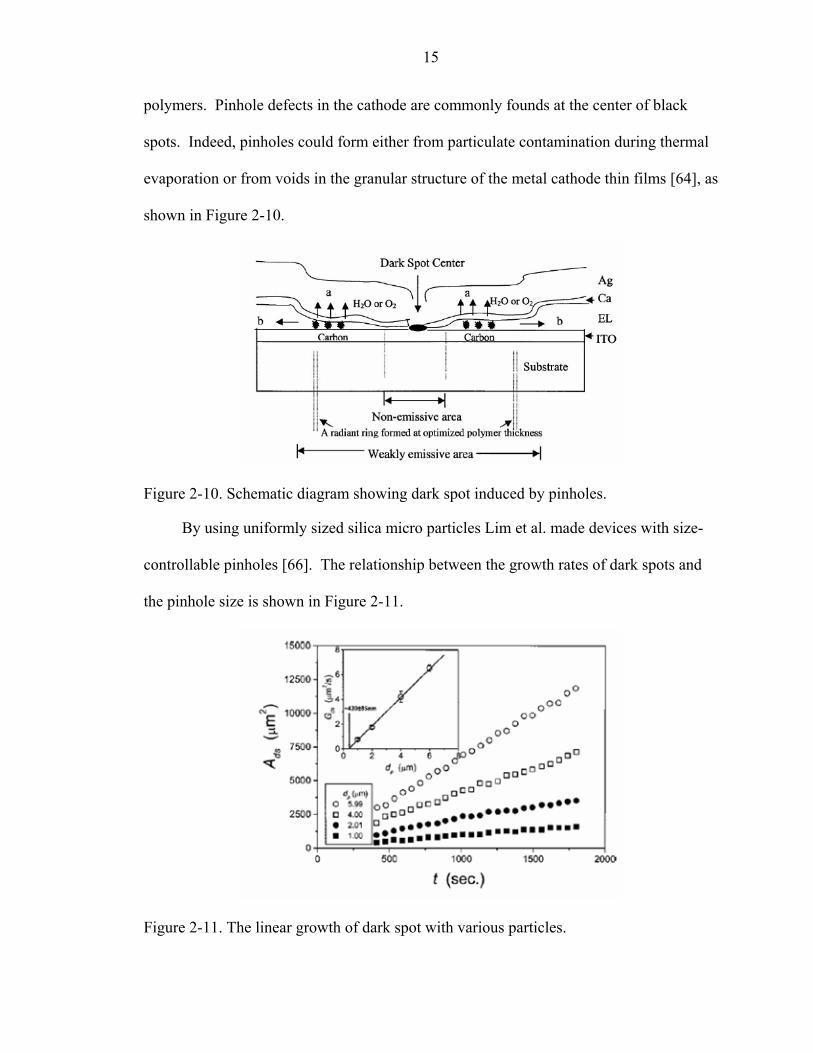
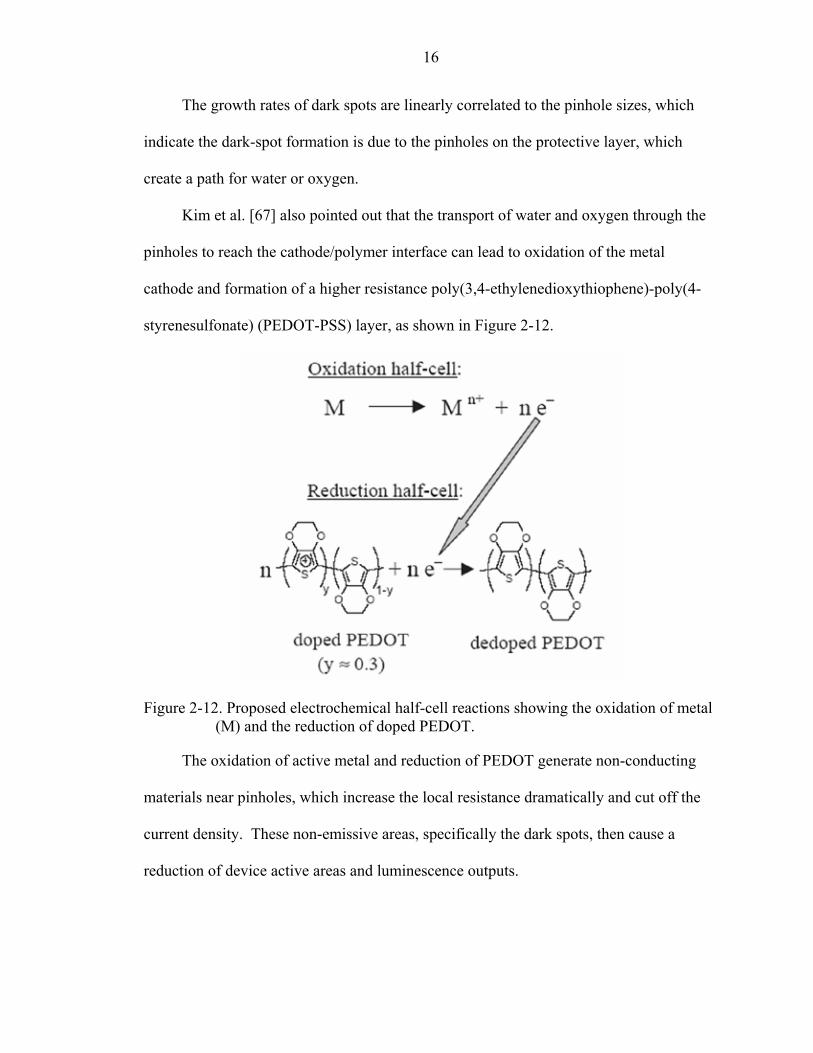
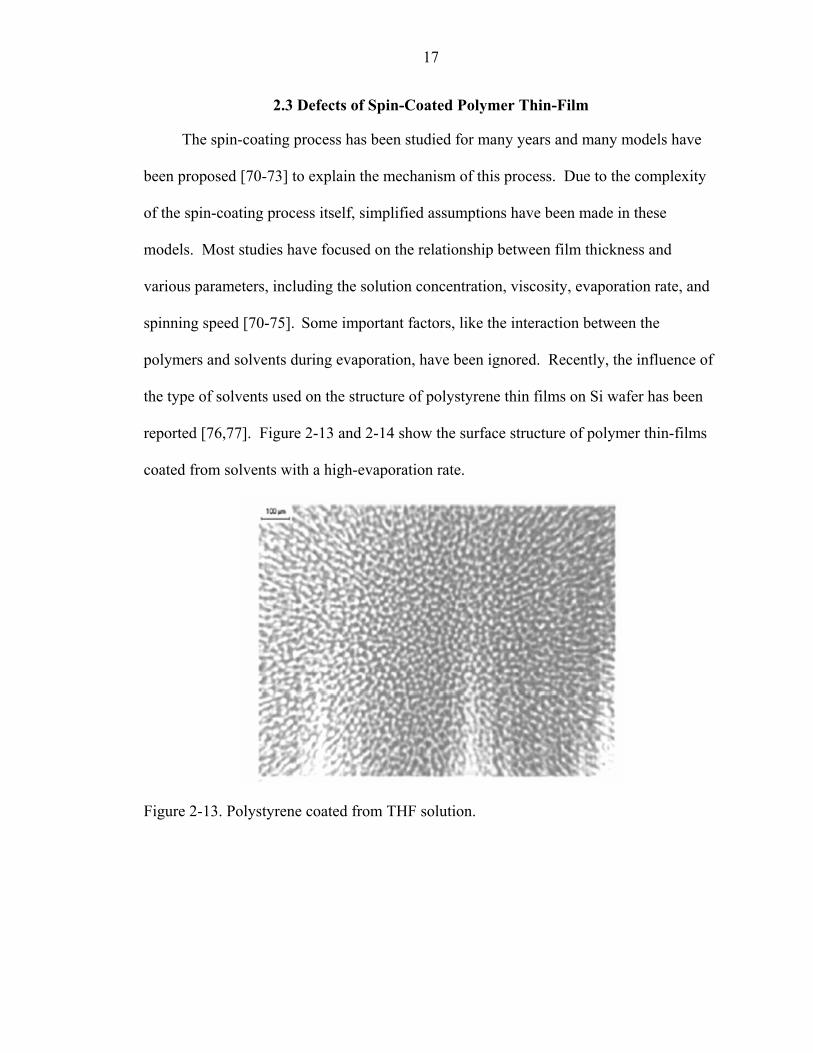
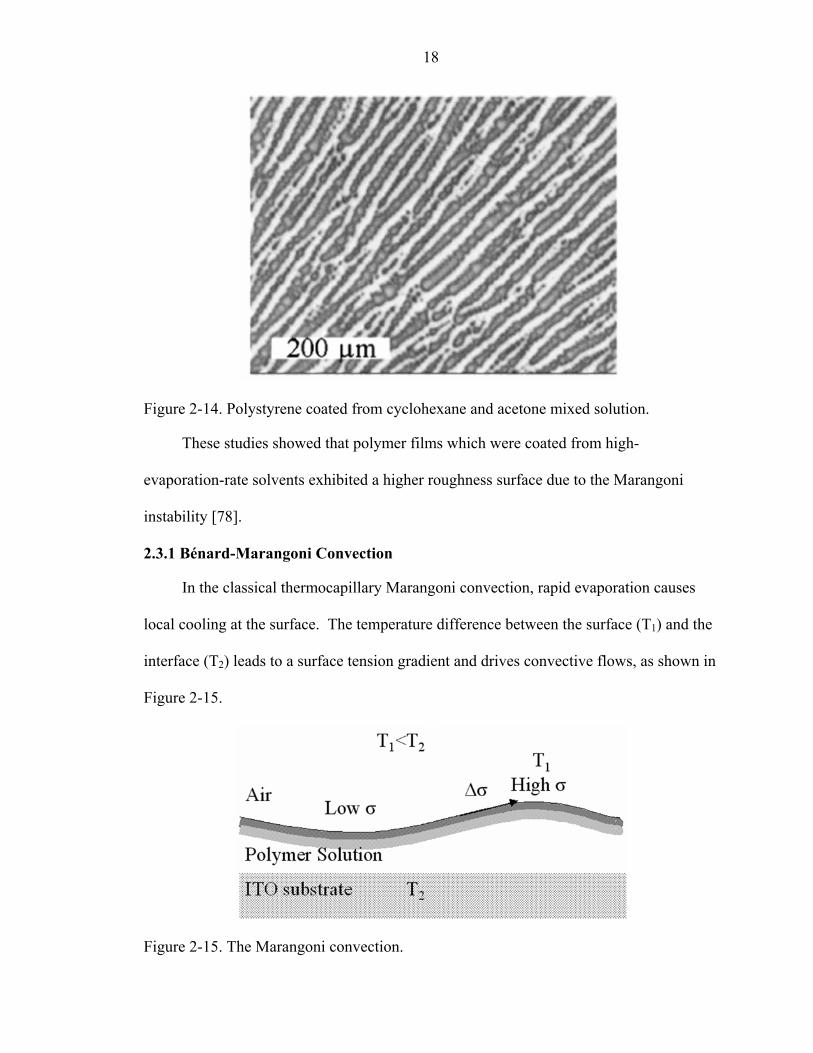
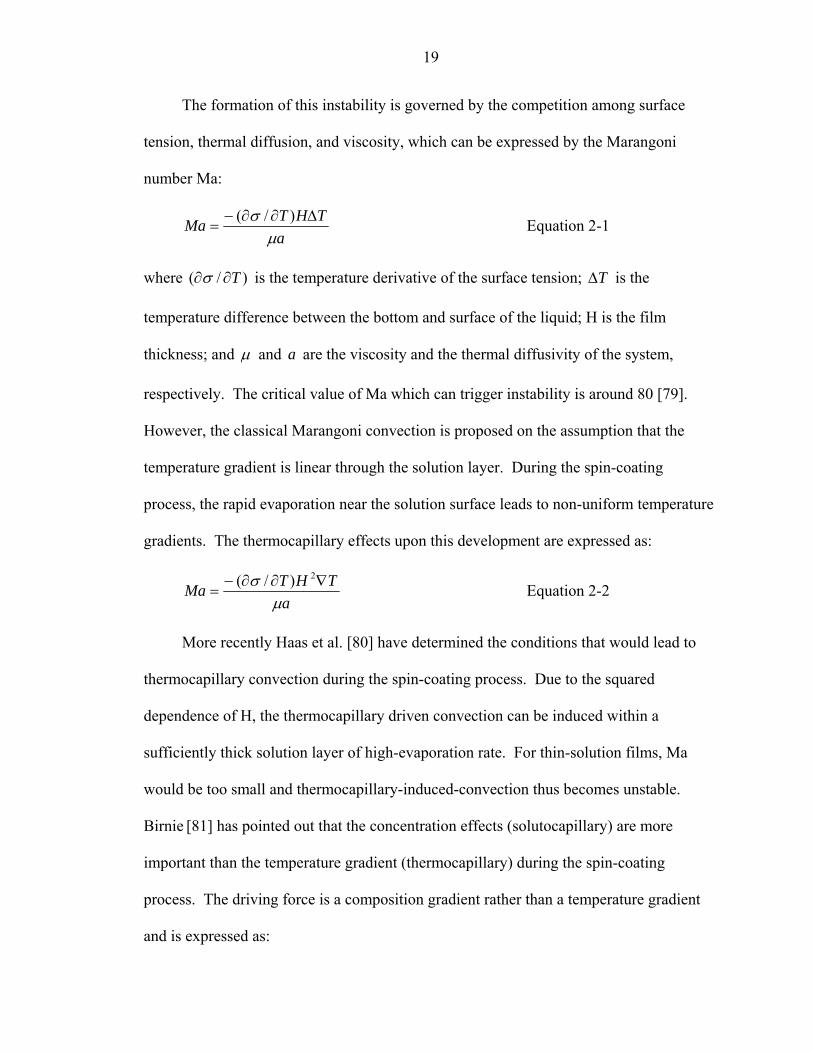
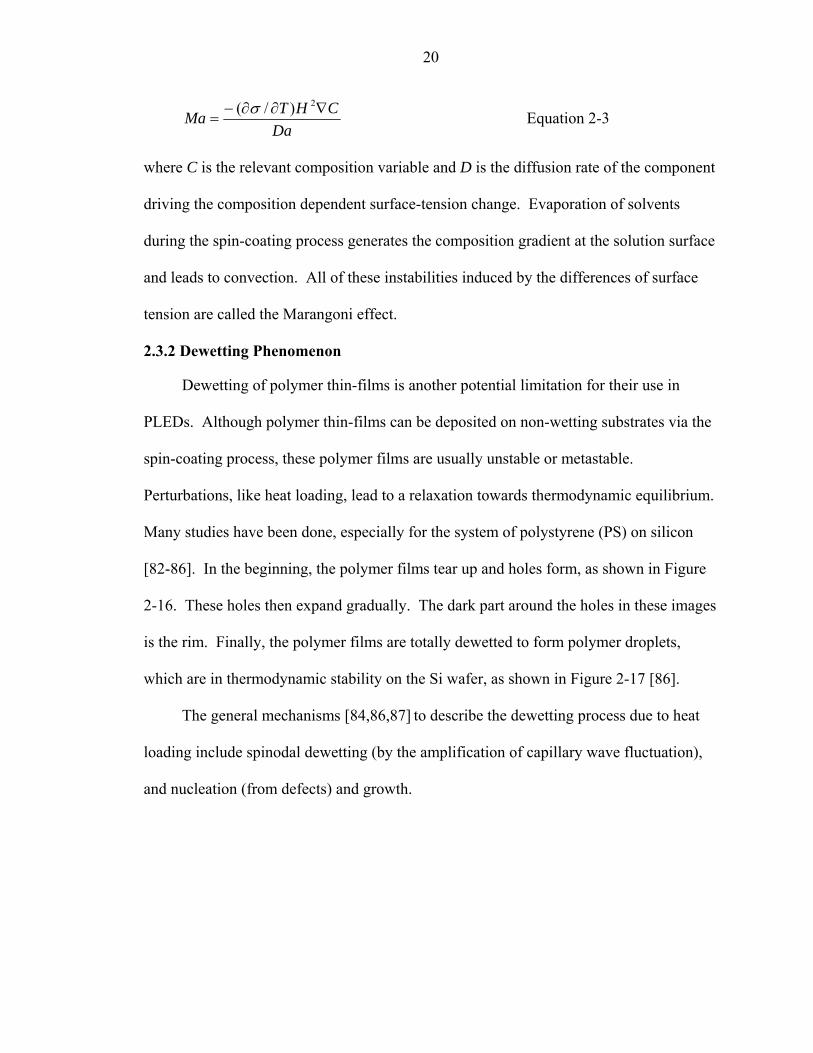
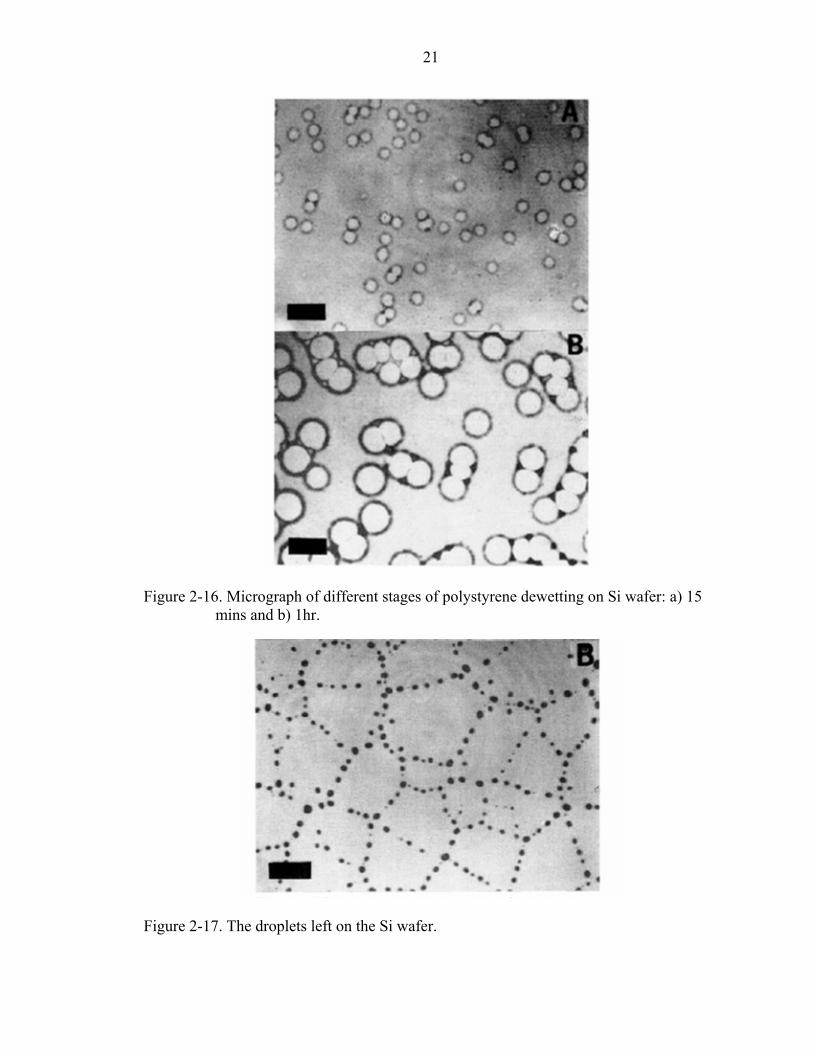
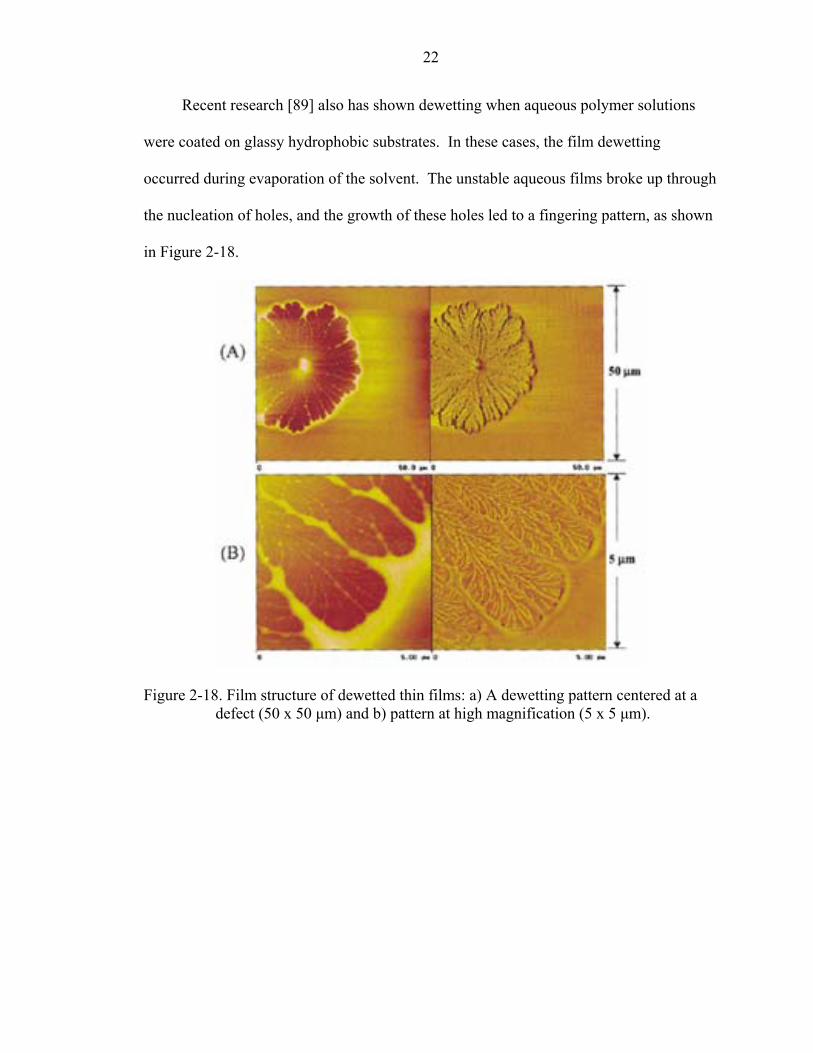
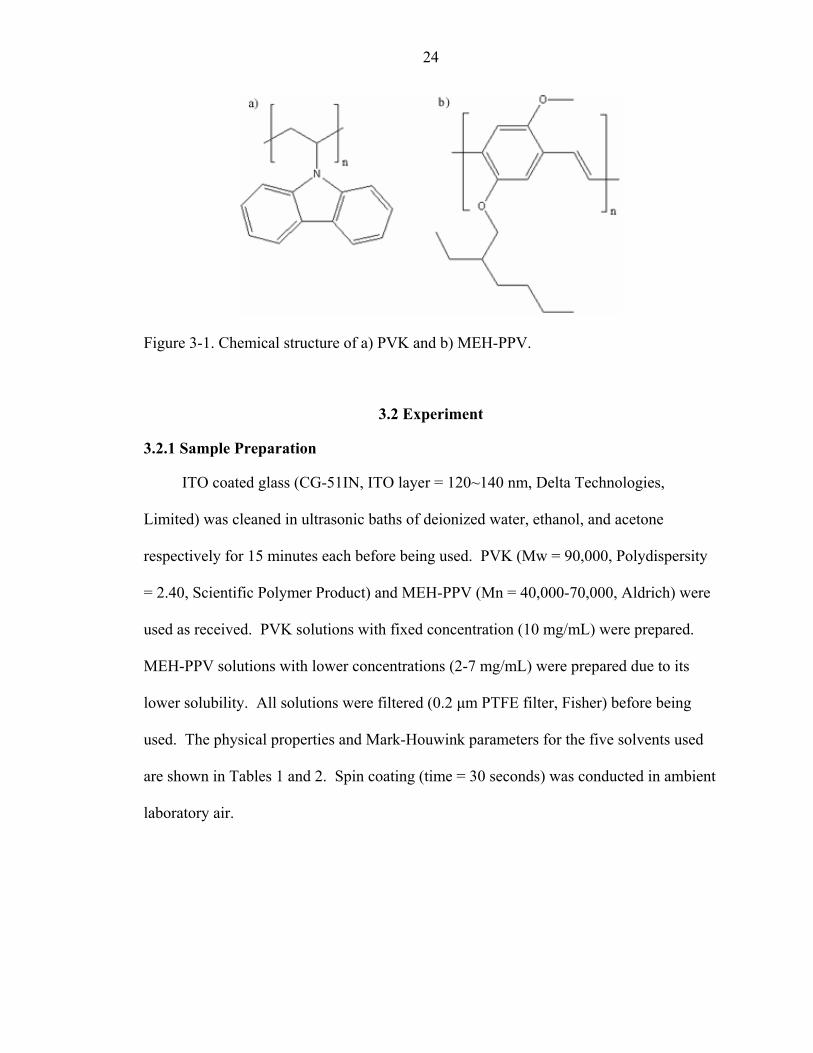
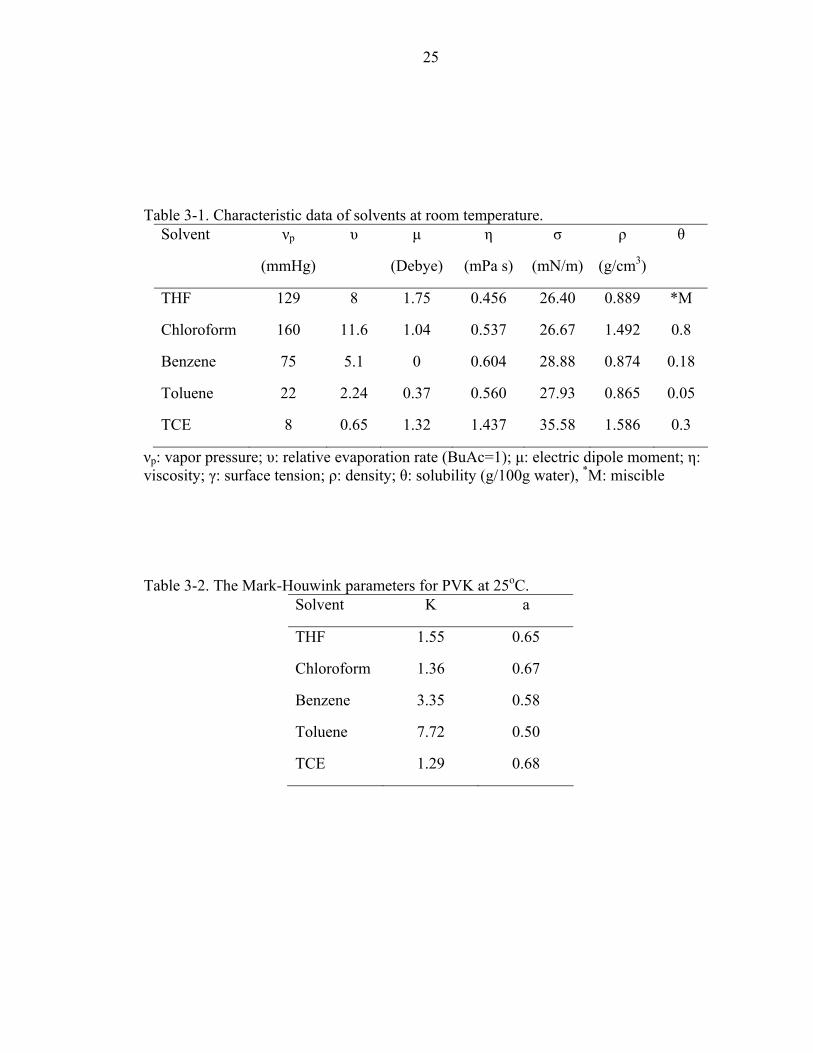
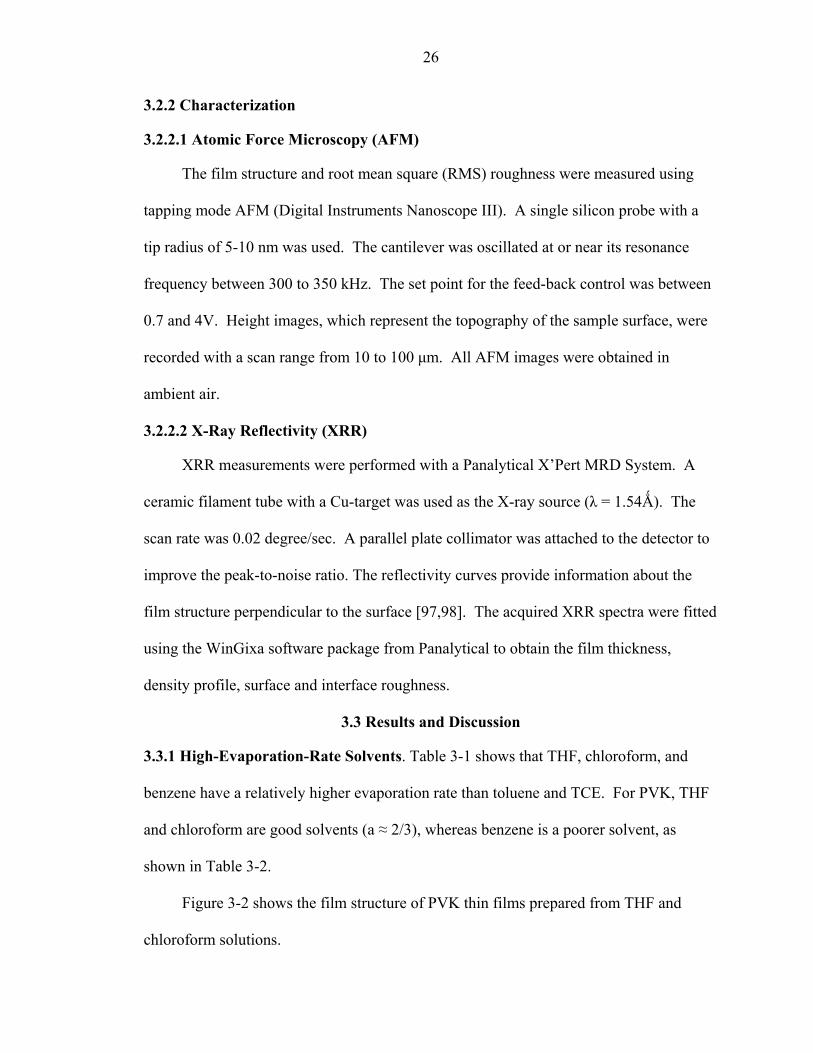
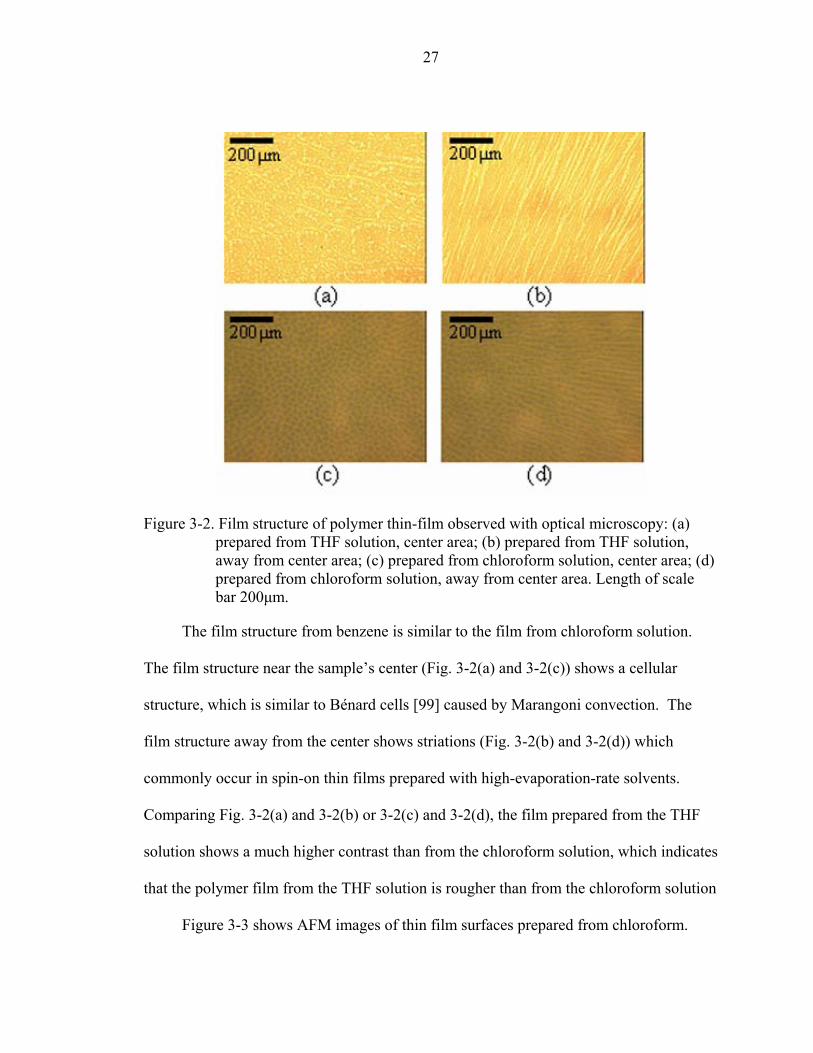
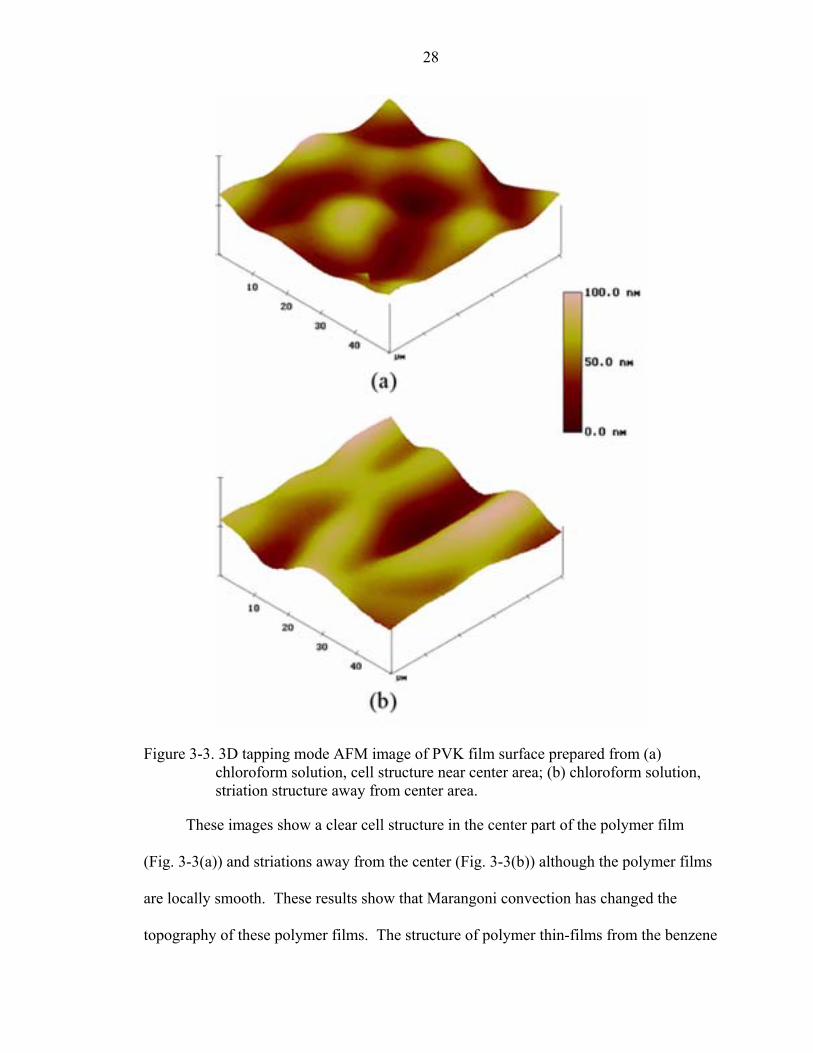
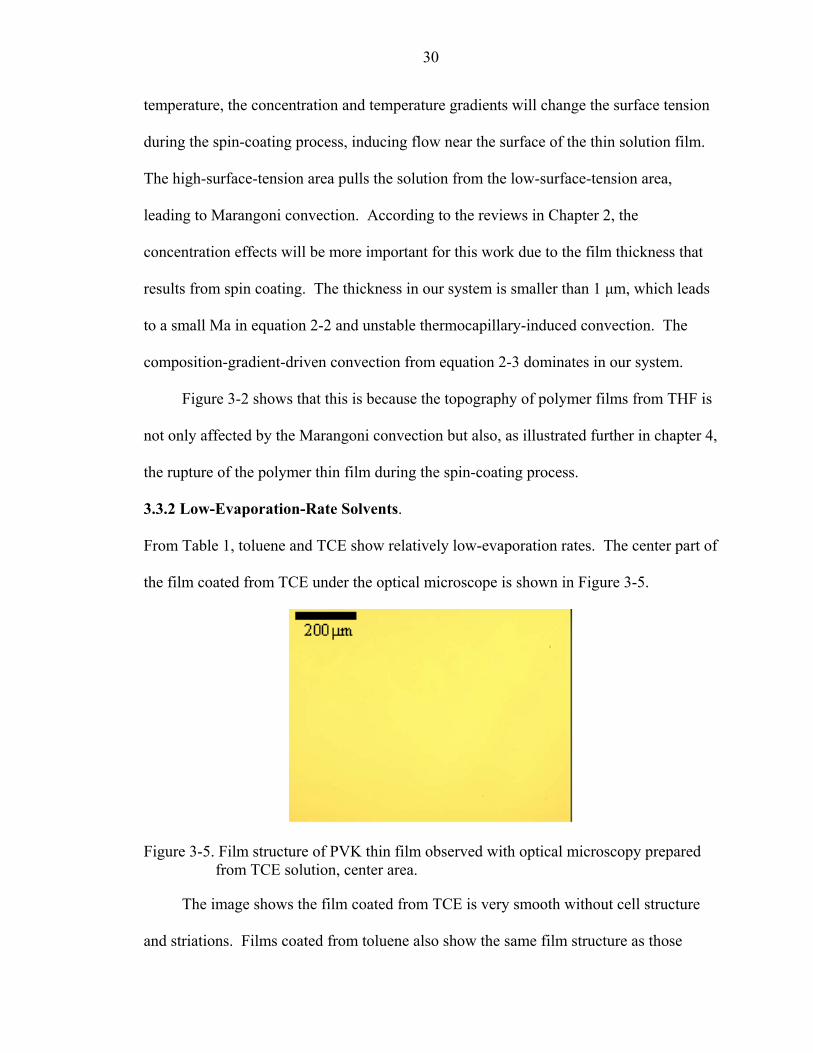
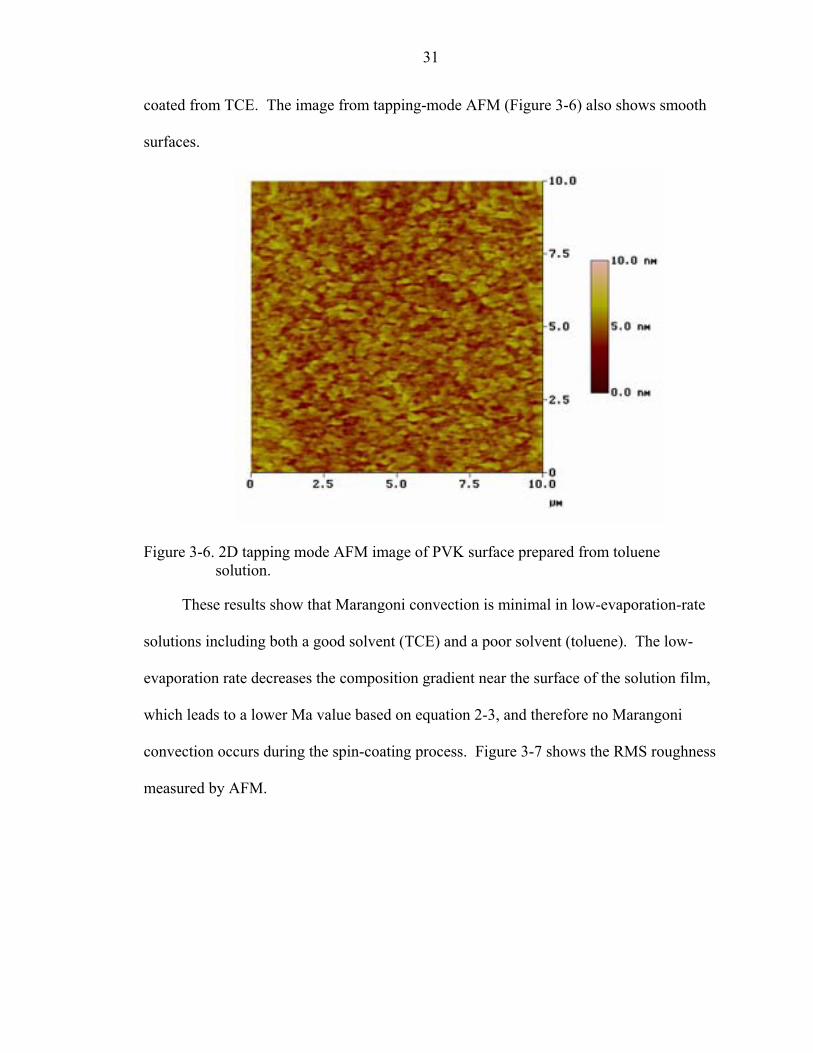
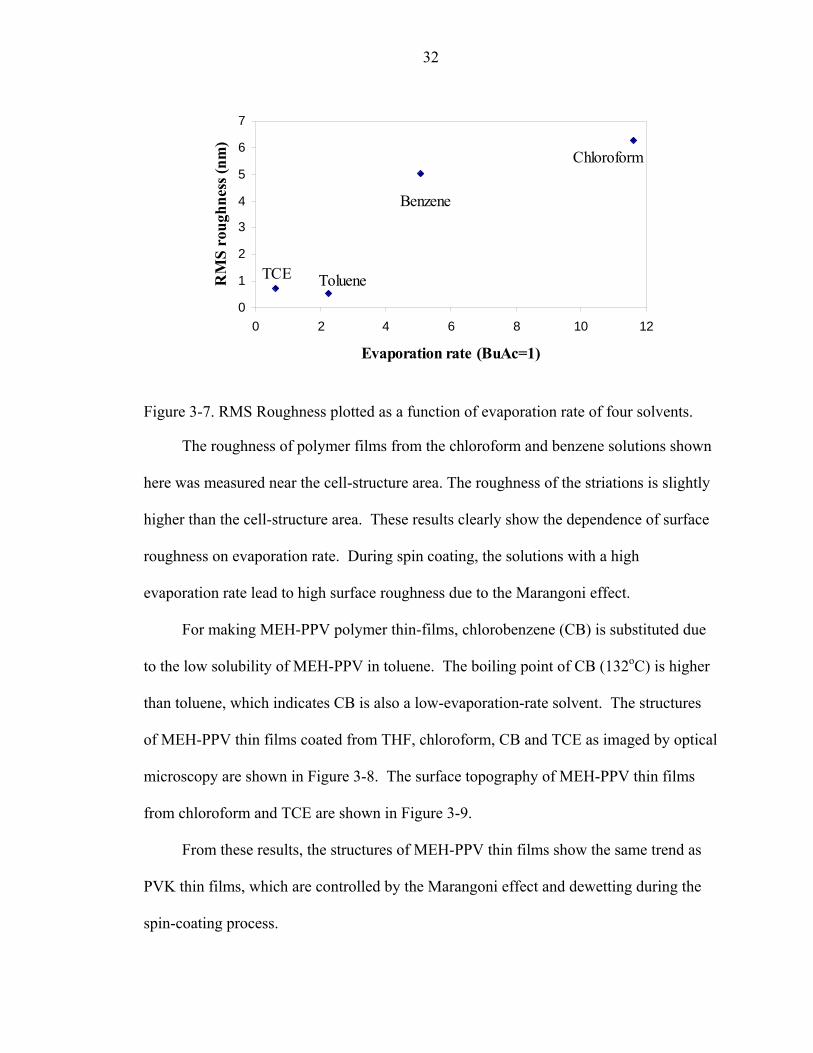
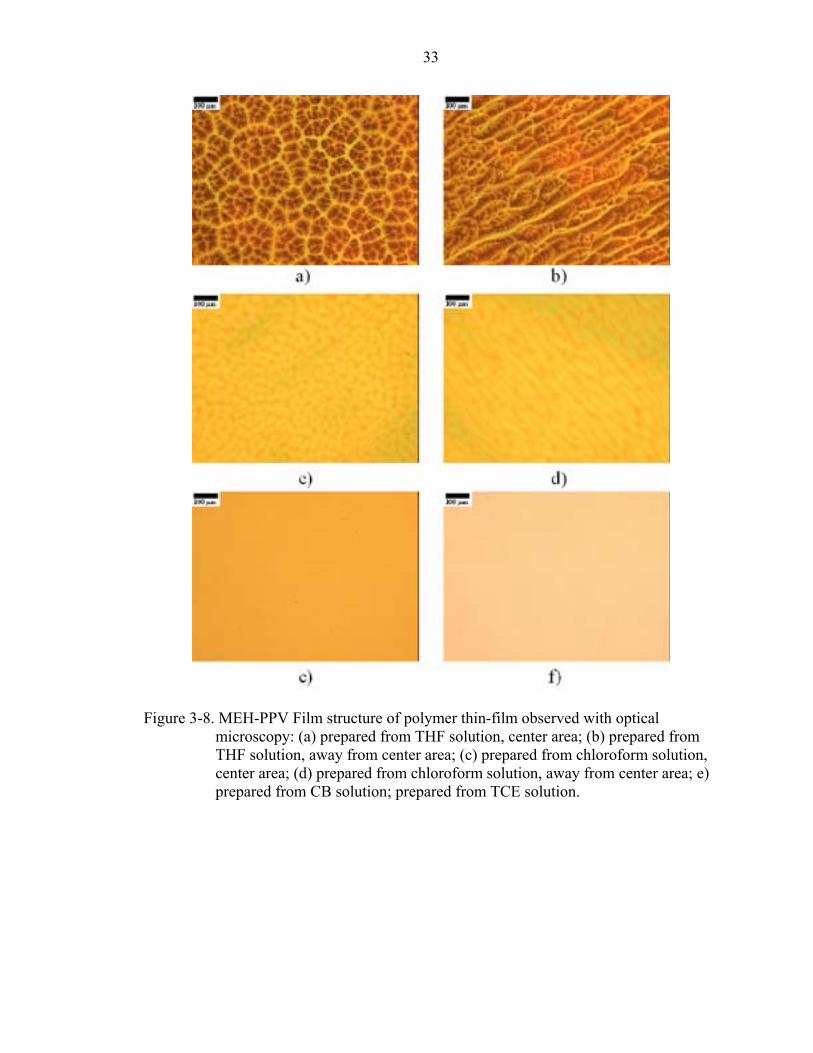
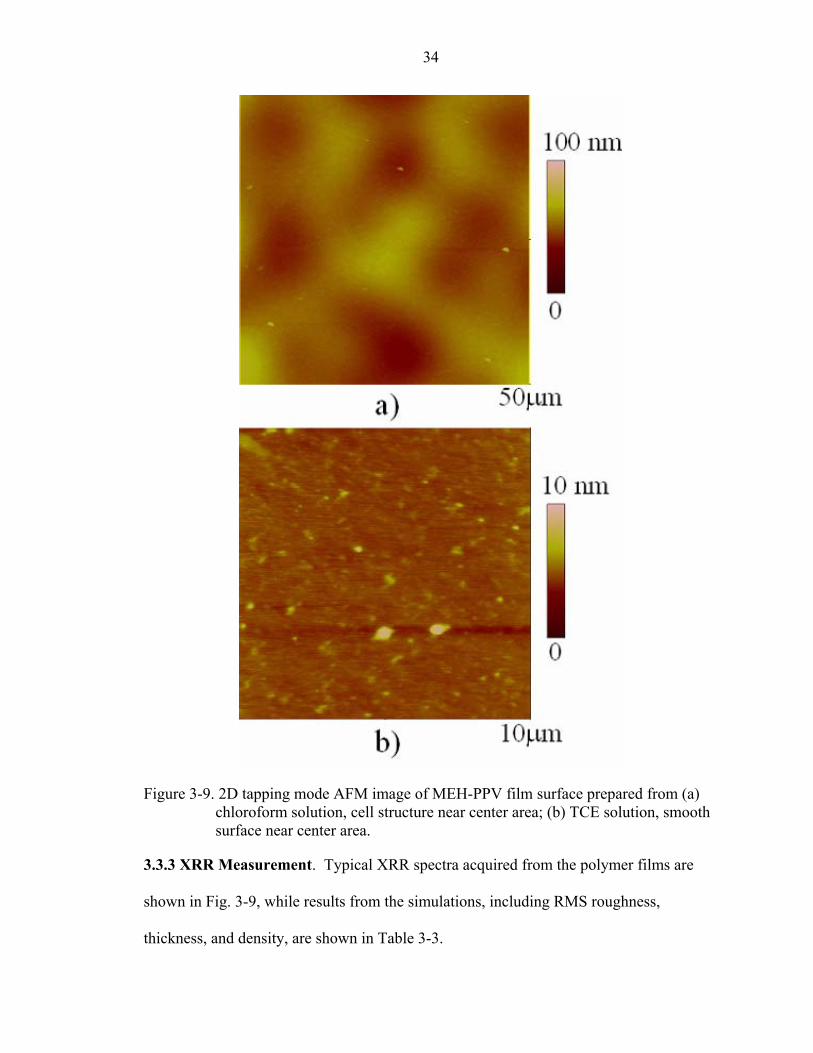
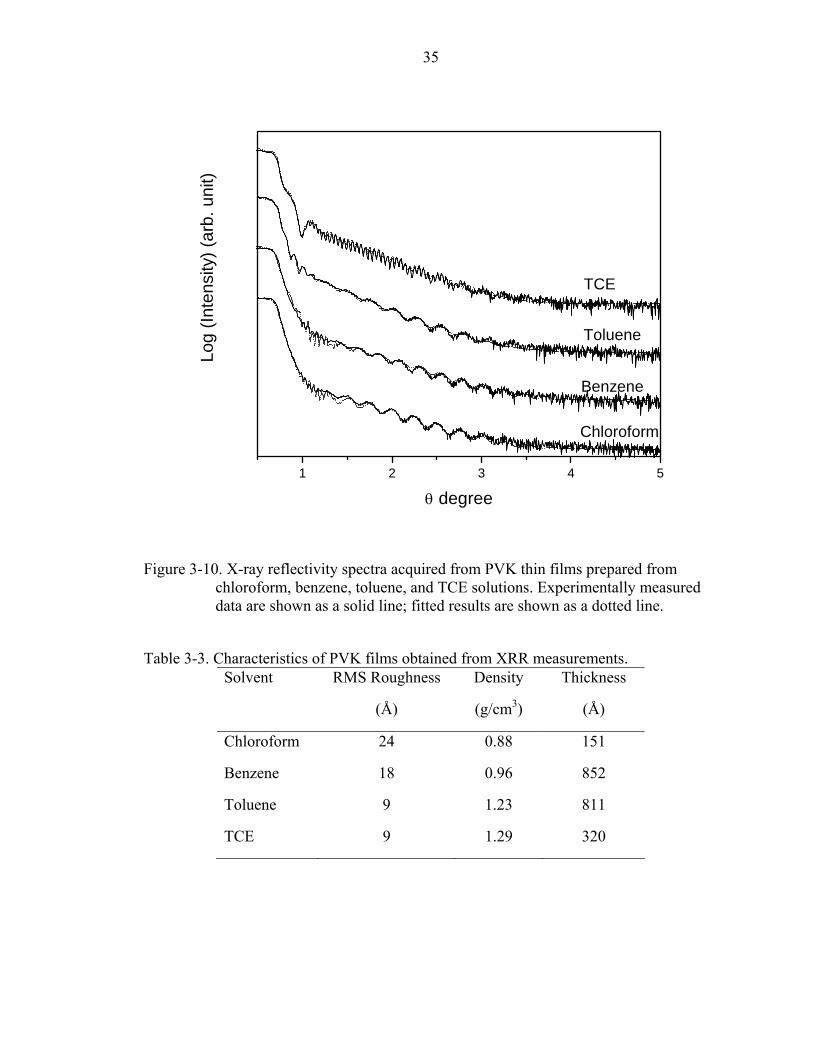
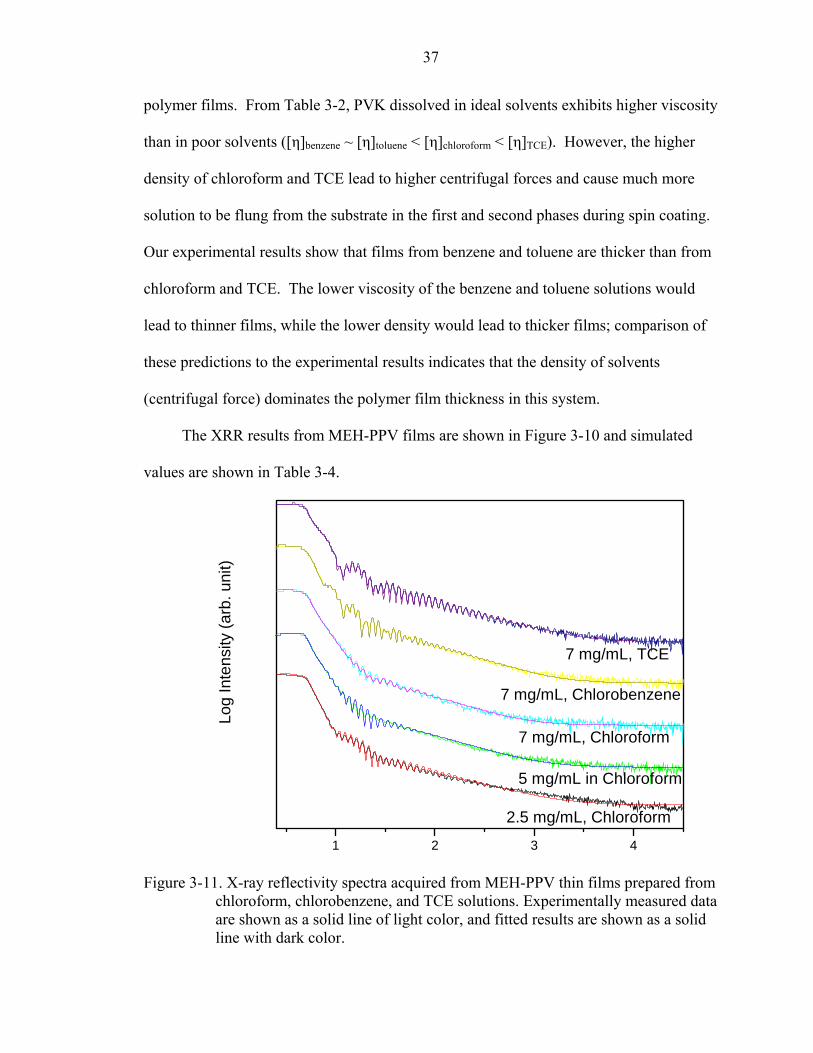
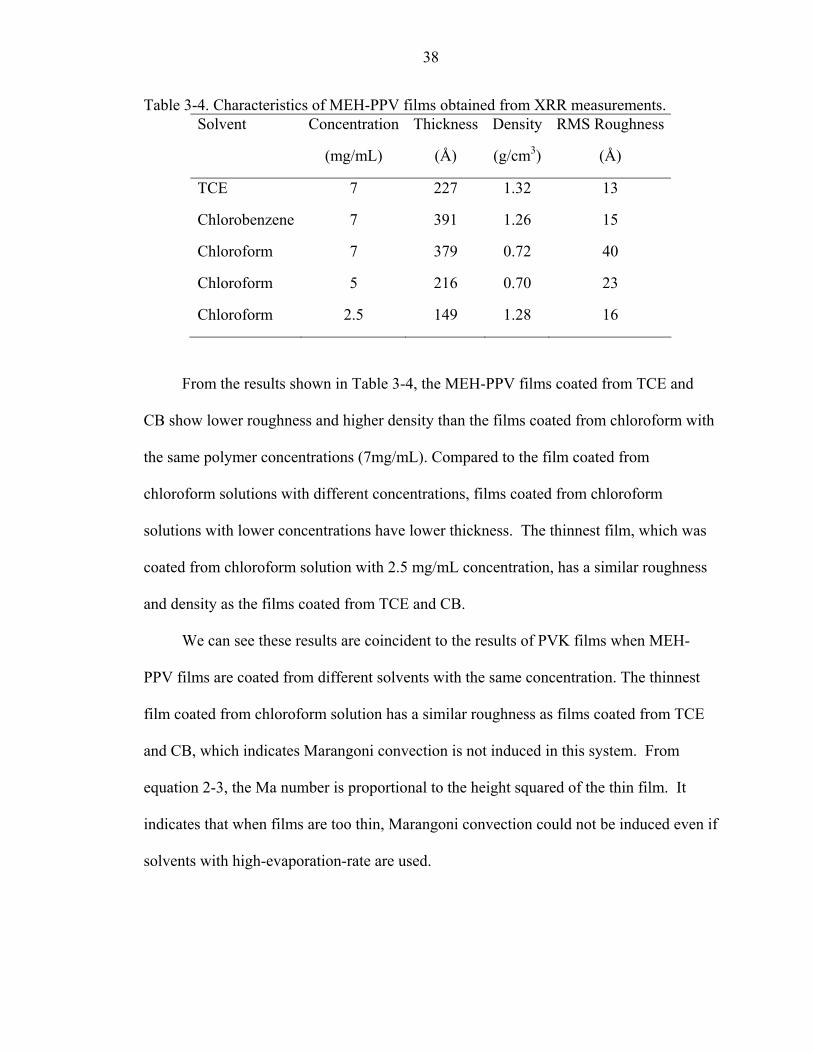
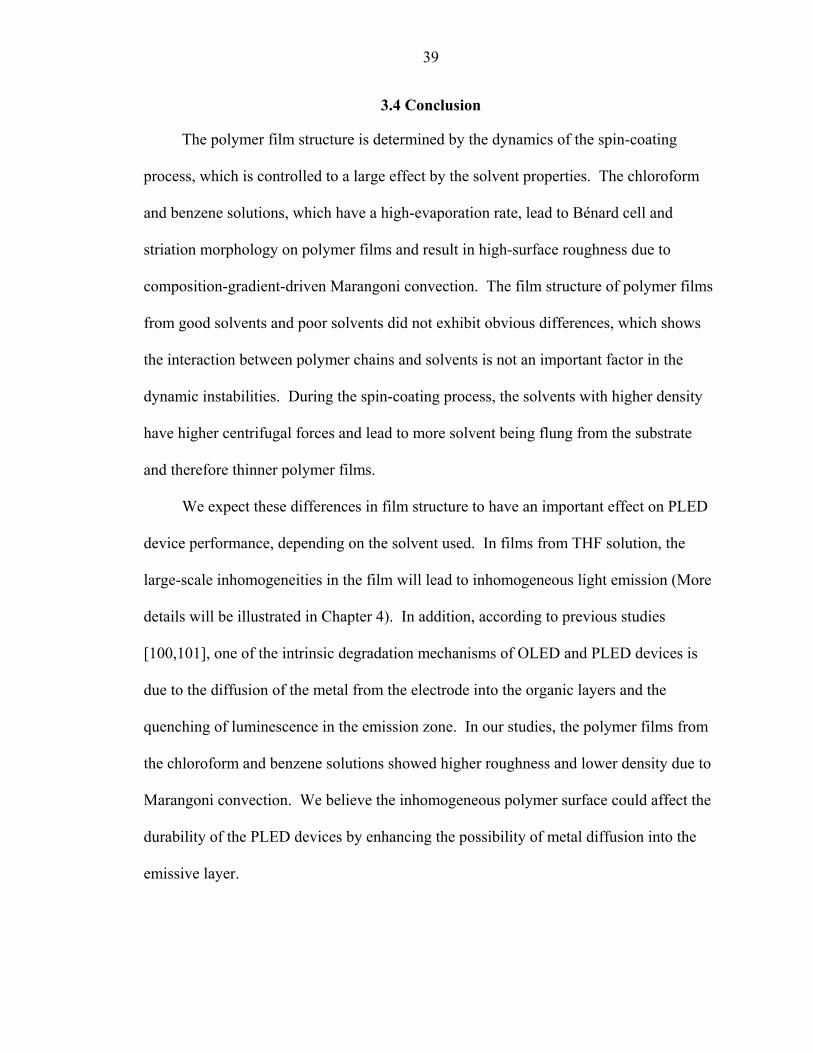
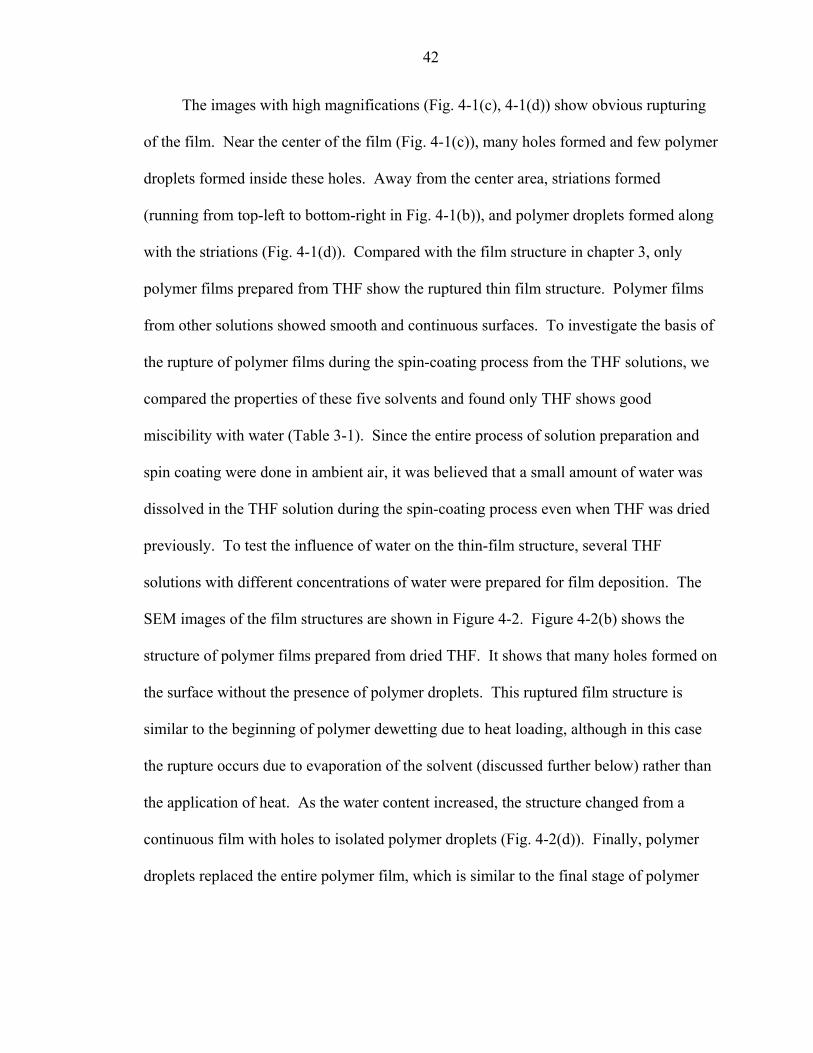
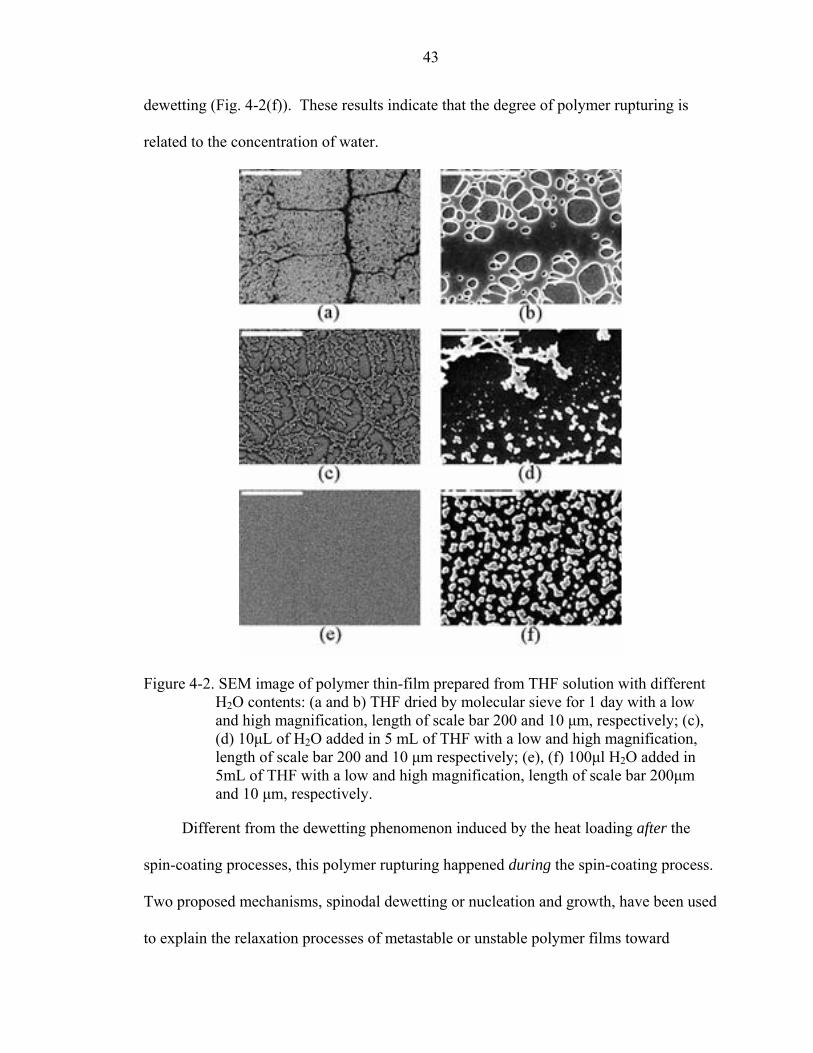
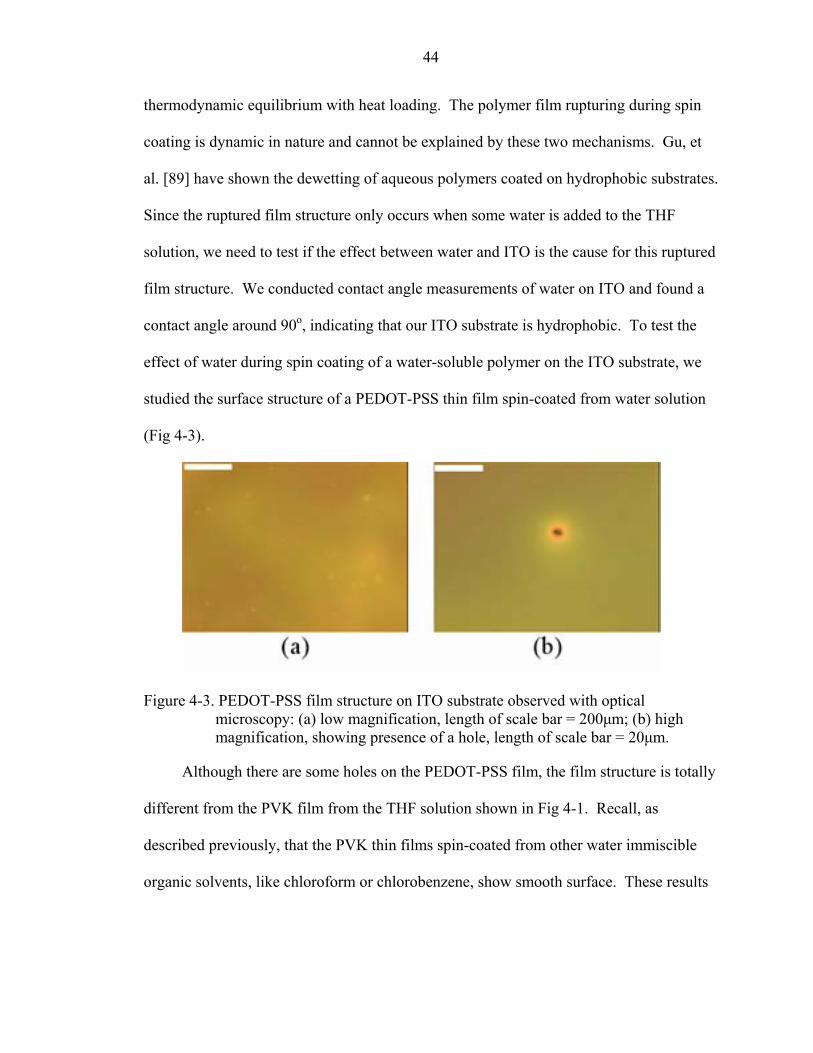
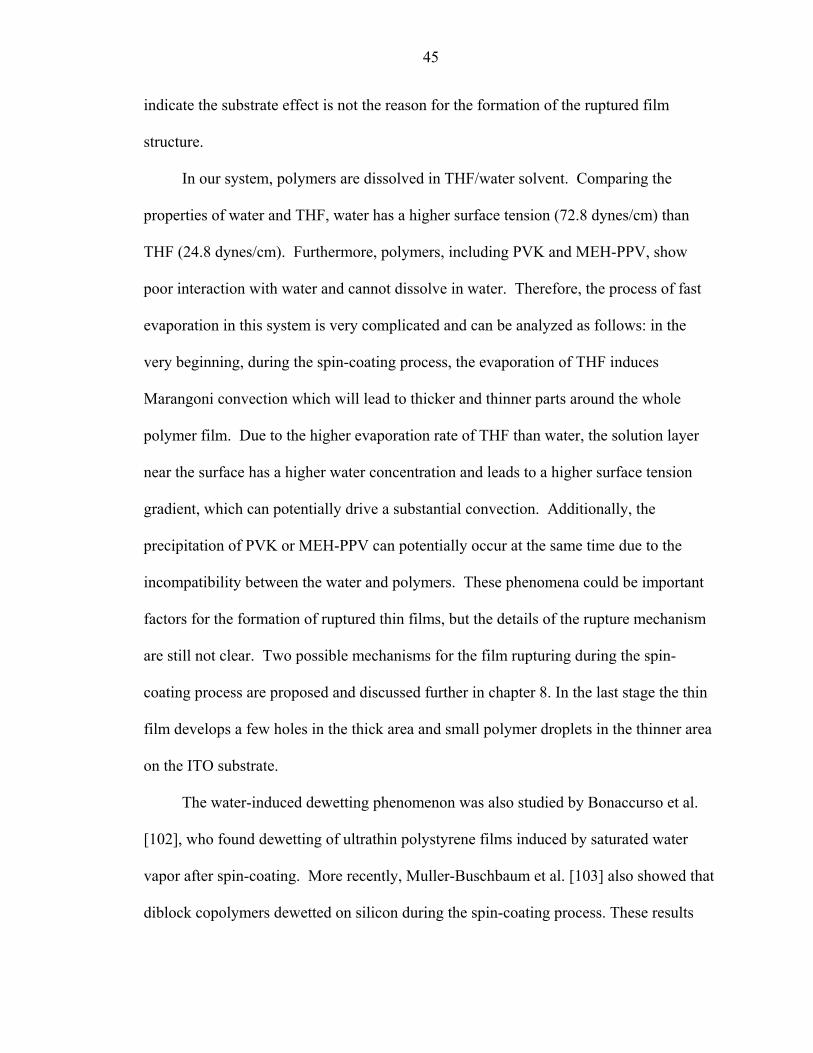
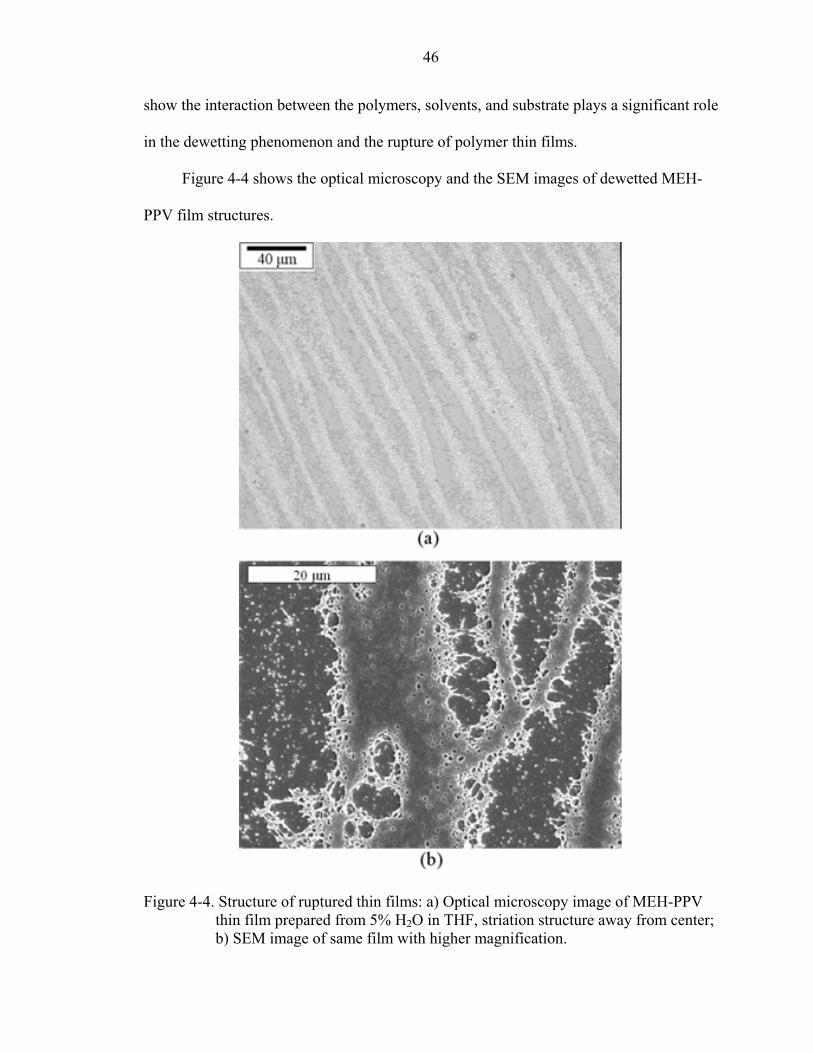
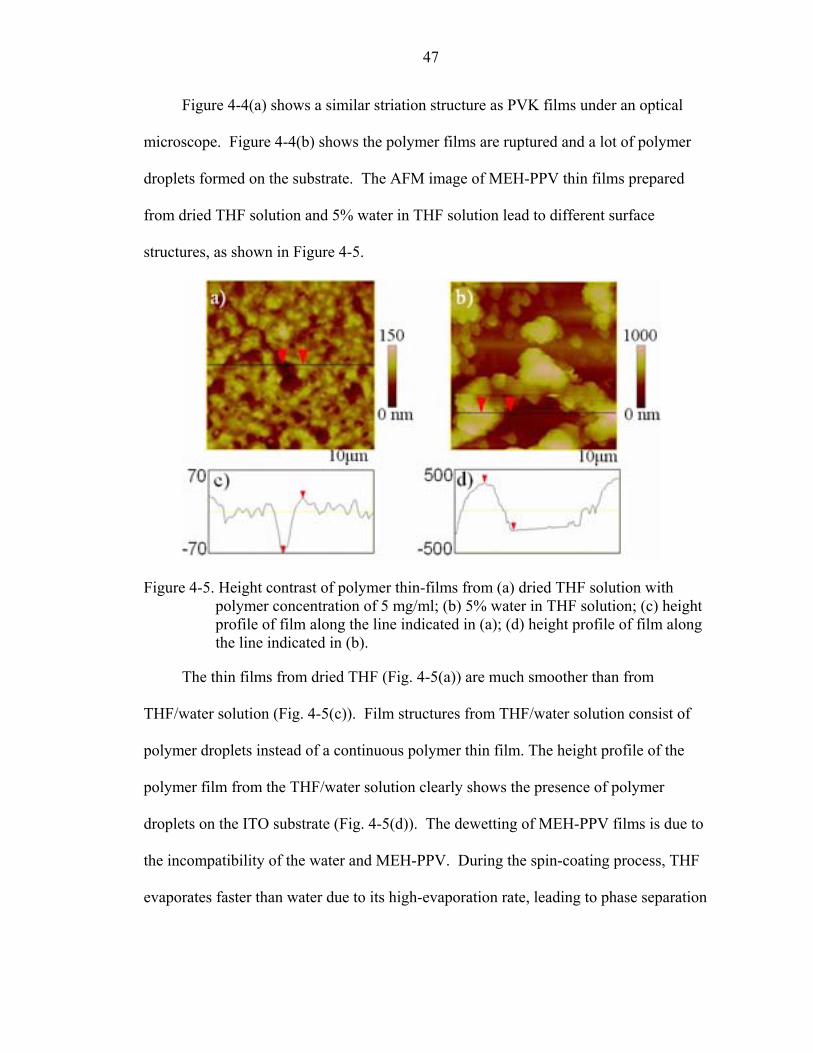
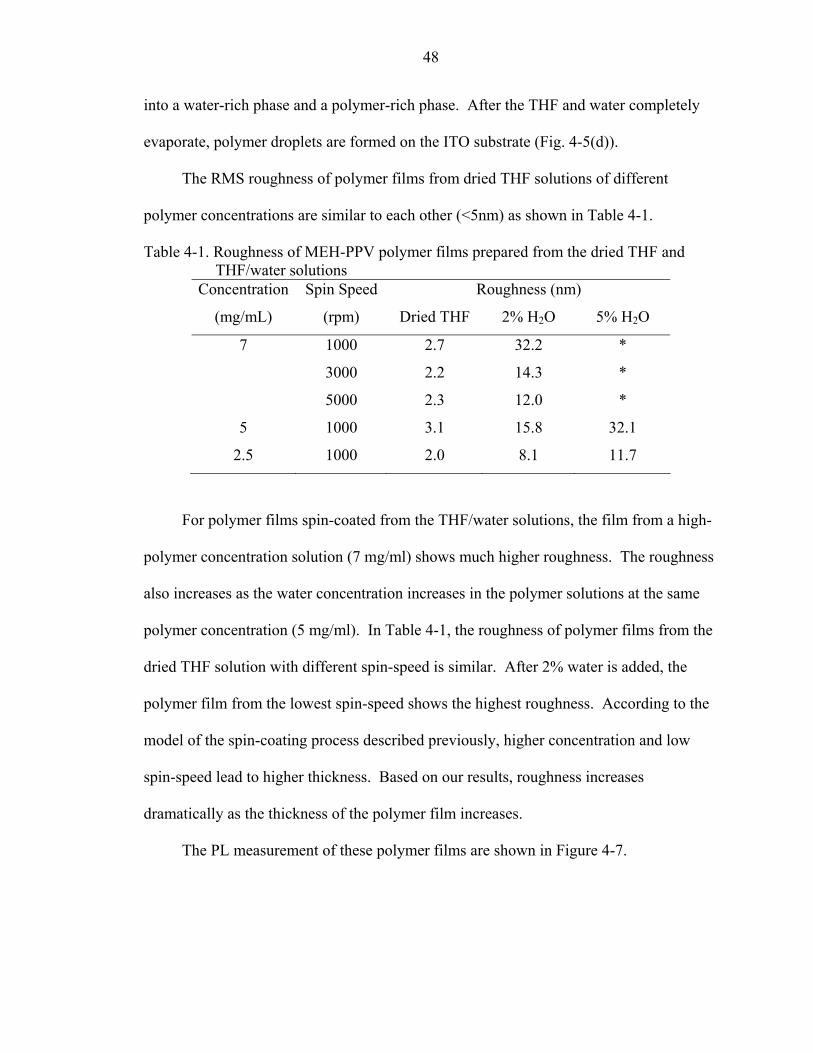
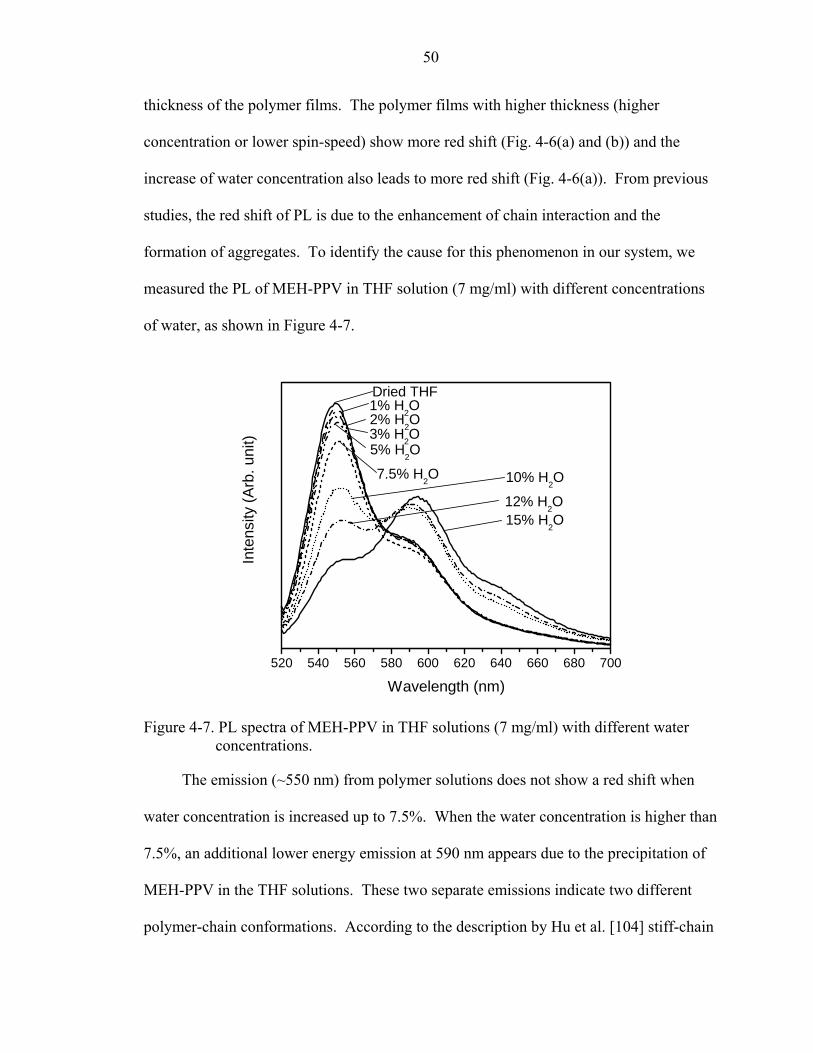
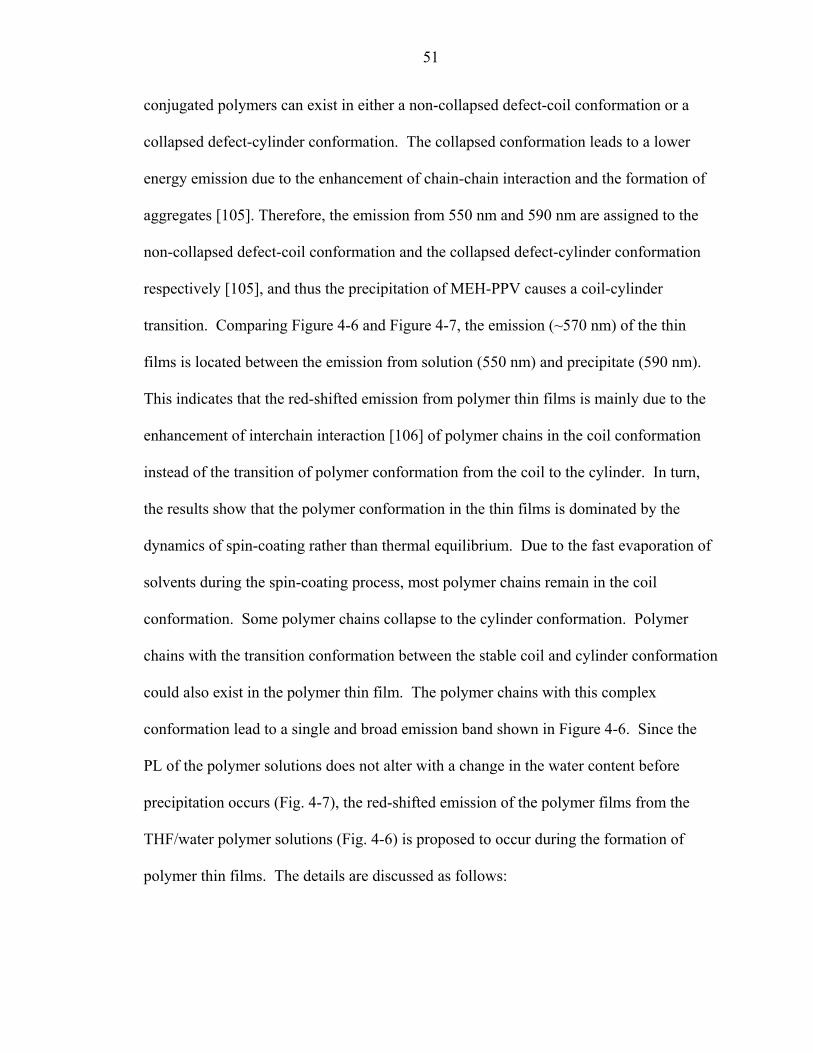
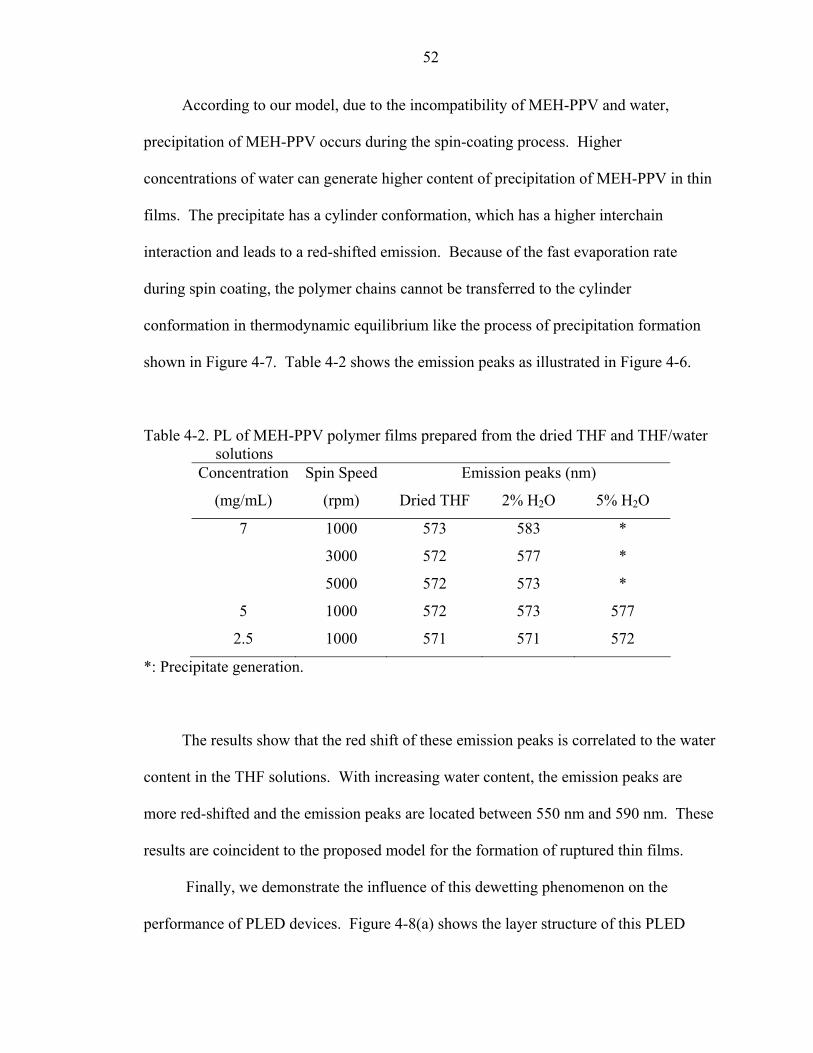
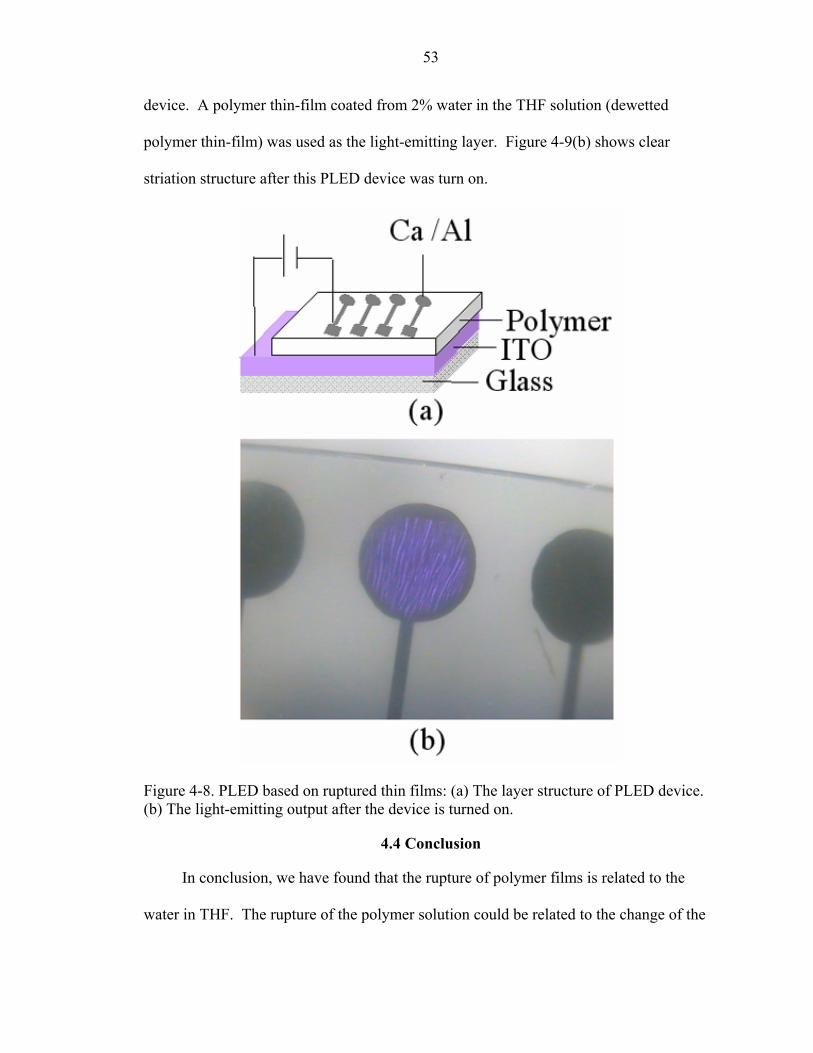
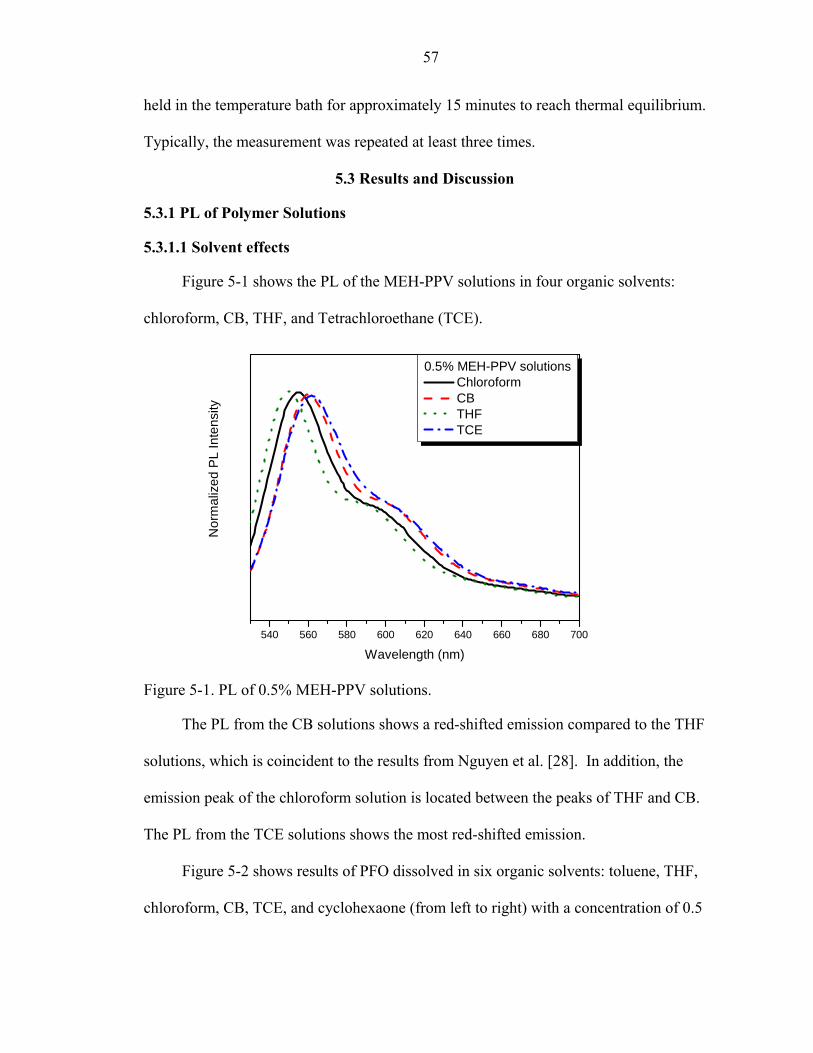
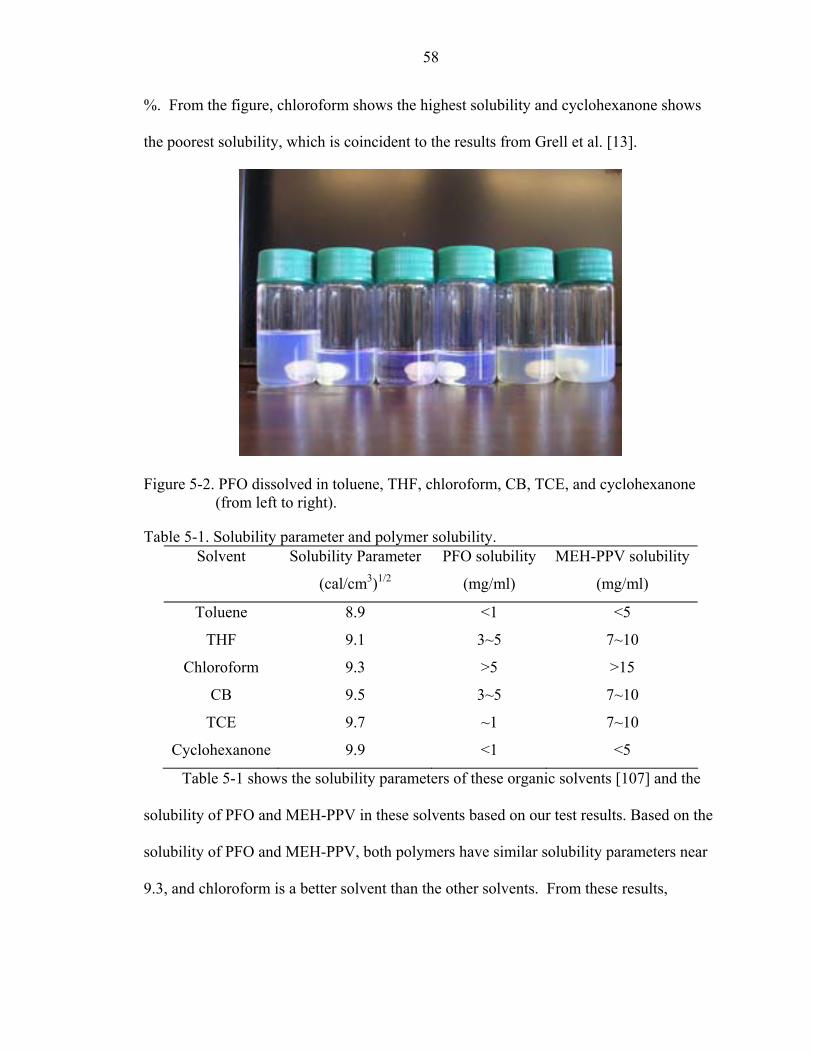
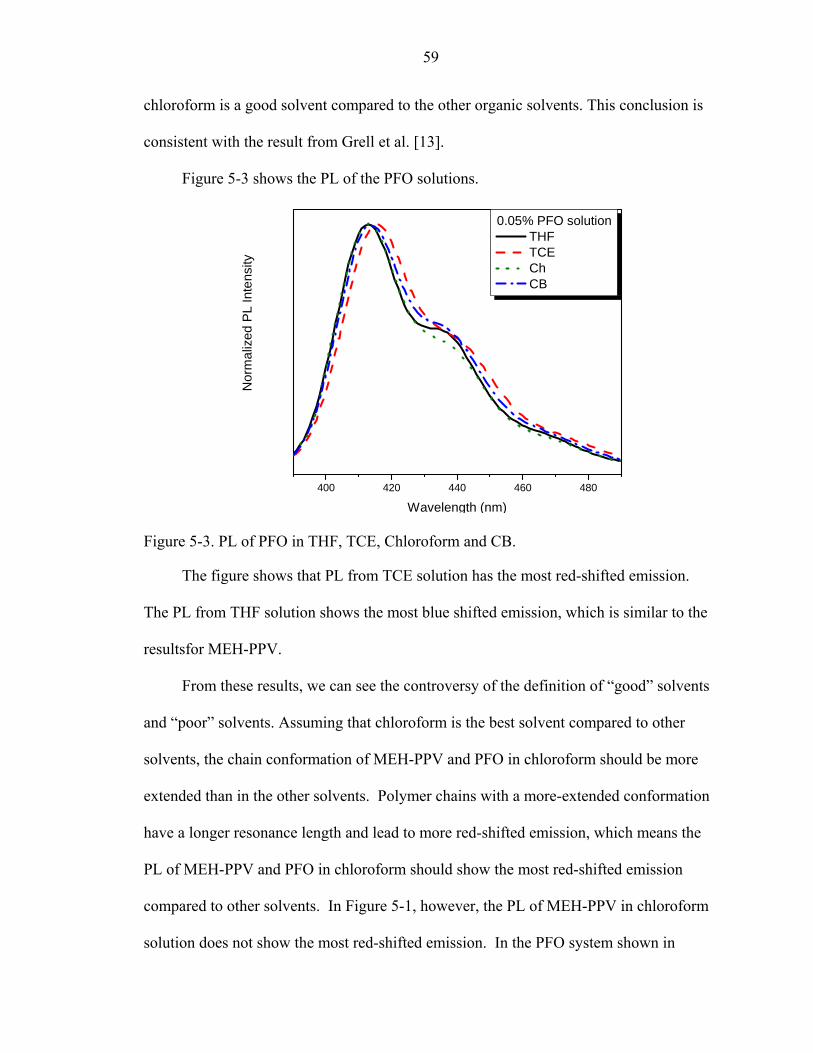
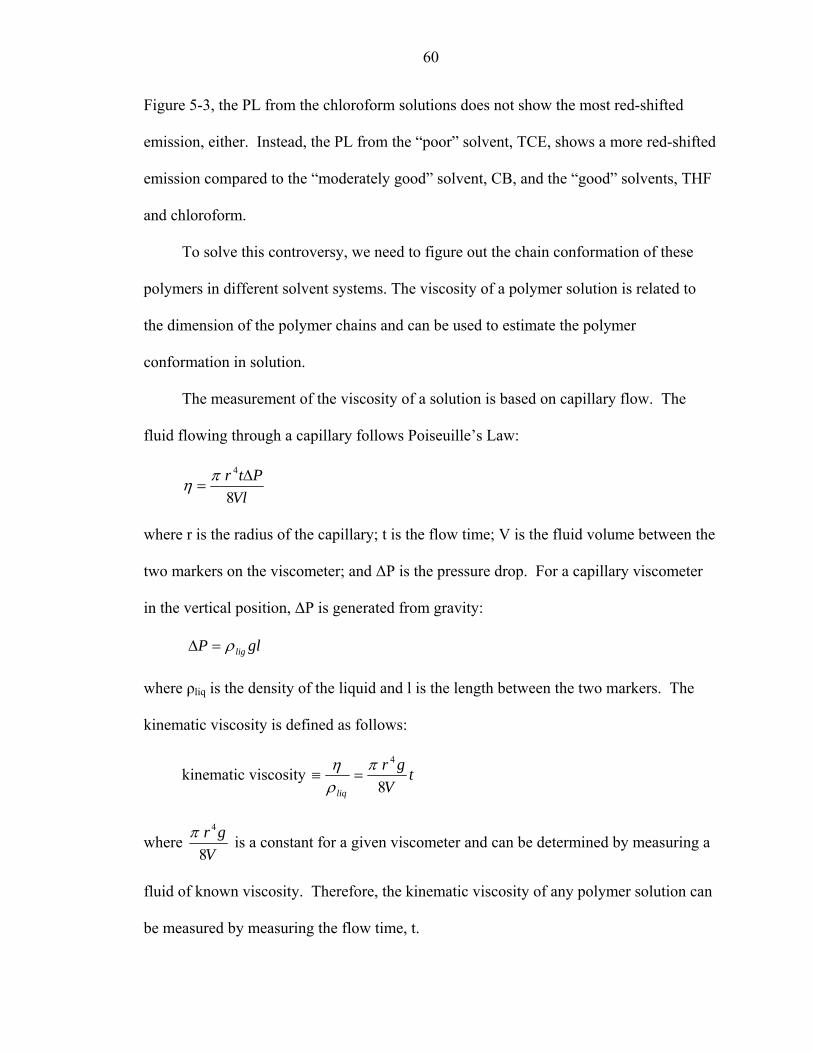
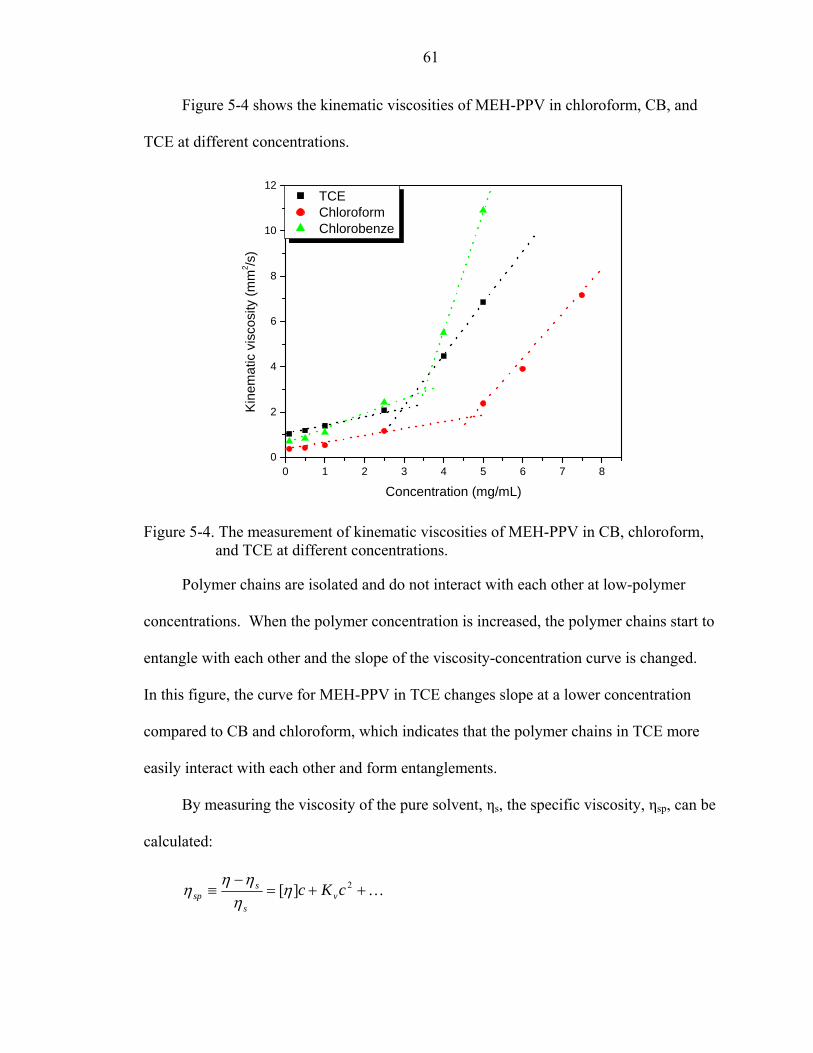
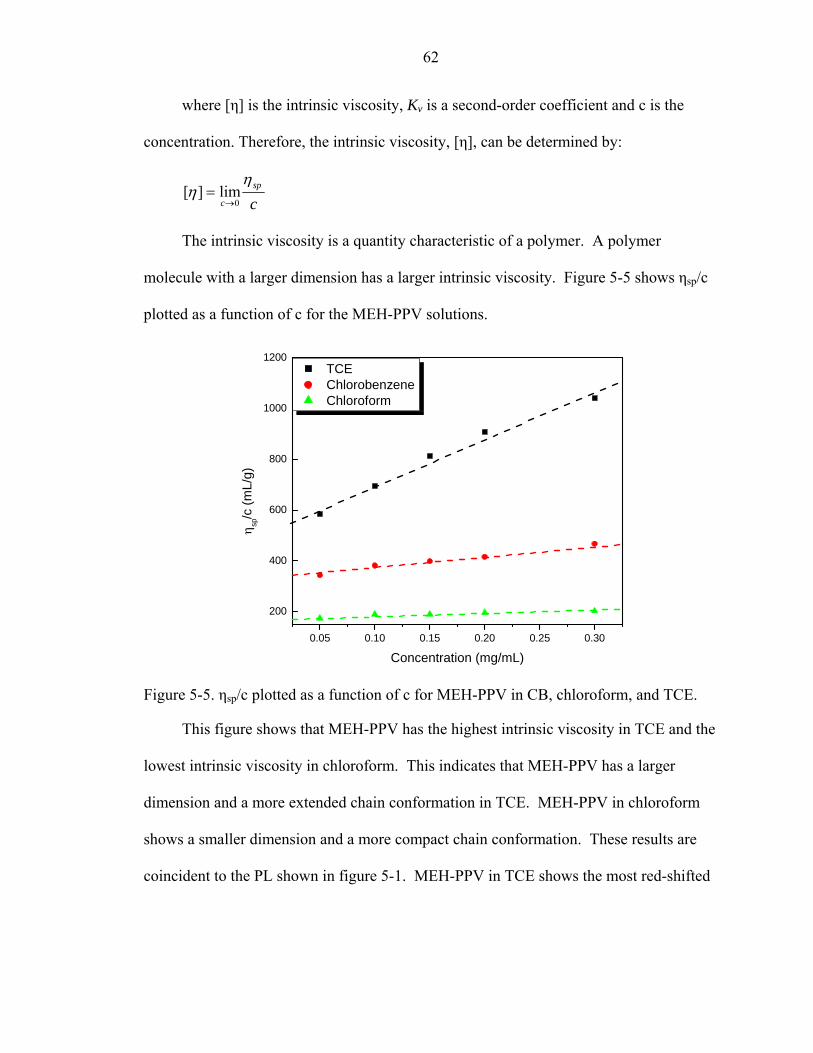
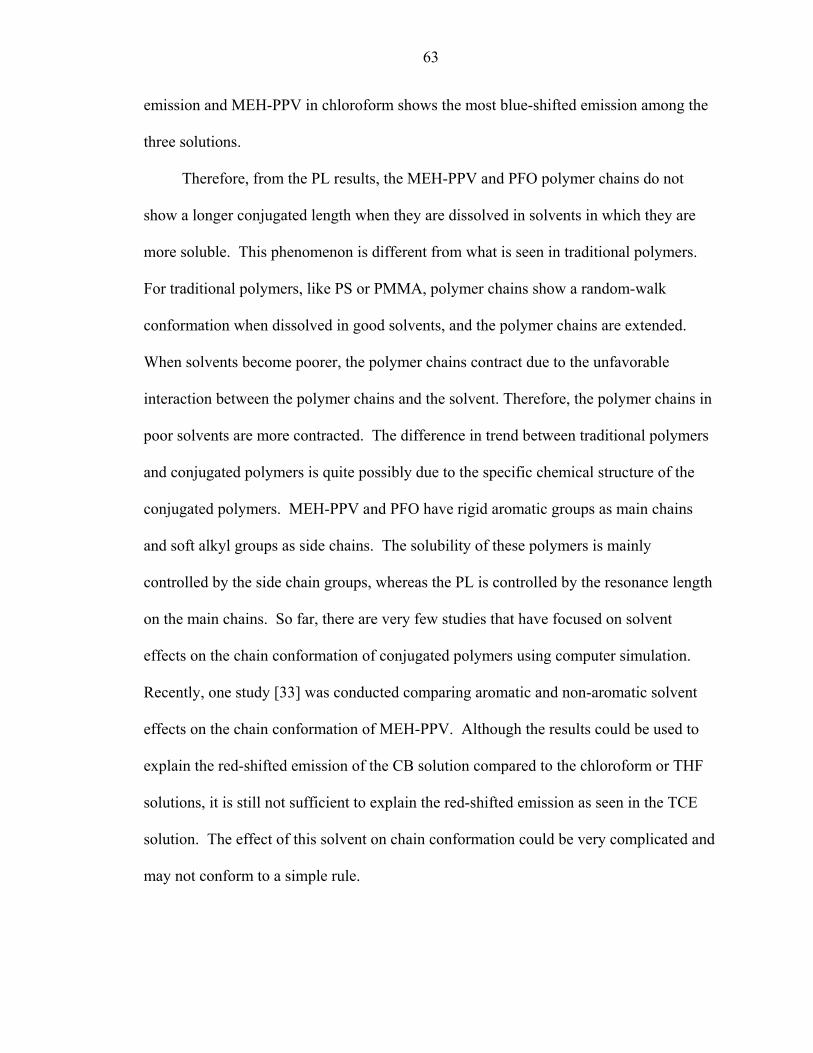
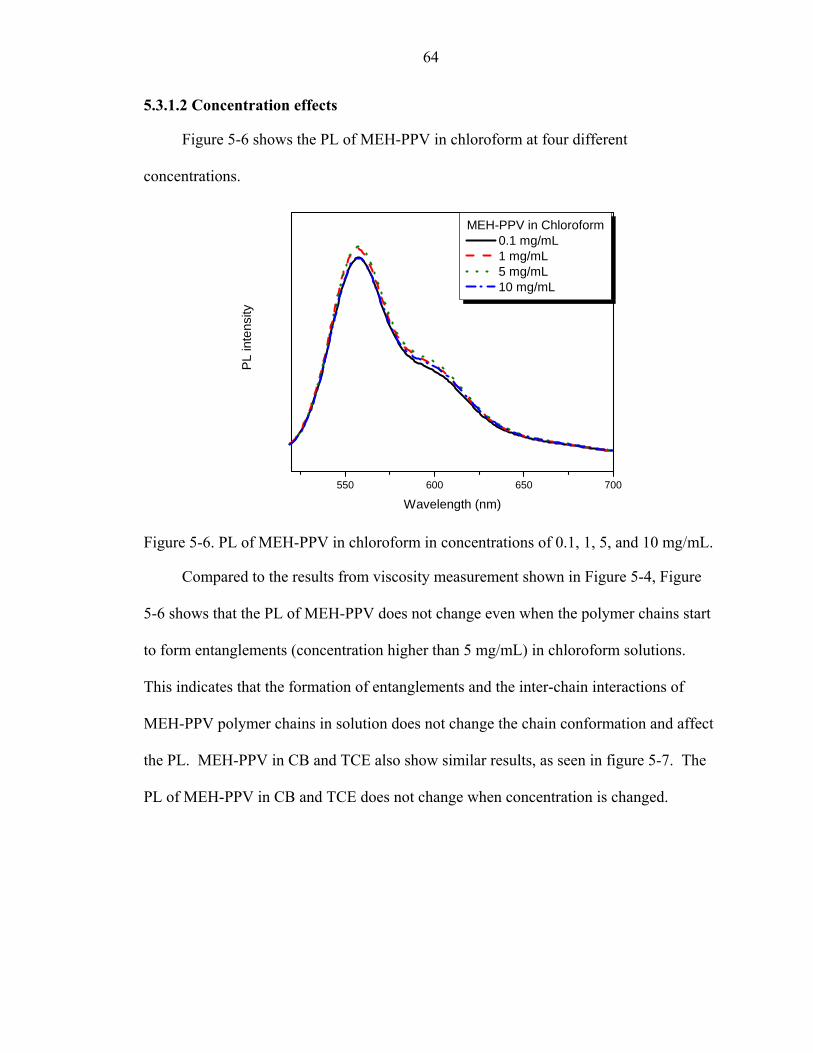
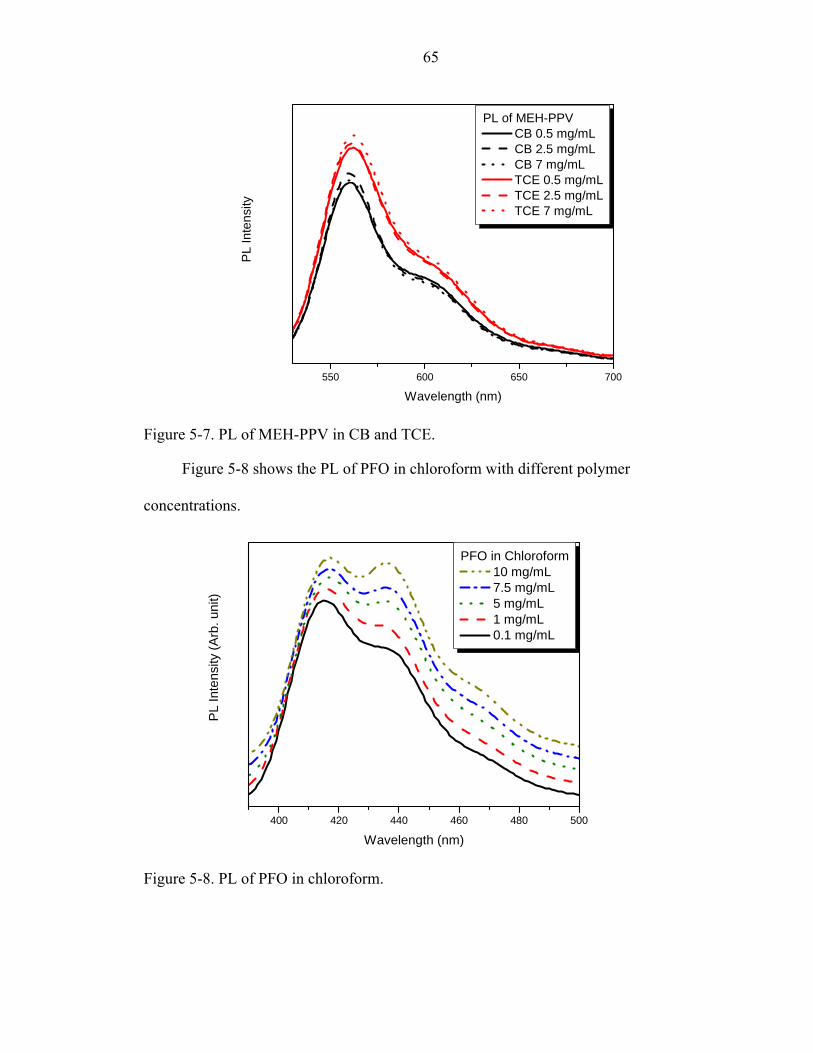
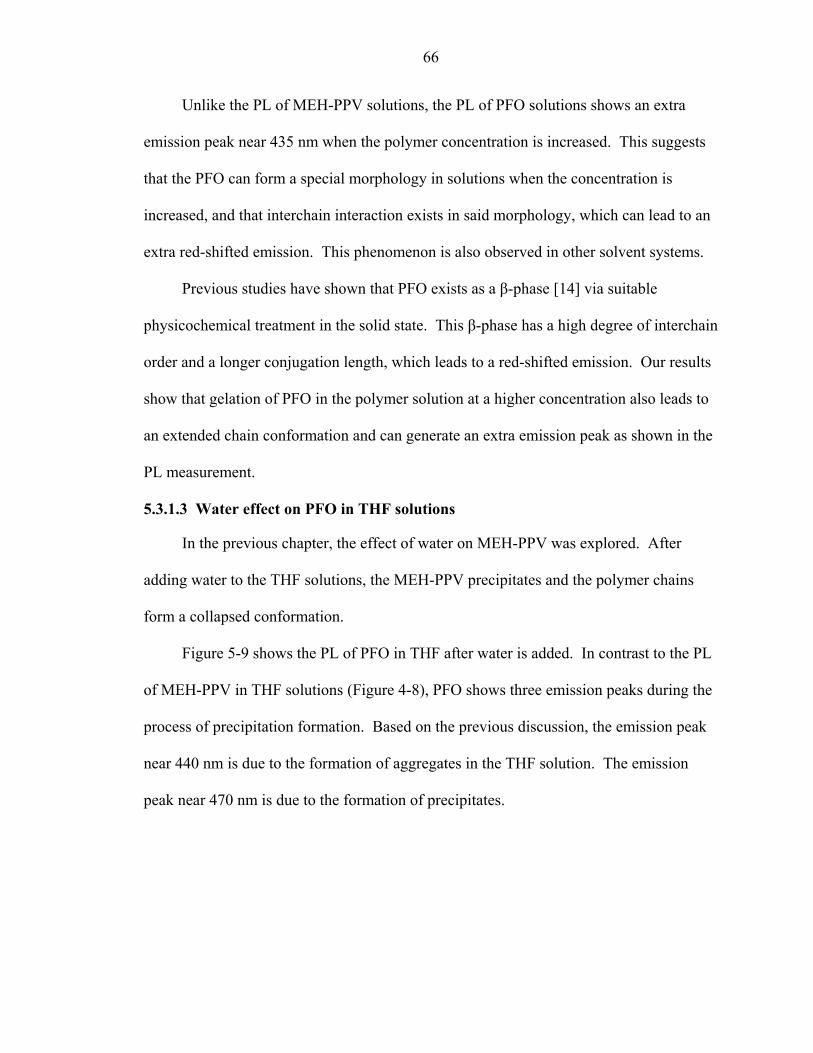
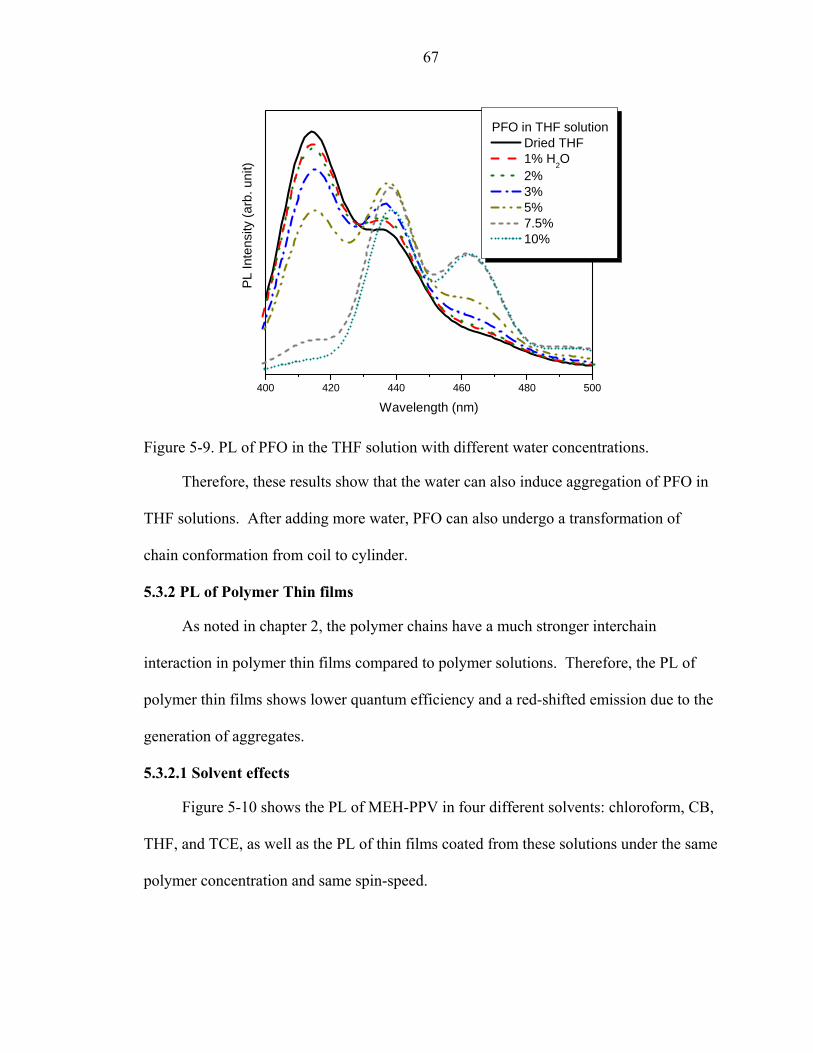
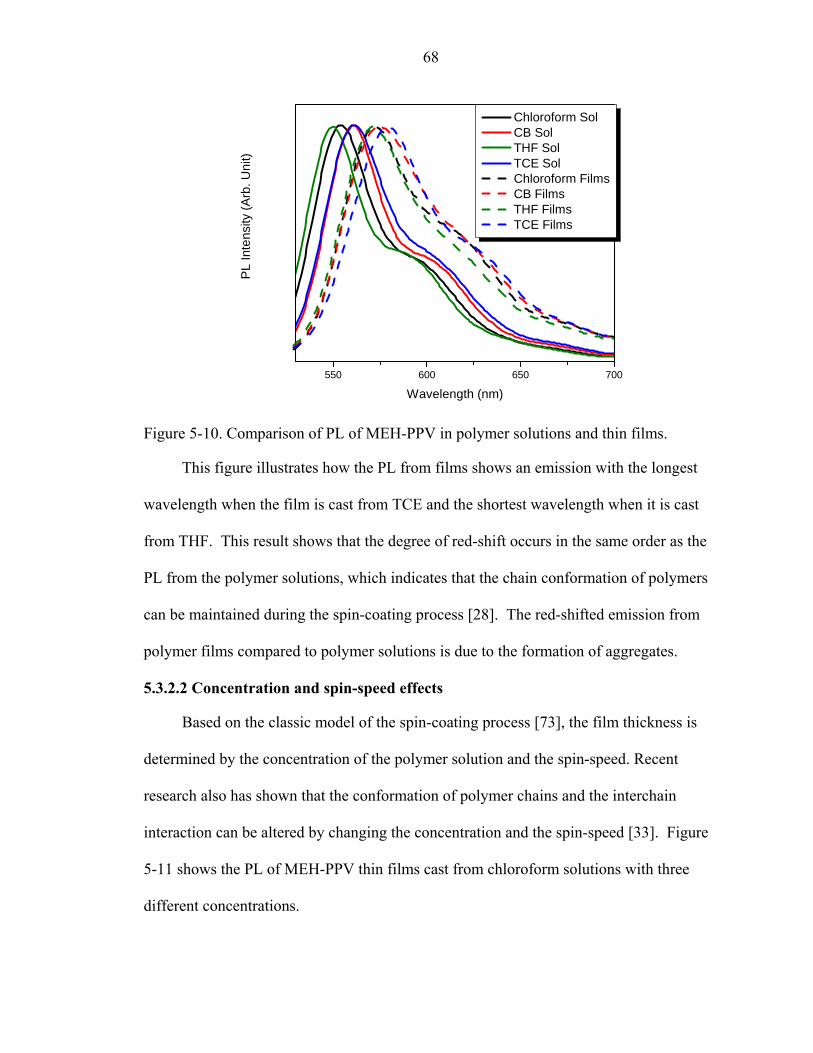
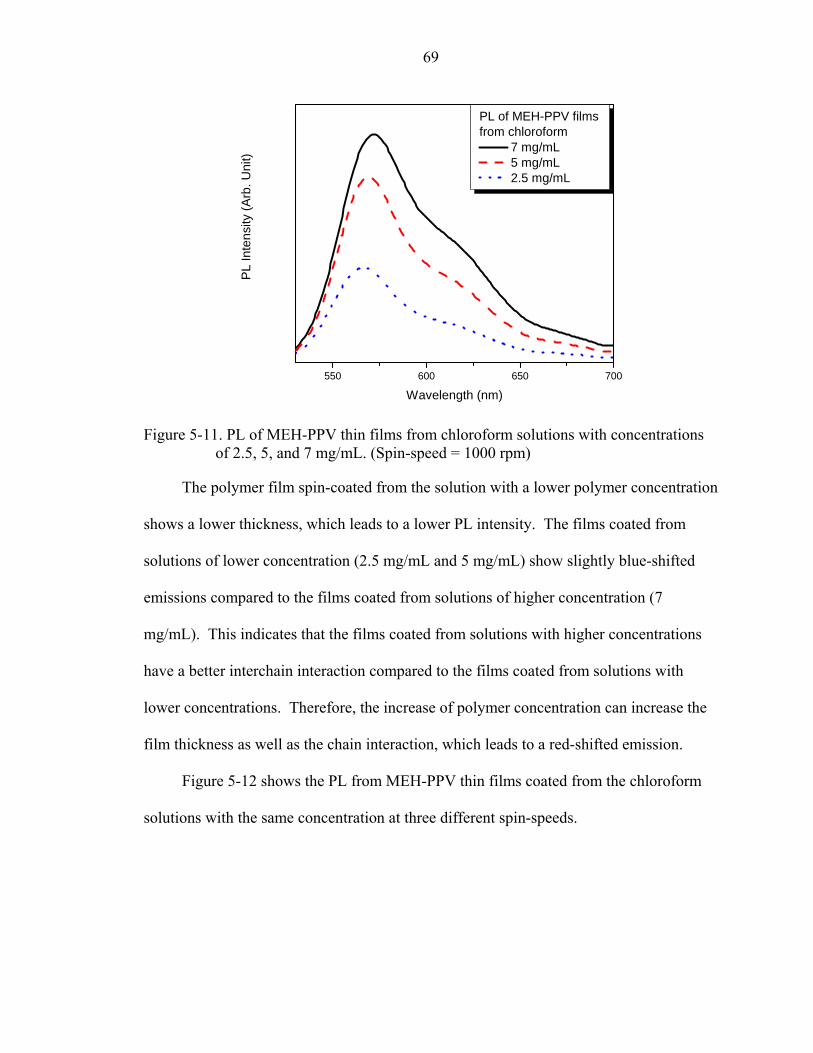
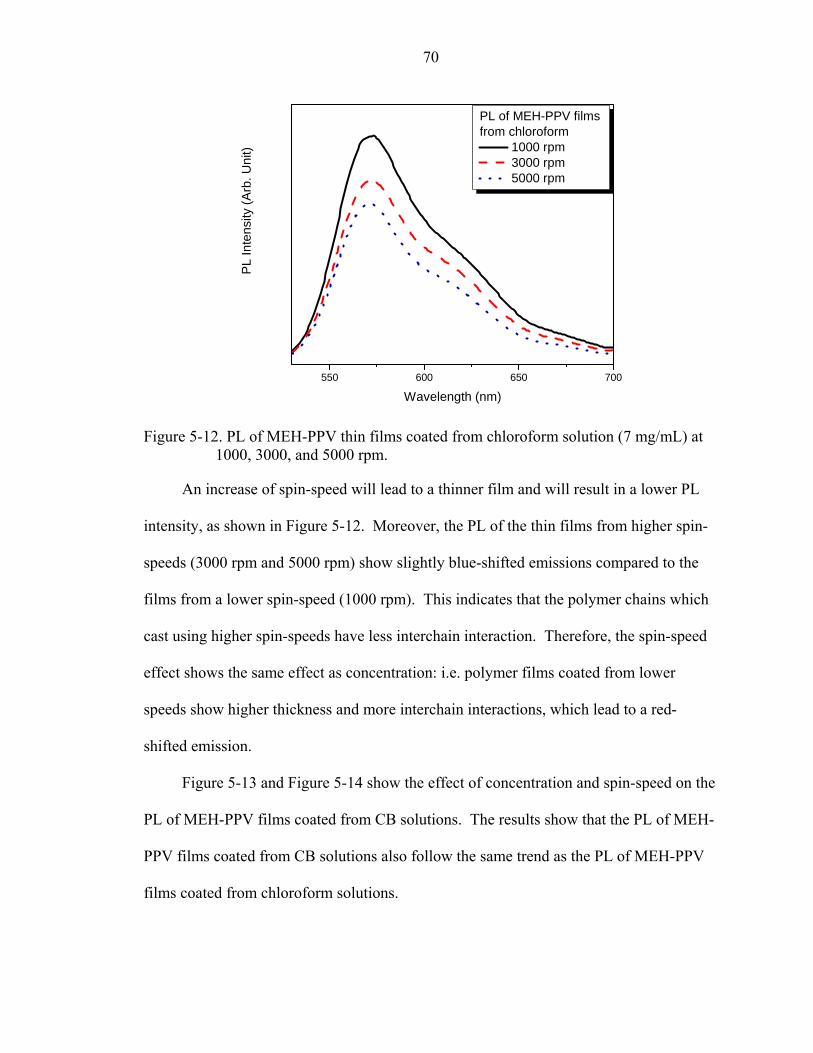
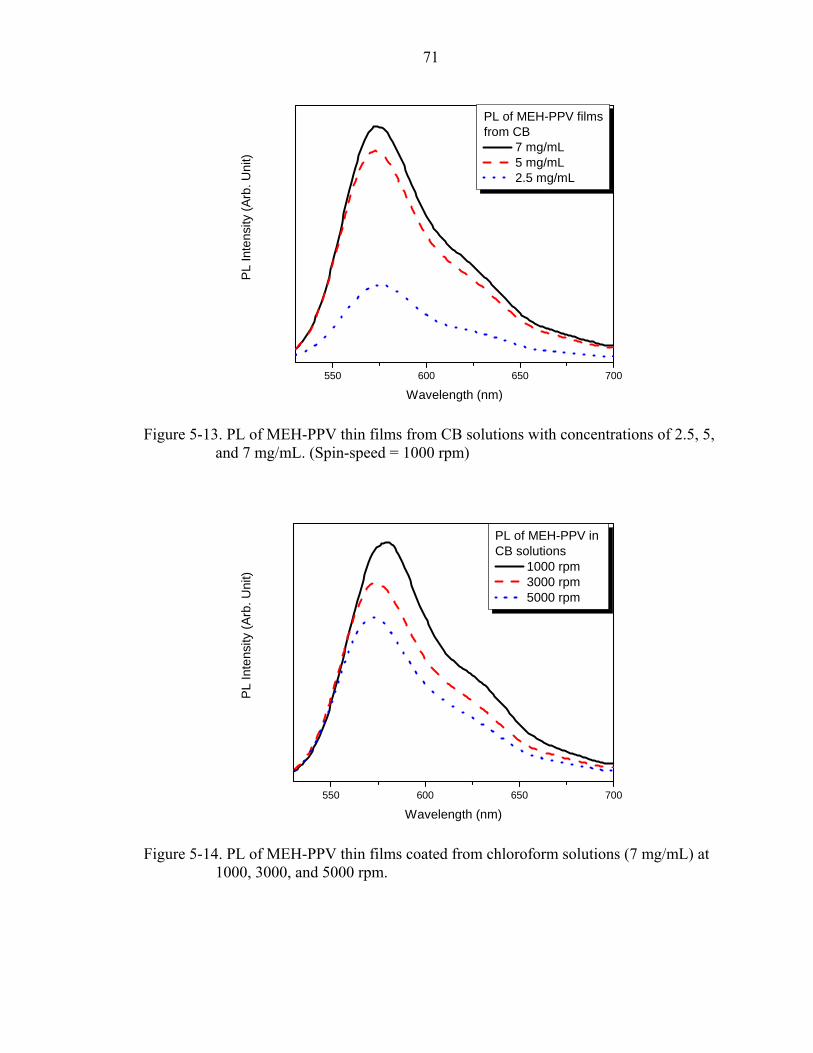
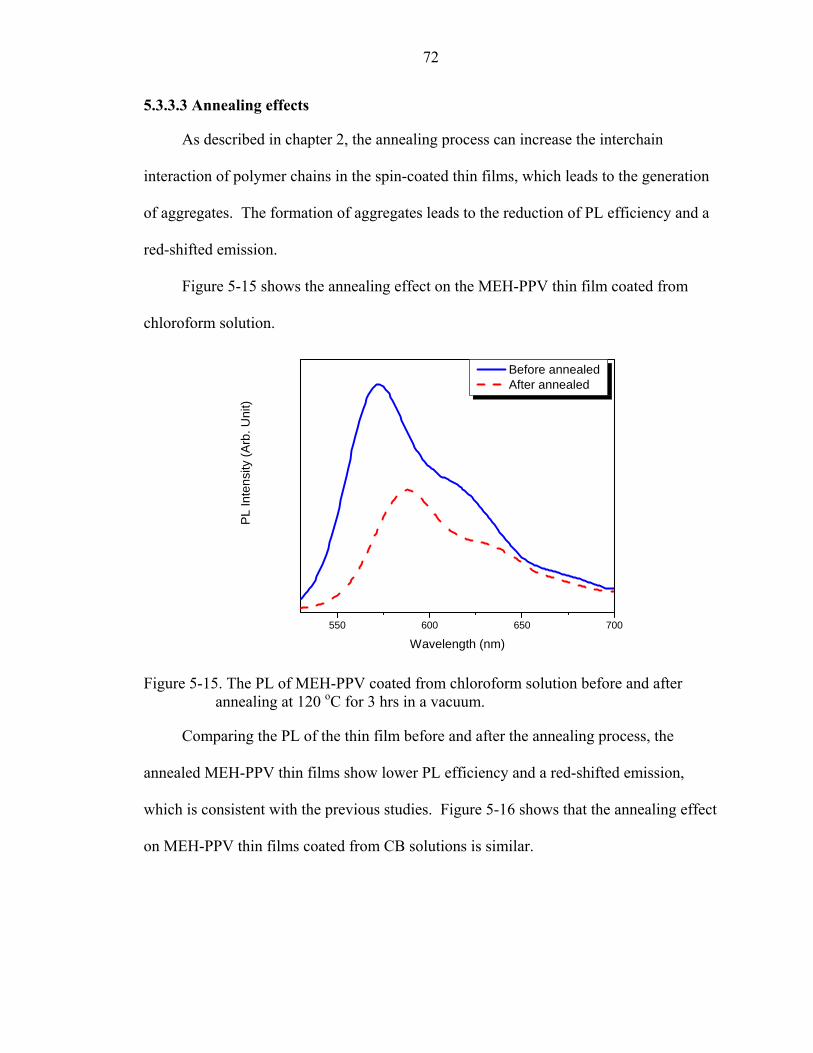
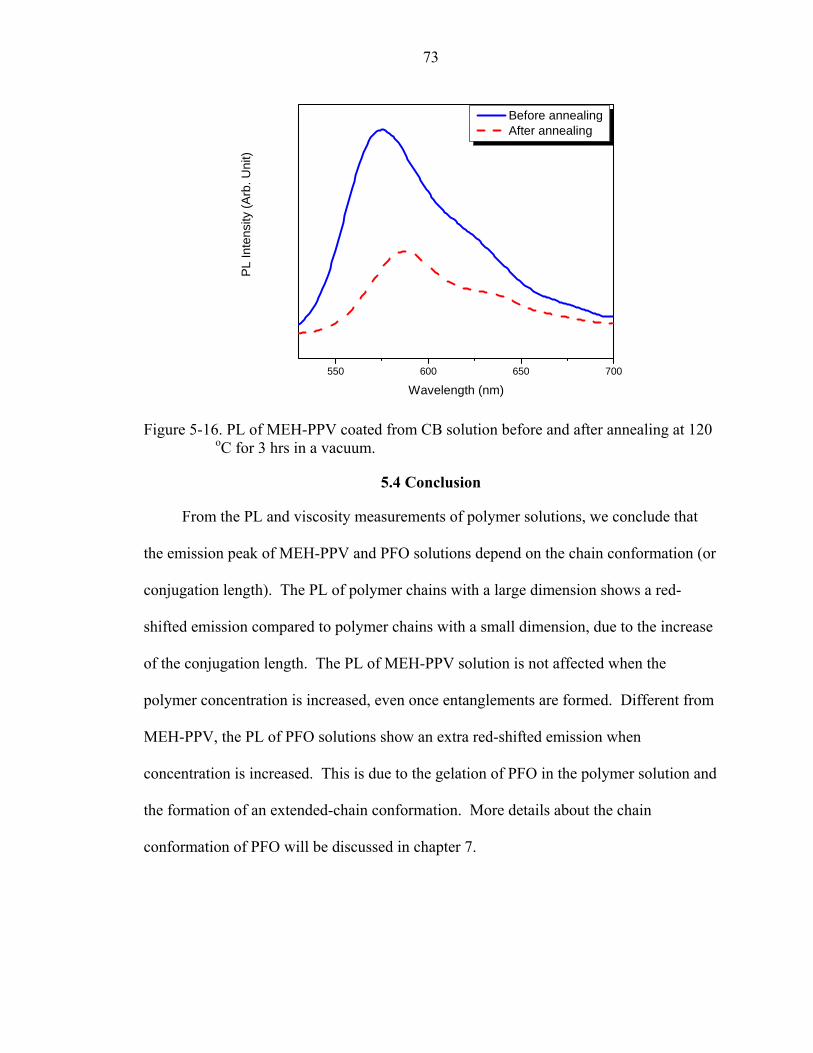
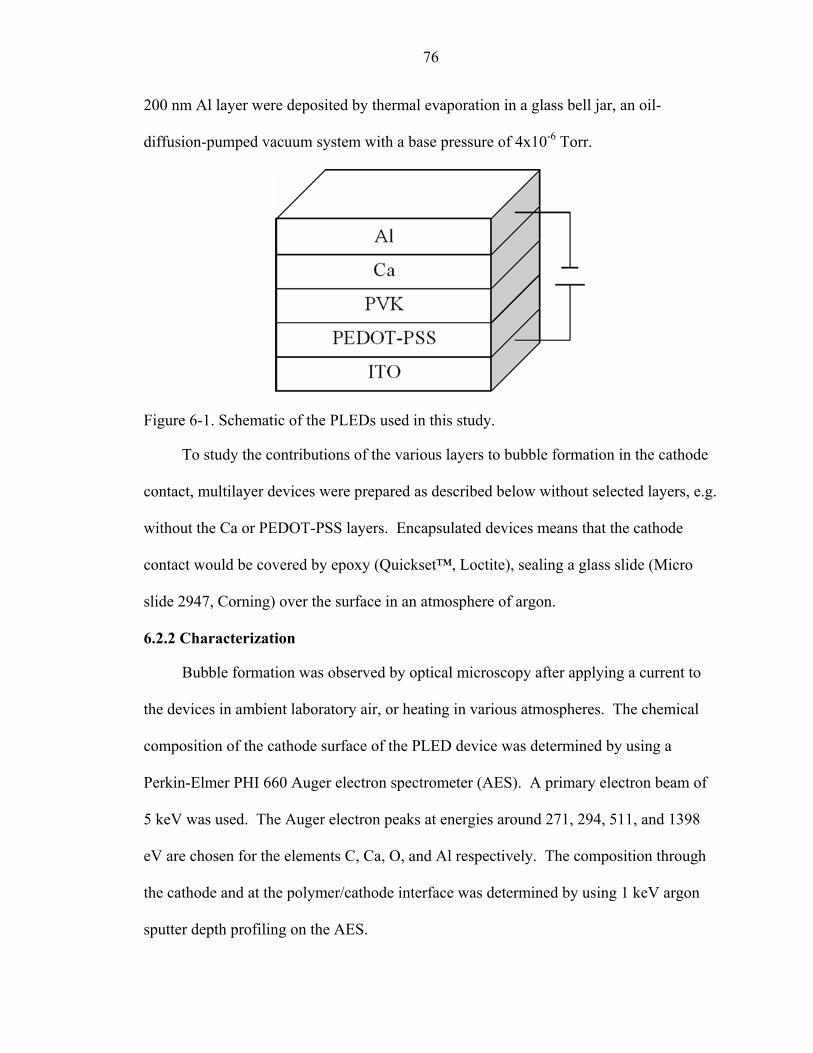
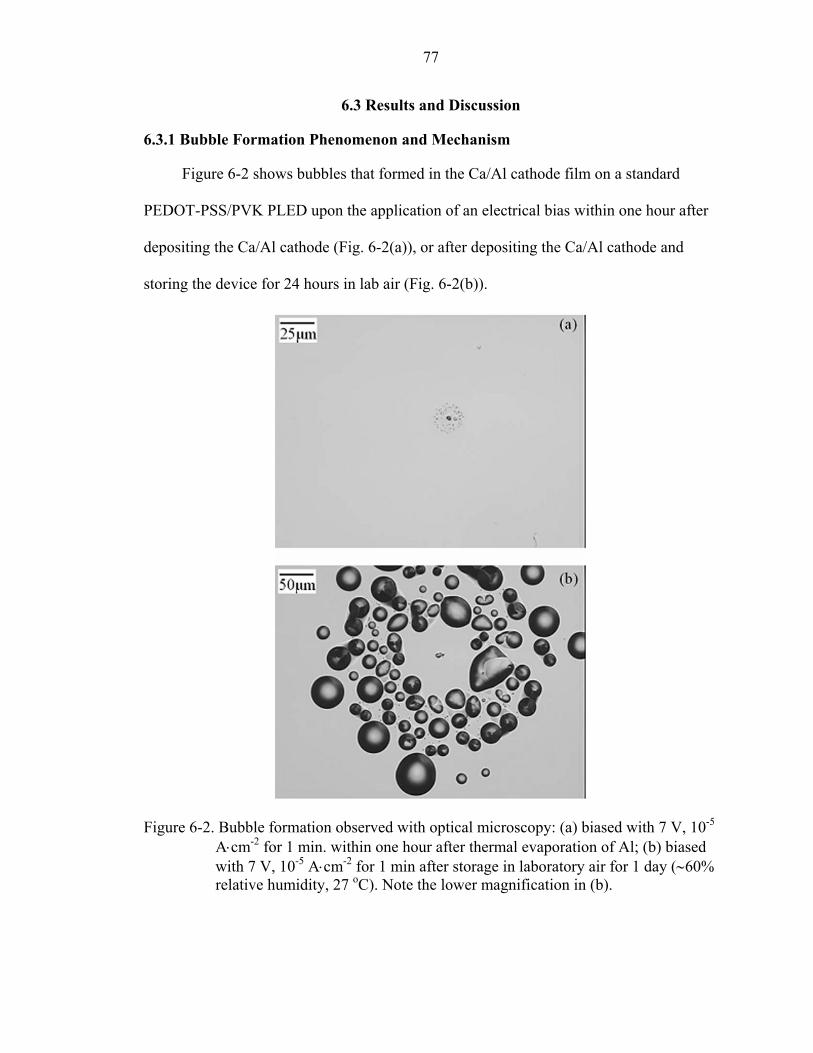
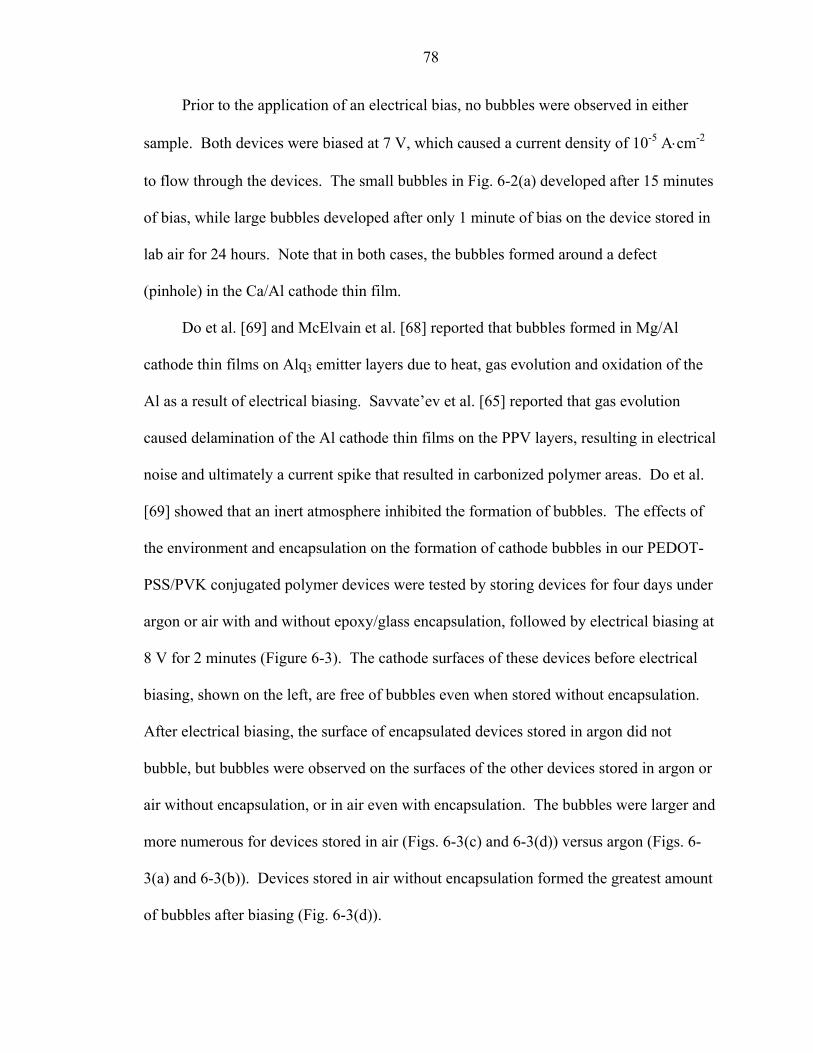
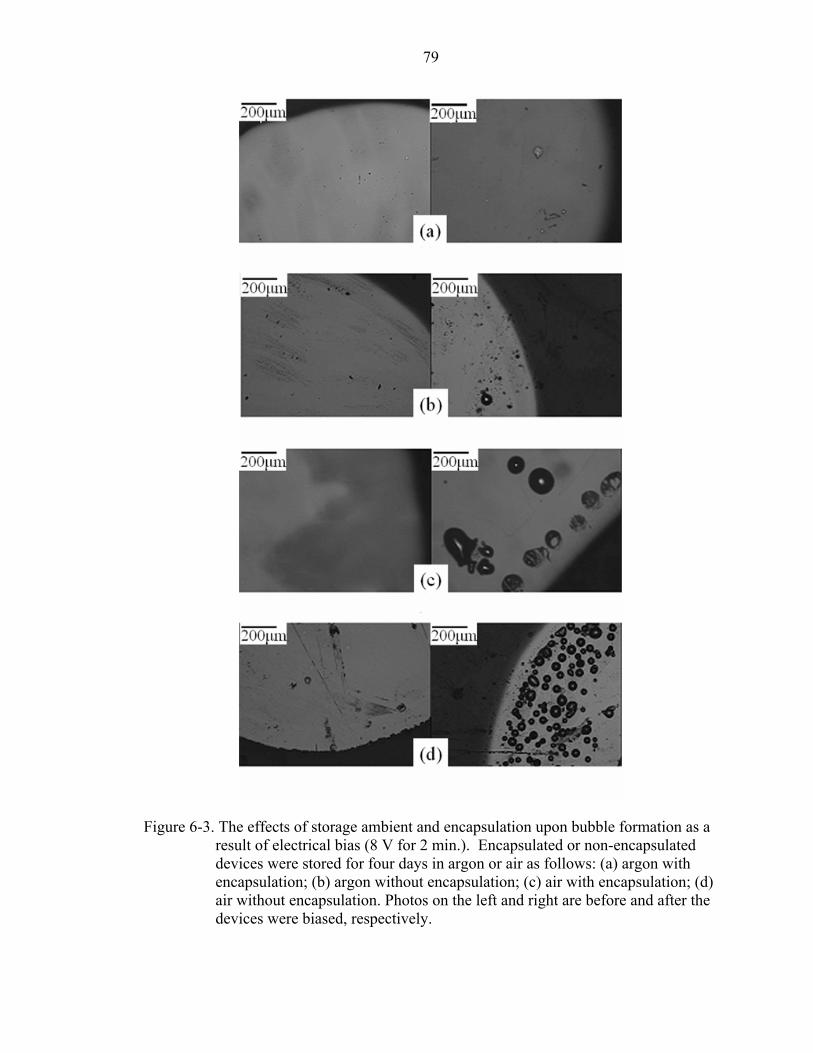
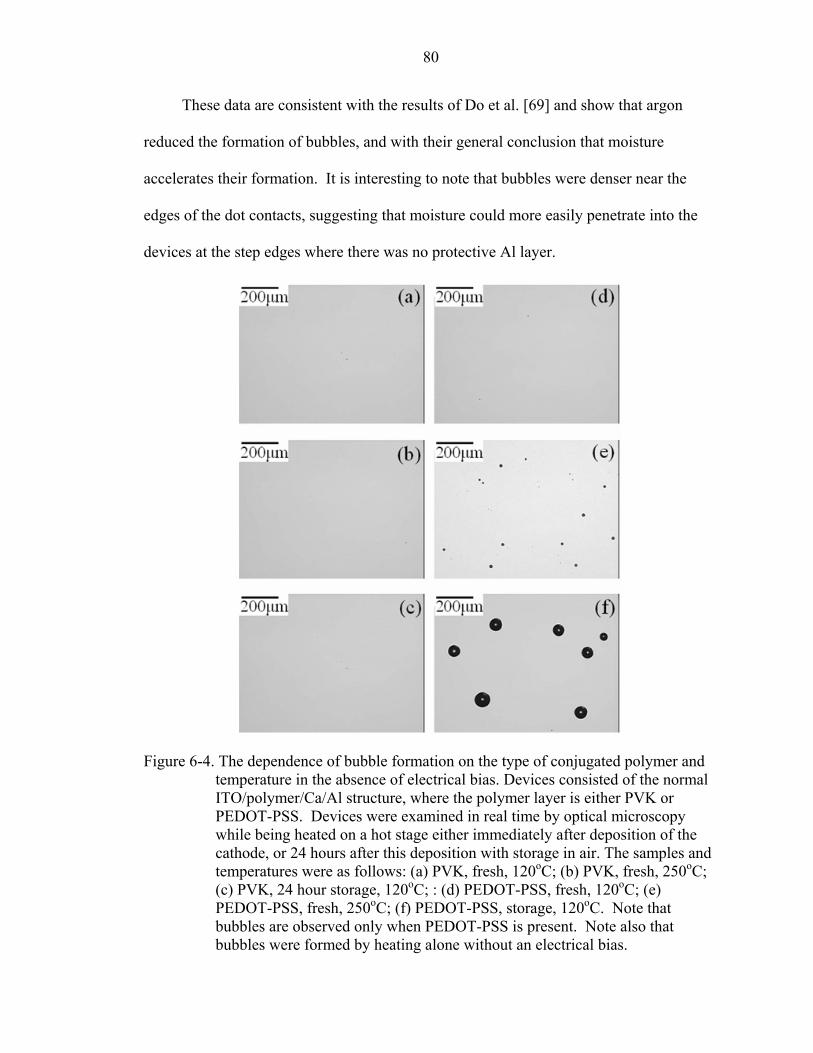
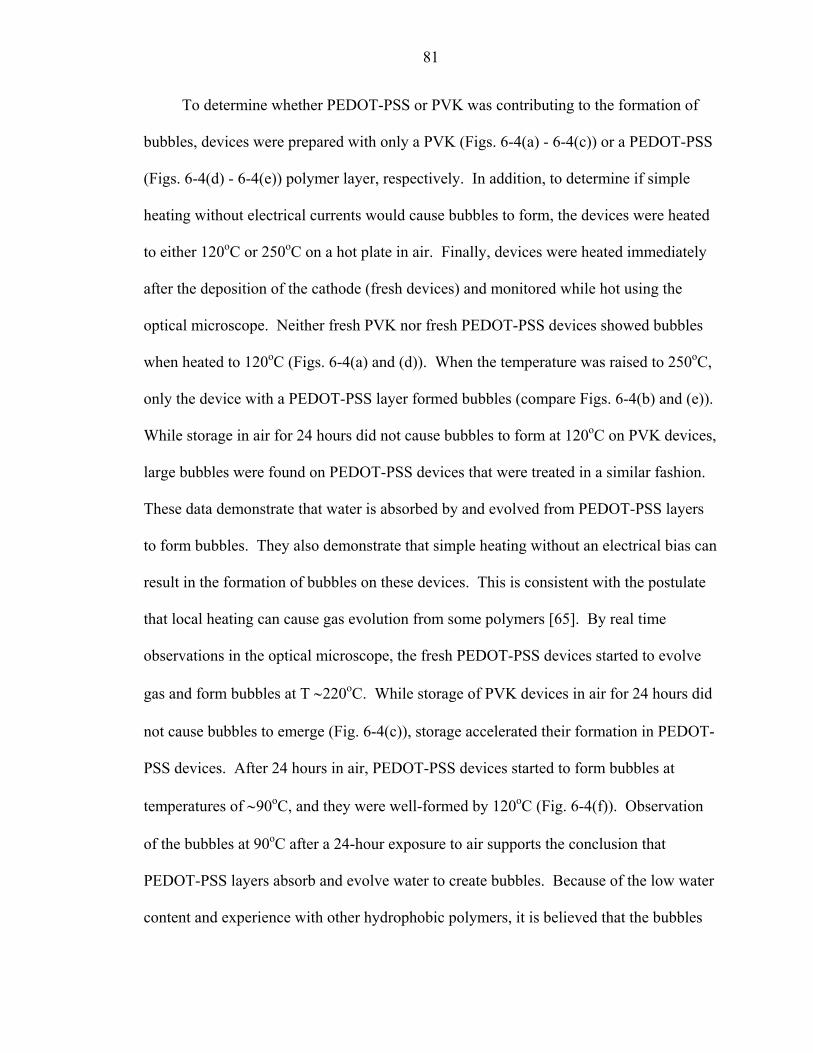
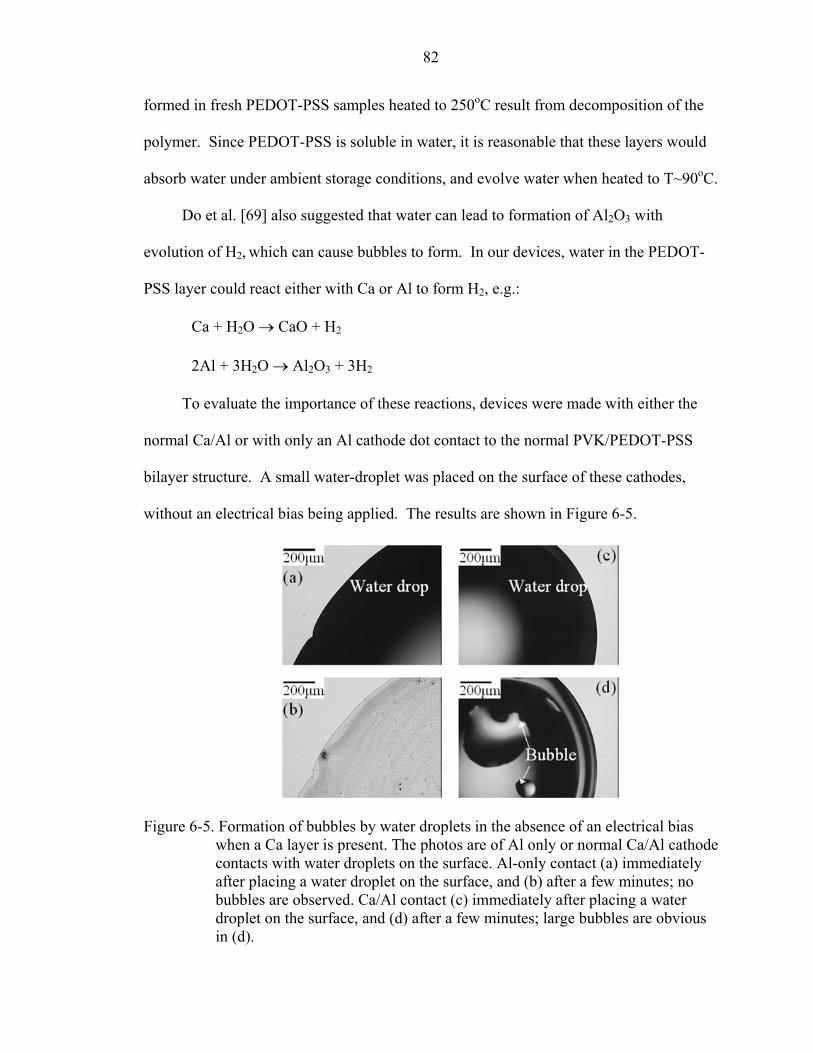
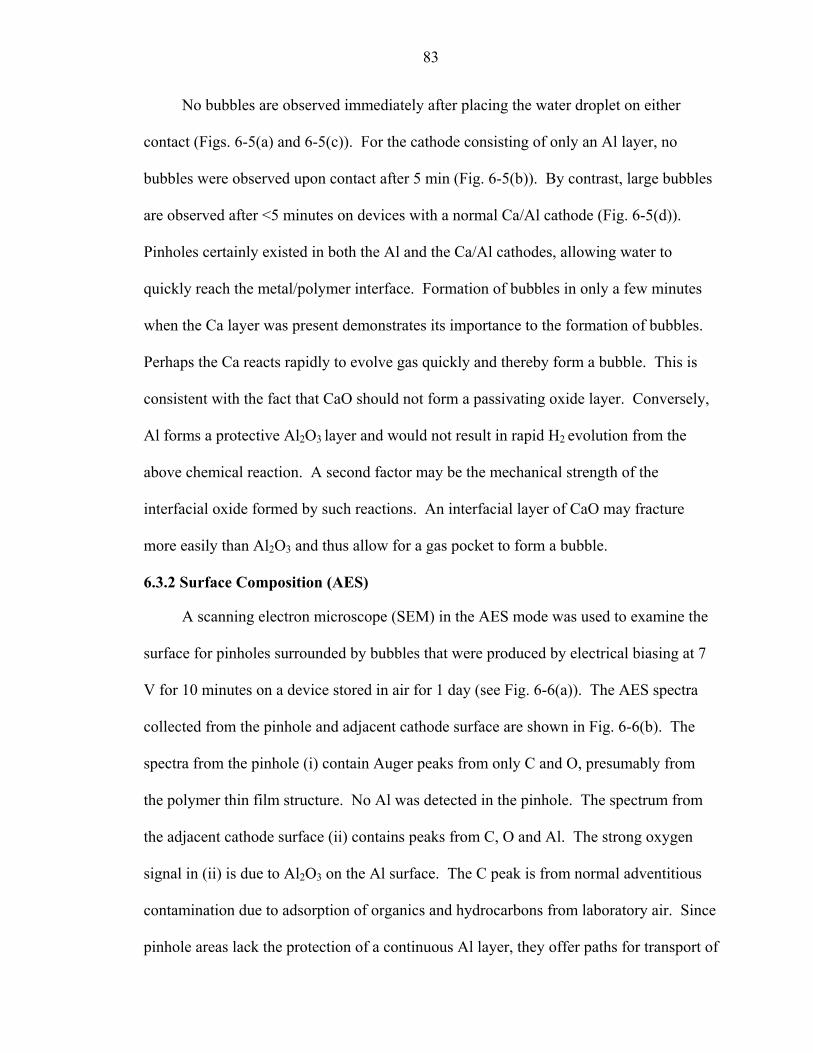
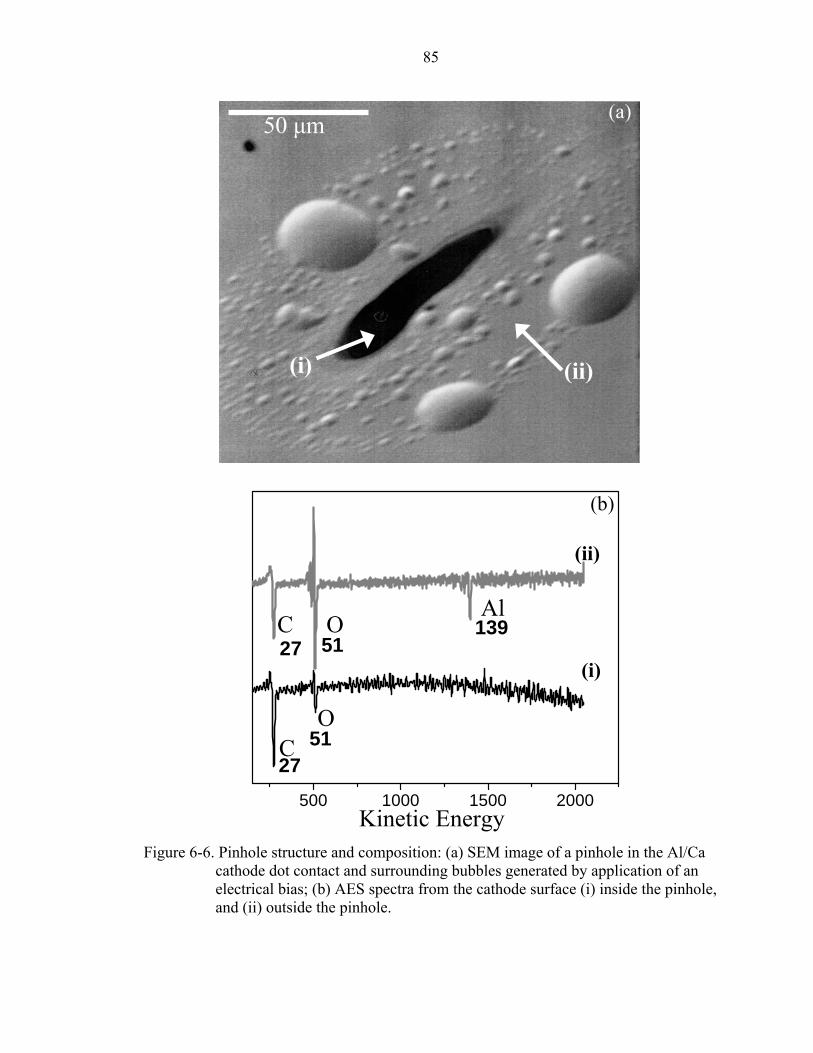
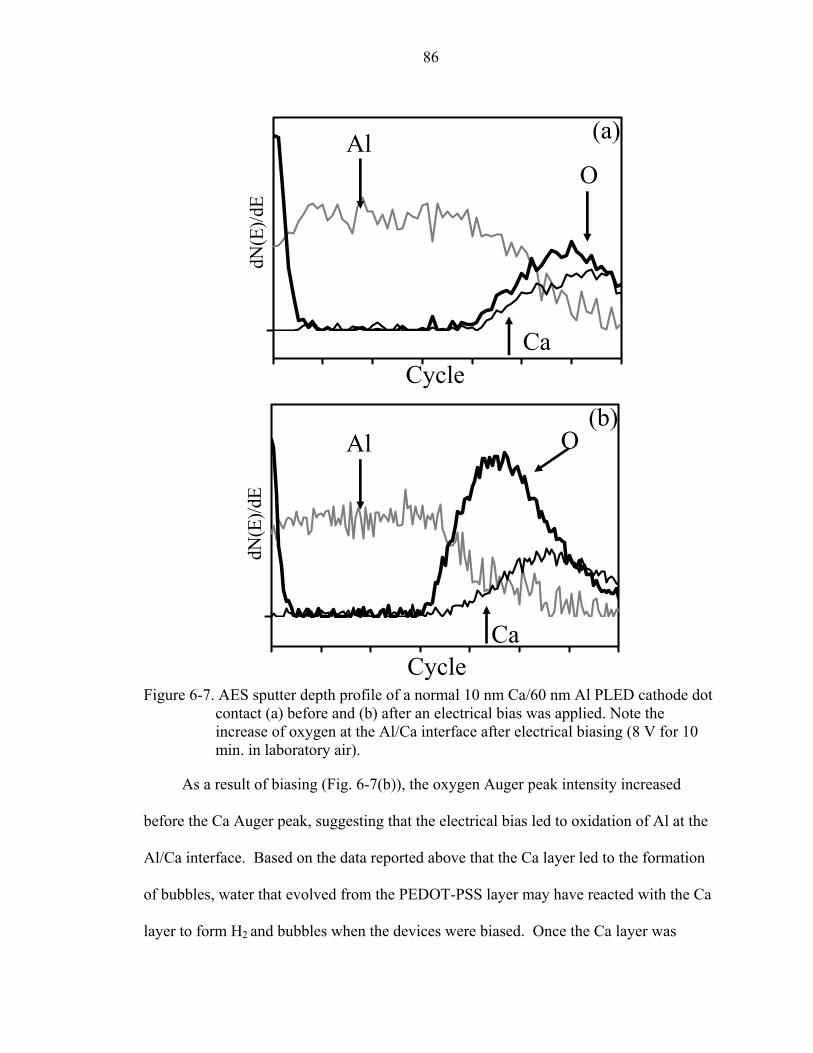
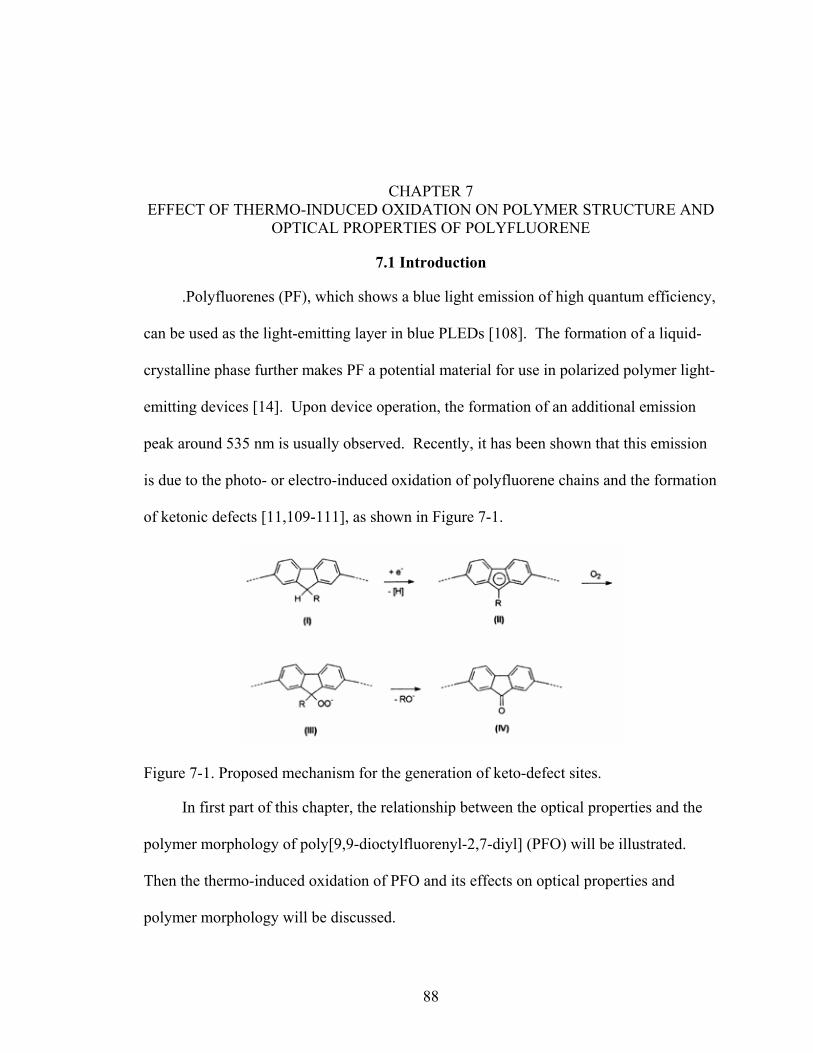
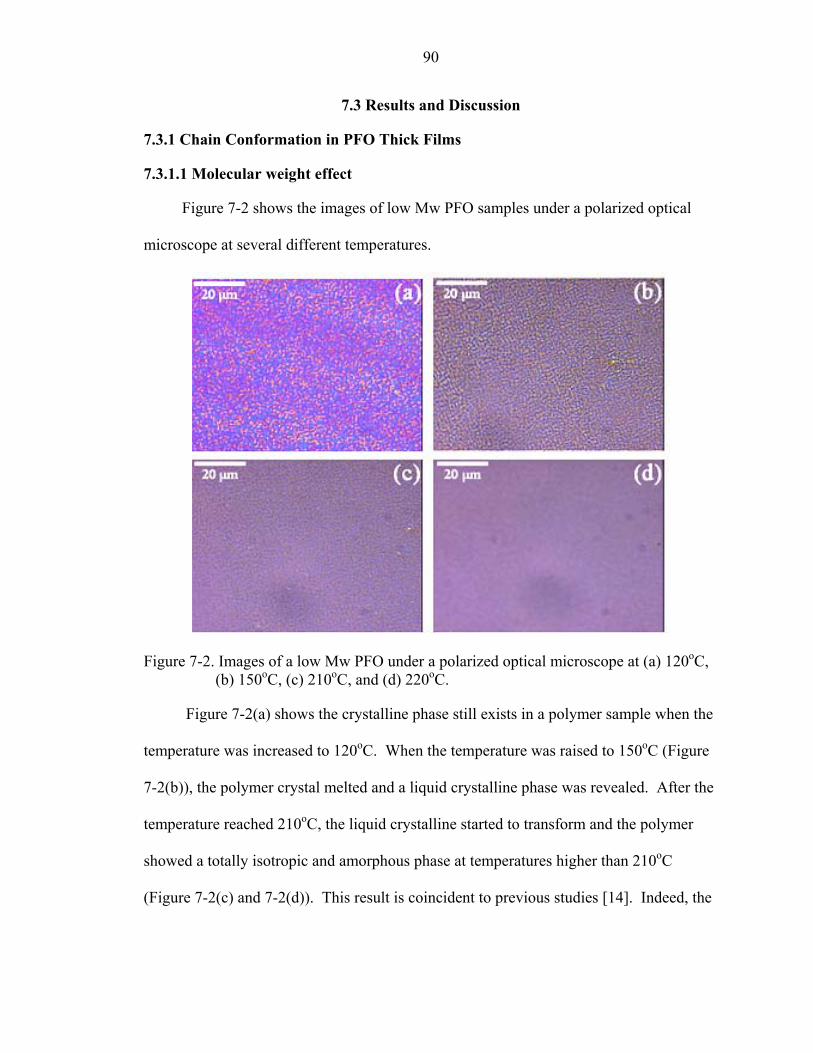
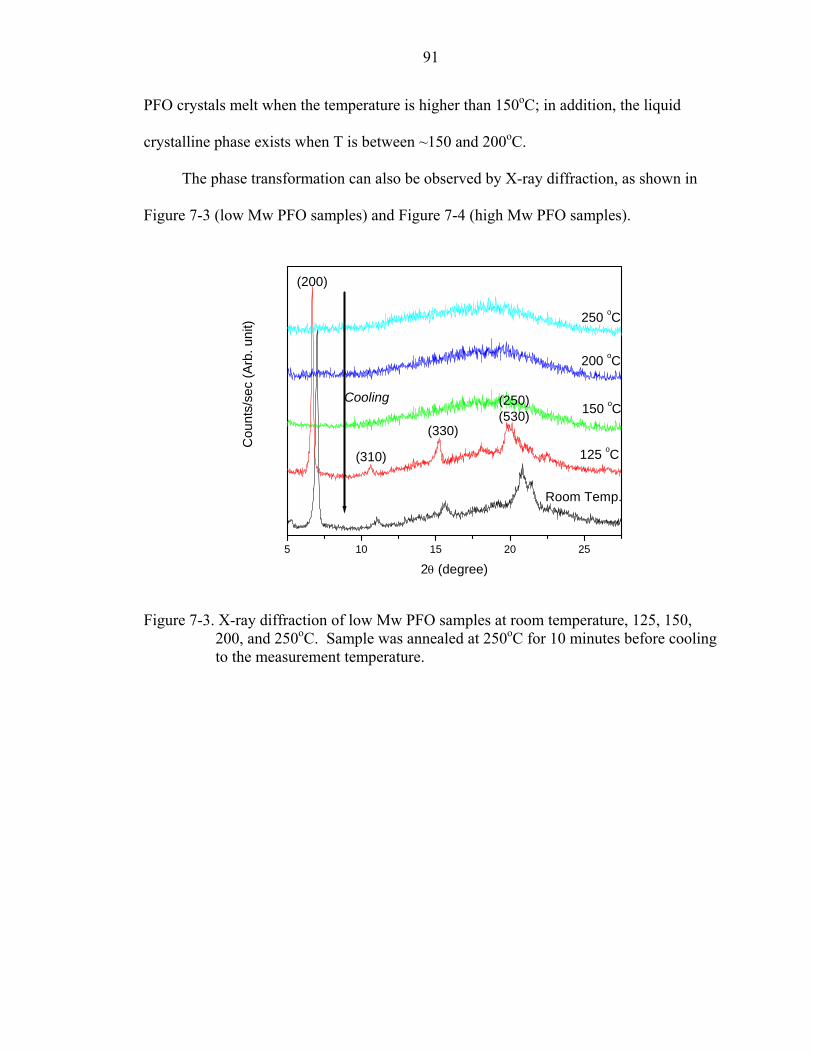
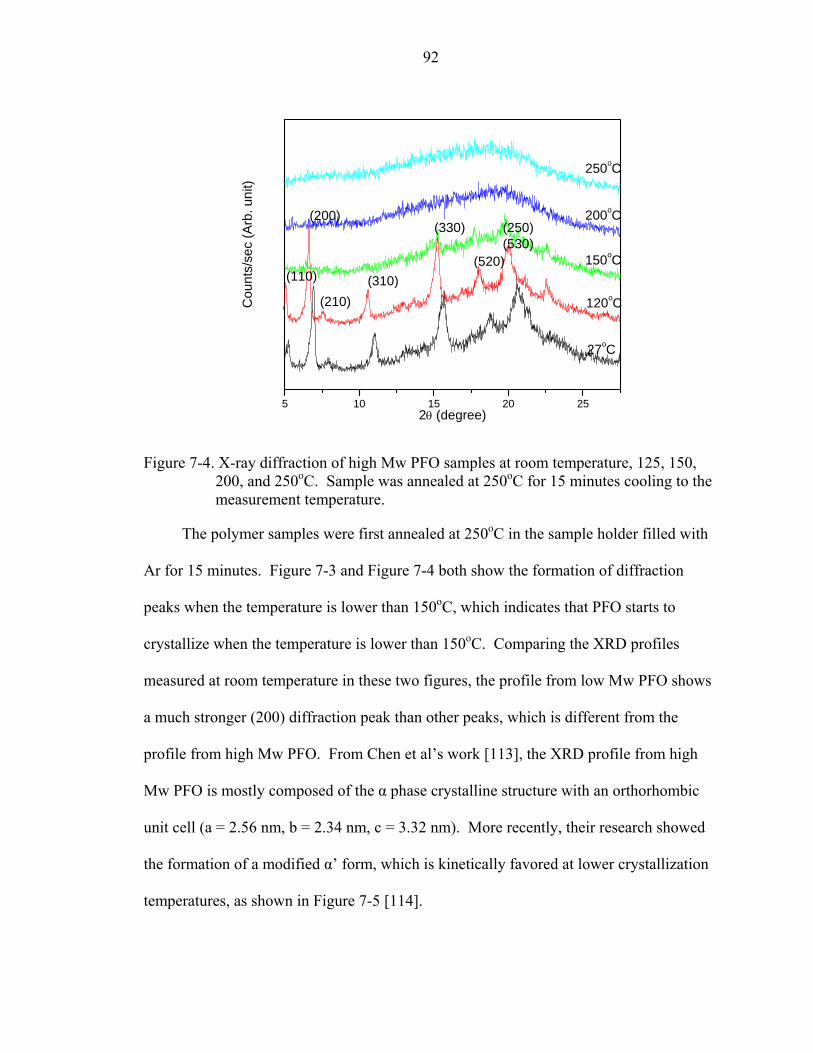
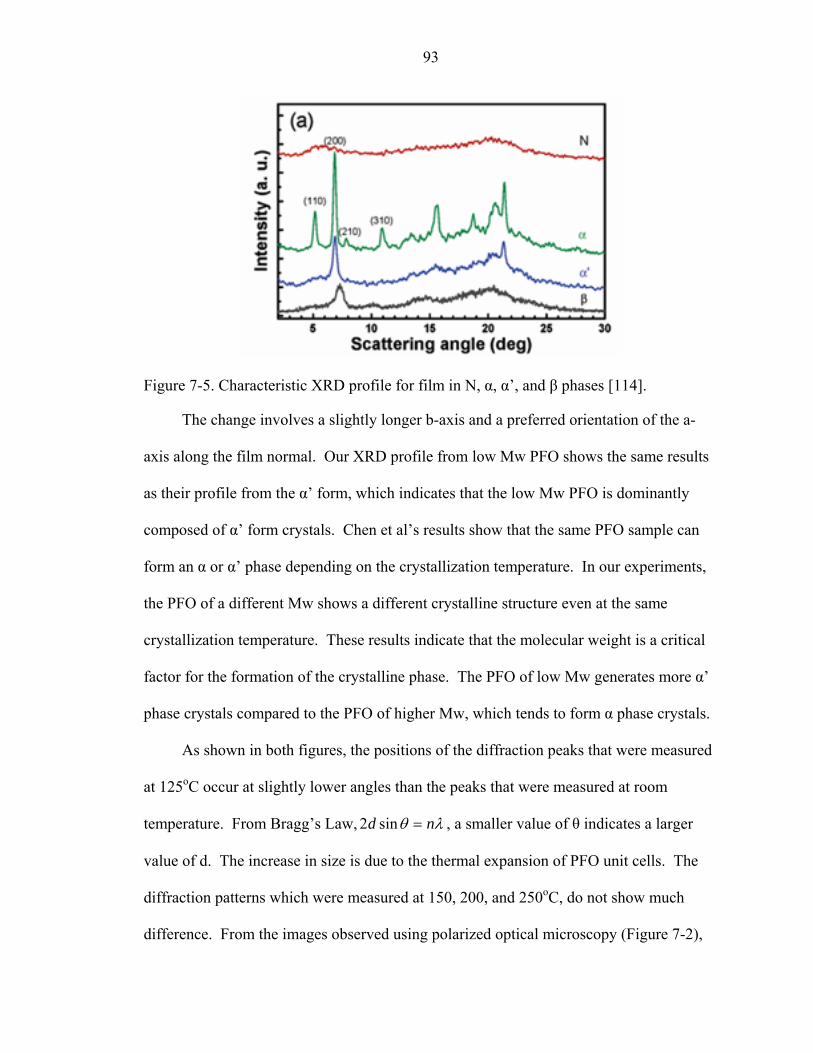
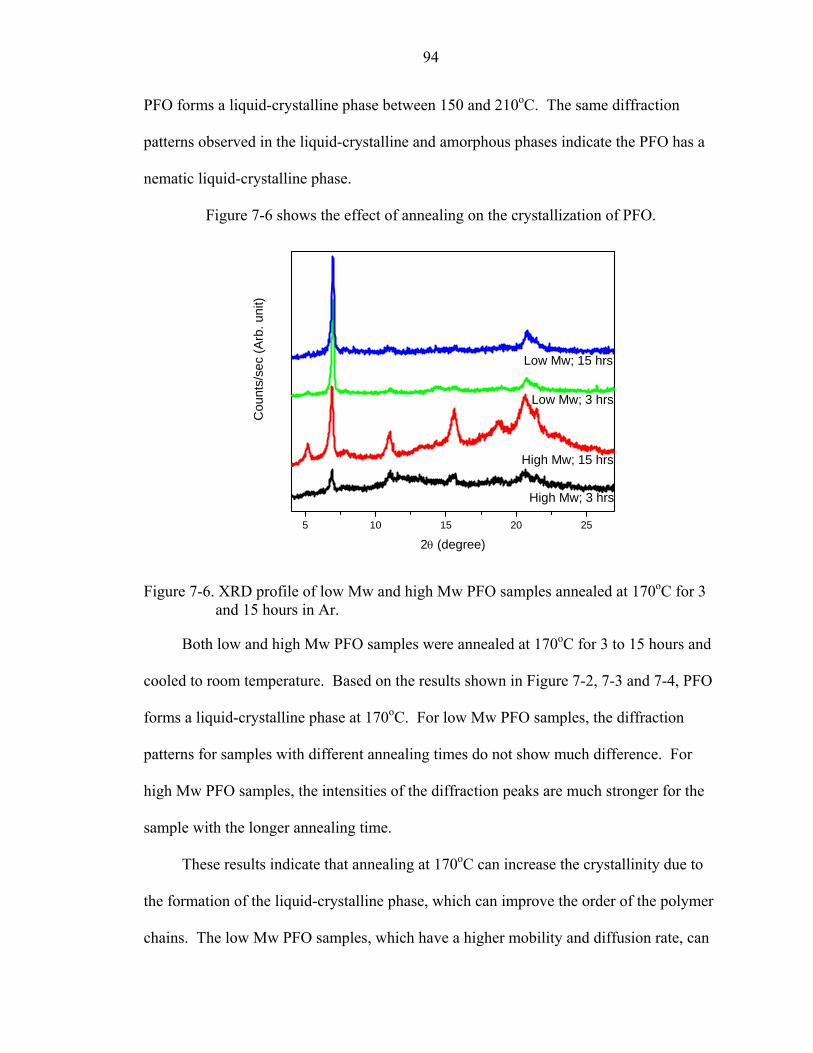
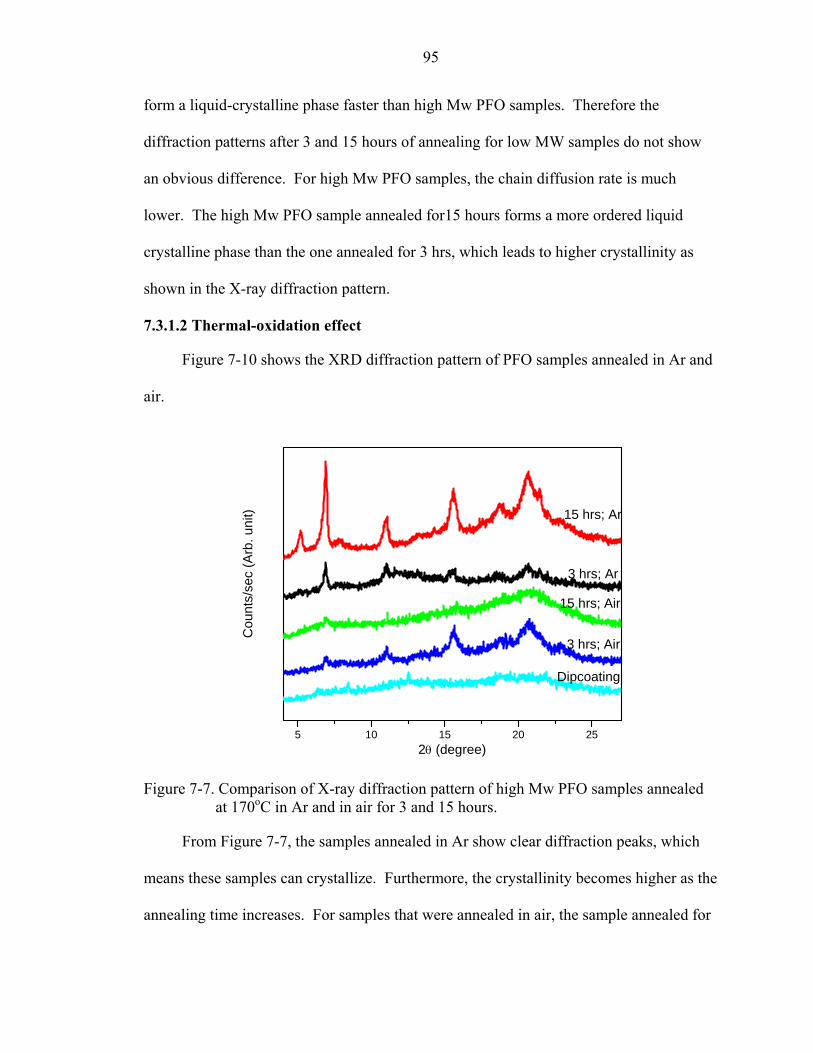
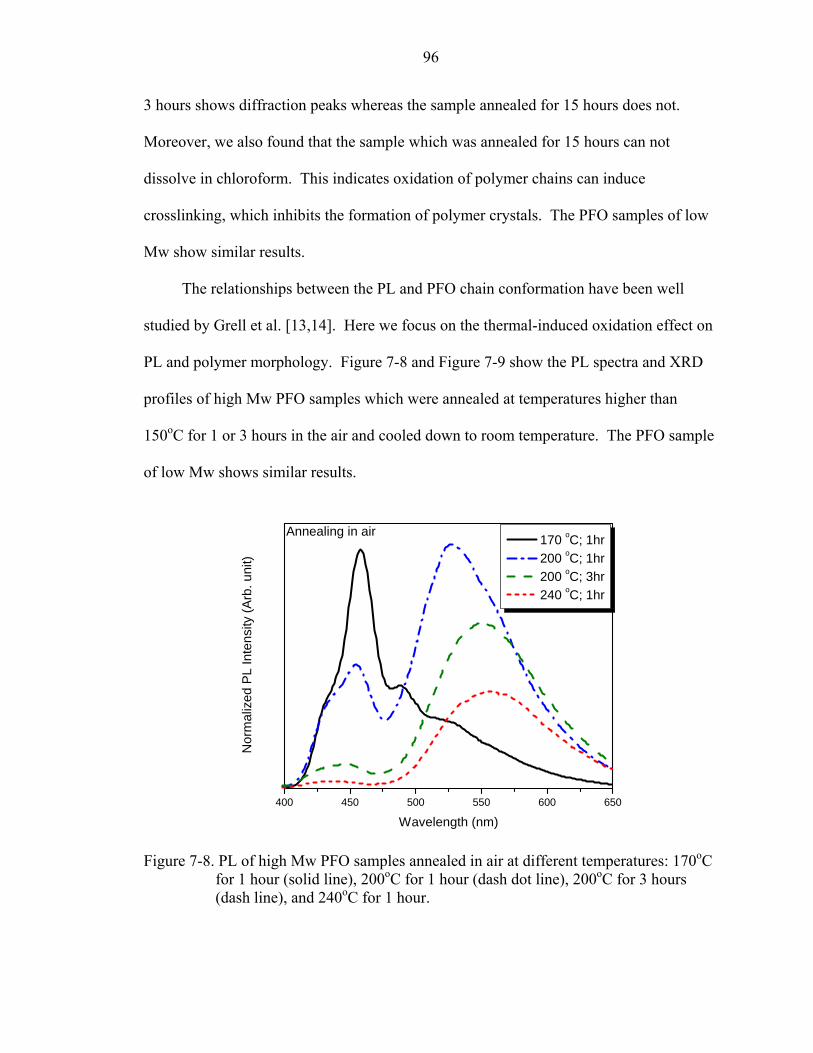
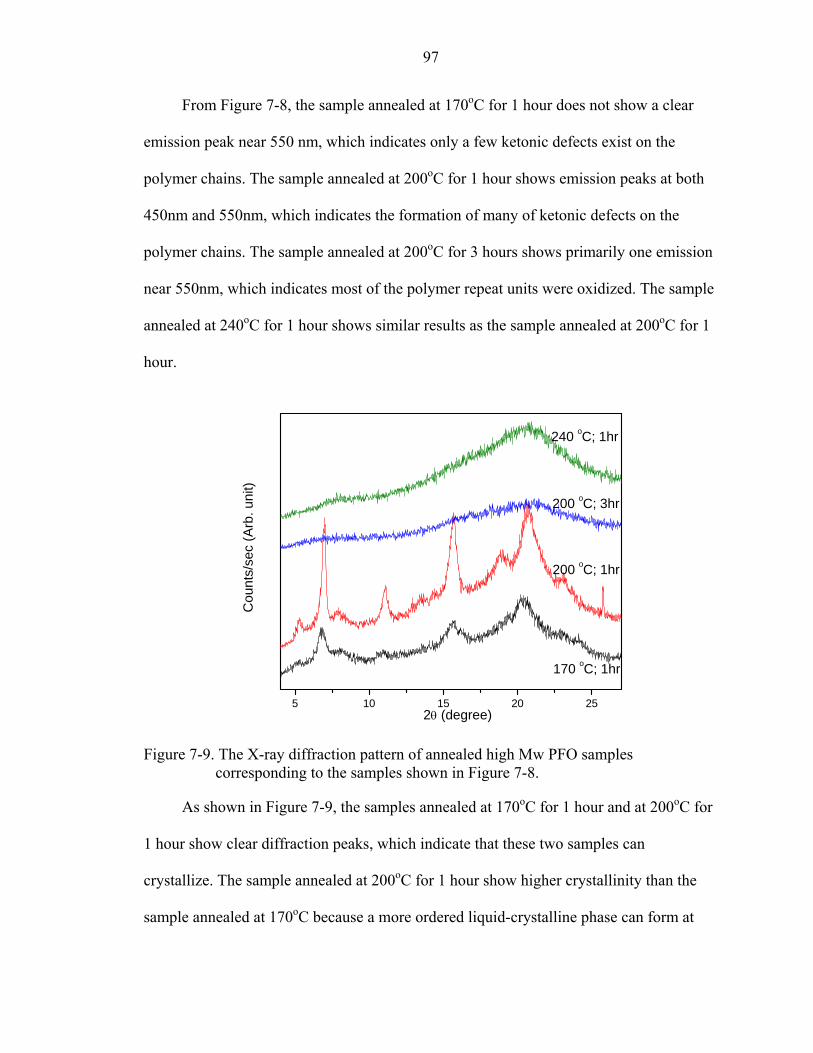
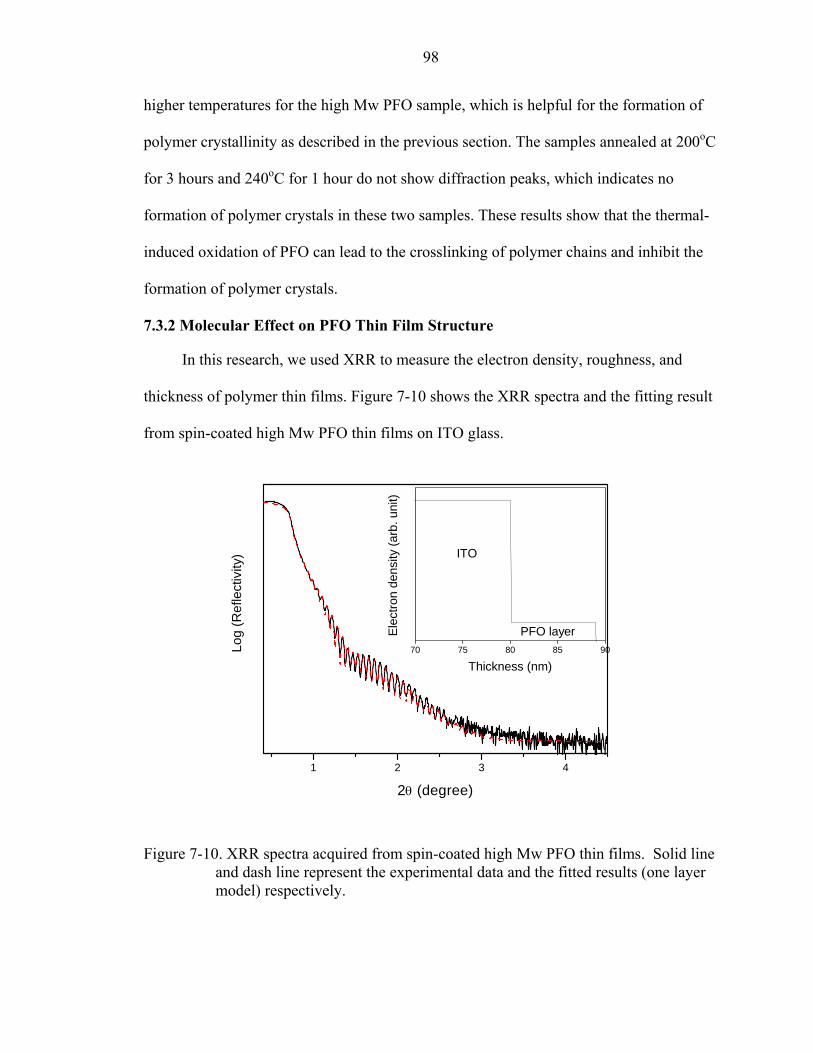
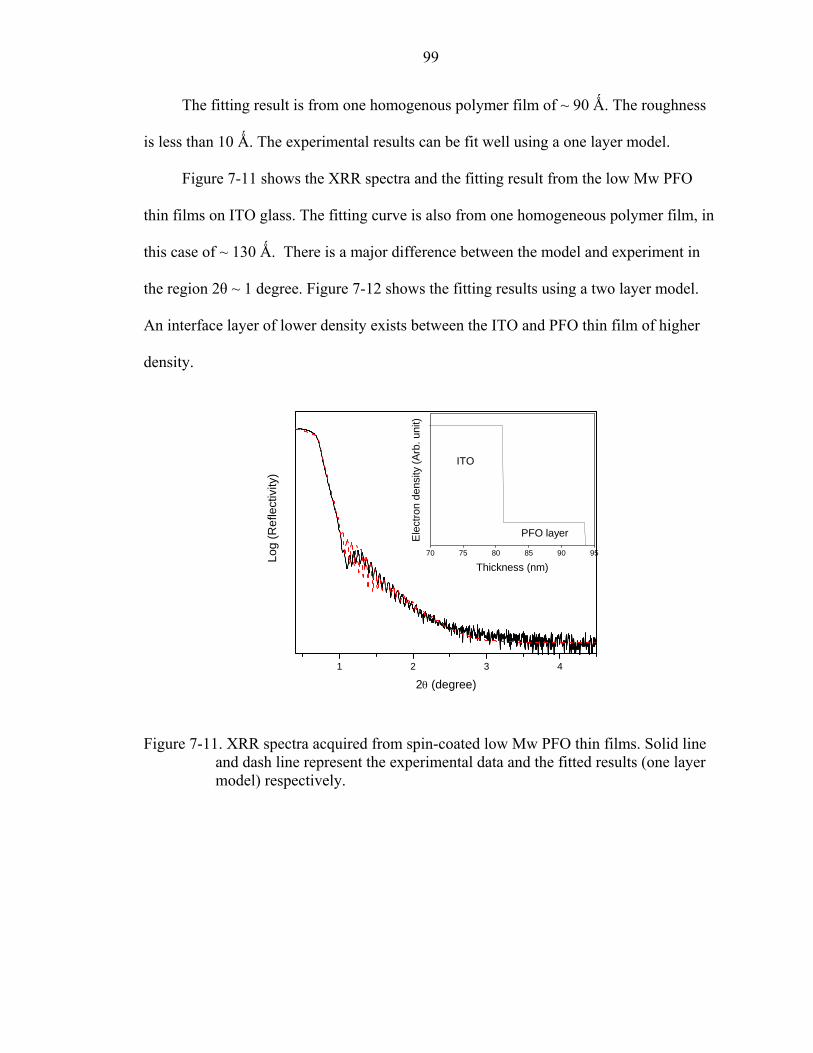
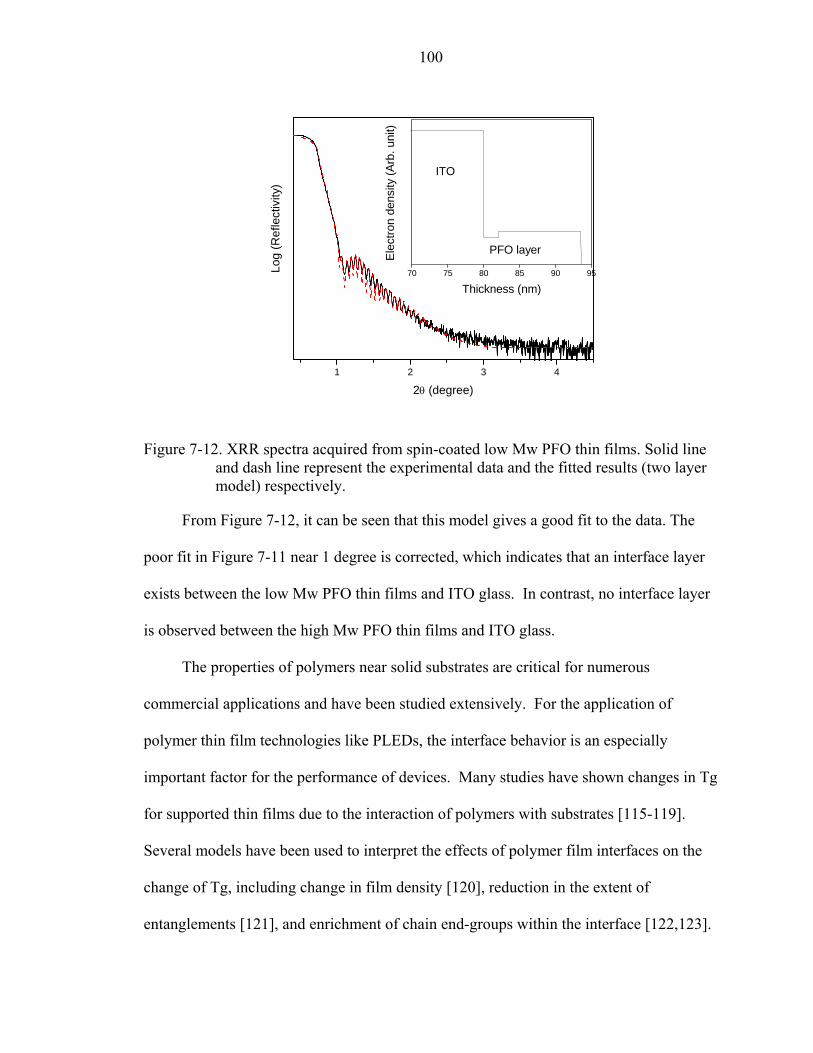
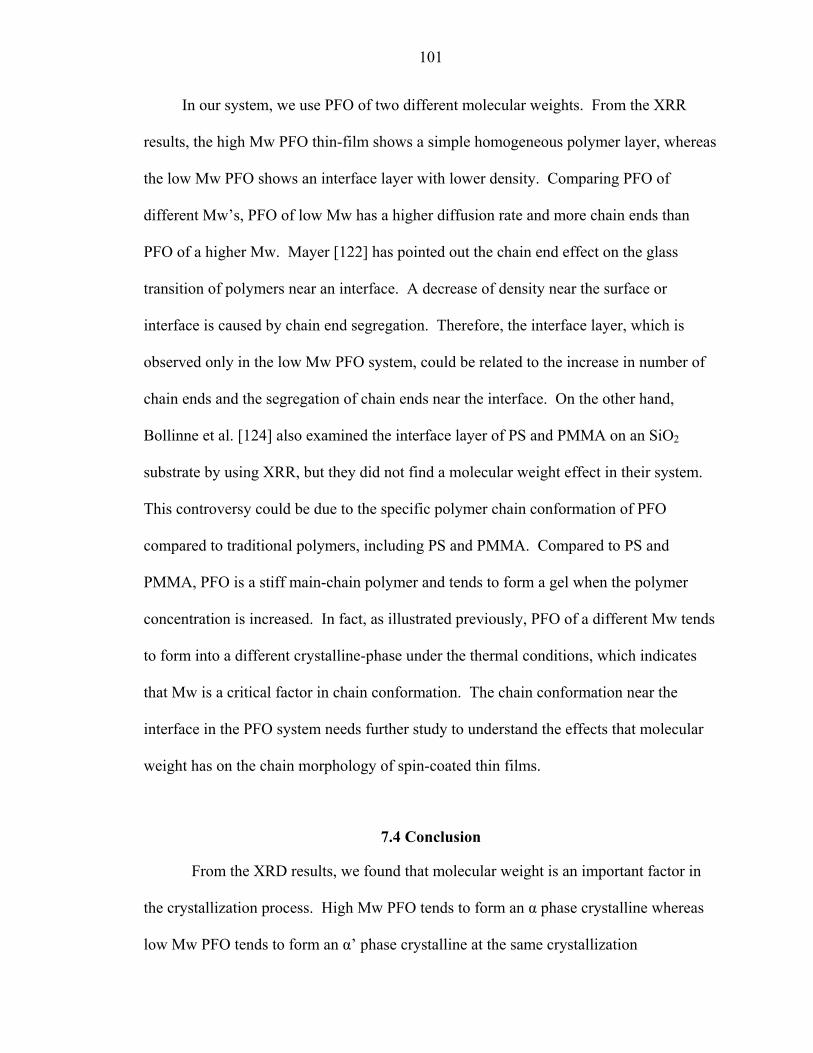
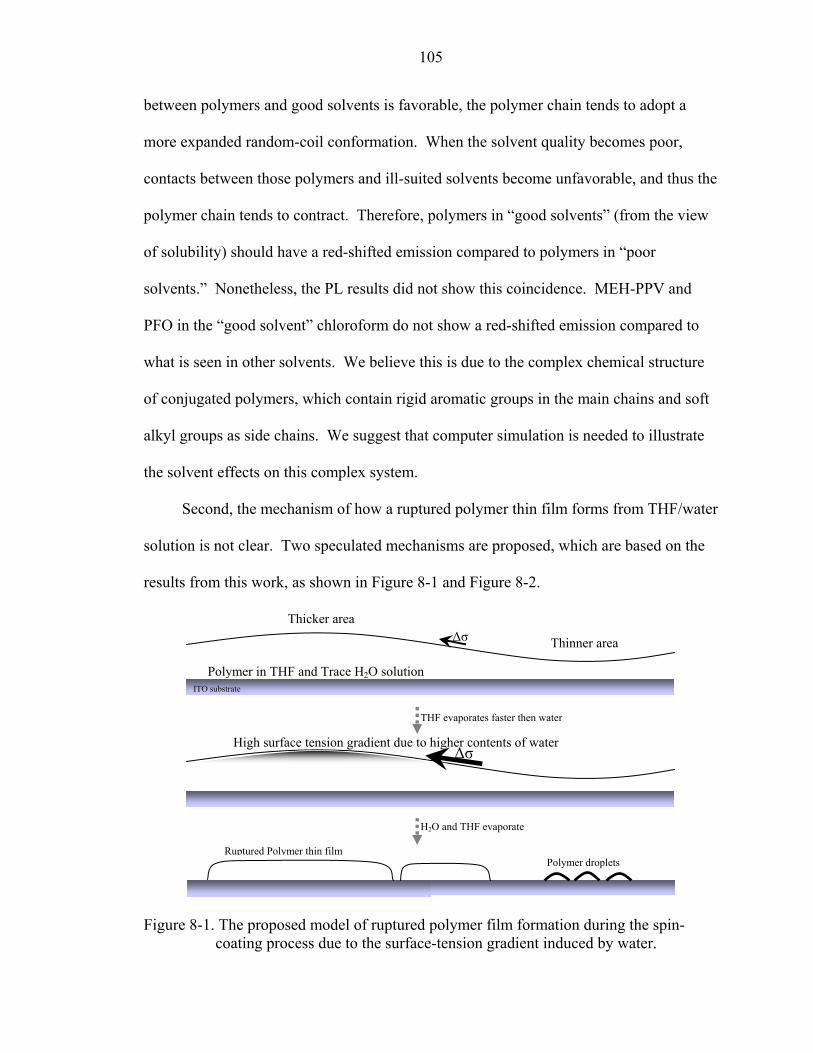
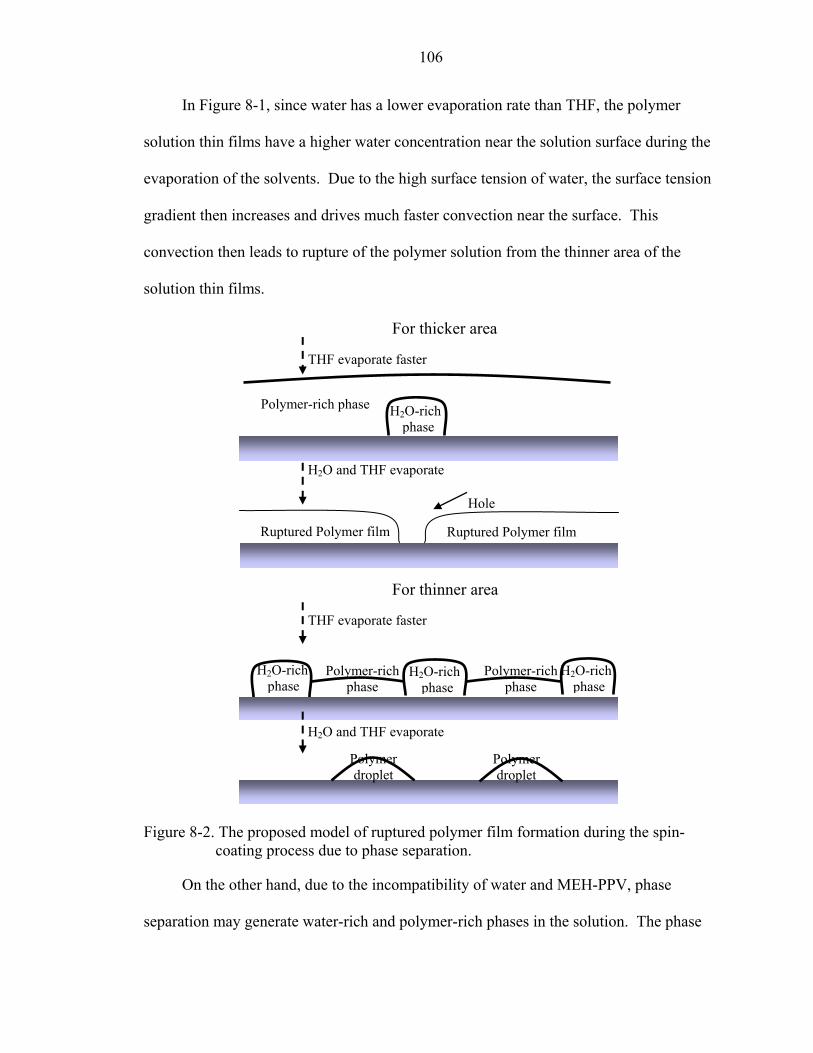


![Review Article Edible Polymers: Challenges and OpportunitiesJournal of Polymers T : Water vapor permeability (WVP) properties of di erent polymers [ ]. Film formulation WVP (gm 1s](https://static.documents.pub/doc/80x56/60ac9618de1e6c714e72a8c9/review-article-edible-polymers-challenges-and-opportunities-journal-of-polymers.jpg)


