JOURNAL OF THE OPTICAL SOCIETY OF AMERICA Behavior of the dc Iron Arc and Its Usefulness in the Determination of f Values RAY HEFFERLIN Southern Missionary College, Collegedale, Tennessee (Received December 9, 1958) Measurements of iron arc spectra have been made with Pachen-Runge spectrographs and a specially designed photoelectric photometer of the ac ratio type allowing continuous scanning and recording. The temperature and self-absorption present in different parts of the arc, and in the arc under different operating conditions, have been determined, and are presented for use in determining which lines are self-absorbed under given conditions. Some unexplained mechanism in the arc causes deviation from equilibrium values of the intensities of all lines within multiplet 68. This mechanism does not operate in the furnace. Corrected values are given for some f values given in the literature. Additional measurements of the arc are now under way for the calculation of high-excitation f values. INTRODUCTION THIS experiment was undertaken to explore the feasibility of using the dc iron arc as a source of excitation for the measurement of high-excitation f values (actually, gf values) in the neutral iron spectrum. Values of the excitation temperature of the arc and the effects of self-absorption of lines in the arc, over a range of currents and pressures and in several parts of the arc, were desired. Measurement of f values of some high-excitation lines was made photographically by King' and photo- electrically by Carter, 2 both of whom produced an emission spectrum of iron in a furnace. The f values for lines of higher excitation are very much desired, and phenomena such as the odd-even effect found by Carter jeopardize attempts to determine f values from astro- physical curves of growth. The arc contains higher excitation lines than the furnace, and hence was chosen as the subject of this experiment. Crosswhite 3 has undertaken a study of the iron arc in relation to its use as an intensity standard in spectro- chemistry. The intensities of 1000 lines were measured using two photocells and a specially designed ratio- recorder. Data are given regarding the variation of intensity with excitation, and regarding self-absorption. A photoelectric ratio circuit was designed for this experiment. Between 3600 A and 5500 A, there are 106 lines of known f values, measured by King and Carter, whose intensities were measured with this instrument. These lines represent transitions between a large number of states, belonging to multiplets 1 up through 800. THEORY The intensity, lo, in watts/sec- sterad, of a spectrum line emitted by the electronic transition from state n to state m, in an optically thin layer of an incandescent gas in thermodynamic equilibrium is Io= Cno 3 gnfnm exp(- En/kT), 'R. B. King, Astrophys. J. 95, 78 (1942). 2 W. W. Carter, Phys. Rev. 76, 962 (1949). 3 H. M. Crosswhite, Spectrochim. Acta 4, 122 (1950). where v is the frequency, no is the number density of atoms in the ground state, gn is the statistical weight of the state whose energy is E., T is the temperature of the ensemble, C is a constant, and f m , referred to as the f value," is proportional to the probability that an electron in state n will make the transition to state m in unit time and to the matrix element of the transition. 4 - 6 A spectrum line emitted by a "thick" source exhibits the phenomena of self-absorption, so that its total resulting intensity I is no longer lo but is a complicated function of Io called (using logarithms) the "curve of growth." 78 Self-absorption is the saturation which would occur in spectrum lines emitted by homogenous source, as the intensity per frequency interval of the line approaches the blackbody "ceiling," B(T). If spectrum lines from any given multiplet are exhibited in a plot of logl/Io against logIo, the resulting curve is horizontal until, when lo is large, self-absorption sets in and the curve drops downward. A detailed prediction of the phenomenon was made by Cowan and Dieke. 9 In principle this experiment uses lines of known f values to determine the extent to which measurements of other line intensities might be used to find high excitation f values. APPARATUS Initial measurements were made on a horizontal 5-m Paschen-Runge spectrograph at the California Insti- tute of Technology. Two photocell units were con- structed for use in an ac ratio circuit. Each unit con- tained a voltage divider for the photomultiplier and a preamplifier is a shielded chassis. Each unit, together with a slit, was mounted on a carriage, which rolled 4 F. K. Richtmeyer and E. H. Kennard, Introduction to Modern Physics (McGraw-Hill Book Company, Inc., New York, 1947). 5 F. A. Jenkins and H. E. White, Fundamentals of Physical Optics (McGraw-Hill Book Company, Inc., New York, 1937), pp. 36-37. 6 A. C. G. Mitchell and M. W. Zemansky, Resonance Radiation and Excited Atoms (The Macmillan Company, New York, 1934). 7 A. Unsold, Z. Astrophys. 24, 306 (1948). 8 L. H. Aller, Astrophysics: the Atmosphere of the Sun and Stars (Ronald Press, New York, 1953). 9 R. D. Cowan and G. H. Dieke, Revs. Modern Phys. 20, 418 (1948). i80 VOLUME 49, NUMBER 7 JULY, 1959
Transcript
JOURNAL OF THE OPTICAL SOCIETY OF AMERICA
Behavior of the dc Iron Arc and Its Usefulness in the Determination of f Values
RAY HEFFERLINSouthern Missionary College, Collegedale, Tennessee
(Received December 9, 1958)
Measurements of iron arc spectra have been made with Pachen-Runge spectrographs and a speciallydesigned photoelectric photometer of the ac ratio type allowing continuous scanning and recording. Thetemperature and self-absorption present in different parts of the arc, and in the arc under different operatingconditions, have been determined, and are presented for use in determining which lines are self-absorbedunder given conditions. Some unexplained mechanism in the arc causes deviation from equilibrium valuesof the intensities of all lines within multiplet 68. This mechanism does not operate in the furnace. Correctedvalues are given for some f values given in the literature. Additional measurements of the arc are nowunder way for the calculation of high-excitation f values.
INTRODUCTION
THIS experiment was undertaken to explore thefeasibility of using the dc iron arc as a source of
excitation for the measurement of high-excitation fvalues (actually, gf values) in the neutral iron spectrum.Values of the excitation temperature of the arc and theeffects of self-absorption of lines in the arc, over a rangeof currents and pressures and in several parts of the arc,were desired.
Measurement of f values of some high-excitationlines was made photographically by King' and photo-electrically by Carter,2 both of whom produced anemission spectrum of iron in a furnace. The f values forlines of higher excitation are very much desired, andphenomena such as the odd-even effect found by Carterjeopardize attempts to determine f values from astro-physical curves of growth. The arc contains higherexcitation lines than the furnace, and hence was chosenas the subject of this experiment.
Crosswhite3 has undertaken a study of the iron arc inrelation to its use as an intensity standard in spectro-chemistry. The intensities of 1000 lines were measuredusing two photocells and a specially designed ratio-recorder. Data are given regarding the variation ofintensity with excitation, and regarding self-absorption.
A photoelectric ratio circuit was designed for thisexperiment. Between 3600 A and 5500 A, there are 106lines of known f values, measured by King and Carter,whose intensities were measured with this instrument.These lines represent transitions between a largenumber of states, belonging to multiplets 1 up through800.
THEORY
The intensity, lo, in watts/sec- sterad, of a spectrumline emitted by the electronic transition from state nto state m, in an optically thin layer of an incandescentgas in thermodynamic equilibrium is
Io= Cno 3gnfnm exp(- En/kT),
'R. B. King, Astrophys. J. 95, 78 (1942).2 W. W. Carter, Phys. Rev. 76, 962 (1949).3 H. M. Crosswhite, Spectrochim. Acta 4, 122 (1950).
where v is the frequency, no is the number density ofatoms in the ground state, gn is the statistical weight ofthe state whose energy is E., T is the temperature ofthe ensemble, C is a constant, and f m, referred to asthe f value," is proportional to the probability that anelectron in state n will make the transition to state m inunit time and to the matrix element of the transition.4 -6
A spectrum line emitted by a "thick" source exhibitsthe phenomena of self-absorption, so that its totalresulting intensity I is no longer lo but is a complicatedfunction of Io called (using logarithms) the "curve ofgrowth." 78 Self-absorption is the saturation whichwould occur in spectrum lines emitted by homogenoussource, as the intensity per frequency interval of theline approaches the blackbody "ceiling," B(T). Ifspectrum lines from any given multiplet are exhibitedin a plot of logl/Io against logIo, the resulting curveis horizontal until, when lo is large, self-absorption setsin and the curve drops downward. A detailed predictionof the phenomenon was made by Cowan and Dieke.9
In principle this experiment uses lines of known fvalues to determine the extent to which measurementsof other line intensities might be used to find highexcitation f values.
APPARATUS
Initial measurements were made on a horizontal 5-mPaschen-Runge spectrograph at the California Insti-tute of Technology. Two photocell units were con-structed for use in an ac ratio circuit. Each unit con-tained a voltage divider for the photomultiplier and apreamplifier is a shielded chassis. Each unit, togetherwith a slit, was mounted on a carriage, which rolled
4 F. K. Richtmeyer and E. H. Kennard, Introduction to ModernPhysics (McGraw-Hill Book Company, Inc., New York, 1947).
5 F. A. Jenkins and H. E. White, Fundamentals of PhysicalOptics (McGraw-Hill Book Company, Inc., New York, 1937),pp. 36-37.
6 A. C. G. Mitchell and M. W. Zemansky, Resonance Radiationand Excited Atoms (The Macmillan Company, New York, 1934).
7 A. Unsold, Z. Astrophys. 24, 306 (1948).8 L. H. Aller, Astrophysics: the Atmosphere of the Sun and Stars
(Ronald Press, New York, 1953).9 R. D. Cowan and G. H. Dieke, Revs. Modern Phys. 20, 418
(1948).
i80
VOLUME 49, NUMBER 7 JULY, 1959
BEHAVIOR OF IRON ARC
along a track formed to fit the focal circle of the spectro-graph. Other parts of the circuit were rack mounted andconnected to the photocell units by cables.
Alignment of the photocells and exit slits toward thegrating was accomplished by gearing the angle of thephotocell chassis on its carriage to the position of thecarriage along the Rowland circle track. Continuousscanning was provided by an induction motor mountedon the carriage, driving a small rubber wheel bearingon the track.
Modulation was accomplished by chopping the lightbeam; a chopper disk was rotated by a synchronousmotor near the entrance slit of the spectrograph.
Numerous attempts were made to stabilize the arc,and it was found that low-current dc iron arcs couldbest be stabilized by wind shielding and by the presenceof a small spherical bead on the lower electrode.
Studies of the arc in atmospheres of different pressure,as well as effective wind shielding for the normal atmos-phere case, were facilitated by running the arc inside aclosed chamber with quartz windows. This chamberwas water cooled and allowed adjustment of the upperelectrode by means of a sylphon bellows. There is atendency for the windows of the chamber to becomecloudy more rapidly as one increases current or pressure.This can be lessened by allowing a very slight leak toblow air across the window.
The source was mounted on a platform allowingvertical and lateral screw adjustment, and an 18-cmfocal-length lens, or equivalent mirror, produced animage of the arc or filament, four times magnified. Thelens is more convenient than a mirror, and tests haveshown that it introduces no wavelength dependentabberations in spite of the different isophots of differentsources, provided that the opening in the slit is smallerthan any image on the slit.
It is very important to insert a diffuser between thephotocell and the exit slit. Otherwise, as the photocellcarriage is moved along the track, slight variations inthe photocell rotation will cause its optic axis to inter-sect the grating at different points; these differentpoints are illuminated with slightly different phasebecause of the rotation of the shadow of the chopperblades; hence the phases of the signals received by thetwo photocells will differ unless diffusers are used. Apiece of waxed paper is adequate and attenuates thesignal only by 50%.
The distribution of light by the spectrograph, andthe response of the photocells, must be calibrated bysubstituting for the arc a source of known spectralemission. One satisfactory source is a GE 18-ampmicroscope illuminator ("ribbon filament lamp") whichhas a color temperature of about 2200'K when operatedat 14 amp. The emissivity of incandescent tungsten isavailable. 0
10 Forsythe and Worthing, Astrophys. J. 61, 146 (1925).
I Ia. T |-/000 DC
I i 1 II 'P I
I 01 +300 DC
I - ~~~* 6 DC
.1 RP
IDENTICAL
UNIT
I +8
FIRST TUBE IN EXISTING
RCORDER .4MPuFIER
L - - - - - - - - - - - - -_ _ I
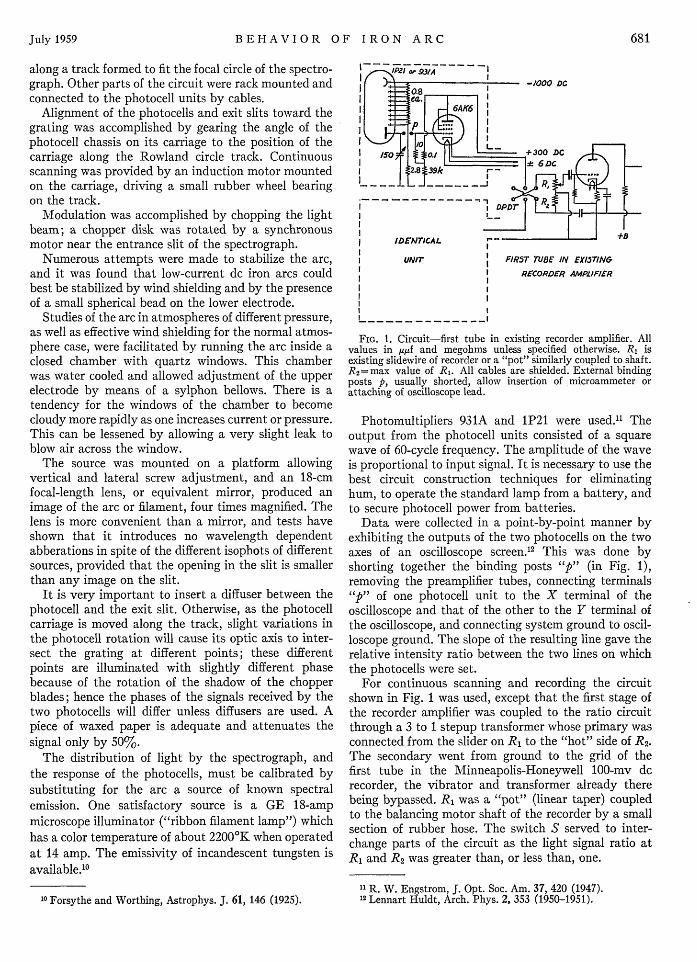
FIG. 1. Circuit-first tube in existing recorder amplifier. Allvalues in 4gf and megohms unless specified otherwise. R isexisting slidewire of recorder or a "pot" similarly coupled to shaft.R2=max value of R,. All cables are shielded. External bindingposts p, usually shorted, allow insertion of microammeter orattaching of oscilloscope lead.
Photomultipliers 931A and 1P21 were used." Theoutput from the photocell units consisted of a squarewave of 60-cycle frequency. The amplitude of the waveis proportional to input signal. It is necessary to use thebest circuit construction techniques for eliminatinghum, to operate the standard lamp from a battery, andto secure photocell power from batteries.
Data were collected in a point-by-point manner byexhibiting the outputs of the two photocells on the twoaxes of an oscilloscope screen. 2 This was done byshorting together the binding posts "p" (in Fig. 1),removing the preamplifier tubes, connecting terminals"p" of one photocell unit to the X terminal of theoscilloscope and that of the other to the Y terminal ofthe oscilloscope, and connecting system ground to oscil-loscope ground. The slope of the resulting line gave therelative intensity ratio between the two lines on whichthe photocells were set.
For continuous scanning and recording the circuitshown in Fig. 1 was used, except that the first stage ofthe recorder amplifier was coupled to the ratio circuitthrough a 3 to 1 stepup transformer whose primary wasconnected from the slider on R1 to the "hot" side of R2.The secondary went from ground to the grid of thefirst tube in the Minneapolis-Honeywell 100-mv dcrecorder, the vibrator and transformer already therebeing bypassed. R1 was a "pot" (linear taper) coupledto the balancing motor shaft of the recorder by a smallsection of rubber hose. The switch S served to inter-change parts of the circuit as the light signal ratio atR, and R2 was greater than, or less than, one.
11 R. W. Engstrom, J. Opt. Soc. Am. 37, 420 (1947).12 Lennart Huldt, Arch. Phys. 2, 353 (1950-1951).
-
_-
July 1959 681
l
RAY HEFFERLIN
This type of circuit calls for several precautions.Calibration should be made of whatever component isused at R1. Since the recorder system is phase-sensitiveas well as frequency-sensitive, it is necessary to fix thechopper blade, relative to the shaft of the (synchronous)chopper motor, at optimum angle. When this has beendone, the signal received at the balancing motor fromthe recorder amplifier is in quadrature with thatreceived in its power winding.
Arc line intensities measured with this apparatus asdescribed were consistently too bright in the green, withrespect to correct intensities for those in the blue, by afactor of 1.8. In order to locate the difficulty, a similarapparatus was constructed at Southern MissionaryCollege, using a 21-ft 10-in. grating blazed at 5000 Ain the first order, where most measurements will bemade. It was found that the previous arrangementintroduced error in the data in the method of couplingthe photocells to the recorder, and in the presence ofscattered light.
The circuit as described above caused the reactanceof each preamp cathode circuit to vary according tothe signal at the opposite photocell. Hence the secondcircuit was coupled as shown in Fig. 1. Photocell powerwas obtained from a PE-103 dynamotor, operated from18 v dc with the input selector at "12 v." The dyna-motor output was filtered by a 10-henry choke in seriesand 4-pf capacitor in parallel.
Numerous tests for linearity were made, by usingknown ac signals to the cathode followers, and byinserting neutral density filters in front of the photocellsand observing the outputs on the recorder in each case.With the whole system in operation, a very critical testis provided by inserting such filters in front of theentrance slit-the recorded ratio should not changealthough the output of each photocell will. The circuitat Southern Missionary College satisfied these tests,whereas that previously used failed the last test.
Scattered light in the spectrographic room wasreduced by blackening illuminated surfaces, by paintingover all except a front window on the photocells, andby masking the focusing lens in such a way that theprojection of the mask falls exactly on the ruled portionof the grating. Scattered light would be picked up bythe apparatus because it is modulated by the chopperjust as is the spectrum; it would have its greatest effectin the ultraviolet where the comparison lamp spectralintensity drops to a very low value.
PROCEDURES
The term "standard arc" refers to an arc drawnbetween two iron rods 5 mm in diameter and separatedby 4 mm. The inverted image of the arc on the slit was16 mm high and equally broad. The entrance slit was3 mm high and 0.38 mm broad. The "edge" of the arcis defined as that region on the equator of the arc whichmarks the outer limit of the blue core of the arc; the"positive pole" and "negative pole" regions are on the
axis of the arc and are bounded by the pole or the beadon the pole.
Setting the photocell unit on a line was accomplishedin three stages. The front surfaces of the slit werepolished so that spectrum lines could be seen on themfrom in front, and the dark slit could be placed on aline. Light passing through the notched upper portionof the slit was directed upward by a prism above thephotocell so that, by looking from above, the operatorcould set the slit upon any line. Precise setting wasaccomplished electronically by observing the signal onan oscilloscope as the photocell carriage was adjusted.This method was used exclusively in the ultravioletportion of the spectrum.
The operation of the circuit required that one photo-cell be fixed so that the light of one line would serve asreference against which the scanned lines were to becompared. A typical arrangement was to place thisfixed photocell unit on a blue line in the second order sothat it would not impede scanning of the entire first-order spectrum.
When data are taken point-by-point with an oscil-loscope, it is necessary to make three readings for eachline on which the scanning photocell is set: (a) lineagainst reference line, (b) nearby continuum againstreference line, and (c) ratio at same wavelength withstandard lamp. Photocell dark-current need not beconsidered since it is subtracted when the signal passesthrough the coupling condensers C in Fig. 1. Thus theintensity of the line is given by (a)-(b), divided by (c).
In continuous recording, initial wavelength deter-mination was made, as signal lamps illuminated whenthe photocell carriage actuated switches placed alongthe track, combined arc-spectrum and lamp-spectrumtracings were obtained by using a first-surface mirrorto substitute the light of the lamp for that of the arcat intervals while an arc run was actually in progress.Such a mirror lowers the color temperature of the cali-bration lamp as seen by the spectrograph by some 60'K,a correction which was applied to the temperaturemeasured by a pyrometer looking directly at thelamp. Measurements of line intensities were greatlysimplified by widening all lines artificially until theyassumed a flat topped shape, for then the altitude of thetrapezoid shaped profile was a measure of relativeintensity. The entrance slit of the spectrograph waswidened for this purpose (typical value for arc, 0.38mm; for lamp, 1.50 mm) while the scanning photocellslit was very narrow (0.05 mm or 0.17 A) compared tothe broadened line image (0.40 mm or 0.70 A). Thestationary, reference, photocell was used as a sensi-tivity selector to determine which range of line inten-sities should give usable ratios compared to the referenceline. Not only may the reference line which it monitorsbe chosen for brightness (as long as it be a high-excita-tion line anticipated free from self-absorption) but theexit slit width may be varied Eas long as it is narrower
682 Vol. 49
BEHAVIOR OF IRON ARC
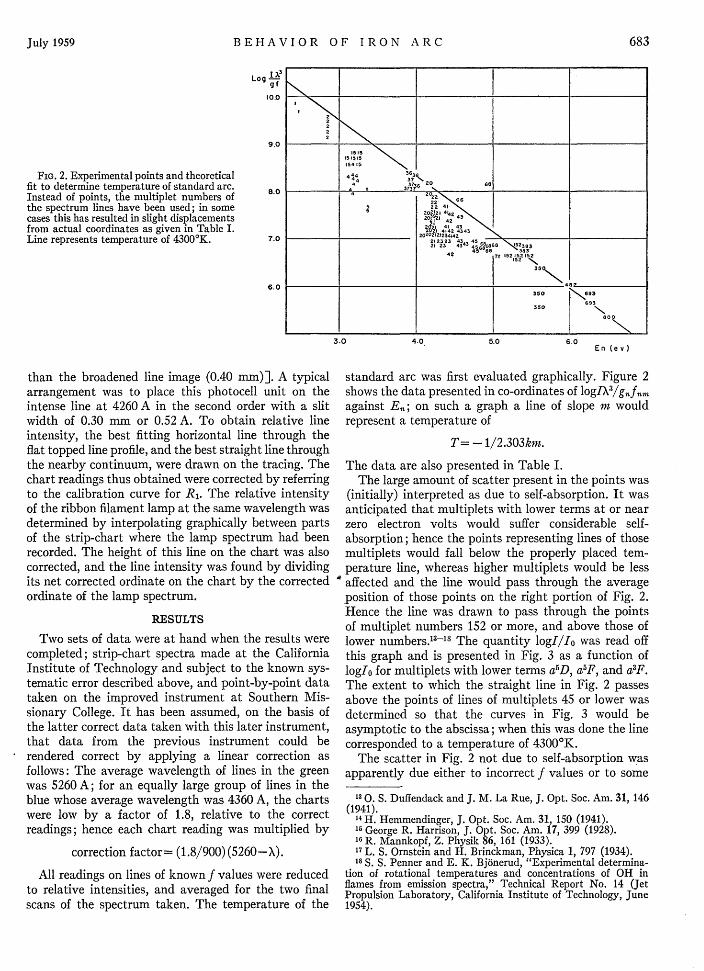
FIG. 2. Experimental points and theoreticalfit to determine temperature of standard arc.Instead of points, the multiplet numbers ofthe spectrum lines have been used; in somecases this has resulted in slight displacementsfrom actual coordinates as given in Table I.Line represents temperature of 4300'K.
than the broadened line image (0.40 mm)]. A typicalarrangement was to place this photocell unit on theintense line at 4260 A in the second order with a slitwidth of 0.30 mm or 0.52 A. To obtain relative lineintensity, the best fitting horizontal line through theflat topped line profile, and the best straight line throughthe nearby continuum, were drawn on the tracing. Thechart readings thus obtained were corrected by referringto the calibration curve for R1. The relative intensityof the ribbon filament lamp at the same wavelength wasdetermined by interpolating graphically between partsof the strip-chart where the lamp spectrum had beenrecorded. The height of this line on the chart was alsocorrected, and the line intensity was found by dividingits net corrected ordinate on the chart by the correctedordinate of the lamp spectrum.
RESULTS
Two sets of data were at hand when the results werecompleted; strip-chart spectra made at the CaliforniaInstitute of Technology and subject to the known sys-tematic error described above, and point-by-point datataken on the improved instrument at Southern Mis-sionary College. It has been assumed, on the basis ofthe latter correct data taken with this later instrument,that data from the previous instrument could berendered correct by applying a linear correction asfollows: The average wavelength of lines in the greenwas 5260 A; for an equally large group of lines in theblue whose average wavelength was 4360 A, the chartswere low by a factor of 1.8, relative to the correctreadings; hence each chart reading was multiplied by
correction factor= (1.8/900) (5260-X).
All readings on lines of known f values were reducedto relative intensities, and averaged for the two finalscans of the spectrum taken. The temperature of the
standard arc was first evaluated graphically. Figure 2shows the data presented in co-ordinates of logIX3/gnfnmagainst E.; on such a graph a line of slope m wouldrepresent a temperature of
T=- 1/2.303km.
The data are also presented in Table I.The large amount of scatter present in the points was
(initially) interpreted as due to self-absorption. It wasanticipated that multiplets with lower terms at or nearzero electron volts would suffer considerable self-absorption; hence the points representing lines of thosemultiplets would fall below the properly placed tem-perature line, whereas higher multiplets would be less
' affected and the line would pass through the averageposition of those points on the right portion of Fig. 2.Hence the line was drawn to pass through the pointsof multiplet numbers 152 or more, and above those oflower numbers. 3- 8 The quantity logl/Io was read offthis graph and is presented in Fig. 3 as a function ofloglo for multiplets with lower terms a5D, a5F, and a3F.The extent to which the straight line in Fig. 2 passesabove the points of lines of multiplets 45 or lower wasdetermined so that the curves in Fig. 3 would beasymptotic to the abscissa; when this was done the linecorresponded to a temperature of 4300 0K.
The scatter in Fig. 2 not due to self-absorption wasapparently due either to incorrect f values or to some
13 Q. S. Duffendack and J. M. La Rue, J. Opt. Soc. Am. 31, 146(1941).14H. Hemmendinger, J. Opt. Soc. Am. 31, 150 (1941).
1 George R. Harrison, J. Opt. Soc. Am. 17, 399 (1928).6 R. Mannkopf, Z. Physik 86, 161 (1933).
17 L. S. Ornstein and H. Brinckman, Physica 1, 797 (1934).18 S. S. Penner and E. K. Bjonerud, "Experimental determina-
tion of rotational temperatures and concentrations of OH inflames from emission spectra," Technical Report No. 14 (JetPropulsion Laboratory, California Institute of Technology, June1954).
Logg f
10.0
9.0
8.0
7.0
6.0
22 66
5 22 ~~~~41445 zo3loi 2O6
20X2 43
4 420202123234142~23 23 4'4 4
21 23 434 4581 I2~
48 7~~~ 15225
330 *N.%93
350 'N.
_ _ _ -I--~~~~~~~~~~~~~~~~~~~~. 3.0 4.0 5.0 6 0
En (ev)
683July 1959
RAY HEFFERLIN
TABLE I. Iron arc spectrum line intensities listed in order ofincreasing multiplet number and then decreasing wavelength.Intensities are given as logI 3 /gnfnm (all states equally populated),for temperature determination in Fig. 2.
when plotted in coordinates such as used in Fig. 2,fell into a similar pattern, and indicated the sametemperature. Curves similar to those in Fig. 3 are givenby Crosswhite but no points are shown.
A point in Fig. 2 which fell far from others in thesame multiplet was considered as having been givenan incorrect gf value. These lines are listed in Table II,along with the gf values given in the literature and thecorrected gf values. The lines of multiplet 68, on theother hand, were almost all too faint relative to theintensities which would have placed them on the linerepresenting the temperature of 4300'K. Since onlyone line each of multiplets 39 and 71 was measured, itwas not possible to infer whether incorrect gf valueswere indicated, or whether the whole multiplet wasshifted. Some mechanism inherent in the arc and absentin the furnace must be in operation to perturb theintensities of multiplet 68. Numerous unsuccessfulattempts were made to correlate this datum withenergy levels (either in iron or in atmospheric gases),which might be inhibiting or enhancing certain transi-tions, with the odd-even effect, and with other data,but no correlation was found.
IogI/I
025
0.60
-0.25
-0.50
- 0.75
-1.00
- 1.25
- .50
6.0 7.0 8.0 10g I1
FIG. 3. Experimental points and empirical curves for self-absorption in the standard arc for lines with lower states a5D(dot-dash line), aF (dashed line), and a3r? (dotted). Ordinatesrepresent vertical displacement of points in Fig. 2 from 4300'Kline. Other multiplets are not self-absorbed.
Key to symbolsLower state Multiplet
aOD 1245
Symbol
S0V
a5F 15
20 121 +22 *23
aOF individual points are not plotted.
5 ~ \ m
so \. 6I _ Vod, +"\+-;..~~'.0
_~~~~~~~" oka
_~~~ ~~~ I I a
phenomenon present in the arc but not in the furnace.The data of Crosswhite for a similar arc, when
combined with the f values of King and Carter and
684 Vol. 49
BEHAVIOR OF IRON ARC
The amount of self-absorption was found to varywith air pressure in the arc chamber and with arccurrent. The pressure was decreased, keeping thecurrent between 2.0 and 3.5 amps, and the data takenshowed that at least the curves for aD and aF pre-sented in Fig. 3 remained unchanged at 40 cm Hg. At4 cm Hg, the only curve for which data were taken(a3F) was completely horizontal, indicating no self-absorption. No data are available for the aF curve asthis investigation took place before measurements inthe ultraviolet were begun. Keeping the pressure at4 cm Hg, and increasing the current to 5 and 9 amp,no change was observed in the curve for aF, Fig. 3.At 15 amp, the curve for a'F again became as in Fig.3, indicating that at 4 cm Hg, 15 amp, the amount ofself-absorption is the same as at 76 cm Hg, 2 to 3 amp.Multiplets with lower term above aF (Em greaterthan 1.60 v) were unchanged throughout. No changewas observed in the "center of gravity" of multiplet68 as found in the standard arc.
The probable error of each reading point on Fig. 2and in Table I is 0.1. Within any given multiplet therelative intensities were reproducible to about 0.05;
TABLE II. Corrections to gf values of Cartera for certain lines,relative to the gf values of other lines in the multiplets to whichthe lines belong.
the other 0.05 is the uncertainty in the "center ofgravity" of the multiplet in Fig. 2.
The variation of arc temperature with pressure andcurrent, and in different portions of the arc, are pre-sented in Tables III and IV. Table III shows that at4 mm 15 amp the temperature was lower than for lessercurrents. As noted by other investigators,' 9 the currentbelow that value, however, produces no change in thetemperature of the arc but the pressue does. Self-absorption was the same in all parts of the arc, undergiven conditions of current and pressure, in spite of arelative increase of the amount of continuum in thespectrum of the edge of the arc.
CONCLUSIONS
It appears that when effects of self-absorption areabsent or corrected for, an approximate excitation tem-perature can be assigned to the arc on the basis of an
19 Ornstein, Brinkman, and Beunes, Z. Physik 77, 72 (1932).
TABLE III. Temperatures (K) at the center of the iron arcoperating under different conditions.
Air pressure Current (amp)(cm Hg) 2-3 5 9 15
4 4600 4600 4600 410076 4300a
a Standard arc.
TABLE IV. Temperatures at various parts of the arc for a givencurrent (2-3 amp) and pressure (40 cm Hg).
Part of arc Temperature (K)
Center 4300Either edge 4070Negative pole 4450Positive pole 4450
assumption of a Boltzmann distribution of atoms in theupper states of the transitions producing lines.
Self-absorption affects strong lines and lines originat-ing in low-excitation levels; temperatures in the variousparts of the arc differ little; the changes of tem-perature which result when current or pressure arechanged are small; and the standard arc has a tem-perature of 4300'K. Thus the arc appears to be apromising source for future measurements of f values,providing that the measurements are confined torelatively weak, high level lines-and it is these whichare of most interest in astrophysics.
There seems to be a mechanism in operation whichis absent in the furnace spectra such that multiplet 68is too weak to fit the Boltzmann distribution exactly.This phenomenon did not change over a range ofpressures from 4 cm Hg to 760 cm Hg and a range ofarc currents from 2 to 15 amp. Some nonequilibriummechanism is suspected and further investigation isrecommended.
It is the conclusion of this investigator that the dciron arc is a good source of high-excitationf values, andwork is already underway on the necessary measure-ments.
ACKNOWLEDGMENTS
It is a pleasure to acknowledge the invaluableassistance of Dr. R. B. King on the theoretical aspectsof this work. The following students at Southern Mis-sionary College deserve thanks for their many con-tributions to the experimental aspects of the workcarried on there: Richard Boskind, Fred Eberhart,Cliff Keller, Bob McCurdy, and Tom Walters. Thismanuscript was prepared as the initial project withfunds from a Research Corporation Grant. The meas-urements at the California Institute of Technology werepartially supported by the Office of Naval Research.


![BY MICHAEL E. TAYLOR - American Mathematical SINGULARITIES OF SOLUTIONS TO WAVE EQUATIONS BY MICHAEL E. TAYLOR1 ... made by Ludwig [24] and by Morawetz and ... *•ƒ (I) rf{ fc - ƒ ƒ M* (t?a ...](https://static.documents.pub/doc/80x56/5aec8f897f8b9ad73f8fcf0e/by-michael-e-taylor-american-mathematical-singularities-of-solutions-to-wave.jpg)


![this page ?· ABCDEFGHIJKLMNOPQRSTUVWXYZ[\]^_`abcdefghijklmnopqrstuvwxyz{|}~ € ‚ƒ„†‡ˆ‰Š‹Œ…](https://static.documents.pub/doc/80x56/5b2a60827f8b9a753e8b4ebb/this-page-abcdefghijklmnopqrstuvwxyzabcdefghijklmnopqrstuvwxyz-.jpg)