Behavioral Treatment of High Blood Pressure I I .Acute and Sustained Effects of Relaxation andSystolic Blood Pressure Biofeedback
MICHAEL S. GLASGOW, PHD, KENNETH R. GAARDER, MD, AND
BERNARD T. ENGEL, PHD
The effects on blood pressure of regular patient and professional monitoring of blood pressure,extensive patient-involved assessment of results, relaxation, and systolic blood pressurebiofeedback are analyzed by comparisons of data from two 3-month treatment periods withresults from a 1-mohth baseline period and by comparisons among control and treatmentgroups. Ninety borderline hypertensive patients completed the treatments. Major findings &ic:A. Acute effects; 1) Both relaxation and systolic blood pressure biofeedback lowered bloodpressure acutely. 2) Improvement in performance of relaxatidn and biofeedback with practiceshowed that they are learned skills. 3) Acutely, relaxation and biofeedback were equallyeffective for lowering systolic blood pressure, but relaxation lowered diastolic blood pressuremore. B. Long-term effects; 1) Blood pressure declined for at least 6 months with regularmonitoring and patient-involved assessment. 2) The greatest lowering of blood pressure bybehavioral intervention occurred during periods when pressures tended to be highest. 3) Acombination of relaxation and biofeedback, with biofeedback preceding relaxation, was betterthan either used alone and slightly, but not significantly, better than relaxation precedingbiofeedback. 4) The long-term effects of biofeedback were slightly greater than those ofrelaxation. A staged, incremental behavioral treatment of borderline hypertension is proposed.
This is the second in a series of reportsdealing with the evaluation of systolicblood pressure (SBP) biofeedback (F) andrelaxation (R) for the control of high bloodpressure (HBP). Our first report (1) de-scribed the findings from a 1-monthbaseline study of 127 patients diagnosedas having borderline HBP. This paper de-scribes the results obtained during a6-month controlled study of F and R. Ituses the extensive, self-determined
From the Gerontology Research Center (Balti-more), National Institute on Aging, National Insti-tutes of Health, Public Health Service, U.S. Depart-ment of Health and Human Services, Bethesda, andthe Baltimore City Hospital, Baltimore, Maryland.
Address requests for reprints to: Michael S. Glas-gow, Ph.D., Gerontology Research Center, BaltimoreCity Hospitals, Baltimore, MD 21224.
Received for publication April 13, 1981, revisionreceived August 11, 1981.
baseline data as bases for determining theresponses to treatment and addresses thefollowing questions: 1) Does R or F pro-vide a significant reduction in BP relativeto a control condition? 2) Is a combinationof R and F more effective than eithertreatment alone? 3) Is the benefit obtaineddependent on the order in which R and Fare used? 4] Is either treatment more effec-tive than the other? and 5) Is there anyrelationship between the effectiveness ofbehavioral treatment and the clinical sta-tus of the patient as indicated by thepresence or absence of diuretic therapy?
Several review articles (2-5) con-cluded that R and F produce comparableeffects on BP; that these effects are smallbut reliable; and that there is insufficientdata available to determine whether onebehavioral treatment is better than theother, or if either produces clinically sig-
nificant effects. Despite the lack of strongcomparative data, most reviewers recom-mend the use of R since it requires noequipment and is inexpensive. However,further investigation is warranted becauseof evidence that suggests that the twomethods affect BP through differentmechanisms. For example, studies of R(6—8) have shown that it is associatedwith equivalent reductions in SBP anddiastolic blood pressure (DBP), with re-ductions in breathing rate, heart rate, andoxygen consumption, suggesting that Raffects BP primarily by reducing cardiacoutput. Kristt and Engel (9) havesuggested that F primarily affects periph-eral resistance because when their pa-tients with mild to moderate HBP learnedto raise and to lower SBP using F, noconcomitant changes in muscle tension(triceps brachii), EEG (alpha wave activ-ity), heart rate, or breathing rate wereobserved. Furthermore, Messerli et al.(10), using DPB F after the method of Elderet al. (11), found acute changes in HRduring DBP modulation but long-term re-ductions in peripheral resistance derivedfrom direct measurements of stroke indexand cardiac output. They concluded thattheir findings supported those of Kristtand Engel since they saw no long-termchanges in heart rate or stroke indexwhereas DBP and peripheral resistancefell. Therefore, the current study seeks toelucidate further these suggested dif-ferences between R and F by investigatingtheir effectiveness, individually and incombination, in the treatment of border-line HBP.
MATERIALS AND METHODS
SubjectsA group of 90 volunteer patients completed this
study. All patients were drawn from the original
sample of 127 subjects who completed the baselinephase of the program (1). Thirty-seven patientswithdrew from the project before its completion. Ofthose who continued, 46 patients were receiving nomedication and 44 were receiving only diureticantihypertensive therapy. All patients being treatedwith any other antihypertensive medication, or tak-ing a beta-blocker for any reason, were excludedfrom the study. Since a detailed description of ourselection criteria was reported earlier (1), it will notbe repeated here.
Experimental DesignFigure 1 outlines the study design. This report
describes findings from the two 3-month treatmentphases only. AH patients who completed thebaseline phase of the study were assigned to one ofthree treatment groups: 1) A control group (C), 2) anF group, 3) an R group. Group assignments weremade to provide approximately equal numbers ofdiuretic-treated and unmedicated patients in eachsubgroup, as well as equivalent average baselineBPs. Each of the three treatment groups then began a3-month treatment phase during which all patientswbic seen monthly by one of the investigators in theoutpatient clinic of the Columbia Medical Plan(CMP). On completion of this treatment phase, pa-tients in the R and F groups were subdivided intogroups matched according to average BP levelswithin the respective groups. These subgroups theneither continued with their original behavioraltreatment or changed to the opposite treatment. Thusthere ultimately were five treatment groups: CC, RR,RF, FF, and FR, where the letters identify the firstand second 3-month treatments, respectively. Ineach of the five groups, about half were receivingdiuretic therapy for their HBP and half were un-treated. Each patient continued to be seen by thesame investigator in the outpatient clinic oncemonthly.
The following points should be emphasized: 1) Nopatient (nor investigator) knew the group assign-ment of a patient until shortly before that assignmentwas made: 2) All patients were informed at the timethey first entered the study (the beginning of thebaseline phase) that they could not be told theireventual group assignments and that 20% of thevolunteers were to serve as controls by continuing tomonitor BP for 6 months beyond baseline, but thateven monitoring alone could be an effective way tolower BP. They were also told that all patients whocompleted the study could enroll in any part ofbehavioral treatment program that they had missed
156 Psychosomatic Medicine Vol. 44, No. 2 (May 1982)
RELAXATION AND SBP FEEDBACK
CONTROL
FIRST TREATMENT
CONTROL
SECOND TREATMENT
CONTROL (CO
RELAXATION
CONTROL
FEEDBACK
RELAXATION (RR)
FEEDBACK (RF)
FEEDBACK (FF)
RELAXATION (FR)
Fig. 1. Study design: 1-month baseline and two 3-month treatment phases.
because of the study design on completion of thesecond treatment phase. Thus control patientslearned that they were to serve as control patientsonly at the time when group assignments were madefor the first treatment phase. They also were told thatafter 6 months as a control patient they could receive6 months of behavioral treatment: 3) On completionof the second treatment phase, patients enrolled intoother groups as appropriate—for example, RR pa-tients were offered F; RF or FR patients entered into afollow-up phase. Data from these stages of the studywill be reported later.
Measurements: ApparatusAt the start of the baseline phase, each patient
was given a sphygmomanometer (Propper Auto-sfig®, Propper Manufacturing Company, GardenCity, NY) and careful instruction in its use forself-determination of BP. Instructions were to mea-sure and record one's own BP three times consecu-tively each morning (on awakening), three timesconsecutively during the afternoon (between 11:30A.M. and 4:00 P.M.), and three times consecutively inthe evening (shortly before retiring). Patients wereinstructed to use disappearance of sound (Phase V)for DBP. Each patient was given franked envelopesand told to mail the BP log to us daily. Each also wastold to obtain a weekly BP determination either by ahealth professional in the outpatient department ofthe CMP clinic or by a health professional at theworksite who also used Phase V for DBP. Self-determined and professionally determined BPs weretaken from the patient's nonpreferred arm using the
patient's assigned manometer—or a mercury-filledmanometer if the cooperating health professionalpreferred this for professional determinations. Anormal adult-size arm cuff was adequate for alldeterminations. When a patient was seen by one ofthe investigators for a regular monthly visit, themanometer currently in use was exchanged for anewly calibrated one. Thus all aneroid BP manomet-ers were maintained within ± 2 % agreement with amercury-filled manometer (1).
At the end of the baseline phase, each patient wasseen at the CMP clinic by one of the investigatorsand the blood pressure history for that month wasreviewed. Data were presented to the patient ingraphic form such that the separate lines for morn-ing, afternoon, evening, and professionally recordedBPs could be examined. These graphs were dis-cussed in detail with special attention to such fea-tures as time-of-day effects, workday and weekenddifferences, self-determined and professionally de-termined differences, and adaptation trends such asunusually high or low values, days, or periods.Patients were encouraged to ask questions about thedata or about various aspects of BP or HBP. Theyoften were surprised by the variability of BP; manycommented on the unreliability of a single reading.
Behavioral TreatmentsDuring the interview following the baseline
phase, each patient was given a group assignmentand instructions for the technique to be practicedduring the first treatment phase.
Control Patients. These patients were told to con-
Psychosomatic Medicine Vol. 44, No. 2 (May 1982) 157
MICHAEL S. GLASGOW et al.
tinue to monitor BP and to mail their data to us dailyas they had done in the baseline phase. They wereseen once monthly throughout the ensuing 6months, at which times their BP graphs were re-viewed as described earlier and their manometerswere exchanged. They were encouraged to attend totheir BP variations throughout the monitoringperiod, but strong expectation of BP reduction wasnot suggested.
Bio/eedback Patients. These patients were trainedin the clinic to use their sphygmomanometer as an Finstrument following the Kristt and Engel (9) mod-ification of the Tursky et al. (12) technique. In thisprocedure, the patient is trained to inflate the BP cuffto about systolic pressure and to try to inhibit bra-chial artery sounds. Patients were instructed to at-tempt to control brachial artery sounds for about25-30 sec, after which they were to deflate the cufffor about 15 sec. If successful in inhibiting 25% ofsounds on the previous trial, the patient was told toinflate the cuff to a pressure level 2 mm Hg less thanthat of the previous trial. This procedure was re-peated until the patient could no longer lower SBPon two consecutive trials. The form on which thepatient recorded daily data included spaces for theusual morning, afternoon, and evening values;spaces for recording the SBP at each F trial; andspaces for recording three consecutive values of SBPand DBP immediately on completion of the trial.Patients were urged to practice F several times daily,but were especially encouraged to practice at thetime of day when their pressures were likely to behighest as indicated by the findings during baseline.For most patients, this was the afternoon. Patientswere seen monthly during this treatment period.Initially they were instructed to develop the F skillthrough regular practice. Then, during the secondtreatment month, they were encouraged to develop"a sense of the F response"—that is, they were told totry to identify internal subjective cues that correlatedwith successful SBP lowering. During the thirdtreatment month, patients were encouraged to prac-tice their skill both formally (using the procedureoutlined earlier) and informally without thesphygmomanometer. In this generalization proce-dure, they were told to use various environmentalcues—for example, traffic signals or work breaks—asindicants for brief SBP lowering sessions, duringwhich they were to focus for no more than 30 sec onthose subjective cues that were associated with SBPlowering. This was to be done as frequently aspossible each day. At each monthly meeting, thepatient was given a set of mimeographed pagesdescribing all new instructions for that month.
Relaxation Patients. These patients were in-structed in the clinic to use both progressive andmeditative relaxation procedures. The progressiverelaxation procedure was used primarily to enablethe patients to develop a sense of tension. Instruc-tions were given to tense and relax arm, neck, andfacial muscles with particular emphasis on notingthe different sensations during tensing and relaxing.Then the patients were instructed to focus on oneparticular muscle or muscle group that was espe-cially tense, to concentrate on that muscle group,and to let it relax. Patients were told that the salientmuscle could be different on different occasions, butthat within a session only one muscle group shouldbe chosen. Patients were encouraged to relax forabout 10 min per session and to practice R at thosetimes of day when their pressures were likely to behighest. The forms used by these patients requiredthat they record BP daily during the morning, after-noon, and evening and that they take three consecu-tive samples of BP immediately after the R practice.During the first month of treatment, patients wereencouraged to develop the R skill; during the secondmonth, they were encouraged to continue practicingbut also to develop a sense of the "feeling of relaxa-tion." Finally, during the last month, they wereencouraged to generalize their skill using salientenvironmental cues similar to those described for theF condition. Thus the instructions to R and F pa-tients were structurally similar but the skills taughtwere different. R patients also were given appropri-ate mimeographed instructions each month.
Second Treatment Phase. Control patients wereseen monthly as in the first treatment phase. Patientswho continued the same procedure they had learnedin the first phase (the RR and FF groups) were seenmonthly to review their results, to exchange man-ometers, and to discuss whatever events of the pastmonth were relevant. Patients in the reversal groups(RF and FR) were trained and treated as describedpreviously. They were encouraged to focus on thenew procedure and to try to develop that skill also.Patients were told not to forget their prior trainingsince that seemed neither feasible nor clinicallyappropriate, but their practice of it was, from thenon, ad libitum.
Statistical AnalysisSeveral statistical procedures were used. The
BMDP (1979 revision) statistical package of the NIHwas used for standard t-tests and analyses of var-iance as reported in the results. To test the long-term
158 Psychosomatic Medicine Vol. 44, No. 2 (May 1982)
RELAXATION AND SBP FEEDBACK
TABLE 1. Analysis of Variance Model Used to Evaluate Long-term Treatment Effects
Source
1. LevelA. OverallB. Between groups
1. Treatment vs. controls2. Among treatments
C. Within groups
II. RegressionA. OverallB. Between groups
1. Treated vs control2. Among treatments
C. Within groupsD. Nonlinear
df
1413
n - 5
1413
n - 53
Notes
Error term for evel comparisons
Error term for regression comparisons
Residual 3(n - 1) Error term for overall andNon-linear regression comparisons
IV. Total
effects of treatment, a model was developed1 (Table1), which enabled us to test group differences inoverall BP levels as well as trends throughout thethree phases (baseline, and first and second phases).Specific between group comparisons were madeusing Waller and Duncan's (13) k-ratio t-test. Brantand Duncan's (14) variation of this procedure wasused for comparing treatments with controls. Be-cause BP trends were nonlinear, analyses were per-formed on log transforms of the data.
RESULTS
Study Participants
Comparison of Patients Who Com-pleted the Study with Those Who With-drew. Prebaseline and baseline charac-teristics for the 127 patients who com-pleted the 35-day baseline period havebeen reported previously (1). Of these, 31
'The authors are grateful to Dr. L. J. Brant for hisvaluable contribution to the development of thisstatistical model.
failed to complete the first 3-month treat-ment phase and six who completed thefirst treatment phase failed to completethe second. None of the withdrawals werefrom the control group. The proportionsof men to women, medicated to nonmedi-cated, and white to nonwhite did notdiffer between the group of patients whocompleted the study and those who with-drew. The groups also did not differ inage, weight, height, body mass, or pre-baseline clinical SBP or DBP. The groupwho withdrew differed only in that dur-ing the baseline period they had some-what lower average DBP as determinedprofessionally (88.2 mm Hg vs 90.5 mmHg; t (126) = 1.93; p < 0.10) and loweraverage self-determined DBP throughoutthe day (88.1 mm Hg vs 91.3 mm Hg; F(1,125) = 5.52; p < 0.05).
The following were reasons for with-drawal: "Too busy" or failed to submitdata regularly (N = 21), change of medica-tion to an antihypertensive drug otherthan a diuretic (N = 2), loss of incentivedue to low blood pressure (N = 9), fear of
Psychosomatic Medicine Vol. 44, No. 2 (May 1982) 159
MICHAEL S. GLASGOW et al.
monitoring blood pressure (N = 3), armdiscomfort related to BP measurements (N= 1), left the area on an extensive businesstrip (N = 1).
Comparisons of BehavioraJJy TreatedPatients with Controls. During the pre-baseline and baseline period.the 20 con-trol patients differed from the 70 behav-iorally treated patients in that they had: 1)lower average prebaseline clinical SBP[137.2 mm Hg vs 142.8 mm Hg; t (88) =2.19, p < 0.05] and 2) higher averageafternoon [95.0 mm Hg vs 91.6 mm Hg; F(1 /88) = 4.08, p < 0.05] and evening [93.0mm Hg vs 89.4 mm Hg; F (1 /88) = 4.86, p< 0.05] self-determined DBP during thebaseline. Also, in the nonmedicated sub-group, control patients had higherbaseline evening DBPs than did treatedpatients [94.2 mm Hg vs 90.0 mm Hg; t(44] = 2.06, p < 0.05]. No other effectswere significant in comparisons of behav-iorally treated patients with controls inthe medicated subgroup: t (42] = 1.97 forprebaseline SBP, t(42] = 1.05 for baselineafternoon DBP, t(42] = 1.16 for baselineevening DBP; or the nonmedicated sub-groups: t(44] = 1.13 for prebaselineSBP and t(44] = 1.89 for baseline after-noon DBP.
Compliance with the Treatment Pro-tocol. The average number of timeseither R or F was practiced per 35-dayperiod for all groups was 38.4, 38.9, 37.3,and 35.2 during the first and last 35 daysof the first and second treatment phases,respectively. No significant group, phase,or group x phase effects were presentamong the four behavioral treatmentgroups (RR, RF, FR, and FF]. It is notewor-thy that both repeating groups (FF andRR) tended to decrease the averagenumber of daily practice sessions across
phases, whereas the groups that changedtreatments during the second treatmentphase exhibited different patterns of com-pliance. Those patients who changedfrom R to F tended to increase the rate ofpractice through the first 35 days of thesecond treatment phase before decreasinglate in the phase, whereas those whochanged from F to R tended to increasethe rate of practice throughout the lasttreatment phase. None of these trends wasstatistically significant.
Acute Lowering of BP (Average BP Im-mediateJy After Practice of R or F MinusAverage BP ImmediateJy Before Practiceof R or Fj. Figure 2A shows averagechanges in SBP and DBP immediatelyassociated with the practice of R or F foreach of the four behavioral treatmentgroups. Figures 2B and 2C, respectively,show these changes for the medicated andnonmedicated subgroups. Each quartet ofbars shows the average BP response dur-ing the four 35-day measurement periods.These acute BP changes were signifi-cantly different from zero (p < 0.01)across all behavioral groups for the com-bined group, F(l/57) = 287.66 for SBP,F(l/57) = 79.89 for DBP; the medicatedsubgroup, F(l /26) = 82.81 for SBP, F(l /26)= 26.13 for DBP; and the nonmedicatedsubgroup, F(l/27) = 261.22 for SBP, F(l/27) = 57.78 for DBP. Furthermore, theimprovement in performance by this mea-sure, between the first 35 days of the firsttreatment phase and the last 35 days of thesecond treatment phase also was signifi-cant for the medicated subgroup, F(3/78)= 3.79, p < 0.05 for SBP, F(3 /78) = 3.94, p< 0.05 for DBP; and for SBP of the com-bined group, F(3/171) = 4.09, p < 0.01;but only marginal for DBP of the com-bined group, F(3/171) = 2.59, p < 0.10.The nonmedicated subgroup did not sig-
160 Psychosomatic Medicine Vol. 44, No. 2 (May 1982)
RELAXATION A N D SBP FEEDBACK
RR RF FR FR FF
Fig. 2. Acute changes in SBP or t)BP with R or F. Each quartet of bars shows average before/after changes inSBP or DBP during the first and last 35 days of each treatment phase. Negative changes indicatereduction in BP.
nificantly improve acute lowering ofeither SBP, F(3/81) = 1.26, or DBP, F(3/81) = 0.46, with continued practice. Be-havioral group differences in acute BPlowering were significant for DBP in thecombined group (Figure 2A-2), F(3/57) =6.19, p < 0.01; and the medicated sub-group (Figure 2B-2], F(3/26) = 3.74, p <0.05, but not in the nonmedicated sub-group (Figure 2C-2), F(3/27) = 2.18. TheRR and FR groups showed superior im-provement in performance with con-tinued practice whenever group dif-ferences occurred; p < 0.05, Waller andDuncan (13).
The acute BP changes resulting from Rduring the first treatment phase (Figures2A, first two bars for RR and RF groups)increased for both SBP and DBP. Thispattern continued through the secondtreatment phase for those patients whocontinued with the practice of R (RRgroup, all four bars). Similarly, F caused aprogressive improvement in acute SBP
reduction (Figure 2A-1, first two bars forFR group, all four bars for FF group), butwas not associated with increased lower-ing of DBP acutely during either the first(Figure 2A-2, first two bars, FR and FFgroups) or the second treatment period(Figure 2A-2, all four bars, FF group). Foracute SBP lowering, R and F were equallyeffective during the first treatment phase,and both treatments were associated withsignificant improvement from the begin-ning to the end of that phase, F(l/73) =8.53, p < 0.01. The effect of R on acuteDBP change during the same period wasgreater than that of F; F(ll73) = 12.75,p < 0.01.
Further evidence that F was not as-sociated with acute lowering of DBP isshown by the results of those groups thatchanged behavioral treatments for thesecond treatment phase. The RF groupregressed in acute DBP lowering whenthey began to practice F (Figure 2A-2, lasttwo bars of RF group), and the FR group
Psychosomatic Medicine Vol. 44, No. 2 (May 1982) 161
MICHAEL S. GLASGOW et al.
began to lower DBP only after switchingto R (Figure 2A-2, last two bars, FRgroup). The group x time interactionswere significant for DBP in the combinedgroup, F(9/171) = 3.06, p < 0.01, and themedicated subgroup, F(9/78) = 2.01, p <0.05. The FF group never showed a levelof acute DBP reduction comparable to thatof patients practicing R. Noteworthy alsois the drop in acute SBP change thatoccurred for the RF group when theyswitched to F (Figure 2A-1, second andthird bars for RF group). After practicingF, the degree to which this group loweredSBP was increased (Figure 2A-1, third andfourth SBP bars, RF group).
For the nonmedicated patients duringthe first treatment phase (Figures 2C, firsttwo bars for each treatment group), theacute changes were significant, F(l/37) =226.36, p < 0.01 for SBP, F(l 137) = 57.06,p < 0.01 for DBP, and the acute DBPchange for the R group was greater thanthat of the F group, F(l/37) = 6.12, p <0.05 (Figure 2C-2). The nonmedicatedsubgroup also showed a marginal group xtime effect for acute DBP change over bothtreatment phases, F(9/81) = 1.85, p <0.10, again indicating the tendency for Rto have a greater effect on acute DBPlowering (Figure 2C-2).
The Lowering of SBP DuringBiofeedback Practice
The F technique was monitored by re-cording the difference between the SBP atthe start of the F procedure and the lowestSBP that the patient was able to achieve inthat practice session. Average reductionsfor the F group in the first treatment phasewere significantly different from zero,F(l/31) = 80.53, p < 0.01 and improvedfrom the first 35 days to the last 35 days,-4.9 mm Hg to -5.8 mm Hg, F(l/31) =
5.13, p < 0.05. During the second treat-ment phase, the effect of previous experi-ence on performance of F was examinedby comparing FF patients with RF pa-tients. These groups did not differ, F(l /31)= 0.02, but did tend to achieve greaterSBP lowering during the last 35 days oftreatment (—4.8 mm Hg to -5.4 mm Hg,F(l/31) = 3.87, p < 0.10.
Long-term Effects of BehavioralTreatment
Figure 3 presents the differences in BPlevels at each time of day from baseline tothe end of each treatment phase. Allgroups lowered their average self-determined SBP and DBP betweenbaseline and the end of the first treatmentphase as well as between baseline and theend of the second treatment phase. Thesechanges are different from zero (p < 0.01)for all groups between baseline and thefirst treatment phase, F(l/85) = 98.60(SBP), F(l/85) = 86.64 (DBP); and be-tween baseline and the second treatmentphase, F(l/74) = 88.44 (SBP), F(l/74) =96.70 (DBP). Furthermore, the greatest re-duction for all groups (-6.0 mm Hg to-12.2 mm Hg for SBP; -3.7 mm Hg to-9.6 mm Hg for DBP) occurred during theafternoon (Figure 3). Changes in profes-sionally determined BPs also were dif-ferent from zero (p < 0.01) betweenbaseline and the first treatment phase:-4.2 mm Hg (SBP), F(l /82) = 19.18, -3.2mm Hg (DBP), F(l/82) = 19.34; and be-tween baseline and the second treatmentphase: -5.6 mm Hg (SBP), F(l/77) =28.67, -4.4 mm Hg (DBP), F(l/77) =42.49.
Figure 4 shows that, as reported earlier(1), both SBP and DBP were highest dur-ing the afternoon. Furthermore, the lineartrend throughout the day was significant
162 Psychosomatic Medicine Vol. 44, No. 2 (May 1982)
RELAXATION AND SBP FEEDBACK
AM PM EVE AM PM EVEBASELINE THRU BASELINE THRU
RUST TREATMENT SECONO TREATMENT
AM PM EVE AM PM EVEBASELINE THRU BASELINE THRU
FIRST TREATMENT SECOND TREATMENT
Fig. 3. Differences in average SBP or DBF between baseline and the last 35 days of each treatment phase forthree times of day: AM = morning, PM = afternoon, EVE = evening.
and positive (evening higher than morn-ing) for SBP, but significant and negative(evening lower than morning) for DBP;and average professionally determinedpressures were comparable to, but slightlylower than, afternoon self-determinedpressures. Figure 4 also shows an overalldrop in BP from baseline to the end of thetreatment period for all groups and a sep-aration of BP levels of the behaviorallytreated groups from those of the controlgroup.
Differences Among BehavioralTreatment Groups(Self-Determined BPs) BP Level
Figure 5 shows average afternoon BPsfor each of the five patient groups, cover-ing five different time periods frombaseline through the second treatmentphase. Graphs of morning and- eveningBPs are similar; however, the greatest dif-ferences appear during the afternoon.Comparative results from all times of day,and for different pharmacological groups,are summarized in Table 2.
No differences were found in self-determined SBP levels at any time of daybetween behaviorally treated patients andcontrols for the combined group or for themedicated or nonmedicated subgroups(Table 2). However, there were significantdifferences in self-determined DBP levelsbetween behaviorally treated and controlpatients in the combined group both inthe afternoon, F(l/85) = 8.67, p < 0.01,and evening, F(l/85) = 8.74, p < 0.01.These differences were present in both themedically treated and the nonmedicatedsubgroups, but they were consistently re-liable in the nonmedicated patients only:afternoon, F(l/41) = 7.77, p < 0.01; eve-ning, F(l /41) = 5.52, p < 0.05.
When self-determined BP levels ofspecific behavioral treatment groups werecompared with that of the control groupusing Brant and Duncan's modification(14) of Waller and Duncan's k-ratio t-test(13), no significant differences in SBPlevels were found. However, each of thefour behavioral treatment groups in thecombined population had lower afternoonand evening self-determined DBP levels
Psychosomatic Medicine Vol. 44, No. 2 (May 1982) 163
MICHAEL S. GLASGOW et al.
AM PM EVE AM PM EVE AM PM EVEBASELINE LAST 35 DAYS OF LAST 35 DAYS OF
FIRST TREATMENT SECOND TREATMENT
Fig. 4. Intradaily variations in SBP or DBP during baseline and the last 35 days of each treatment phase.Average professionally determined BP levels are indicated for the five treatment groups on thevertical line to the right of the corresponding self-determined levels. AM = morning, PM =afternoon. EVE = evening.
Fig. 5. Average afternoon self-determined BP levels for medicated and nonmedicated patients combinedduring each of the five measurement periods. B = baseline, 1 = first treatment phase, 2 = secondtreatment phase.
164 Psychosomatic Medicine Vol. 44, No. 2 (May 1982)
RELAXATION AND SBP FEEDBACK
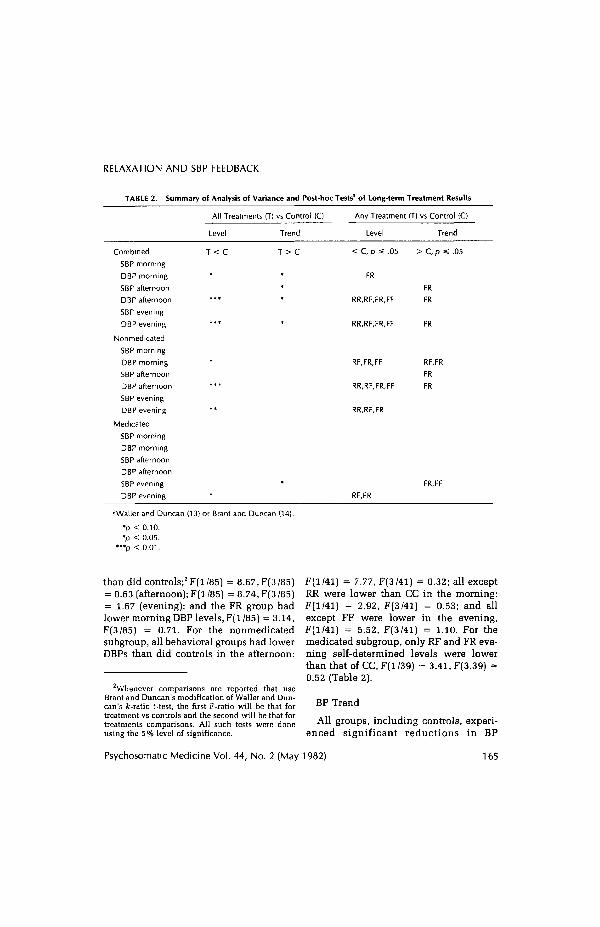
TABLE 2. Summary of Analysis of Variance and Post-hoc Tests'1 of Long-term Treatment Results
All Treatments (T) vs Control (C) Any Treatment (T) vs Control (C)
Level Trend Level
< C, p « .05
FR
RR,RF,FR,FF
RR,RF,FR,FF
RF,FR,FF
RR,RF,FR,FF
RR,RF,FR
Trend
> C, p *s .05
FR
FR
FR
RF.FR
FR
FR
Combined
SBP morning
DBP morning
SBP afternoon
DBP afternoon
SBP evening
DBP evening
Nonmedicated
SBP morning
DBP morning
SBP afternoon
DBP afternoon
SBP evening
DBP evening
Medicated
SBP morning
DBP morning
SBP afternoon
DBP afternoon
SBP evening
DBP evening
T < C
RF.FR
FR.FF
''Waller and Duncan (13) or Brant and Duncan (14).
*p < 0.10.•p < 0.05.
*"p < 0.01.
than did controls;2 F(l/85) = 8.67,F(3/85)= 0.63 (afternoon); F(l /85) = 8.74, F(3 /85)= 1.67 (evening); and the FR group hadlower morning DBP levels, F(l/85) = 3.14,F(3/85) = 0.71. For the nonmedicatedsubgroup, all behavioral groups had lowerDBPs than did controls in the afternoon:
Whenever comparisons are reported that useBrant and Duncan's modification of Waller and Dun-can's k-ratio t-test, the first F-ratio will be that fortreatment vs controls and the second will be that fortreatments comparisons. All such tests were doneusing the 5% level of significance.
F(l/41) = 7.77, F(3/41) = 0.32; all exceptRR were lower than CC in the morning:F(l/41) = 2.92, F(3/41) = 0.53; and allexcept FF were lower in the evening,F(l/41) = 5.52, F(3/41) = 1.10. For themedicated subgroup, only RF and FR eve-ning self-determined levels were lowerthan that of CC, F(l/39) = 3.41, F(3.39) =0.52 (Table 2).
BP Trend
All groups, including controls, experi-enced significant reductions in BP
Psychosomatic Medicine Vol. 44, No. 2 (May 1982) 165
MICHAEL S. GLASGOW et al.
through the course of this study (Figure5). Regressions (BP trend) for the curvessuch as those of Figure 5 were differentamong the four behavioral treatmentgroups only for the DBP of the combinedgroup in the afternoon, F(3/85) = 2.78, p< 0.05. Furthermore, BP trend did notdiffer significantly for the comparison ofbehaviorally treated patients with con-trols for either SBP or DBP at any time ofday or for either pharmacological group-ing. However, for the DBP of the com-bined group, a consistent pattern is evi-dent in that the data for all times of dayshow that the average regression of DBPamong behaviorally treated patients tends(p < 0.10) to be more negative than that ofcontrols, F(l/85) = 3.31 (morning), F(l/85) = 3.81 (afternoon), F(l/85) = 2.97(evening). This tendency also was ob-served for the afternoon SBP trends in thecombined group, F(l /85) = 2.79, p < 0.10.
When the BP trends of specific behav-ioral treatment groups were comparedwith control group trend using Brant andDuncan's (14) modification of the Wallerand Duncan test (13), the combined FRgroup had a more negative trend (p <0.05) for both SBP and DBP during theafternoon: F(l/85) = 2.79, F(3/85) = 2.12for SBP, F(l/85) = 3.81, F(3/85) = 2.78for DBP; and for DBP only in the evening,F(l/85) = 2.97, F(3/85) = 1.17. For thenonmedicated subgroup, the FR grouphad greater negative SBP trend than didcontrols during the afternoon: F(l/41) =0.42, F(3/41) = 2.62, and greater negativeDBP trend during both the morning, F(4/41) = 1.80, F(3/41) = 1.49, and the after-noon, F(l/41) = 2.58,F(3/41) = 1.85. DBPtrend also was more negative than controlfor the RF group in the morning. For themedicated subgroup, the only trends morenegative than control occurred for SBP of
the FR and FF groups during the evening,F(l/39) = 3.14,F(3/39) = 0.53 (Table 2).
Application of F and R
The appearance of the curves in Figure5 suggests that those patients receivingboth F and R (RF and FR) performedconsistently better at lowering BP thandid those receiving a single treatment (FFand RR), but the differences in BP level ortrend were not significant by the methodof Brant. The differences between thosereceiving R first (RF) and those receivingF first (FR) also were not significant foreither level or trend, nor were the dif-ferences between those receiving only F(FF) and those receiving only R (RR).Nonetheless, there is a consistent ten-dency for the FR and RF groups to per-form better than CC (Table 2) and for theFF and FR groups (F-first treatment mode)to do better than the RR and RF groups(R-first treatment mode).
Professionally Determined BPs
Figure 6 shows average professionallydetermined BPs for each behavioraltreatment group in the combined popula-tion. The first point on each curve repre-sents the BP used for selection of subjectsinto the study, that is, those obtained frommedical records. Comparable graphs forthe medicated and nonmedicated sub-groups are similar in appearance. Thebehaviorally treated patients did not differas a group from controls in either BP levelor BP trend. However, the CC grouptended (p < 0.10) to have Jower SBP levelsin the combined population, F(l/85) =2.74, and the medicated subgroup, F(l /39)
166 Psychosomatic Medicine Vol. 44, No. 2 (May 1982)
RELAXATION AND SBP FEEDBACK
MONTH: 1
PHASE: s B •1-
Fig. 6. Average professionally determined BP levels for medicated and nonmedicated patients combinedduring each of six measurement periods. S = selection phase, B = baseline, 1 = first treatmentphase, 2 = second treatment phase.
= 3.34. The negative trend in SBP wasgreater [p < 0.05) than control for the FRgroup in the combined population, F(l/85) = 2.74, F(3/85) = 1.22, and in thenonmedicated subgroup, F(l/41) = 1.69,F(3/41) = 3.0; and it tended (p < 0.10) tobe greater for the nonmedicated RF group.The changes in average professionally de-termined BP (mm Hg SBP/mm Hg DBP)from the selection phase to the finaltreatment phase were as follows: -7.3/-6.0 (CC), -6.2/-7.0 (RR), -4.7/-6.2(FF), -8.0/-5.6 (RF), and -13.8/-10.2(FR). Changes were significantly differentfrom control (p < 0.05) for the FR grouponly; F(l/36) = 5.54 (SBP), F(l/36) = 4.78(DBP).
Effect of the First BehavioralTreatments on BP Variables
Blood pressure levels and lability(standard deviation and intradaily range)were compared by repeated measuresanalysis of variance on data from thebaseline period and the first 35 days andlast 35 days of the first treatment phase.Professionally measured pressures alsowere analyzed in this way, with patientsdivided into medicated, nonmedicated,and combined groupings.
While the medicated subgroup exhib-ited no change in any of these variables asa result of activities in the first treatmentphase, the nonmedicated patients who
Psychosomatic Medicine Vol. 44, No. 2 (May 1982) 167
MICHAEL S. GLASGOW et al.
received training in either R or F achievedDBP levels in the afternoons and eveningsthat were lower than those of the C group:F(l,43) = 7.12, p < 0.05 (afternoons),F(l,43) = 4.61, p < 0.05 (evenings).3 Thenonmedicated, behaviorally treated pa-tients also showed a greater reduction instandard deviation of SBP in the morning,F(l,43) = 5.66, p < 0.05, and evening,F(l,43) = 5.90, p < 0.05, during the firsttreatment phase than did the C group; andthe declining trend in their afternoon DBPlevels was greater than that of the C group,F(l,43) = 4.64, p < 0.05.
The differences between behaviorallytreated patients and controls in afternoonand evening DBP levels were sufficientamong the nonmedicated patients to yielddifferences when nonmedicated andmedicated groups were analyzed as acombined group, F(l,87) = 6.97, p < 0.01(afternoon), F(l,87) = 7.00, p < 0.01 (eve-ning). There was also a tendency (p <0.10) for DBP trends to be more negativein behaviorally treated patients than incontrols at all times of day: morning F(l /87) = 2.69, afternoon F(l/87) = 3.37, andevening F(l/87) = 2.46. Furthermore, inthe combined group, the declining trendin afternoon DBP was greater in the pa-tients practicing F than in those practic-ing R, F(l,87) = 4.38, p < 0.05.
Thus the effects of behavioral therapywere evident during the first treatmentphase and the effects of F on DBP werealready distinguishable as compared toblood pressure monitoring alone ormonitoring in combination with R.
3The lower evening DBP levels exhibited by non-medicated, behaviorally treated patients in compari-son with nonmedicated controls were not significantwhen analyses of variance were run on differencesfrom baseline evening DBP levels.
DISCUSSION
These results show that patients withborderline elevations in BP will improvein a program of regular self- and profes-sional BP monitoring coupled with con-siderable patient involvement in the as-sessment of their progress. The findingsalso show that significant additional low-ering of BP can be achieved by adding Ror F to the program, and they suggest thatbehavioral treatment of BP can be op-timized by combining monitoring, F, andR in a stepped-care treatment regimen.Furthermore, the evidence suggests thatthis form of treatment is most effective forpatients who are not taking antihyperten-sive medication. It should be emphasizedthat the results reported here have beencompared with those of an extendedbaseline period, during which both SBPand DBP decreased significantly belowthe levels recorded in the patients' medi-cal records (1). Therefore, the findings areconservative estimates of the impact thatthese behavioral interventions had on BPrelative to those usually reported in clini-cal studies that typically use much shorterbaseline periods.
Among the five treatment modesexamined here, FR consistently producedthe largest reductions in SBP and DBPover the course of the investigation. That acombination of R and F (FR or RF) wasmore effective than either single treatment(FF or RR) is consistent with thehypothesis that the two operate on dif-ferent factors in the BP equation, namelythat R achieves lower BP primarilythrough a reduction in cardiac outputwhereas F acts primarily by loweringperipheral vascular resistance. The factthat both SBP and DBP are lowered duringR suggests that the lowered state ofarousal associated with this practice re-
168 Psychosomatic Medicine Vol. 44, No. 2 (May 1982)
RELAXATION AND SBP FEEDBACK
duces demand on the cardiovascular sys-tem leading to a reduction in cardiacoutput. The inhibition of K sounds duringF is consistent with a lessening of tensionin vascular smooth muscle sufficient tolower SBP. It is possible that with regularreduction of peripheral resistance using F,the myogenic response (15)—associatedwith sustained increases in peripheral re-sistance in response to elevated BP—could be lessened. One could speculatethat the reduction of myogenic wall thick-ening in peripheral vessels led to a rever-sal of the vascular response to sustainedHBP, resulting in the long-term reduc-tions of both SBP and DBP observed here.
This line of reasoning also suggests apossible explanation for the faster rate ofdecline in BP achieved with FR as com-pared to RF. Although F patients switch-ing to R for the second treatment phasewere not given specific direction for con-tinuing to use F, the latter stages of their Ftreatment had been devoted to generaliza-tion of the effects of F in an attempt tosustain BP reduction over longer periodsof time. This was done through shortpractice sessions, practiced at opportunemoments throughout the day, and pa-tients were advised to continue thesemini-F sessions ad libitum while practic-ing R according to the treatment protocol.Thus the FR patients had 6 months duringwhich F could have been acting to reduceperipheral vascular tension as comparedto 3 months of this for the RF group. Thetherapeutic advantage gained by the RFand FR groups, then, may have been dueto the combined reduction of both cardiacoutput and peripheral resistance; and theadded advantage gained by the FR groupcould have been due to the longer periodof time that they had for reversal ofmyogenic thickening in peripheral bloodvessel walls.
It also is interesting that, while patientstaking diuretic antihypertensivesachieved significant reductions in BP dur-ing the study period, the data for thissubgroup do not suggest that behavioraltherapy led to significant improvementover the reduction obtained by the controlpatients (Table 2). Thus it is possible thatreduction in peripheral resistance at-tributable to long-term thiazide therapy inour medicated subgroup was sufficient toprevent further reduction of vascular toneby R or F and that the reduction in BPexperienced by these patients was as-sociated, in some nonspecific way, withthe added attention to BP brought aboutby the requirement for extensive monitor-ing and assessment. However, it should berecalled that the prebaseline data reportedearlier (1) show that the medicated pa-tients entered this study with lower aver-age DBP than did nonmedicated patients.Furthermore, they were older. Therefore,although the explanation just suggestedfor the difference in responsiveness ofmedicated and nonmedicated subjects tobehavioral therapy is consistent with thedata, other factors also distinguish the twogroups.
Since the responsiveness of these bor-derline hypertensive patients to BPmonitoring was so favorable, the use ofself-monitoring in conjunction with regu-lar professional monitoring and signifi-cant patient involvement in data assess-ment is clearly justified as an initial stagein the management of borderline HBP.Thus we suggest that this should be thefirst step in a stepped-care program forcontrol of borderline HBP. If this proves torestore normal BP, further treatmentwould be unnecessary. However, if BPremained stable but elevated after about 1month of monitoring, behavioral interven-tion should begin with F; to be followed,
Psychosomatic Medicine Vol. 44, No. 2 (May 1982) 169
MICHAELS. GLASGOW et al.
in about 3 months, by R if necessary. It is with this study. In particular, we wish topossible that the combination of these thank CharJes TayJor, M.D., Chief of In-procedures with other behavioral inter- ternal Medicine, for his support through-ventions such as dietary salt restriction, out. We are aJso grateful to Dr. Larry /.weight reduction, and regular exercise Brant/or his contribution to the statisticalcould significantly reduce the need for analyses used in this work, and to Mr.antihypertensive pharmacotherapy. Richard H. Mathias for his dedicated as-
sistance with many technical aspects ofWe are grateful to the staff of the Co- the study.
Jumbia Medical Plan for their assistance
REFERENCES
1. Engel BT, Gaarder KR, Glasgow MS: Behavioral treatment of high blood pressure I. Analysis of intra-and interdaily variations of blood pressure during a one-month, baseline period. Psychosom Med43:255-270, 1981
2. Shapiro AP, Schwartz GE, Ferguson DCE, Redmond DP, Weiss SM: Behavioral methods in thetreatment of hypertension. A review of their clinical status. Ann Intern Med 86:626-636, 1977
3. Frumkin K, Nathan RJ, Prout MF, Cohen MC: Nonpharmacologic control of essential hypertension inman: a critical review of the experimental literature. Psychosom Med 40:294-320, 1978
4. Seer P: Psychological control of essential hypertension: review of the literature and methodologicalcritique. Psychol Bull 86:1015-1043, 1979
5. Shapiro AP: Behavior modification: can it control hypertension? J Cardiovasc Med De-cember:1075-1079, 1980
6. Wallace RK, Benson H, Wilson AF: A wakeful hypometabolic physiologic state. Am J Physiol221:795-799, 1971
7. Wallace RK, Benson H: The physiology of meditation. Sci Am 226:84-90. 19728. Benson H, Greenwood MM. Klemchuk H: Relaxation response: psychophysiological aspects and
clinical applications. Int J Psychiatry Med 6:87-98, 19759. Kristt DA, Engel BT: Learned control of blood pressure in patients with high blood pressure. Circulation
51:370-378, 197510. Messerli FH, Decarvalho JGR, Christie B. Frohlich ED: Systemic haemodynamic effects of biofeedback
in borderline hypertension. Clin Sci 57:437s-439s, 197911. Elder ST. Longacre A Jr, Welsh DM, McAfee RD: Apparatus and procedure for training subjects to
control their blood pressure. Psychophysiology 14:68-72, 197712. Tursky B, Shapiro D, Schwartz GE: Automated constant cuff-pressure system to measure average
systolic and diastolic blood pressure in man. IEEE Trans Biomed Eng 19:271-276, 197213. Waller RA, Duncan DB: A Bayes rule for the symmetric multiple comparison problem. J Am Stat Assoc
64:1484-1499, 1969 and Corrigenda 67:253-255, 197214. Brant LJ, Duncan DB: k-ratio t tests for comparing n treatments with a control, in preparation15. Folkow B: Description of the myogenic hypothesis. Circ Res Suppl 1 XIV and XV:279-287, 1964
1 70 Psychosomatic Medicine Vol. 44, No. 2 (May 1982)


![[BMIm][Fe(OTf)3], [BMIm][Mn(OTf)3], [BMIm][Li(OTf)2 ...znaturforsch.com/s68b/s68b0003.pdf · the non-coordinating properties of some ionic liquids, favoring a coordination of ligands](https://static.documents.pub/doc/80x56/5e79fdd9e0173f1b98680110/bmimfeotf3-bmimmnotf3-bmimliotf2-the-non-coordinating-properties.jpg)


