85
Behind the Dozer A Comprehensive Investigation of Follow-up Brush Control Options April 29, 2004 San Angelo TAMU Research and Extension Center Agriculture and Natural Resource Field Day

Behind the DozerA Comprehensive Investigation of Follow-up Brush Control Options
April 29, 2004San Angelo TAMU Research and Extension Center
Agriculture and Natural Resource Field Day

Behind the Dozer: A Comprehensive Investigation of Followup Brush Control Options
What Did and What Did Not Work . . . . . . . . . . . . . . . . . . . . . . . . . . . . . . . . . . . . . . . . . . . . . . . . . . . . . 1John Walker, Resident Director of Research
Texas Agricultural Experiment Station, San Angelo, Texas
What Did and What Did Not Work: Aerially Sprayed Mesquite . . . . . . . . . . . . . . . . . . . . . . addendumJohn Walker, Resident Director of Research
Texas Agricultural Experiment Station, San Angelo, TexasDarrell N. Ueckert, Regents Fellow & Professor
Texas Agricultural Experiment Station, San Angelo, TexasJoe Petersen, Senior Research Associate
Texas Agricultural Experiment Station, San Angelo, Texas
Maintenance Brush Control - Does It Pay? . . . . . . . . . . . . . . . . . . . . . . . . . . . . . . . . . . . . . . . . . . . . . . 6W.T. Hamilton, Senior Lecturer
Texas A&M University, College Station, TexasJ.R. Connor, Professor
Texas A&M University, College Station, Texas
Planning a Long-Term Brush Control Program . . . . . . . . . . . . . . . . . . . . . . . . . . . . . . . . . . . . . . . . . . . 21Allan McGinty, Professor & Extension Range Specialist
Texas Cooperative Extension, San Angelo, TexasDarrel N. Ueckert, Regents Fellow & Professor
Texas Agricultural Experiment Station, San Angelo, Texas
Specifications for Mesquite and Redberry Juniper Control Methods: If You Are Going To Do It, Do It Right . . . . . . . . . . . . . . . . . . . . . . . . . . . . . . . . . . . . . . . . . . . . . . 30
Darrel N. Ueckert, Regents Fellow & ProfessorTexas Agricultural Experiment Station, San Angelo, Texas
Allan McGinty, Professor & Extension Range SpecialistTexas Cooperative Extension, San Angelo, Texas
Wildlife Considerations “After the Dozer” . . . . . . . . . . . . . . . . . . . . . . . . . . . . . . . . . . . . . . . . . . . . . . 51Dale Rollins, Professor and Extension Wildlife Specialist
Texas Cooperative Extension & Texas Agricultural Experiment StationSan Angelo, Texas
Fire and Herbivory: Why They are Important . . . . . . . . . . . . . . . . . . . . . . . . . . . . . . . . . . . . . . . . . . . 56Charles “Butch” Taylor, Professor
Texas Agricultural Experiment Station, Sonora, Texas
Where’s the Money for Follow-up Treatments for Brush Control? . . . . . . . . . . . . . . . . . . . . . . . . . . . 67Jason L. Johnson, Associate Professor & Extension Economist
Texas A&M University & Texas Cooperative Extension, San Angelo, Texas
1
What Did and What Did Not Work
John Walker, Resident Director of ResearchTexas Agricultural Experiment Station, San Angelo, Texas
Many factors determine whether a brush control project is successful. On the surface it mightappear that the answer to the questions: “What did and what did not work?” is what percent ofthe brush that was treated was killed. But if an expensive control method that killed 100% of thetargeted brush plants was used and the ranch went bankrupt paying for it, was it successful? Or ifdue to poor management the pasture is in worse condition 5 – 10 years after the initial control,should the treatment be considered a success? This paper will summarize factors that determineimmediate and long term success of brush control practices. It will also review different brushcontrol treatments relative to the risks that must be managed if they are to work. Many of thepoints made will be addressed in greater detail by other papers in this proceeding.
Initial Success Rates
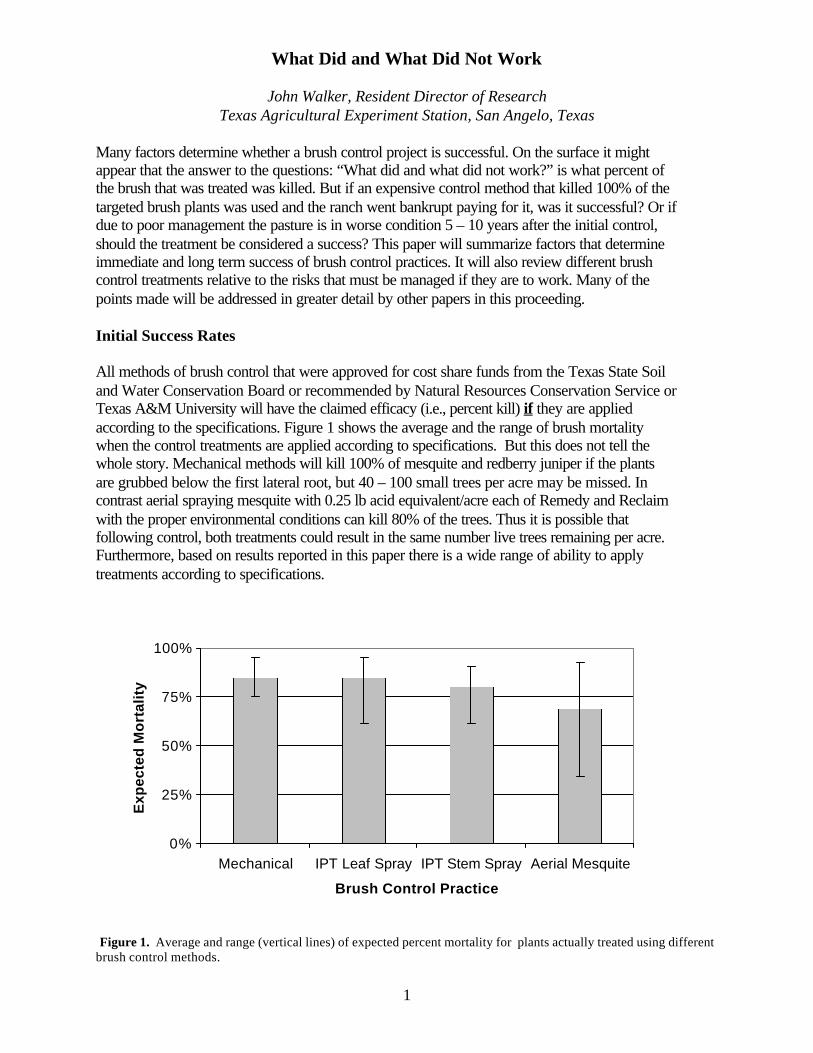
All methods of brush control that were approved for cost share funds from the Texas State Soiland Water Conservation Board or recommended by Natural Resources Conservation Service orTexas A&M University will have the claimed efficacy (i.e., percent kill) if they are appliedaccording to the specifications. Figure 1 shows the average and the range of brush mortalitywhen the control treatments are applied according to specifications. But this does not tell thewhole story. Mechanical methods will kill 100% of mesquite and redberry juniper if the plantsare grubbed below the first lateral root, but 40 – 100 small trees per acre may be missed. Incontrast aerial spraying mesquite with 0.25 lb acid equivalent/acre each of Remedy and Reclaimwith the proper environmental conditions can kill 80% of the trees. Thus it is possible thatfollowing control, both treatments could result in the same number live trees remaining per acre. Furthermore, based on results reported in this paper there is a wide range of ability to applytreatments according to specifications.
Figure 1. Average and range (vertical lines) of expected percent mortality for plants actually treated using differentbrush control methods.
0%
25%
50%
75%
100%
Mechanical IPT Leaf Spray IPT Stem Spray Aerial Mesquite
Brush Control Practice
Exp
ecte
d M
ort
alit
y

2
In the spring of 2002 the efficacy of 26 brush control treatments in the North Concho brushcontrol project were surveyed to determine the effectiveness of different control treatments(Table 1). The treatments were classified as mechanical, chemical or a combination ofmechanical and chemical. Mechanical control was the most effective method with 93% percentof the observed treatments classified as successful. The one mechanical job that was notconsidered successful occurred because mesquite plants were not cut below the first lateral root,which resulted in resprouts. The 93% success rate of the mechanical control treatments shouldnot be interpreted to mean that 93% percent of the brush was killed. Mechanical methods missedfrom 40 to 100 small plants per acre.
Pits formed by grubbing will catch water and provide a favorable site for reestablishment ofperennial grasses and forbs. However, raking and stacking brush smooths the soil surface andincreases the potential for runoff. Leaving grubbed brush in place protects seedlings fromgrazing, thus encouraging the establishment of desirable herbaceous cover. Brush was raked andstacked or windrowed on 1/3 of the excavator grubbed sites and 2/3 of the dozer grubbed sites. Raking did not affect the rating of a site with respect to effectiveness of brush control but it diddetract from the ecological benefit of mechanical brush control.
Only 50% of the chemical individual plant treatments were considered successful. The lowefficacy of individual plant treatments was probably a result of application error and/or marginalenvironmental conditions for effective herbicide uptake and translocation to roots. On one of thetreated areas it appeared that the spray had not been properly formulated. On other areas, whereapplication error was considered part of the cause of treatment failure, it was due either to notcovering the entire plant with herbicide or because many small plants were missed.
Table 1. Efficacy, i.e., percent of areas surveyed that were consideredsuccessful, of different brush control practices in the North Concho BrushControl Program.Method Number Surveyed Percent Success
MechanicalDozer 5 80%Excavator 6 100%Skid-Steer 1 100%Track Loader 1 100%Hand Grub 1 100%
Sub-total Mechanical 14 93%Chemical
Mesquite IPT 5 60%Juniper IPT1 1 0%
Sub-total Chemical 6 50%Mechanical & Chemical
Shear & Spray 7 36%1 In this treatment both mesquite and juniper were present and mesquitecontrol was acceptable but juniper control was rated marginal.

3
The shear and spray treatment gave the lowest level of efficacy of any of the treatmentsobserved. The poor results of this method of brush control occurred because the stump was oftennot completely covered with herbicide. This typically happens when brush is severed below thesoil surface and soil falls on the stump, preventing herbicide from contacting the entire surface.Shearing stumps slightly above ground level would prevent this.
Management and Treatment Success
There is a negative relationship between cost of a treatment and the level of management required to obtain the expected results (Figure 2). Management and risk are positively relatedbecause the more items that must be managed, the greater the chance that a process will not beconducted properly and the control treatment will be a failure. Mechanical control methods arethe most expensive but require the least amount of management and have the lowest risk offailure. For mechanical control to be successful the only process that must be properly managedis that brush species must be detected and cut off below the first lateral root for resproutingspecies. In contrast, for individual plant treatment of mesquite with a leaf spray to be successfulat least four items must be done or within specification including: 1) herbicide must be properlymixed, 2) the entire plant canopy must be wetted with spray, 3) the plant must be in the propergrowth stage, 4) and the environmental conditions must be correct. Figure 2 presents ageneralized relationship between cost and management intensity for different brush controlmethods.
Mechanical
AerialHerbicide
ChemicalIPT
Cost of Treatment
Man
agem
ent I
nten
sity
0
0
Figure 2. Effect of type of brush control treatment on the relationship between treatment cost and managementrequired to properly implement a brush control treatment.

4
There are two types of risk that must be managed to have a successful brush control treatment,avoidable risk and controllable risk. Avoidable risks are factors related to weather, plant andother environmental factors that cannot be controlled, but must be monitored and avoided. Ifconditions are not within the specified parameters for a chemical treatment, then the treatmentshould not be applied. Avoidable risk include both the risk associated with controllable risk aswell as the additional risk that a planned brush control treatment must be delayed, sometimes fora year or longer. Thus for methods such as aerially spraying mesquite there may be years whenbecause of drought, hail or other factors the treatment cannot be applied. In addition to the riskassociated with missed opportunities, management must be in place to insure that environmentalconditions are being properly monitored and the correct decision relative to brush control isbeing made in response to the conditions.
Controllable risks are related to human error and can be controlled by training, motivation andmonitoring performance. Human error was probably the primary cause for the low percentage ofacceptable treatments for the chemical individual plant treatments. The shear and spray treatmentrequired decisions and management for both chemical and mechanical control methods and hadthe lowest efficacy. Presumably this demonstrates that the more possible errors that can be made,the more errors that will be made. Thus the simpler a method is, the higher the probability of itssuccess. However, with proper training of both the land manager and employees involved in abrush control practice controllable risks can be reduced to the point of being inconsequential.
Experience indicates that personnel-intensive brush control options such as individual planttreatments have the potential to produce the most variable results unless adequate supervision isavailable. Close supervision, worker training and an incentive-based compensation system areprobably necessary to obtained published per acre cost for individual plant treatments. Landmanagers who plan to use such options with paid labor need to be certain they have the time andsupervisory skills necessary before choosing these options.
Follow-up
Without proper management following the initial control, none of the treatments will likely beconsidered successful in the long run. Proper follow-up consist of both proper grazingmanagement and follow-up brush control. The late Dr. Charles Scifres, one of the foremostresearchers in brush management stated “Since proper grazing management is the basic rangeimprovement practice, brush management is only as successful as it is allowed to be by thegrazing management system on which it is superimposed.” Proper grazing management primarily involves using the proper stocking rate to allow perennial grasses to reestablish andprovide competition to reduce the rate of reinfestation by brush. Stocking rates should bemanaged to leave 350 – 750 of residual forage per acre for short and mid-grass communities,respectfully. Use of the proper class of livestock is also an important grazing managementconsideration following brush control. Because they consume the least amount of grass and thegreatest amount of brush, goats are the livestock preferred species for several years followingbrush control to promote the establishment of new grass plants and reduce reinfestation of brush. Follow-up brush control is essential before the initial treatments can truly be considered asuccess. All brush control methods will leave some live plants as well as a seed bank from whichnew plants can establish. Without follow-up, initial brush control is expected to have a

5
20 – 30 year life. In contrast, with properly applied low cost follow-up treatments, an expensiveinitial treatment will last indefinitely.
Conclusions
• There was evidence that all methods of brush control can successfully kill brush.• Variability in efficacy was related to the number of decisions and level of management
required by a treatment.• Variability and risk can be reduced through proper training, education and supervision.• Follow-up is necessary for brush control to have long-term success
o Stocking rates should be managed to leave a minimum of 350 lb/acre or 750 lbacre on short and mid-grass communities respectfully
o Follow-up brush control should be initiated 3 – 5 years after initial treatments

What Did and What Did Not Work: Aerially Sprayed Mesquite
John Walker, Resident Director of Research Texas Agricultural Experiment Station, San Angelo, Texas
Darrell N. Ueckert, Regents Fellow & Professor
Texas Agricultural Experiment Station, San Angelo, Texas
Joe Petersen, Senior Research Associate Texas Agricultural Experiment Station, San Angelo, Texas
This paper presents information on the percent kill (i.e., treatment efficacy) of aerially sprayed mesquite in the North Concho Brush Control Project and is an addendum to the paper titled “What Did and What Did Not Work.” Areas that were aerially sprayed from May 29 to June 6, 2002, which was within the “early spray window”, were evaluated on April 23, 2004. Efficacy of aerially spraying with 0.25 lb per acre each of Remedy and Reclaim was evaluated on four sites near Sterling City, TX and one site about 8 miles northwest of San Angelo. The sampled areas were classified as dominated by mesquite that was under 10 ft tall or over 15 ft tall, which is an indication of the relative age of the different stands. Two mechanically grubbed areas adjacent to two of the aerially sprayed areas near Sterling City were sampled to compare the number of live mesquite plants per acre following the two control methods. Ninety-five percent of the mesquite less than 10 ft tall was apparently dead at 22 months after spraying. Efficacy of aerial spraying of the mesquite over 15 ft tall was 85%, which is at the top end of the expected percent mortality from this treatment. These results exceeded our expectations for efficacy from aerial spraying! We believe the reason for this high efficacy is that to qualify for cost-share for aerial spraying in the North Concho Brush Control Project targeted areas had to be pre-certified by employees of the Texas State Soil and Water Conservation Board to insure that all conditions met or exceeded specifications for aerial spraying. The criteria were:
• soil temperatures at 12 to 18 in. greater than 75° F, • leaves dark green with no significant leaf damage by hail, insect or drought • no new leaves caused by recent precipitation, • mesquite bean pods (if present) fully elongated • flowers if present were yellow (not white)
The greatest amount of flagging (i.e., resprouting from existing branches) occurred at the edges of sprayed areas where aircraft were turning. We presume this occurred because amount of herbicide reaching the mesquite plants falls below the recommended rate in these areas. This indicates the importance of applying the full-recommended rate of herbicide. These results are 15 to 25 percentage units higher for tall and short mesquite, respectively, than previously reported average mortality for mesquite that was aerially sprayed with a combination of Remedy and Reclaim at 0.25 lb per acre. Although all grubbed mesquite were killed, on the mechanically grubbed sites there were still 74 live mesquite plants per acre compared to 19 and 55 live mesquite per acre for the short and tall aerially sprayed mesquite, respectively. The number of live plants per acre following grubbing reported here is within the range that we found in mesquite and/or juniper sites that had been grubbed when we surveyed in 2002. The average mesquite density across all aerially sprayed sites was 370 plants per acre, thus the percent efficacy for aerially spraying would have to drop below 80% before the number of live plants remaining per acre would be as great as that observed following power grubbing.
6
Maintenance Brush Control – Does It Pay?
W. T. Hamilton, Senior Lecturer Texas A&M University, College Station, Texas
J. R. Conner, Professor
Texas A&M University, College Station, Texas
Introduction Using brush control to best economic advantage is central to effective brush management. However, the effective lives of many standard brush control treatments fall short of the time required to pay back the investment (Whitson and Scifres 1980). Application of low-cost, secondary or follow-up practices may extend the lives of some initial brush management treatments long enough for profits to be returned. There may be several possible alternatives for application following the initial treatment, each potentially yielding a somewhat different end result (Garoian, et al. 1984). The best choice for a follow-up treatment often may be based on economic comparison. Such comparisons in the Integrated Brush Management Systems (IBMS) context require that the initial treatment and the follow-up treatments be subjected to economic analysis as if they were a single entity treatment (Scifres et al. 1983). Probably one of most significant realizations that has evolved in rangeland brush and weed management is that we should utilize all available knowledge on the biology and ecology of target species in our weed management programs, as well as the economic efficiency of alternative treatments and/or treatment sets. This means that brush and weed management programs should be based on sound ecological and economic principles. All weed and brush species have a “vulnerable” spot or “weak link” in their life cycle. This is the life stage at which they can most easily and effectively be killed or managed, and usually at least cost. IBMS implies the application of an array of control or mangement practices in a planned sequence and with proper timing so that the characteristic weaknesses of one treatment are offset by the unique strengths of other treatments. This often refers to the advantage that can be gained by treating brush while it is at relatively low densities with individual plant treatments (IPT) as opposed to high-cost broadcast treatments. Such IPT are frequently used as follow-up practices after the application of an initial treatment that has reduced woody plant or weed density and cover. Follow-up or maintenance practices must be selected and properly timed and applied so that the effective life of expensive, initial reclamation treatments will be extended long enough for the cost to be recovered through increased revenue. Sound grazing management is a component of any IBMS on rangeland or improved pastures.

7
Common Follow-up or Maintenance Methods Prescribed fire The comparative economic performance of prescribed burning in combination with selected other brush management practices in south Texas has been published in multiple works since the 1970’s, particularly results from herbicide application and prescribed burning (Whitson and Scifres 1980, Garoian et al. 1984, McBryde et al. 1984, Scifres and Hamilton 1989). In many cases, prescribed burning improved the economic outcome of investing in the various practices, compared to results when the initial treatment was not followed by burning. Prescribed fire often increases the effective life of the initial brush management practice and, in some cases, improves livestock performance over that from the single treatment. An initial practice that reduces woody plant dominance and favors herbaceous species may facilitate improved forage production and livestock carrying capacity for several years after treatment, but then treatment effect is progressively reduced as woody plant cover is reestablished (Fig. 1). Prescribed burning can be applied to suppress brush regrowth and maintain near maximum production levels. As a consequence, the probability of a profitable return from the initial practice or the length of time over which profits are returned on the investment is increased. Mechanical and Chemical Individual Plant Treatments (IPT) There are a variety of mechanical tools that have application for treating low densities of woody plant regrowth as a follow-up after initial treatments. Some of the most popular of these are known as “low energy grubbers”. Low energy grubbers are so named because they use small, low-horsepower crawler or rubber-tired tractors in combination with hydraulic maneuverability of the grubbing unit or blade to effectively remove woody plants with minimum power (energy) requirement (Weidemann et al. 1977, McFarland and Ueckert 1982, Weidemann and Cross 1982). A very popular technique for controlling small woody plants, including cedar, mesquite, huisache and pricklypear is known as the “Brush Busters” method. Brush Busters offers land managers effective control of these species before they mature, thicken and require expensive broadcast chemical or mechanical control methods. Brush Busters includes both leaf spray and stem spray methods and may be cost effective compared to broadcast treatments at densities of 300-400 plants per acre, or even greater densities for some species (Ueckert and McGinty 1999). Biological Follow-up: Goats for Regrowth Suppression The use of goats in south Texas brush management systems will extend the life of the intitial treatment, lower mechanical energy inputs, and reduce herbicide applications (Mercado et al. 1991). Initial brush management practices, such as chaining or roller chopping, that reduce the stature of woody plants and promote succulent basal sprouts allow goats to effectively suppress regrowth (depending largely on stocking rate) while providing revenue from goat production

8
(Ford et al. 1992). Goating can be effective for controlling juniper seedlings, saplings and regrowth. Maintenance control of juniper with goats can be a profitable ranch enterprise, hence it is an “economically sustainable” element for juniper management systems (Ueckert et al. 1994). A Production Response Model for Economic Analysis Scifres (1980) evaluated several criteria for economic analyses of range improvement practices. Net present value (NPV) was considered superior to measures such as payback period and simple rate of return because it considered the timing of cash flows arising from the investment over the entire life of the project. Application of NPV analysis requires that all costs and benefits expected from the improvement practice alternative be identified. This may best be achieved using partial budgeting procedures. Development of partial budgets and net present value analyses are considerably less laborious than in the past because of the current computer capabilities available to many ranch managers. The model used for NPV analysis consists of a production response curve that projects change in livestock production through time following application of improvement practice(s) (Fig. 1). The first series of calculations are based on estimates of changes in livestock carrying capacity and include: 1. The initial carrying capacity (Po), which may be used as the real-time value (carrying
capacity actually used), or an estimated value that adjusts carrying capacity to an appropriate level (the adjustment is based on the conclusion that present stocking rate on the targeted management unit is not proper).
2. The maximum expected level of production (Pmax) and the expected longevity of maximum
production (TPmax). These estimates may be derived from past experiences with improving similar sites, from published research, from the best estimation (expert opinion) of experienced managers, or from a combination of these sources. Since these data represent projections, the values can be adjusted through time as actual results from practice application are accrued.
3. The time required (Tr) to reach P max after application of a given practice at Po. This
information is generally available in the research literature or from range management experts.
4. The expected point in time at which treatment effect in exhausted, i.e., carrying capacity
returns to pretreatment level, and referred to as TEo. The time required to reach TEo is the treatment life, TL. In cases where maintenance practices are used to extend effects of the original treatment (Fig. 1), TEo may not be reached during the planning horizon.
The NPV model takes into account the maximum potential change in carrying capacity, the projected annual change through time, and the length of treatment effectiveness. In this regard, the investment in treatment must take into account the impact of time. This is accommodated in
9
analytical terms by applying net present value ana lysis to the data, which allows discounting all monetary inputs/outputs to the present time. Many range improvement practices, particularly those that include maintenance treatments to extend benefits from the initial practice, have costs that occur at different times in the planning period. Similarly, benefits are normally accrued over several years. Since it is necessary when planning range improvements to select the best alternative practice in current time based on anticipated future costs and returns, costs and returns should be adjusted to reflect their “present value” before being compared (Conner et al. 1990). The present value analysis of an investment takes into account the time value of money. Present value is the worth today of a sum of money that is to be available sometime in the future. A dollar to be received a year from now is not worth a dollar today because you must forgo using it for one year. If you had the dollar today, it could be invested to earn interest, thus making it more valuable than the dollar to be received next year. To equate the two - that is, to estimate the present value of a dollar that is to be received a year from now – a discount rate must be selected to develop a factor which discounts the dollar to its present value (Conner et al. 1990). A dollar received one year from now discounted at an 8 percent discount rate would have a present value of about 93 cents (.926 discount, or present value, factor). A dollar discounted at the same rate for two years would have a present value of only about 86 cents (0.857 discount factor). It must be noted that the analysis presented considers only on-site benefits from brush management to landowners using the land for livestock production. Obviously, there are other benefits both on- and off-site, such as water yield and enhanced wildlife and recreation potential from woody plant manipulation. These other benefits generally accrue to society in general (not just landowners) and are the justification for society sharing the cost of some brush management practices through programs such as the Environmental Quality Improvement Program (EQIP). Examples of Economic Influences of Maintenance Practices In the Texas Rolling Plains, Teague et al. (2001) reported differences in net present value and benefit/cost ratios for the following burning scenarios following application of a root-killing herbicide: 1) no follow-up burn, 2) follow-up burns 10 years after herbicide, 3) follow-up burns 15 years after herbicide and 4) follow-up burns 20 years after herbicide. In all simulated scenarios, treatments were economically feasible since the NPV were >0 and benefit/cost ratio >1. However, the burn after 10 years showed the highest NPV, with the 15 year burn having the second highest NPV. Even if burning began in year 20 after herbicide application, the amount of mesquite and the associated decline in carrying capacity was insufficient to result in the no-follow-up burn treatment option having a higher NPV even though it had no burning costs. Scifres (1987) reported economic performance of prescribed burning following aerial application of tebuthiuron pellets for Texas whitebrush-dominated rangeland in the fall. A 10% discount rate was used in the economic analyses. Rapid increase in density of honey mesquite during the experiment was a factor necessitating repeated burns or an alternate mesquite control measure. Since no brush management treatment generated an internal rate of return of 10%, net present

10
values at the end of the planning profile were negative. The least internal rate of return resulted when tebuthiuron was applied as a single treatment (2.3%). Burns in the winter 4 or 7 years after treatment were equally effective in increasing the internal rate of return, compared to treatment with tebuthiuron only (4.5% and 4.4%, respectively). However, prescribed burns in year 4 and again in year 7 after herbicide application, increased the internal rate of return and accumulated cash compared to either of the single burns (5.6%). Projected outcome of prescribed burning a third time, simulated to occur 3 years after the second burn (10 years after the initial treatment ), resulted in an estimated increase in the internal rate of return to 7.5%. In one of the most comprehensive economic studies of brush management, McBryde et al. (1984) performed analyses of multiple brush management practices in eastern south Texas in an effort to assist area ranchers in evaluating and implementing profitable brush management. The authors examined four generalized but distinct and representative brush stands in the area and 11 brush management treatments. In all scenarios, prescribed fire was included as the follow-up treatment. Internal rates of return on investments were positive and higher across all treatments when maintenance practices were included. Net present values were consistently higher when maintenance was applied, even when NPV was negative. All treatment combinations that included prescribed burning averaged 11.1 percent internal rate of return, contrasted to 2.4 percent where maintenance prescribed burning was not employed. Scifres and Hamilton (1989) compared aerially applied picloram and triclopyr (1:1) at 1.1 kg/ha brush mangement initial treatments with and without follow-up prescribed burning at different posttreatment intervals. An 8 percent discount rate was used in the analyses. Burning in years 5, 9 and 13 as a follow-up practice to the initial herbicide treatment increased the internal rate of return over the initial treatment with no follow-up, leading the authors to conclude that maintenance of a high proportion of the initial benefits from the herbicide treatment is necessary for successful economic performance over planning horizons greater than the treatment life of the herbicide alone. Garoian et al. (1984) proposed integration of prescribed burns into management systems with herbicide and mechanical controls as an economically efficient means of improving productivity of Macartney rose- infested rangeland. Prescribed burning following herbicide application to disturbed Macartney rose stands increased the internal rate of return from 6.3 percent to 16.1 percent and the net present value of treatment from $11 to $57/acre. Moreover, the 20-year net cash flow was increased from $42 to $415/acre. These changes were attributable to the maintenance prescribed burns. Use of the GSAT (Grazing Land Spatial Analysis Tool) Investment Analysis Module for Analysis of a Case Study With and Without Maintenance Practices This case study is adapted from an example provided by Reinecke et al. (1997). Specifically it considers control of Ashe juniper (Juniperus ashei), initially at 60 percent canopy cover, with two-way chaining followed by prescribed fire one and seven years post chaining. We adapted the Reinecke et al. example to also consider and contrast the economic feasibility of chaining without the use of prescribed fire.

11
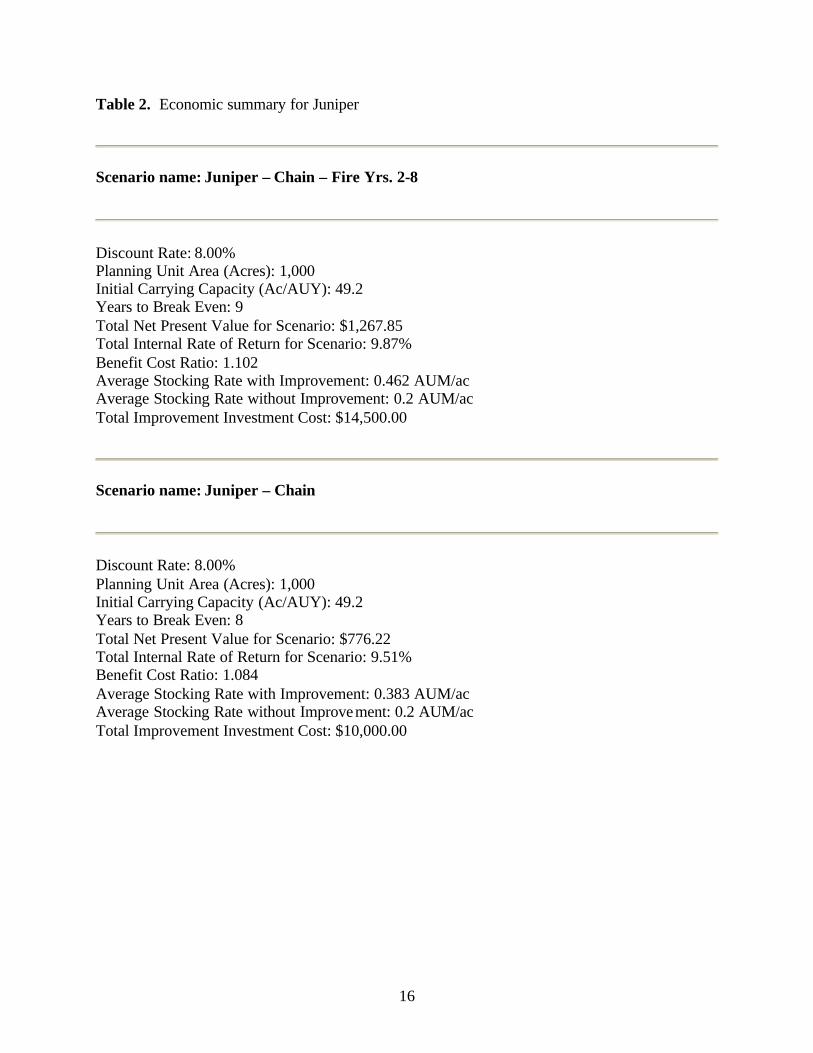
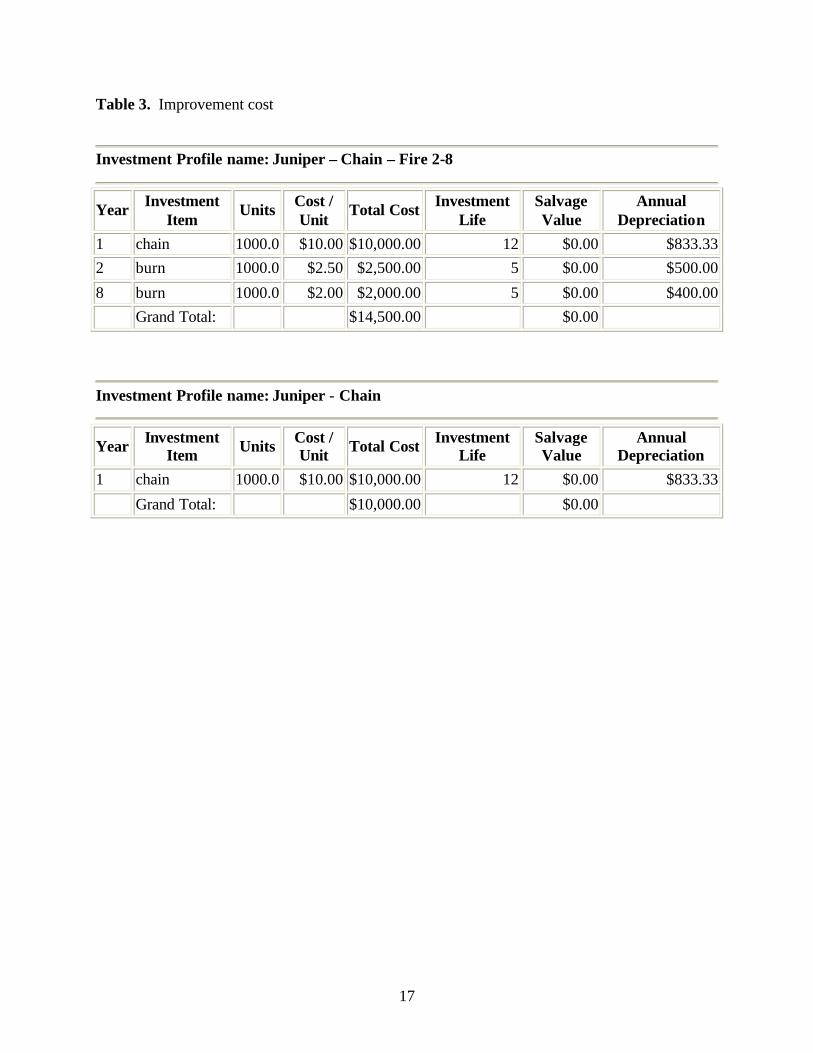
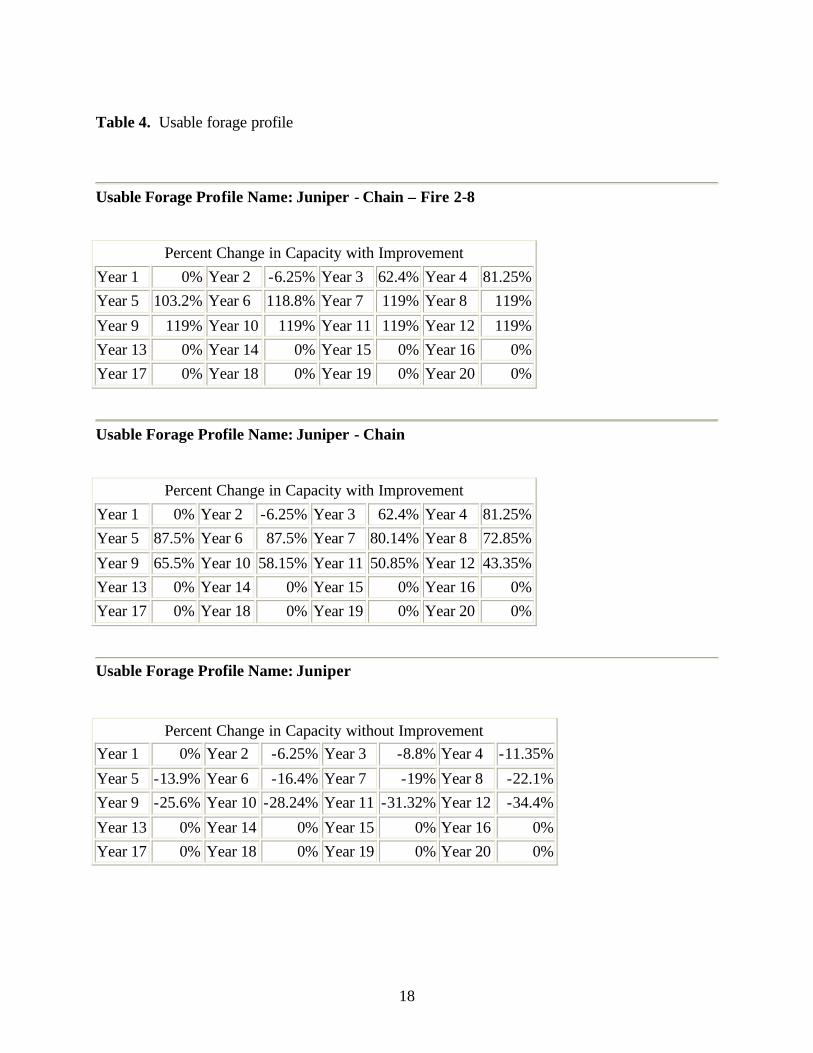
The investment analysis was preformed with the Investment Analysis Module of GSAT, a Windows-based decision support system for grazing land managers. GSAT was developed by the Ranching Systems Group in the Rangeland Ecology and Management Department at Texas A&M University in cooperation with the Natural Resource Conservation Service, USDA. The software and users guide are available for free down-loading at http://cnrit.tamu.edu/gsat. To keep the example simple and maintain focus on the impact that maintenance practices (prescribed fire) can have on the economics of brush management, we assumed that the juniper management would be applied to a 1,000-acre pasture which is used for livestock grazing via a grazing lease agreement. The lease was assumed to be based on Animal Unit Equivalents (AUE) so that the land owner could more easily assure the use of proper stocking rates by the grazing lessee. A budget representing annual revenues and costs for a typical grazing lease enterprise can be seen in Table 1. For purposes of the analysis we used a 12-year planning period with year 1 being the year that the 2-way chaining is applied. We also assumed that the landowner’s opportunity cost for investment capital would be 8 percent (see discount rate in Table 2). Based on the Reinecke et al. study, initial carrying capacity was set at 49.2 acres per animal unit (ac/au) (Table 2). Table 3 provides detail of the timing and costs of the specific brush control practices for the “with fire” and “without fire” scenarios. The 2-way chaining was estimated to cost $20.00 per acre while the prescribed fire was estimated to cost $5.00 per acre for the first burn and $4.00 for the second; the lower cost of the second burn reflecting the assumed easier task of using the previously established fire lane. It was assumed that the landowner would seek and be approved for cost-share on the brush control practices via government funded conservation programs such as EQIP. In this analysis, the cost share rate was assumed to be 50 percent. The expected changes (expressed as percents) in the grazing capacity from the original 49.2 ac/au for each year in the 12-year planning period are displayed in Table 4. The first panel shows the expected changes for the chaining plus prescribed fire program. After the chaining and the first burn are implemented in years 1 and 2 respectively, the grazing capacity increases to 119 percent (Pmax) over the original level in year 7. With the second burn applied in year 8, the grazing capacity is expected to remain at (Pmax) for the remainder of the planning period. The second panel shows the expected changes in grazing capacity for the chaining only program. Note that in this case, Pmax is reached in year 5 and is only 87.5 percent over the original level. The improved grazing capacity begins to decline in year 7 and by the end of the planning period provides only a 43 percent improvement over the beginning level. The last panel in Table 4 shows the expected changes in grazing capacity during the planning period if no brush control measures are implemented. In this case, it is expected that by the end of the 12-year planning period continued encroachment of juniper would further reduce grazing capacity by 34 percent compared to the original level. Year by year detail of the net present value analysis for the chaining-fire and chaining only programs are shown in Tables 5 and 6 respectively. Note that the program with fire (Table 5) produces about $500 more present value of net cash flow than the program without the maintenance practices (Table 6). Other indicators of relative economic/financial feasibility are
12
displayed for each of the scenarios in Table 2. As would be expected given the outcomes of the net present value analyses, the program with fire produces higher internal rate of return, benefit-cost ratio and average stocking rate than the chain only program. Discussion A review of the literature and experience by the authors in working with economic analyses of range improvements for more than three decades indicates that internal rates of return on investments and net present value of brush management (even at low discount rates and with maintenance practices) have generally declined over time. In many instances, it is no longer economically efficient based solely on revenues from livestock production to implement brush management practices without a cost-share source. This is attributed to the long-term, relatively stable income-producing capacity from livestock enterprises during a time when costs of production have risen sharply. However, during this same period landowners have offset much, if not all, of the difference between ranch costs of operation and income by maximizing the potential from wildlife hunting leases. Moreover, there are programs, such as EQIP, that provide substantial cost-share for improvement practices including brush management. Regardless of the economic environment, the fundamental concept remains: that “stretching” the benefits from high-cost, initial brush management treatments with relatively low-cost follow-up practices continues to yield a higher return on investments compared to no maintenance of initial treatments. Literature Cited Ford, J. , W. Hoefler, C. W. Hanselka, and J. C. Paschal. 1992. The impact of Spanish meat goats
on range vegetation. Pp. 1-3 in La Copita Research Area: 1992 Cons. Prog. Rep. CPR-5047. Texas Agr. Exp. Sta. 83 pp.
Garioan, L. R., J. R. Conner, and C. J. Scifres. 1984. Economic evaluation of fire-based systems
for Macartney rose-dominated rangeland. J. Range Manage. 37:111-115. McBryde, G. L., J. R. Conner, and C. J. Scifres. 1984. Economic analysis of selected brush
management practices for eastern South Texas. Texas Agr. Exp. Sta. B-1468. 14 pp. McFarland, M. L. and D. N. Ueckert. 1982. Honey mesquite control: use of a three-point hitch
mounted, hydraulically assisted grubber. Pp 48-50 in Brush Management and Range Improvement Research. 1980-1981. Tex. Agr. Exp. Sta. Cons. Prog. Rep. 3968-4014.
Mercado, R., C. W. Hanselka, and J. C. Paschal. 1991. Spanish goat production in south Texas.
Texas Cooperative Extension. Comprehensive Ranch Management for Profit Program, Corpus Christi, Texas. 22 pp.
13
Reinecke, R., J. R. Conner, and A. P. Thurow. 1997. Economic considerations in Ashe Juniper control. In Juniper 1997 Symposium. Texas A&M Research and Extension Center, San Angelo. Texas Agr. Exp. Sta. Tech. Rept. 97-1, pp6-3 – 6-10.
Scifres, C. J., W. T. Hamilton, J. M. Inglis, and J. R. Conner. 1983. Development of integrated
brush management systems (IBMS): decision-making processes. Brush Manage. Symp., Soc. Range Manage. Albuquerque, N. M. pp. 97-103.
Scifres, C. J. 1987. Economic assessment of tebuthiuron-fire systems for brush management.
Weed Technology. Vol. 1:22-28. Scifres, C. J. and W. T. Hamilton. 1989. Factors affecting economic performance of herbicides.
Chap. VII. In Scifres, C. J., B. H. Koerth, R. A. Crane, R. C. Flinn, W. T. Hamilton, T. G. Welch, D. N. Ueckert, C. W. Hanselka, and L. D. White. Management of South Texas mixed brush with herbicides. Texas Agr. Exp. Sta. Bull. 1623. 66 pp.
Teague, R., Kreuter, U.P., Ansley, R.J. and McGrann, J.M. 2003. Economics of fire as a follow-
up to herbicide treatment of mesquite. Pp.1973-1975 in Rangelands in the New Millennium. Proceedings of the 7th International Rangeland Congress, Durban, South Africa. 26 July-1 August 2003.
Ueckert, D. N., S. G. Whisenant, and M. Kieth Owens. 1994. Juniper control and management.
Chap. 7, p 61-67 in 1994 Juniper Symposium Tech Rep. 94-2. 80 pp. Ueckert, D. N. and A. McGinty. 1999. Brush Busters: how to estimate costs for controlling small
mesquite. Texas Cooperative Extension, Texas Agricultural Experiment Station. Bull E-131.
Weidemann, H. T., B. T. Cross, and C. E. Fisher. 1977. Low-energy grubber for controlling
brush. Trans. Amer. Soc. Agr. Engr. 20:210-213. Weidemann, H. T. and B. T. Cross. 1982. Performance of front-mounted grubbers on rubber-
tired equipment. Pp. 50-52 in Brush Management and Range Improvement Research, 1980-1981. Texas Agr. Exp. Sta. Cons. Prog. Rep. 3986-4014.
Whitson, R. E. and C. J. Scifres. 1980. Economic comparisons of alternatives for improving
honey mesquite- infested rangeland. Texas Agr. Exp. Sta. Bull. 1307.

14
Figure Caption
Figure 1. Components of a typical response curve used in economic analysis of brush management practices showing response from the initial treatment and from maintenance practice(s).

15
Table 1. Enterprise Budget for lease grazing ($/AUE)
Item Unit
Label # Units $/Unit $ Year
1 $ Year
2 $ Year
3 $ Year
4 $ Year
5 $ Year
6 $ Year
7 $ Year
8 $ Year
9 $ Year
10 $ Year
11 $ Year
12 grazing fee AUE 1.0 $100.00 $100.00 $100.00 $100.00 $100.00 $100.00 $100.00 $100.00 $100.00 $100.00 $100.00 $100.00 $100.00
Item Unit Label # Units $/Unit
$ Year 1
$ Year 2
$ Year 3
$ Year 4
$ Year 5
$ Year 6
$ Year 7
$ Year 8
$ Year 9
$ Year 10
$ Year 11
$ Year 12
maint. & reprs.
AUE 1.0 $5.00 $5.00 $5.00 $5.00 $5.00 $5.00 $5.00 $5.00 $5.00 $5.00 $5.00 $5.00 $5.00
16
Table 2. Economic summary for Juniper
Scenario name: Juniper – Chain – Fire Yrs. 2-8
Discount Rate: 8.00% Planning Unit Area (Acres): 1,000 Initial Carrying Capacity (Ac/AUY): 49.2 Years to Break Even: 9 Total Net Present Value for Scenario: $1,267.85 Total Internal Rate of Return for Scenario: 9.87% Benefit Cost Ratio: 1.102 Average Stocking Rate with Improvement: 0.462 AUM/ac Average Stocking Rate without Improvement: 0.2 AUM/ac Total Improvement Investment Cost: $14,500.00
Scenario name: Juniper – Chain
Discount Rate: 8.00% Planning Unit Area (Acres): 1,000 Initial Carrying Capacity (Ac/AUY): 49.2 Years to Break Even: 8 Total Net Present Value for Scenario: $776.22 Total Internal Rate of Return for Scenario: 9.51% Benefit Cost Ratio: 1.084 Average Stocking Rate with Improvement: 0.383 AUM/ac Average Stocking Rate without Improvement: 0.2 AUM/ac Total Improvement Investment Cost: $10,000.00
17
Table 3. Improvement cost
Investment Profile name: Juniper – Chain – Fire 2-8
Year Investment Item
Units Cost / Unit
Total Cost Investment Life
Salvage Value
Annual Depreciation
1 chain 1000.0 $10.00 $10,000.00 12 $0.00 $833.33 2 burn 1000.0 $2.50 $2,500.00 5 $0.00 $500.00
8 burn 1000.0 $2.00 $2,000.00 5 $0.00 $400.00 Grand Total: $14,500.00 $0.00
Investment Profile name: Juniper - Chain
Year Investment Item Units Cost /
Unit Total Cost Investment Life
Salvage Value
Annual Depreciation
1 chain 1000.0 $10.00 $10,000.00 12 $0.00 $833.33
Grand Total: $10,000.00 $0.00
18
Table 4. Usable forage profile
Usable Forage Profile Name: Juniper - Chain – Fire 2-8
Percent Change in Capacity with Improvement Year 1 0% Year 2 -6.25% Year 3 62.4% Year 4 81.25% Year 5 103.2% Year 6 118.8% Year 7 119% Year 8 119%
Year 9 119% Year 10 119% Year 11 119% Year 12 119% Year 13 0% Year 14 0% Year 15 0% Year 16 0% Year 17 0% Year 18 0% Year 19 0% Year 20 0%
Usable Forage Profile Name: Juniper - Chain
Percent Change in Capacity with Improvement Year 1 0% Year 2 -6.25% Year 3 62.4% Year 4 81.25% Year 5 87.5% Year 6 87.5% Year 7 80.14% Year 8 72.85%
Year 9 65.5% Year 10 58.15% Year 11 50.85% Year 12 43.35% Year 13 0% Year 14 0% Year 15 0% Year 16 0% Year 17 0% Year 18 0% Year 19 0% Year 20 0%
Usable Forage Profile Name: Juniper
Percent Change in Capacity without Improvement Year 1 0% Year 2 -6.25% Year 3 -8.8% Year 4 -11.35%
Year 5 -13.9% Year 6 -16.4% Year 7 -19% Year 8 -22.1% Year 9 -25.6% Year 10 -28.24% Year 11 -31.32% Year 12 -34.4%
Year 13 0% Year 14 0% Year 15 0% Year 16 0% Year 17 0% Year 18 0% Year 19 0% Year 20 0%

19
Table 5. Net present value for Juniper – chained & burned
Year Net Revenues with Improvement
Net Revenues without
Improvement
Net Revenues
Improvement Investments
Net Cash Flow (NCF)
Accumulated NCF
Present Value of NCF
1 $1,930.89 $1,930.89 $0.00 $10,000.00 ($10,000.00) ($10,000.00) ($9,259.26) 2 $1,810.21 $1,810.21 $0.00 $2,500.00 ($2,500.00) ($12,500.00) ($2,143.35)
3 $3,135.77 $1,760.98 $1,374.80 $0.00 $1,374.80 ($11,125.20) $1,091.36 4 $3,499.75 $1,711.74 $1,788.01 $0.00 $1,788.01 ($9,337.20) $1,314.24
5 $3,923.58 $1,662.50 $2,261.08 $0.00 $2,261.08 ($7,076.12) $1,538.85 6 $4,224.80 $1,614.23 $2,610.57 $0.00 $2,610.57 ($4,465.55) $1,645.10 7 $4,228.66 $1,564.02 $2,664.63 $0.00 $2,664.63 ($1,800.91) $1,554.79
8 $4,228.66 $1,504.17 $2,724.49 $2,000.00 $724.49 ($1,076.42) $391.42 9 $4,228.66 $1,436.59 $2,792.07 $0.00 $2,792.07 $1,715.65 $1,396.73
10 $4,228.66 $1,385.61 $2,843.05 $0.00 $2,843.05 $4,558.70 $1,316.88 11 $4,228.66 $1,326.14 $2,902.52 $0.00 $2,902.52 $7,461.22 $1,244.84 12 $4,228.66 $1,266.67 $2,961.99 $0.00 $2,961.99 $10,423.21 $1,176.25
Total $43,896.95 $18,973.74 $24,923.21 $14,500.00 $10,423.21 $1,267.85

20
Table 6. Net present value for Juniper - chained
Year Net Revenues with Improvement
Net Revenues without
Improvement
Net Revenues
Improvement Investments
Net Cash Flow (NCF)
Accumulated NCF
Present Value of NCF
1 $1,930.89 $1,930.89 $0.00 $10,000.00 ($10,000.00) ($10,000.00) ($9,259.26)
2 $1,810.21 $1,810.21 $0.00 $0.00 $0.00 ($10,000.00) $0.00 3 $3,135.77 $1,760.98 $1,374.80 $0.00 $1,374.80 ($8,625.20) $1,091.36
4 $3,499.75 $1,711.74 $1,788.01 $0.00 $1,788.01 ($6,837.20) $1,314.24 5 $3,620.43 $1,662.50 $1,957.93 $0.00 $1,957.93 ($4,879.27) $1,332.53 6 $3,620.43 $1,613.26 $2,007.16 $0.00 $2,007.16 ($2,872.10) $1,264.85
7 $3,478.31 $1,564.02 $1,914.29 $0.00 $1,914.29 ($957.82) $1,116.97 8 $3,337.55 $1,504.17 $1,833.38 $0.00 $1,833.38 $875.57 $990.52
9 $3,195.63 $1,445.08 $1,750.55 $0.00 $1,750.55 $2,626.12 $875.71 10 $3,053.71 $1,385.61 $1,668.10 $0.00 $1,668.10 $4,294.22 $772.65 11 $2,912.75 $1,326.14 $1,586.62 $0.00 $1,586.62 $5,880.83 $680.47
12 $2,767.94 $1,266.67 $1,501.27 $0.00 $1,501.27 $7,382.10 $596.18 Total $36,363.37 $18,981.27 $17,382.10 $10,000.00 $7,382.10 $776.22

21
Planning a Long-Term Brush Control Program
Allan McGinty, Professor & Extension Range SpecialistTexas Cooperative Extension, San Angelo, Texas
Darrell Ueckert, Regents Fellow & ProfessorTexas Agricultural Experiment Station, San Angelo, Texas
One of the greatest misconceptions about brush control is that the application of a single brush controltreatment will provide long-term control. Unfortunately most brush control methods provide onlypartial control of the target species. For example, the aerial application of herbicide to mesquite rarelyproduces a root kill in excess of 80%, often much less. Thus 20% or more of the treated mesquite isonly defoliated or top-killed and rapidly regains its previous height and canopy cover. Also, mostrangeland brush species maintain a tremendous seed bank in the soil. While grubbing may provide ahigh level of juniper (cedar) control, the removal of the parent trees often results in an explosion of newseedlings throughout the pasture. The single treatment approach is rarely successful because mostrangeland brush species are prolific resprouters, partially resistant to most control methods and maintainlarge seeds banks in the soil.
The Problem
Many ranchers ignore woody plant problems until the stands are mature and dense. By this time majordeclines in forage, wildlife habitat, livestock production, and net income have occurred. The usualapproach is to hire a contractor with heavy machinery or an aerial herbicide applicator to apply anexpensive reclamation treatment. Often, there is no plan for maintenance treatments, and the process isrepeated when the brush has again become mature and dense. In may cases the brush is allowed toincrease to the point where serious, and sometimes irreversible damage occurs to soils, desirable forageand wildlife habitat.
The traditional approach of infrequent treatment of dense brush requires very little managerial ortechnical skill. This strategy is not economically sound because livestock and wildlife production andnet revenue decrease as brush thickens and matures. The effective treatment life of expensive,reclamation treatments is usually not sufficient to recover treatment costs.
The traditional approach described above is not ecologically sound because as brush matures andthickens, the abundance and productivity of desirable species decrease and they are often replaced byless desirable or noxious species. Top soil may be eroded, which permanently decreases the potentialof the land to produce forage and cover (McGinty and Ueckert, 2001).

22
Brush Control Systems
There is seldom one best method of brush management for any particular ranch or pasture. Brushmanagement is usually more effective and economical when a combination of methods is integrated overa period of years. Integrated methods, for example can increase the effectiveness and minimize the useof herbicide and expensive mechanical treatments. Before selecting a method, feasible alternatives mustbe evaluated relative to 1) the degree of control expected, 2) their characteristic weaknesses, 3)possible secondary effects (e.g. increase of a secondary undesirable plant), 4) expected life oftreatment, 5) application requirements, 6) effect on wildlife habitat, 7) cost vs. benefit, and 8) safety(Hanselka, et. al., 1996).
The method chosen may be applied to individual plants or large areas, depending on plant densities. Ifdensities are low to moderate it may be more ecologically and economically feasible to treat individualplants. Greater densities may require broadcast methods. The treatment method must be selective ifdesirable plants are present and damage to these plants is undesirable.
Treatment methods must be applied in a logical sequence to take advantage of their respective strengthsand weaknesses. After the initial reclamation treatment, maintenance control measures are necessary. Maintenance treatments allow the production benefits of the initial treatment to remain near optimumindefinitely. For example, prescribed burning, low-energy grubbing, goating and individual planttreatments with herbicides (e.g. Brush Busters methods) can be used to extend the life of initialtreatments and to improve the economic benefits of the overall program.
Brush control options include mechanical, chemical, fire and biological methods. These are describedin publication B-5004, “Brush Management Methods,” available from Texas Cooperative Extension(tcebookstore.org). There is also an expert system called EXSEL(http://cnrit.tamu.edu/rsg/exsel/hist.html) designed to recommend the best mechanical and chemicalrange brush and weed control treatments in Texas for a broad array of brush and weed species.
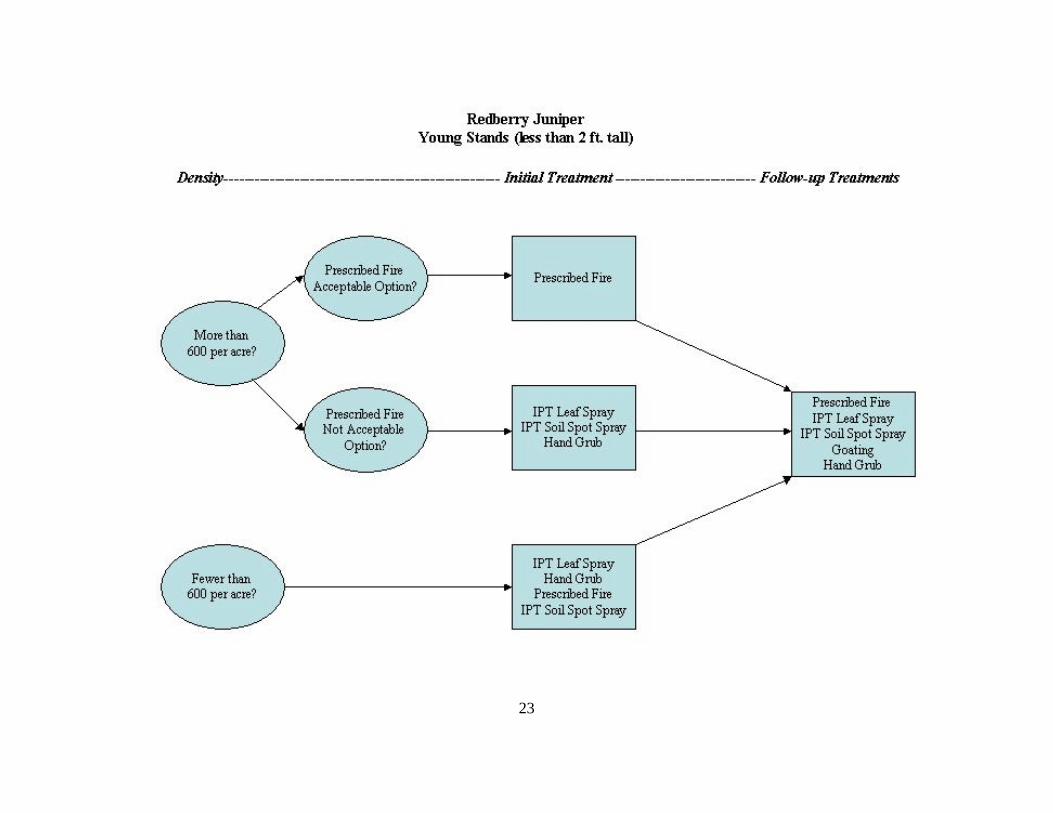
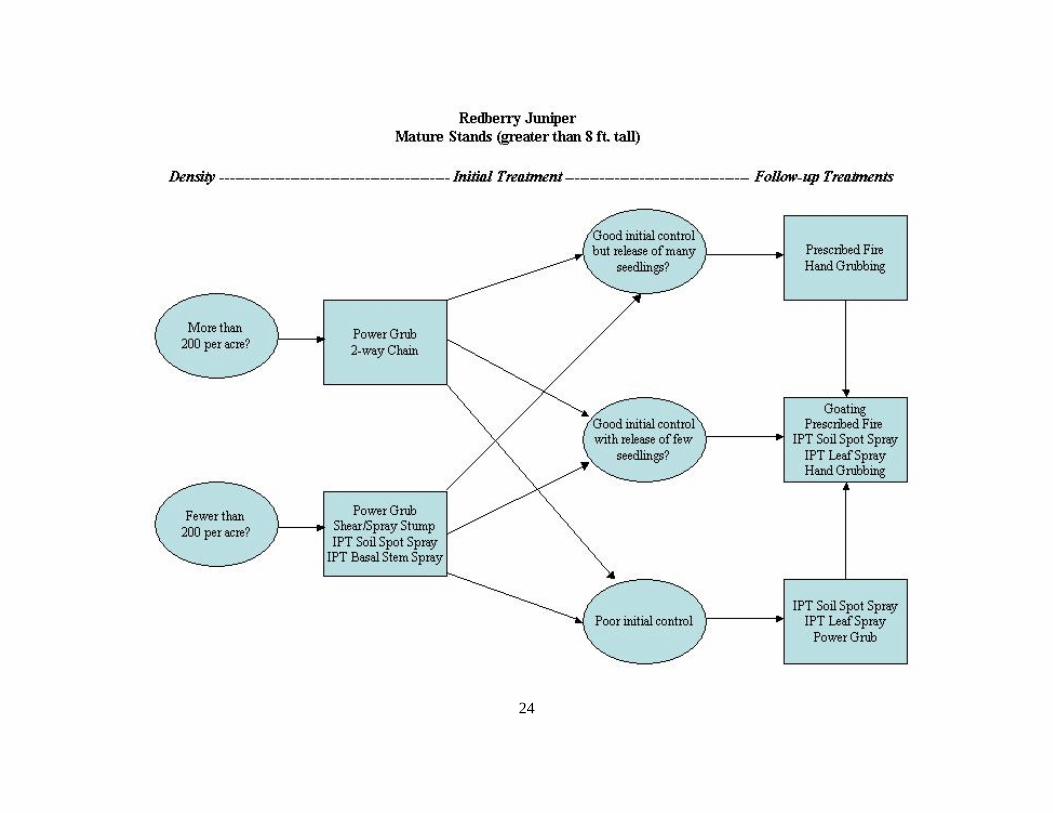
Brush Control Systems for Mesquite and Redberry Juniper
The target species for the Middle and Upper Concho Brush Control Program were mesquite andredberry juniper. Following are a series of flow charts showing the available treatment options andsequencing for various scenarios with these two plants. The flow charts provide both initial treatmentoptions and maintenance treatment options. The various mesquite control scenarios include: 1) standsdominated by mesquite less than 8 ft tall; 2) stands dominated by mesquite greater than 8 ft tall; and 3)mixed aged stands of mesquite. Redberry juniper brush control systems are illustrated for 1) standsdominated by plants less than 2 ft tall; 2) stands dominated by plants greater than 8 ft tall; and 3) mixedage stands.
23
24

25

26

27

28

29
Literature Cited
Hanselka, C. Wayne, Wayne T. Hamilton and Barron S. Rector. 1996. Integrated brush managementsystems for Texas. Texas Cooperative Extension, L-5164.
McGinty, Allan and Darrell N. Ueckert. 2001. The Brush Busters success story. Rangelands. Vol23(6):3-8.
Welch, Tommy G. 1991. Brush management methods. Texas Cooperative Extension, B-5004.
30
Specifications for Mesquite and Redberry Juniper Control Methods:If You Are Going To Do It, Do It Right
Darrell N. Ueckert, Regents Fellow & ProfessorTexas Agricultural Experiment Station, San Angelo, Texas
Allan McGinty, Professor & Extension Range Specialist Texas Cooperative Extension, San Angelo , Texas
Introduction
This paper has three major objectives. First, we recommend initial and follow-up controlpractices for mesquite and redberry juniper for State-funded Brush Control Projects in west-central Texas. All treatments recommended are known to be effective for control of thesespecies if applied correctly. Second, we provide specifications, in layman’s terms, on how toproperly and safely apply these treatments. Third, we provide suggestions for the sequencingand timing of these treatments to promote optimum watershed conditions, i.e., to prevent the re-establishment of mesquite and redberry juniper woodlands.
For each control method, this manual: 1) gives a general description of the proper use of themethod; 2) identifies equipment requirements; 3) suggests the best times of the year, plantconditions, or environmental conditions to apply the method; 4) describes the plant species,growth forms, and/or types of infestations for which the method is best suited; 5) outlinesquality control measures that must be met to achieve maximum treatment efficacy andconsistency; 6) discusses specific safety or environmental concerns; and 7) provides guidanceon how to properly time and sequence the method with other control methods for specificsituations. A primary consideration in selecting the most appropriate treatment alternative is thedensity (number of plants per acre) of the target plants. The final section of this paperdescribes two simple methods for estimating densities of mesquite and redberry juniper. Wepresent additional information and specifics on timing and sequencing the various brush controlprocedures in another paper in this proceedings entitled “Planning a Long-Term Brush ControlProgram”.
Ranchers are urged to avoid the “single-treatment” approach to brush management, i.e., do not rely upon one treatment method exclusively. The single-treatment approach has rarely resulted inacceptable long-term economic or ecological benefits to the ranching enterprise. The “integrated brush management systems” approach offers a much more economically andecologically sound alternative. The integrated brush management systems approach involveslong-range planning, careful selection of the most appropriate initial and follow-up treatmentsfor each type of brush infestation, and utilizing low-cost, ecologically sound follow-uptreatments that effectively extend the effective life of expensive, initial treatments.
31
Chaining (mesquite and redberry juniper)
Method Description: Chaining involves dragging a heavy anchor chain, usually 150 to 300 ftlong, in a loop behind two large crawler tractors. Swath width will vary from 85 to 150 ft,depending on the size of the crawler tractors and the size and density of the brush. The crawlertractors should be positioned sufficiently far apart to provide a maximum swath width, whilemaintaining an acceptable, constant forward speed. To kill mesquite and redberry juniper thechain must pull the plants from the soil and completely sever the roots below the bud zone.Double chaining, covering the same area twice in opposite directions, is the preferred methodand will usually break off nearly all of the above-ground growth of woody plants and will uprootfrom 10 to 80 percent of large trees, depending on soil moisture content (Scifres 1980).
Equipment Specifications: The heavier the anchor chain, the more effective the chain will be at uprooting trees, rather than simply riding over them. Anchor chains should weigh at least 80lb per ft. The size of the crawler tractor required will vary depending on length of chain pulledand size and density of the brush. D-8 to D-9 crawler tractors are usually needed for chainingdense stands of mature mesquite and redberry juniper.
Timing: Mesquite and redberry juniper can be chained any time of the year. The mostimportant factor determining proper timing for chaining is soil moisture. Good soil moisture iscritical for uprooting a high proportion of the mesquite and juniper plants, and thus for achievingan acceptable level of control. If mesquite and redberry juniper trees are chained when the soil isdry, most trees will simply break off at the soil surface and resprout profusely.
Works Best On: Trees that have basal stem diameters of 6 to 18 in. and stem densities lessthan 1000/acre.
Quality Control Concerns: Chaining should not be used where the trees are small, haveextreme multi-stemmed growth, or where the stems are too limber to be uprooted. If aprescribed fire is not used within a few years following chaining, it may be necessary to rakeand stack the downed timber following chaining to facilitate individual plant treatment ofresprouts. Chaining should not be used where pricklypear is abundant. The high soil moisturerequired for successful chaining will result in a high incidence of rooting of pricklypear padsbroken off and spread by chaining, and can significantly increase pricklypear plant density.
Safety/Environmental Concerns: When chaining pastures that may have colonies ofAfricanized bees, crawler tractors should be equipped with enclosed cabs to protect theoperators.
Treatment Sequencing: For both mesquite and redberry juniper, chaining is recommended asan initial treatment option only for stands dominated by large trees (mature or certain mixed agestands). Chaining alone usually offers only temporary benefits. But when followed byappropriate follow-up treatments it can significantly reduce stands of large brush at minimalcost.
32
Because both mesquite and redberry juniper are basal-crown sprouters, follow-up treatments arecritical. One of the most effective follow-up treatments after chaining mature stands of mesquiteis an individual plant leaf spray with a mixture of the herbicides Reclaim and Remedy (see IPTLeaf Spray below). This follow-up treatment should be applied 2 to 3 years following initialchaining. Aerial spraying with Remedy and Reclaim (see Aerial Herbicide Spray below) isanother option following chaining of mature mesquite, but the regrowth should be allowed toattain a height of 4 ft before the aerial spray is applied. Individual plant treatments such as powergrubbing, high-volume herbicide stem spray, or shearing and spraying the stump with herbicidewill not be very effective as follow-up treatments of mesquite after chaining due to breakage oftrunks by the chaining operation.
Following chaining of redberry juniper, potential maintenance treatments include prescribed fire,individual plant soil spot spray (Velpar L) or leaf spray (Tordon 22K), hand grubbing andgoating (see specifications on these methods below). The most applicable follow-up treatmentand its timing will depend on the level of control achieved with the initial chaining treatment,the abundance of mesquite or redberry juniper seedlings, the relative proportions of seedlings vs.resprouts in the treated area, and the growth rates of these seedlings and resprouts.
Power Grubbing (mesquite and redberry juniper)
Method Description: Power grubbing is one of the oldest methods for woody plant control, andis very effective for control of mesquite and redberry juniper. Both mesquite and redberryjuniper are crown sprouters. To effectively kill either of these species, the plant must be severedbelow the lowest dormant basal bud, which is usually a few inches to a foot or more beneath thesoil surface. The plant is removed from the soil using a grubbing implement, usually a blade,which penetrates the soil and severs the plant below the lowermost dormant bud. Powergrubbing uses mechanized power and/or hydraulics to force the blade through the soil and tosever the plant roots.
Equipment Specifications: A variety of grubbing implements are available that can be attachedto rubber-tired farm tractors or loaders, crawler dozers, skid-loaders, track loaders, orexcavators.
Timing: Mesquite and redberry juniper can be grubbed any time of the year as long as there issufficient soil moisture to allow plants to be grubbed deeply enough to completely remove thebasal buds. The power requirements for grubbing increase in most soils as the soils becomedrier, thus the efficiency of grubbing decreases and cost for grubbing usually increases as soilsbecome drier.
Works Best On: Power grubbing is most effective on sites where mesquite or redberry juniperare of moderate densities and are large enough for the operator to easily see them. Thehorsepower of the grubber will determine the maximum size of plant that can be grubbed. Power grubbing will not be effective if the terrain is excessively steep or rocky. Sites with

33
heavy clay soils will be extremely difficult to properly grub if soil moisture is low. Mesquiteand redberry juniper growing in deep sandy soils are often very difficult to grub effectivelybecause deep accumulations of soil around the bases of plants increases the depth requirementfor grubbing. The efficiency of grubbing implements and thus the cost to grub mesquite orredberry juniper will vary widely depending on size of the plants, size and horsepower of thegrubber, stand density, type of growth, soil texture and soil moisture. Cost for grubbingbecomes excessive where densities of redberry juniper or mesquite are extremely high.
Quality Control Concerns: Mesquite and redberry juniper must be grubbed below the budzone to kill the plant. A properly grubbed plant will be severed below the first lateral root. Grubbing blades should be sharpened or replaced when they become dull and blunt. With powergrubbing, fewer plants will usually be missed or severed above the bud zone by operators onequipment that provides the operator good visibility of the grubbing blade and the target plants,such as track loaders, skid loaders, excavators. Good operator visibility of the target plants andthe grubbing blade also minimizes the amount of soil disturbance and damage to grass cover during the grubbing operation.
Safety/Environmental Concerns: Power grubbing using tracked vehicles will cause significantsoil disturbance. If tracked grubbers are used, debris left by grubbing should be left in place toavoid accelerated soil erosion. Grubbing implements mounted on tracked excavators generallyresult in much less soil disturbance as compared to tracked dozers. Rubber-wheeled grubbersgenerally result in less soil disturbance as compared to tracked dozers. The soil depressionscreated by grubbing increase surface roughness, which is desirable because it increases on-siterainfall retention.
Power grubbing should be used with caution where pricklypear is abundant. The high soilmoisture generally required for efficient and successful power grubbing will often result in therooting of pricklypear pads broken off and spread by grubbing. Power grubbing cansignificantly increase pricklypear plant density.
When power grubbing pastures that may have colonies of Africanized bees, power grubbersshould be equipped with enclosed cabs to protect the operator.
Treatment Sequencing: For mesquite, power grubbing can be used as an initial or follow-uptreatment, depending on the type of stand and plant density. For young stands (less than 8 fttall), low-energy power grubbing is an option if plant density is less than about 400mesquite/acre. Mature stands of mesquite (greater than 8 ft tall) can be economically powergrubbed as an initial treatment if mesquite density is less than approximately 150 plants/acre. Larger horsepower grubbers will be required for trees this size. For greater densities, it isgenerally more cost efficient to use other treatment options. When treating mixed age stands ofmesquite, power grubbing is best used as an initial treatment to control larger plants (over 8 fttall) if their density is less than 150 plants/acre or as a follow-up treatment to kill trees thatsurvive aerial spraying as an initial treatment.
For redberry juniper, power grubbing is an initial treatment option for both mature and mixedage stands.

34
Hand Grubbing (mesquite and redberry juniper)
Method Description: The seedlings and saplings of mesquite and redberry juniper can beeffectively killed by hand grubbing. Even young plants are crown sprouters, and to effectivelykill either of these species, the plant must be removed below the lowest dormant bud, which isone to several inches below the soil surface. Hand grubbing is therefore applicable to use onseedlings or very young mesquite and redberry juniper that have shallow bud zones that can beeasily cut below the first lateral root using manual labor. Hand grubbing is not usually feasibleon rocky soils.
Equipment Specifications: The grubbing hoe has been the implement most commonly used tohand grub mesquite or redberry juniper, but a modified sharp-shooter spade equipped with a 5-ftlong handle made from 1.5 in. od steel pipe has recently been found to be highly effective andmuch more user friendly (D.N. Ueckert, personal experience). The grubbing hoe or spadeshould be sharpened several times daily.
Timing: Mesquite and redberry juniper can be grubbed anytime of the year as long as there issufficient soil moisture to allow plants to be grubbed deeply enough to remove the dormantbuds. Grubbing or spading of small mesquite and juniper will be less stressful on workers ifdone during the cooler seasons.
Works Best On: Hand grubbing is restricted to very young plants that have shallow bud zones.For mesquite this means seedlings or saplings with basal stem diameters of less than 2 in. Redberry junipers up to about knee height can also be hand grubbed effectively with minimaleffort. Cost becomes a limiting factor when using this treatment on high densities of mesquite orredberry juniper.
Quality Control Concerns: Mesquite and redberry junipers must be grubbed below the budzone to kill the plant. A properly grubbed plant will be severed below the first lateral root. Plantmortality will be 100% for young mesquite and redberry junipers properly grubbed.
Safety/Environmental Concerns: There are no specific safety concerns with this method otherthan maintaining body fluid levels when working on hot days and the normal precautionsrequired when using sharp implements.
Treatment Sequencing: Hand grubbing mesquite is limited to control of seedling and saplings. Once past the seedling or sapling stage, the depth of the bud zone deepens below the soil surfaceand root diameters increase, reducing the efficiency of hand grubbing.
Somewhat older redberry juniper plants can be hand grubbed as long as they are not over kneehigh. Because of the flush of seedlings following some initial treatments, hand grubbing is anexcellent follow-up practice, especially if low-cost prison labor is available.
35
Shear/Spray Stump (mesquite and redberry juniper)
Method Description: Shearing and immediately spraying the stump is a very effectiveindividual plant treatment for mesquite and redberry juniper. Shearing removes the top growth,while spraying the remaining stump with herbicide kills the dormant buds and roots. Whendone correctly, root kills in excess of 90% can be expected.
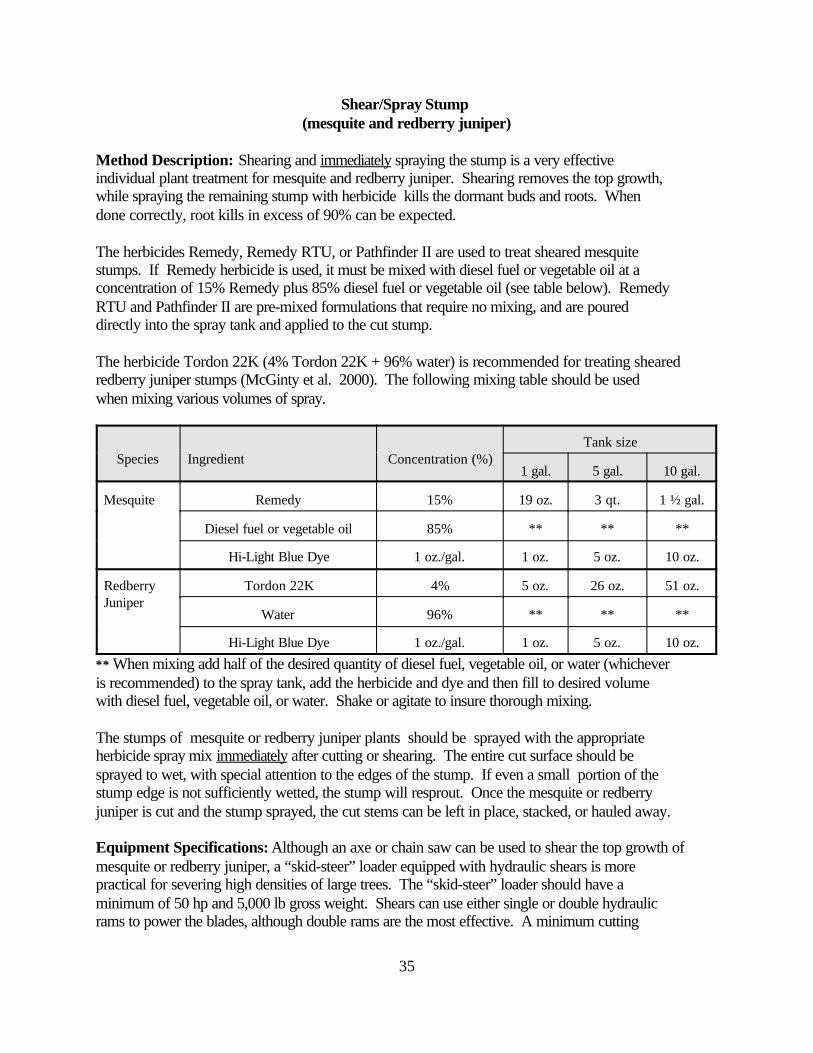
The herbicides Remedy, Remedy RTU, or Pathfinder II are used to treat sheared mesquitestumps. If Remedy herbicide is used, it must be mixed with diesel fuel or vegetable oil at aconcentration of 15% Remedy plus 85% diesel fuel or vegetable oil (see table below). RemedyRTU and Pathfinder II are pre-mixed formulations that require no mixing, and are poureddirectly into the spray tank and applied to the cut stump.
The herbicide Tordon 22K (4% Tordon 22K + 96% water) is recommended for treating shearedredberry juniper stumps (McGinty et al. 2000). The following mixing table should be usedwhen mixing various volumes of spray.
Species Ingredient Concentration (%)Tank size
1 gal. 5 gal. 10 gal.
Mesquite Remedy 15% 19 oz. 3 qt. 1 ½ gal.
Diesel fuel or vegetable oil 85% ** ** **
Hi-Light Blue Dye 1 oz./gal. 1 oz. 5 oz. 10 oz.
RedberryJuniper
Tordon 22K 4% 5 oz. 26 oz. 51 oz.
Water 96% ** ** **
Hi-Light Blue Dye 1 oz./gal. 1 oz. 5 oz. 10 oz.
** When mixing add half of the desired quantity of diesel fuel, vegetable oil, or water (whicheveris recommended) to the spray tank, add the herbicide and dye and then fill to desired volumewith diesel fuel, vegetable oil, or water. Shake or agitate to insure thorough mixing.
The stumps of mesquite or redberry juniper plants should be sprayed with the appropriateherbicide spray mix immediately after cutting or shearing. The entire cut surface should besprayed to wet, with special attention to the edges of the stump. If even a small portion of thestump edge is not sufficiently wetted, the stump will resprout. Once the mesquite or redberryjuniper is cut and the stump sprayed, the cut stems can be left in place, stacked, or hauled away.
Equipment Specifications: Although an axe or chain saw can be used to shear the top growth ofmesquite or redberry juniper, a “skid-steer” loader equipped with hydraulic shears is morepractical for severing high densities of large trees. The “skid-steer” loader should have aminimum of 50 hp and 5,000 lb gross weight. Shears can use either single or double hydraulicrams to power the blades, although double rams are the most effective. A minimum cutting

36
blade length of 16 in. is recommended.
To spray cut stumps when using a “skid-steer loader” the spray nozzle is usually mounteddirectly behind the cutting blades. The spray system also includes an on-board spray tank and12-volt, electric pump. An adjustable cone nozzle with a large orifice, such as the ConeJet5500-X12 (Spraying Systems Co.) or greater is recommended. When using a spray nozzleattached directly to the tree shear, after cutting, the nozzle should be positioned directly over thecut stump at a height that insures the entire stump is included in the spray pattern. Someoperators successfully use a hand-held spray wand with an adjustable cone nozzle, such as theConeJet 5500-X3 or X5, from within the loader cab to spray the severed stumps.
Timing: Mesquite and redberry juniper can be sheared and the stump sprayed anytime of theyear, although spring-summer treatments will often provide the highest level of control.
Works Best On: Shearing with “skid-steer” loader-mounted hydraulic shears followed byspraying will be most effective and efficient on plants with a minimum 3 to 4 in. trunk diameter. As the number of basal stems increase, the difficulty of using this method will increase. Handcutting with loping shears, axes or chain saws may be more appropriate for smaller plants.
Quality Control Concerns: Cut stumps should be sprayed immediately after cutting. Theyshould not be sprayed if the cut surface is wet or covered with soil. All inside edges of thestump should be sprayed to wet, to prevent re-sprouting. For mesquite, the bark from the cut tothe soil surface should also be sprayed to wet.
Safety/Environmental Concerns: Chemical resistant gloves and safety glasses should be usedwhen mixing the herbicides with water or diesel. When applying the spray mix wear a long-sleeve shirt and long pants, shoes with socks and chemical resistant gloves. Wash all clothingworn during applications separately from other laundry. When operating in pastures that mayhave colonies of Africanized bees, the “skid-steer” loader should be equipped with an enclosedcab to protect the operator. Tordon 22K applications are limited by label to 1 quart/acre/year. APesticide Applicator License from the Texas Department of Agriculture is required to purchaseor use Tordon 22K. Carefully read and understand the labels of Remedy and Tordon 22K beforeusing these products. Treatment Sequencing: Shearing and spraying the stump can be used as an initial treatment forlight to moderate densities of mixed age or mature mesquite or redberry juniper. When treatingmixed-age stands, small mesquite that are not efficiently controlled by this method can be treatedwith an individual plant leaf spray, stem spray, or by hand grubbing. Small juniper can beindividual plant leaf sprayed, soil spot sprayed, hand grubbed or controlled with prescribed fire. Always sequence this treatment before the use of prescribed fire or any other treatment that mayonly top-kill plants and result in prolific resprouting and multi-stemmed plants.

37
Individual Plant Treatment (IPT) Leaf Spray (mesquite and redberry juniper)
Method Description: Mesquite and redberry juniper can be controlled (76% to 100% rootkill)by spraying the leaves of individual plants with herbicide. A 1% concentration of the herbicideTordon 22K is used to spray redberry juniper. A mixture containing ½ % Remedy + ½ %Reclaim is used to spray mesquite (see mixing table below). When leaf spraying individualmesquite or redberry juniper plants, wet all the foliage of each plant until the leaves are almost tothe point of dripping (McGinty et al. 2000).
Species Ingredient** Concentration (%)Tank size
3 gal. 14 gal. 25 gal.
Mesquite Remedy 1/2% 2 oz. 9 oz.. 16 oz.
Reclaim 1/2% 2 oz. 9 oz.. 16 oz.
Surfactant 1/4% 1 oz. 5 oz. 8 oz.
Hi-Light Blue Dye 1/4 - 1/2% 1-2 oz. 5-9 oz. 8-16 oz.
Redberry Juniper Tordon 22K 1% 4 oz. 18 oz. 32 oz.
Surfactant 1/4% 1 oz. 5 oz. 8 oz.
Hi-Light Blue Dye 1/4 - 1/2% 1-2 oz. 5-9 oz. 8-16 oz.
** All spray solutions are mixed in water.
Equipment Specifications: Small pump-up garden sprayers, backpack sprayers, cattle sprayersor sprayers with 12-volt diaphragm electric pumps mounted on 4-wheel all-terrain vehicles(ATV’s) work well for applying leaf sprays to mesquite and redberry junipers. Backpacksprayers are usually the most efficient if only a few plants are to be treated, while ATV sprayersbecome more efficient for large acreages or as the distance between plants increase. The sprayershould have an adjustable cone nozzle, such as a Conejet 5500-X8 capable of delivering a coarsespray (large droplets) to the top of an 8-ft tall tree.
Timing: Leaf spraying of mesquite can begin in the spring, after the soil temperature at 12 to 18in. deep has reached 75o F. and mesquite leaves have changed color from a light pea green to auniform dark green. Spraying can continue through September. Redberry juniper can be leafsprayed any time during the year except during extremely cold weather.
Works Best On: Mesquites that are bushy or single stemmed, have few to many stems at groundlevel, and are less than 8 ft tall. The individual plant leaf spray works best on redberry juniperthat are less than 3 ft tall. Cost becomes a limiting factor when using this treatment on highdensities of mesquite or redberry juniper.
Quality Control Concerns: Surfactant (commercial or liquid dishwashing detergent) shouldalways be added to the spray mix to ensure thorough wetting of the leaves with the herbicide

38
spray. Do not apply leaf sprays to mesquite plants that have been top killed by hand cutting, fire,mechanical methods or herbicide treatment for at least two years. Do not spray mesquite whenrains have stimulated light green new growth in the tree tops. Do not spray mesquite or redberryjuniper when the leaves are wet, or when the foliage is damaged from hail, insects or disease.
Always add a dye, such as Hi-Light Blue Dye, to the spray mix. Dyes aid in identification ofsprayed plants and insure complete herbicide spray coverage of individual plants.
Safety/Environmental Concerns: Chemical resistant gloves and safety glasses should be usedwhen mixing the herbicides with water. When applying the herbicide spray mix wear a long-sleeve shirt and long pants, shoes with socks and chemical resistant gloves. Wash all clothingworn during applications separately from other laundry.
Tordon 22K applications are limited by label to 1 qt/ac/yr. Do not spray the herbicide Tordon22K within 100 ft of known sinkholes or fractures that would allow the herbicide to enterunderground water aquifers. Do not treat large numbers of small junipers growing beneath thecanopies of valuable trees such as live oak or pecan because these trees may be damaged orkilled by root uptake of Tordon 22K. A Pesticide Applicator License from the Texas Departmentof Agriculture is required to purchase or use Tordon 22K.
Reclaim applications are limited by the herbicide label to 1 1/3 pint/acre/year.
Do not spray any of the leaf spray mixes immediately upwind of desirable trees, shrubs or crops.
Carefully read and understand the labels of Remedy, Reclaim, and Tordon 22K before usingthese products. Treatment Sequencing: The individual plant leaf spray for mesquite is best used as an initialtreatment option for young stands of mesquite when plant density is less than 400 trees/acre andwhere most of the trees are less than 8 ft tall. This treatment method is also effective as amaintenance treatment following aerial herbicide applications, chaining or power grubbing ofmixed age stands or mature stands of mesquite.
The individual plant leaf spray for redberry juniper is normally restricted to plants less than 3 fttall. Treatment cost escalates rapidly as plants become larger. Because of this restriction thismethod is best suited as an initial treatment for young stands when plant density is less than 600redberry junipers/acre. The individual plant leaf spray is also an excellent maintenancetreatment to kill redberry juniper re-sprouts and new seedlings following various initial controltreatments.

39
Individual Plant Treatment (IPT) Stem Spray (mesquite)
Method Description: Smooth barked mesquite can be controlled (76% to 100% rootkill) byspraying the basal stems of individual plants with herbicide. The herbicides Remedy, RemedyRTU, or Pathfinder II are used to treat mesquite basal stems. If Remedy is used, it must bemixed with diesel fuel or vegetable oil at a concentration of 15% Remedy plus 85% diesel fuelor vegetable oil (see mixing table below). Remedy RTU and Pathfinder II are pre-mixedformulations (with vegetable oil) requiring no mixing, that are poured directly into the spraytank and applied to the mesquite stems. The diesel fuel or vegetable oil serves as a penetrant tomove the Remedy herbicide through the mesquite bark.
When stem spraying individual mesquite plants, wet the entire circumference of each basal stem,but not to the point of runoff, from ground-line to a height of 12 to 16 in.
Species Ingredient Concentration (%)Tank size
1 gal. 2 gal. 4 gal.
Mesquite Remedy 15 % 19 oz. 38 oz. 76 oz.
Diesel fuel orvegetable oil
85 % ** ** **
** Add Remedy to mixing container, then fill to volume with diesel fuel or vegetable oil, andagitate thoroughly.
Equipment Specifications: A small pump-up garden sprayer can be used although backpacksprayers work best for treating mesquite basal stems. The spray gun and wand should bemodified by adding a ConeJet 5500-X1 (Spraying Systems Co.) nozzle. Adjust the nozzle so itdelivers a mist in a narrow, cone-shaped pattern. Hold the nozzle tip about 1 in. from themesquite stem while spraying. A 100- mesh screen and check valve should be placed behind thenozzle to prevent clogging and dripping.
Timing: Mesquite can be stem sprayed anytime of the year, although spring and summerapplications are most effective.
Works Best On: This method is best suited for control of smooth barked mesquite with fewbasal stems. Cost becomes a limiting factor when using these treatments on high densities ofmesquite.
Quality Control Concerns: When treating mesquite, the entire circumference of all basal stemsmust be wetted with the herbicide spray, or the plant will not be killed. This method will not behighly effective for control of plants that have many basal stems or plants that have a denseunderstory of grass or weeds. The stem spray should not be used if basal stems are wet fromrain or dew. A significant drop in mesquite plant mortality should be expected if this method isused in the fall.

40
Safety/Environmental Concerns: Chemical resistant gloves and safety glasses should be usedwhen mixing the herbicide with diesel or vegetable oil. When spraying these mixtures in thefield, long-sleeve shirts, long pants, shoes with socks and chemical resistant gloves should beworn. Wash all clothing worn during applications separately from other laundry.
Read and understand the labels of Remedy, Remedy RTU, and Pathfinder II before using theseproducts. Treatment Sequencing: The individual plant stem spray for mesquite is best suited as an initialtreatment option for young stands (undisturbed seedlings and saplings) of mesquite (smoothbark), with few basal stems, when plant density is less than 400 trees/acre. This treatmentmethod is also effective as a maintenance treatment following initial treatment of young ormixed stands and for control of new seedlings that emerge and establish following any initialcontrol treatment.
Individual Plant Treatment (IPT) Basal Stem Spot Spray (redberry juniper)
Method Description: Undiluted Tordon 22K is used to treat the basal stems of redberry juniper. Rainfall is necessary to move Tordon 22K herbicide into the soil where it may be taken up byjuniper roots.
When stem spraying redberry juniper, apply undiluted Tordon 22K to the stem base at or nearthe ground line. Use 4 ml of Tordon 22K per 3 ft of tree height or canopy diameter, whichever isgreater. If plant size requires more than a single 4 ml application, place subsequent applicationsequally around the plant stems (McGinty et al. 2000).
Equipment Specifications: When treating redberry juniper basal stems with undiluted Tordon22K, use an exact delivery handgun applicator or automatic syringe capable of delivering precise4 ml doses. The exact delivery handgun or automatic syringe can be attached directly to theherbicide container or to a 3-qt sheep drench bladder.
Timing: Redberry juniper is best treated spring through fall, before expected rainfall.
Works Best On: This method is best suited for control of low densities of redberry juniper. Cost becomes a limiting factor when using this treatment on high densities of redberry juniper.
Quality Control Concerns: When using the basal stem spray to control redberry juniper theherbicide must be placed on the stem base near the soil surface. This may be difficult because ofoverhanging branches. Ease of application can be improved by attaching a 4-ft length of 1/16-in.i.d. copper tubing to the end of the automatic syringe or exact delivery handgun. Insert the tubethrough the plant canopy to make the herbicide application to the basal stem.
Safety/Environmental Concerns: When spraying Tordon 22K in the field, long-sleeve shirts,long pants, shoes with socks and chemical resistant gloves should be worn. Wash all clothing
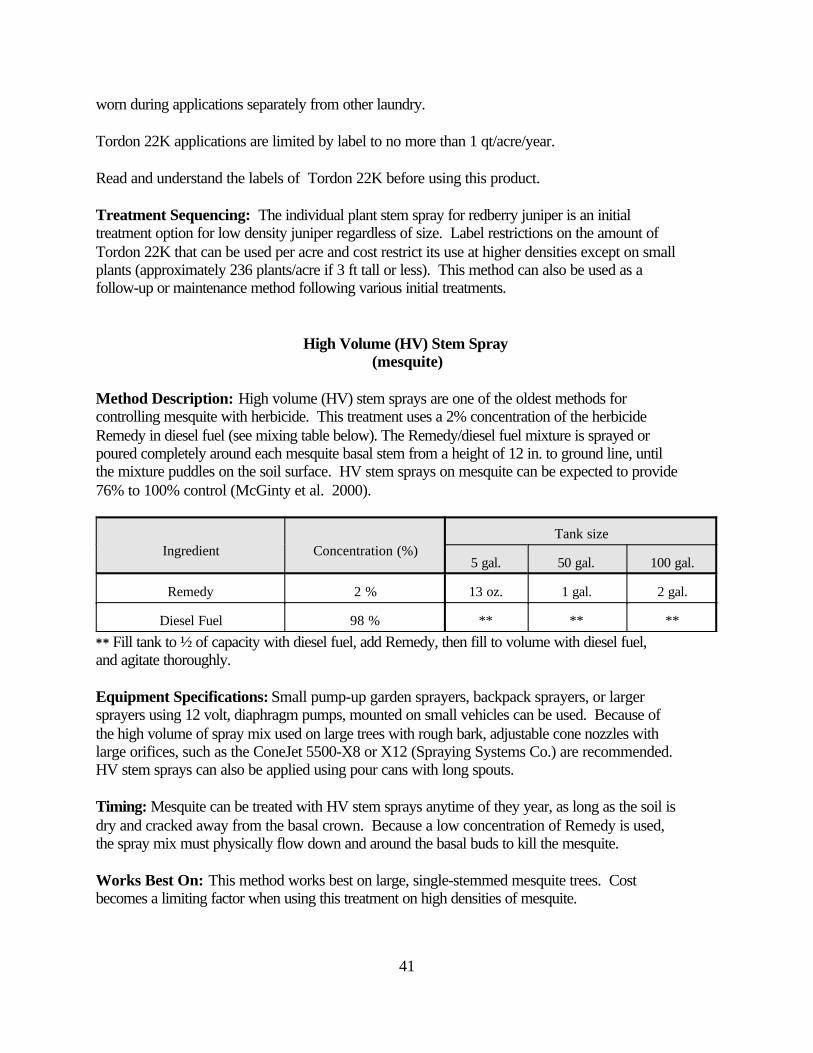
41
worn during applications separately from other laundry.
Tordon 22K applications are limited by label to no more than 1 qt/acre/year.
Read and understand the labels of Tordon 22K before using this product. Treatment Sequencing: The individual plant stem spray for redberry juniper is an initialtreatment option for low density juniper regardless of size. Label restrictions on the amount ofTordon 22K that can be used per acre and cost restrict its use at higher densities except on smallplants (approximately 236 plants/acre if 3 ft tall or less). This method can also be used as afollow-up or maintenance method following various initial treatments.
High Volume (HV) Stem Spray (mesquite)
Method Description: High volume (HV) stem sprays are one of the oldest methods forcontrolling mesquite with herbicide. This treatment uses a 2% concentration of the herbicideRemedy in diesel fuel (see mixing table below). The Remedy/diesel fuel mixture is sprayed orpoured completely around each mesquite basal stem from a height of 12 in. to ground line, untilthe mixture puddles on the soil surface. HV stem sprays on mesquite can be expected to provide76% to 100% control (McGinty et al. 2000).
Ingredient Concentration (%)Tank size
5 gal. 50 gal. 100 gal.
Remedy 2 % 13 oz. 1 gal. 2 gal.
Diesel Fuel 98 % ** ** **
** Fill tank to ½ of capacity with diesel fuel, add Remedy, then fill to volume with diesel fuel,and agitate thoroughly.
Equipment Specifications: Small pump-up garden sprayers, backpack sprayers, or largersprayers using 12 volt, diaphragm pumps, mounted on small vehicles can be used. Because ofthe high volume of spray mix used on large trees with rough bark, adjustable cone nozzles with large orifices, such as the ConeJet 5500-X8 or X12 (Spraying Systems Co.) are recommended.HV stem sprays can also be applied using pour cans with long spouts.
Timing: Mesquite can be treated with HV stem sprays anytime of they year, as long as the soil isdry and cracked away from the basal crown. Because a low concentration of Remedy is used,the spray mix must physically flow down and around the basal buds to kill the mesquite.
Works Best On: This method works best on large, single-stemmed mesquite trees. Costbecomes a limiting factor when using this treatment on high densities of mesquite.

42
Quality Control Concerns: HV stems sprays should not be used on plants with multiple basalstems. This method will provide poor control if the soil is moist or if an insufficient volume ofspray mix is applied per individual tree to adequately wet the basal crown area.
Safety/Environmental Concerns: Chemical resistant gloves and safety glasses should be usedwhen mixing the herbicides with diesel. When spraying these mixtures in the field, long-sleeveshirt and long pants, shoes with socks, and chemical resistant gloves should be worn. Wash allclothing worn during applications separately from other laundry.
Read and understand the label of Remedy herbicide before using this product. Treatment Sequencing: The HV stem spray is recommended either as an initial or follow-uptreatment for mature stands of mesquite. The maximum threshold for use as an initial treatmentis approximately 150 plants/ac. The HV stems spray is also a treatment option following aerialspraying of mature or mixed age stands.
Individual Plant Treatment (IPT) Soil Spot Spray (redberry juniper)
Method Description: This method uses either the herbicide Velpar L (McGinty et al. 2000) orPronone Power Pellets. Velpar L is a liquid containing the active ingredient hexazinone. Pronone Power Pellets are dry tablets containing the same active ingredient. Velpar L is appliedundiluted to the soil surface under individual redberry juniper trees. Pronone Power Pellets areplaced by hand in the same manner. Placement for both should be midway between the juniperbasal stems and the canopy edge. The amount of herbicide used will vary depending on plantsize (see rate table below). If plant size requires more than a single 2-ml application of Velpar Lor one Pronone Power Pellet, subsequent applications should be spaced equally around the plant. On slopes, apply most of the herbicide on the uphill side of the stem. Hi-Light Blue Dye can beadded to Velpar L (1 oz/gal.) to aid in identification of treated plants. Rainfall is necessary tomove the active ingredient in these herbicides into the soil where it may be taken up by juniperroots.
Juniper Height or CanopyDiameter (which ever is
greatest)
Herbicide
Velpar L* Pronone Power Pellets
less than 6 ft. 2 ml for every 3 ft of heightor canopy diameter(whichever is greater).
1 pellet for every 3 ft ofheight or canopy diameter(whichever is greater).
greater than 6 ft. 4 ml for every 3 ft of heightor canopy diameter(whichever is greater).
2 pellets for every 3 ft ofheight or canopy diameter(whichever is greater).
* Hi-Light Blue dye can be added to Velpar L (1 oz/gal.) to aid in identification of treatedplants.

43
Redberry juniper treated with Velpar L or Pronone Power Pellets die slowly, depending on theamount of rainfall received following application. Two to three years may lapse before finalrootkill is obtained.
Users seeking the least cost herbicide for the redberry juniper soil spot spray will choose theherbicide Velpar L. Users seeking convenience of application may choose the Pronone PowerPellets.
Equipment Specifications: Soil spot sprays using Velpar L should be applied with an exact-delivery handgun. This equipment is available from most herbicide retail outlets.The handgundelivers a thin stream of predetermined volume when triggered. Adjust the handgun to deliver 2ml (cc) for each pull of the trigger. Inexpensive automatic syringes obtained from animal healthcare outlets can also be used, although they will have to be replaced frequently. Whicheverapplication device is used, it should be thoroughly cleaned immediately after use. Do not cleanthis equipment near water wells or desirable plants.
Chemical resistant gloves should be worn when applying Pronone Power Pellets.
Timing: The best time to use this method is late winter through mid-spring (ideally beforeexpected rainfall).
Works Best On: Redberry juniper less than 6 ft tall. Cost becomes a limiting factor when usingthis treatment on high densities of large redberry juniper.
Quality Control Concerns: This method should not be used on clay soils. Clay immobilizesthe active ingredient hexazinone and prevents its absorption by the target plant. This methodwill provide unsatisfactory results if used on plants that have been recently top killed unless theapplication rate is adjusted to original plant size. To obtain maximum efficacy, both Velpar Land Pronone Power Pellets should be applied to the soil surface and not on top of rocks, organicdebris, grass or weeds beneath the target plant.
The active ingredient in Velpar L and Pronone Power Pellets is non-selective. Grass and weedswill be killed where each spot of herbicide is applied. Grass recovery may take 2 to 3 years.
Neither of these herbicides should be used close to desirable trees or shrubs. A minimum buffer(untreated) zone of 3 times the height or canopy diameter (whichever is greater) of desirabletrees should be maintained between treated areas and the desirable trees. If treating up slopefrom desirable trees or shrubs, this buffer should be increased significantly.
Rodents may carry Pronone Power Pellets to their nests or burrows, reducing the efficacy of thismethod and potentially damaging desirable plants near the rodent den.
Safety/Environmental Concerns: If 600 to 5,000 Pronone Power Pellets are used per acre,livestock grazing is restricted for 60 days. If more than 5,000 Pronone Power Pellets are usedper acre, grazing is restricted for a year. Velpar L applications are limited to 1/3 gal./acre/year.

44
Applicators using either herbicide should wear long-sleeved shirts and long pants, shoes plussocks, waterproof gloves and protective eye wear. Wash all clothing worn during applicationsseparately from other laundry.
Read and understand the label of Velpar and Pronone Power Pellets before using these products.
Treatment Sequencing: The soil spot spray is an initial treatment option for low densityjuniper regardless of size. Label restrictions on the amount of Velpar L or Pronone PowerPellets used per acre and cost restrict its use at higher densities except on small plants(approximately 600 plants/acre if 3 ft tall or less). This method can also be used as a follow-upor maintenance method following initial treatment of redberry juniper.
Aerial Herbicide Spray (mesquite)
Method Description: Aerial broadcast herbicide sprays are usually the most cost-effectivemethod to treat large acreages with moderate to dense infestations of mesquite. The mosteffective aerial herbicide spray treatment for mesquite is a mixture of the herbicides Reclaimand Remedy. The recommended rate is 1/4 lb a.i./acre of each herbicide (½ pt Remedy + 2/3 ptReclaim/acre) (McGinty et al. 2000). The herbicides are applied in a 1:5 oil:water emulsioncarrier. The oil should be diesel or No. 2 fuel oil. A minimum of 1 oz of emulsifer per gallon ofdiesel or No. 2 fuel oil is used to create the oil:water emulsion. A drift retardant should be addedto the spray mix to increase spray droplet size and to maximize deposition of the spray solutionon the target area.
A minimum of 4 gal. total spray volume per acre should be used during the application. Windspeed should be between 2 and 10 mph. For optimum coverage of the mesquite leaf canopy,especially when the canopy is very dense, wind speed should be between 5 and 10 mph.Individual spray passes are flown perpendicular to the wind. Applications should be made whenrelative humidity is above 50% and air temperature is below 95° F (DowElanco 1990).
Equipment Specifications: All aerial applications for mesquite control must be flown bycommercial, Texas Department of Agriculture certified, aerial applicators. Fixed wing or rotarywing aircraft can be used. Aircraft should be equipped with GPS guidance systems to reducestreaking of the sprayed area and to provide a permanent log of each application. Airplane speedshould not exceed 120 mph during applications.
Timing: Spraying can begin in the spring after soil temperatures at 12 to 18 in. exceed 75o F. This can occur as early as 40 to 45 days after bud break and coincides with the change in themesquite canopy from a pea green color to a dark green color. The spray season then continuesfor approximately 60 days, as long as soil temperatures remain above 75o F. For West Texas,Texas Tech University researchers recommend spraying during the period 42 to 63 days afterbud break, or 72 to 84 days after bud break, if soil temperatures are above 75o F (Dahl andSosebee 1984).

45
Works Best On: This method works best on moderate to high density mesquite, with full,healthy leaf canopies. This method should not be used on mesquite that has been previously topkilled until the regrowth is about 4 ft tall.
Quality Control Concerns: To achieve maximum efficacy and consistency from aerialapplications to control mesquite the following criteria should be met:
1) Aircraft calibrated to deliver 4 gal./acre total volume or greater.2) Aircraft speed less than 120 mph.3) Spray mix contains the proper quantity of herbicide, diesel fuel, water, emulsifier anddrift retardant.4) Spraying conducted under proper climatic conditions (2 to 10 mph wind speed, over50% relative humidity and air temperature less than 95° F. 5) Soil temperature 75o F or greater at 12 to 18 in. deep (preferable 80° F or higher).6) Mesquite carbohydrate flow is from leaf canopy to below ground basal bud zone(generally occurs 40 to 100 days following bud break).7) Mesquite pods (if present) should be fully elongated.8) Mesquite leaf canopy healthy and full and not drought stressed (leaves yellow, leafmargins and tips necrotic or leaves dropping).9) If significant rainfall occurs during the spray period, do not spray if light green, newgrowth is observed in twig tips.10) Mesquite leaf canopy with less than 25% damage due to hail, insects or disease.11) Mesquite flowers (if present) should be yellow (not white).
Safety/Environmental Concerns: The most significant safety/environmental concern withaerial applications is off-target drift of the herbicide spray. The use of large spray droplets, driftretardants and spraying only under the defined climatic conditions will reduce but not eliminatedrift. The following table provides general guidelines for protection of susceptible plants fromspray drift (Welch and Hyden 1996).
When wind velocityis
Spray no closer than
Downwind Upwind
0 to 3 mph 1 mile ½ mile
4 to 6 mph 2 miles 1/8 mile
7 to 10 mph 4 miles 250 ft
Treatment Sequencing: Aerial spraying is an initial treatment option for moderate to highdensity mesquite. The density threshold that triggers the use of aerial spraying will varydepending on the size of the mesquite, but in general if there are over 400 mesquite/acre foryoung stands (less than 8 ft tall), or over 150 mesquite/acre that are greater than 8 ft tall, aerialspraying should be considered as a treatment option. Aerial spraying may also be a viablefollow-up treatment following aerial herbicide or chaining treatments which do not meetmanagement objectives relative to plant kill.

46
Prescribed Fire (mesquite and redberry juniper)
Method Description: Fire was a natural ecological factor on most Texas rangelands beforeEuropean settlement. Fire effectively suppresses most woody plants while encouraging grassgrowth (White and Hanselka 1989). Prescribed fire differs from wildfires in that prescribedrange burning follows guidelines that establish the conditions and manner under which fire willbe applied on a specific area to accomplish specific management and ecological objectives.
The first step in conducting a prescribed burn is to develop a written burn plan. This planincludes but is not limited to the following items:
1) Pre-burn grazing management to allow adequate fuel build-up.2) Equipment and personnel needs.3) Identification of land unit to be burned.4) Type and locations of fire guards.5) Climatic conditions (humidity, temperature and wind speed) required for burn.6) Ignition schedule that shows the types of fires (backfire, flankfire, stripfire, headfire)that will be used, when and where.7) Control plan that will identify where fire suppression units and personnel will bestationed and their responsibilities.8) Notification list of individuals (neighbors, law enforcement, fire departments, lesees,TNRCC, etc) that will be contacted before the burn. 9) Post-burn management of the burned area.
Equipment Specifications: Minimum equipment needed to conduct an effective prescribedburn includes a weather kit to measure wind speed, humidity and air temperature as well as areliable ignition source. In most cases drip torches are used to ignite the fire. These torchesgenerally use a 70% diesel + 30% gasoline mix. Although propane torches, matches, burningtires or toilet tissue rolls have been used to ignite prescribed burns, these ignition sources aremuch less efficient and safe to use. As the size of the burn increases, it may be necessary tohave radios and large fire suppression equipment available.
Timing: The types of fires used for control of mesquite and redberry juniper are generallyapplied in the cool season. January, February and March are the months when most of theseburns are conducted.
Works Best On: Prescribed fire will only kill seedling mesquite. Larger and older plants maybe top killed but they will resprout profusely from the basal crown.
Redberry juniper plants can be killed by fire as long as the crown bud zone is not covered withsoil. This can occur in less than 10 years on some sites (Ueckert 1997).
Quality Control Concerns: There must be sufficient fine fuel (dormant grass and weeds) todevelop the intensity of fire needed to kill mesquite and redberry juniper. A minimum fine fuelload of 1,500 lb/ac. with good continuity across the landscape is needed. Greater fuel loads will

47
provide even more effective and consistent control.
Safety/Environmental Concerns: Prescribed fires are inherently dangerous. Anyone using thistool should have formal training and a great deal of “hands-on” experience. Fires should neverbe set when relative humidity is less than 20%, air temperature is above 80° F, and wind speedis greater than 20 mph. Summer burning should only be used by large and highly experiencedand trained fire crews who have state-of-the-art fire suppression and communications equipment.
Fire lines are used to contain the fire. In most circumstances the fire line is constructed byblading or plowing an 8- to 20-ft-wide strip to mineral soil surface. As an additional controlmeasure, backfires are set on the downwind side next to the fire lines and allowed to burn in 100to 200 ft before the head fires are ignited on the upwind side. When burning flammable fuelssuch as redberry juniper, double fire lines should be cut on the north and east sides of the pastureto be burned (Rasmussen et al. 1986). These double fire lines should be 500 ft apart. The finefuels between the lines are burned under safe conditions (40% relative humidity; 60° F airtemperatire) before the main fire is set.
Because of the complexity of planning and implementing an effective and safe prescribed burn,it is recommended that users be required to develop a written fire plan under the guidance of theNatural Resources Conservation Service. Treatment Sequencing: Prescribed fire will only kill seedling mesquite. Thus this controloption will be restricted in use as a maintenance treatment for seedlings that emerge andestablish after more mature mesquite plants have been controlled. Even intense summer fires donot root kill saplings or mature mesquite plants, but rather they stimulate basal sprouting andusually result in greater mesquite stem densities and mesquite foliage density.
Prescribed fire does not kill mature redberry junipers or saplings whose bud zone has beencovered by soil. However, fire is a very important control option for redberry junipermanagement. High densities of young junipers can be easily and effectively controlled atreasonable cost using fire. Prescribed fire is also a maintenance option following othertreatments. Mechanical treatments such as chaining or grubbing often release a high number ofseedling juniper plants. In general, these seedlings cannot be controlled by mechanicaltreatments because of their small size or by individual plant herbicide treatments because of theirhigh density. Prescribed fire is an excellent tool to use in these situations.
Goating (redberry juniper)
Method Description: For many years Texas ranchers have used goats to aid in their efforts tocontrol brush. Goats have been shown to significantly reduce seedling juniper numbers ifmanaged properly (Smeins 1990; Taylor 1992).
In general, goating involves stocking a pasture infested with juniper seedlings with high numbersof goats for a controlled period of time. This is best accomplished in the winter, when goats will

48
be less likely to consume desirable plants that are dormant. This method is most successful ifcombined with a monitoring program that provides early detection of juniper seed germinationand seedling emergence. Young juniper seedlings are the growth stage most vulnerable togoating because at this stage they have the lowest terpenoid concentration. Greaterconcentrations of terpenoids in older junipers decrease the palatability of juniper to goats. Monitoring must also be used to insure grazing pressure from goats does not harm desirablebrowse or herbaceous species. Goats can only consume a small quantity of juniper leaves per daybecause of their limited capacity to detoxify the terpenoids. Therefore, to effectively controljuniper with goats one must achieve a high goat:juniper ratio.
Treatment Specifications: Spanish goats have the potential to consume more juniper thanAngora goats (Taylor et al. 1997). Goats used to control juniper should be provided a high-quality protein supplement to meet the demands of detoxification of monoterpenoids containedin juniper plants.
Timing: The best time to apply heavy goating pressure to control redberry juniper is during thewinter. During this time many of the more desirable forage species are dormant and not aspalatable to the goat as compared to the spring and summer months. Using goating during thewinter months helps concentrate the grazing pressure on the redberry juniper and away fromother species.
Works Best On: Goating is only effective if used to control seedling juniper. Redberry juniperis less palatable to goats than ashe juniper. Juniper regrowth following prescribed burning haslower terpenoid contents and is more palatable to goats than is unburned juniper.
Quality Control Concerns: Grazing pressure must be monitored closely to insure there is asufficient number of goats to provide control of redberry juniper seedlings, but that they are notallowed to graze the area for a sufficient length of time to cause damage to desirable plants.
Safety/Environmental Concerns: Fences must be goat proof to allow use of this control option,especially if the control area is on the perimeter of the property. Predator control measures will be necessary in most areas. Treatment Sequencing: Goating is best used after initial and maintenance treatments to helpcontrol invasion of an area by new redberry juniper seedlings. Two or more treatments may benecessary prior to using goats to reduce the volume of juniper foliage sufficiently to be able toachieve a high goat:juniper ratio. Goating may be effective for reducing the numbers of juniperseedlings sufficiently to minimize the use of labor-intensive maintenance treatments, such as leafspraying, soil spot treatments, or hand grubbing.
Two Methods to Estimate Plant Density
As stressed in the above specifications, plant density, height, and growth form (single-stemmedvs. multi-stemmed regrowth) are primary considerations in selection of the most appropriatetreatment for management of mesquite and redberry juniper. While plant height and growth form

49
can be easily estimated visually, plant density (the number of plants per acre) is not easilyestimated by a cursory visual examination of a brush infestation. Fortunately, plant density canbe easily estimated by counting the number of plants within belt transects or within plots of aknown acreage, such as 1/10 acre. Descriptions of these two methods are presented below. BeltTransect Methodl
! Select a representative area in the pasture. Pick a landmark on the horizon or someobject in the pasture and walk 363 feet (about 131 large steps) directly toward thatlandmark or object. Stop when you reach that location.
! Turn around and slowly return along a straight line to your starting point. As youproceed, count every small mesquite or redberry juniper rooted within 3 feet of your path(about an arms length on both your left and right sides).
! To calculate the number of mesquite or redberry juniper per acre, multiply the number ofplants counted along the line by 20. For example, if you counted eight mesquite, then thedensity is 160 mesquite per acre (8 x 20).
! Repeat this procedure in at least three more representative areas.
! Total the samples, then divide by the number of samples to calculate an average densityfor your pasture. For example, if you had four estimates of 160, 100, 60 and 80 redberryjuniper per acre, then your average plant density is 100 redberry juniper per acre(160+100+60+80 = 400; 400/4 = 100).
1/10th-Acre Plot Method
! Select a representative area in your pasture. Mark off a square area 66 feet (about 22 bigsteps) on a side.
! Count the number of redberry juniper or mesquite within this area.
! To calculate the number of redberry juniper or mesquite per acre, multiply the number ofplants counted within the area by 10. For example if you counted eight redberry juniper,then the density is 80 redberry juniper per acre (8 x 10 = 80).
! Repeat this procedure in at least three more representative areas.
! Total the samples, then divide by the number of samples to calculate an average densityfor your pasture. For example, if you had four estimates of 160, 100, 60 and 80 mesquiteper acre, then your average plant density is 100 mesquite per acre (160+100+60+80 =400; 400/4 = 100).
50
Literature Cited
Dahl, B. E. and R. E. Sosebee. 1984. Timing - the key to herbicidal control of mesquite. TexasTech Univ. Range and Wildlife Management. Management Note 2.
DowElanco. 1990. Successful control of mesquite. DowElanco. Form No. 138-1072-90R.
McGinty, Allan, J. F. Cadenhead, Wayne Hamilton, C. Wayne Hanselka, Darrell N. Ueckert, andSteven G. Whisenant. 2000. Chemical weed and brush control - Suggestions forrangeland. Tex. Coop. Ext. Pub. B-1466.
Rasmussen, G. Allen, Guy R. McPherson, and Henry A. Wright. 1986. Prescribed burningjuniper communities in Texas. Texas Tech. Univ., Range and Wildlife Management.Management Note 10.
Scifres, Charles J. 1980. Brush management. Texas A&M Univ. Press. College Station, Tex.
Smeins, Fred E. 1990. Ashe juniper: consumer of Edwards Plateau rangeland. Texas Agric. Exp.Sta. Tech. Rep. No. 90-1. Sonora Res. Sta., Sonora, Tex.
Taylor, Charles A. Jr. 1992. Brush management considerations with goats. p. 144-155, In: J. C.Paschal and C. W. Hanselka (Ed.) Proceedings of the International Conference of meatgoat production, management and marketing. Texas Cooperative Extension.
Taylor, Charles A. Jr., Karen Launchbaugh, Ed Huston, and Erika Staka. 1997. Improving theefficacy of goating for biological juniper management. p. 5/17 - 5/22, In: Charles A.Taylor (Ed.) Proceedings of the Juniper Symposium. Texas. Agric. Exp. Sta. Tech. Rep.No. 97-1. Sonora Res. Sta., Sonora, Tex.
Ueckert, Darrell N. 1997. Juniper control and management. p. 5/23 - 5/34, In: Charles A. Taylor(Ed.) Proceedings of the Juniper Symposium. Tex. Agr. Exp. Sta. Tech. Rep. No. 97-1. Sonora Res. Sta., Sonora, Tex.
Welch, Tommy G. and Suzanne Hyden. 1996. Weed and brush control for pastures andrangeland. Tex. Coop. Ext. Pub. B-6034.
White, Larry D. and C. Wayne Hanselka. 1989. Prescribed range burning in Texas. Texas.Coop. Ext. Pub. B-1310.
51
Wildlife Considerations “After the Dozer”
Dale Rollins, Professor and Extension Wildlife SpecialistTexas Cooperative Extension & Texas Agricultural Experiment Station, San Angelo, Texas
The economic importance of hunting-related revenues to ranchers in the Concho Valley hastempered brush management practices. I believe that if the same cost-share incentives had beenmade available 25 years ago, the resulting landscape would look quite differently, and the resultwould have been less wildlife-friendly. I flew over the North Concho watershed three years agoin a helicopter and was pleased to see how landowners (with some exceptions) had adopted the“Brush Sculptor” philosophy, i.e., the planned, selective control of brush to enhance wildlifehabitat. While I’m skeptical of the “brush control equals water” precept, I’m bullish on the“selective brush control equals better wildlife habitat” precept.
The ideal situation for considering wildlife is “a priori” (before the fact) not “a posteriori” (afterthe fact). Accordingly, if you have yet to initiate brush control efforts, I remind you to considerthe “carpenter’s axiom”, i.e., “measure twice and saw once.” It’s a lot easier to take outadditional brush later than it is to bring it back after the dozer.
A tale of 3 Landowners
I approach this discussion as I would if addressing three landowners who own 3,500-acreranches in the Concho Valley. Woody vegetation on their ranches consisted mostly of mesquite,with scattered pockets of cedar, and various other brush common to this region (e.g., lotebush,littleleaf sumac). Each applied mechanical brush control (e.g. grubbing, excavation) under theguidelines of the North Concho River Watershed program at three different intensities that Ishall define as:
1) Cautious Clyde cleared 30% of his country originally; mesquite and juniper only wereremoved;
2) Liberal Luke cleared 80% of his country originally; mesquite and juniper only were removed;and,
3) Cost-share Clem cleared 98% of his country; everything was cleared except a few scatteredhackberries and along the creeks where he was afraid the dozer might tip over. Clem reasonedthat, “Hey, this is the last opportunity for ‘manna’ from Uncle Sam for brush control. That brushwill grow back before you know it.”
These characters are fictitious, but the scenarios are real. Now, five years later, let’s assess eachof these landowners income-potential from wildlife.

52
Cautious Clyde enhanced his habitat for deer, turkey, and even has some quail hunting now. What will his property lease for hunting? Maybe $5 to $10 per acre.
Liberal Luke may have compromised his deer hunting depending on the terrain and density ofassociated brush (e.g., littleleaf sumac, hackberry), but likely enhanced his quail huntingconsiderably. What will his property lease for hunting? Maybe $3 to $5 per acre.
Cost-share Clem never liked hunters anyway, and now he doesn’t have to worry about them, atleast for the next 25 years or so.
Note: I’m not being judgmental about who was “right” here. As a private landowner in Texas,each of these gentlemen had the right to create the landscape he so desired. But as my PreacherPaul often says at the beginning of a sermon “you’re free to choose your actions, but you’re notfree to choose the consequences.”
Here would be my recommendations to the three ranchers for maintenance brush control andhow to sustain/enhance their wildlife habitat.
Cautious Clyde. Use the Brush Busters technique to treat regrowth mesquite about every fiveyears. Keep your openings open. Use prescribed fire as opportune to do so, perhaps with a firefrequency of 5-7 years. If you made brushpiles, burn them; they likely harbor more skunks andsnakes than they benefit quail. If you left the slash on the ground (i.e., didn’t rake and pile),don’t worry about it. Carry a grubbing hoe and spend 30 minutes a day taking out the smallcedars as they pop up; it’s great exercise! Other options for small junipers include fire and IPTwith Tordon 22K. Use reduced stocking rates and/or dormant season grazing to enhance thewarm-season component of your grass understory. Use a stocking rate adjusted for the amountof the ranch that was actually cleared, as livestock (and deer) will focus on the clearings andsubsequently they will receive greater than expected grazing pressure.
Liberal Luke. Much the same strategy as Clyde’s, but your grazing management will be evenmore important. Maintaining taller grasses on this place will pay dividends for fawning andnesting cover, and will tend to make more of the pasture “usable” to quail. On areas that may bea bit open, look for areas where the mesquite regrowth tends to “clump” and intentionally sparesuch areas (perhaps the size of a basketball court) from subsequent control efforts. Once thesebrush patches are identified, it may be worthwhile to “half-cut” 5-10 mesquites per patch. Half-cut them in April; see http://teamquail.tamu.edu for the technique.
Cost-share Clem. Realistically Clem’s opportunities are limited for enhancing wildlife habitat inthe short-term. He could have some good quail hunting, but mostly along the periphery with hisneighbors (assuming they left more brush than Clyde did). Ditto for deer hunting very early andlate in the day, i.e., Clem has a nice “kitchen” for deer, but no “living room.” If blue quailcontinue their rebound, he may have some opportunity for some wide-open quail hunting. Grazing management that facilitates more ground cover (especially taller growing grasses forscreening cover) may mitigate the absence of woody cover to some degree. Allowing somemesquite thickets to grow up as Luke did would pay dividends, but it will likely be 15 years

53
before I’d expect much use of such areas. Dove hunting could be good, especially for the firstcouple of years following the brush control (i.e., as a result of seed-producing annuals created bysoil disturbance).
The concept of “usable space”
Usable space essentially asks the question “how much of my property is ‘usable’ by critter X(e.g., bobwhite quail) over the entire year (365 days)?” In order to maximize the abundance of aparticular species, your approach should be to maximize usable space. Usable space for quail inwest Texas is dictated mostly by two decisions, brush control and grazing management. Fordeer and turkey, grazing management is somewhat less important.
In 1999, I had the opportunity to sculpt a 100-acre pasture on the Angelo State University MIRCenter with quail in mind. We were constrained under the auspices of the North Concho RiverWatershed Project to reduce the mesquite to no more than 5% canopy cover. My tact was to (1)use mechanical control (grubbing) to sculpt the habitat, (2) not enroll that portion of the pasturewith a strip of “older” mesquite (that remained from some clearing done in 1978), and (3)provide for a “quail house” every softball-throw apart. I left small thickets of mesquite (aboutone-tenth acre in size) in those areas that lacked other quail cover (e.g., lotebush, littleleafsumac), and I also left more mesquites along the border with a plowed field. I’d be happy toshow this area to anyone with quail-management goals.
Over the past five years, I’ve done several private consulting jobs for well-heeled quail hunters(generally from the East Coast) who want to own a Texas quail ranch. When I look at a ranchwith a prospective buyer, we stop every mile and assess the site for quail potential (usablespace). If the property affords 70% usable space, it has great potential for quail. Usable spacefor quail would be a landscape where one could throw a softball in the air from one “quailhouse” (loafing covert, e.g., lotebush or sumac) to the next. Thicker pockets of brush and largerareas of brush would be more meaningful for deer.
I have used the Brush Busters technique and half-cutting to enhance quail habitat on formerConservation Reserve Program land on my lease near Tennyson. The goal is to make the openCRP more usable to quail by addressing the weak link, i.e., adequate quail houses.
Another technique that I’m high on is that of “water harvesting.” Use a dozer to create “spreaderdams” to retain water that would otherwise be lost to runoff. While this may be contrary to thegoal of putting water in the Concho River, it pays dividends to the landowner in making “quailoases”, i.e., moist-soil areas that provide better seed and insect habitat. The Aiken Ranch inFisher County and the Hammond Ranch in Pecos County are classic examples of how spreaderdams can be used to improve quail habitat.

54
Monitoring the wildlife response
I’m very high on on-site experimentation. If a landowner asks me what I think of this practice orthat, I encourage them to try it, at least on a portion of their ranch. But, you should always havea means by which to evaluate your results over time. Did quail numbers increase? Did antlerscores increase?
The lack of a coordinated evaluation of wildlife response to the brush control done in the Northand Middle Concho watersheds was a serious oversight in my opinion. It offered an opportunityto evaluate population responses of important game species at a scale not likely to be achievedagain in west Texas. But alas, the gatekeepers spurned the idea and no funding was provided tocoordinate such efforts. So much for sour grapes. That doesn’t preclude private landownersfrom monitoring the population responses on their own properties.
For quail managers, I recommend your involvement in the Texas Quail Index(http://teamquail.tamu.edu) as a means of assessing quail response over time. For deer, censusand harvest records can provide the means to assess the herd’s response. Remember that yourpastures are now more open, hence you may see more deer, but that does not necessarily meanthere are more deer. Deer will use these open areas for feeding, but when the hunting starts theywon't be there except mostly at night. Establishing permanent photo points (seehttp://tcebookstore.org/tmppdfs/1597748-L5216.pdf for a publication with protocols) offers alow-input way to monitor vegetation change over time.
The upshot
Brush control can be one of the best tools for managing wildlife habitats in west Texas. Or oneof the worst. Examples of each can be found in the Concho Valley. If wildlife-based recreationis an important part of your management objectives, you should realize there are trade-offsbetween wildlife and livestock needs relative to brush. Temper your desire to eradicate brushwith the knowledge that some brush is important to maintain wildlife. If you have gotten yourpastures cleared of brush the way you want it; now focus your attention on getting the grassback. The same precaution that dictates safety at a party (i.e., alcoholic consumption) shouldguide your brush practices on the back forty, i.e., “know when to say when.”
References
Hailey, T. L. 1979. Basics of brush management for white-tailed deer production. Texas Parksand Wildlife Department Booklet 7100-35, Austin. Available electronically athttp://www.tpwd.state.tx.us/publications/wildlife_habitat/pdf_docs/basics_brush_mgmnt_whitetail_deer.pdf.

55
Nelle, S. 1997. Brush as an integral component of wildlife habitat. Proceedings Brush Sculptorssymposium. Texas Agricultural Extension Service, San Angelo. Available electronicallyat http://texnat.tamu.edu/symposia/sculptor/index.htm.
Richardson, C. L. 1990. Brush management effects on deer. Available electronically at http://texnat.tamu.edu/publications/L-2347/index.htm.
Rollins, D., D. N. Ueckert, and C. G. Brown. 1997. Brush Sculptors: innovations for tailoringbrushy rangelands to enhance wildlife habitat and recreational value. Symposiumproceedings. Texas Agricultural Extension Service, San Angelo. Availableelectronically at http://texnat.tamu.edu/symposia/sculptor/index.htm.
Rollins, D. and J. R. Cearley. 2000. Brush, water, and wildlife: a compendium of ourknowledge. Symposium proceedings. Texas Agricultural Extension Service, SanAngelo. Available electronically athttp://texnat.tamu.edu/symposia/brush_water_wildlife.pdf.

56
Fire and Herbivory: Why They are Important
Charles “Butch” Taylor, Professor Texas Agricultural Experiment Station, Sonora, Texas
Introduction It is apparent that fire and grazing/browsing (herbivory) have played a significant role in shaping the vegetation of Texas for thousands of years. Understanding the role of fire and herbivory is critical for land management. Semi-arid rangelands of West Texas are characterized by the occurrence of woody plants, prickly pear, forbs, and grasses. It’s the authors opinion that the balance between woody plants, prickly pear, forbs, and grasses is mostly determined by the interactive effects of herbivory and fire. These effects are based on the positive feedback between grass (i.e., fuel load) and fire intensity and frequency. An increase in grazing pressure reduces the fuel load, which reduces fire frequency and intensity. A reduction in fire frequency and intensity allows the noxious woody plants and prickly pear to increase. The landscape then switches from a grassland savanna state (i.e., dominated by grasses with a few woody plants) to a shrubland (i.e., dominated by woody plants and prickly pear). Browsers (i.e., goats) can enhance the effect of fire on woody plants because they reduce woody plant cover, thus indirectly stimulating grass growth. A combination of prescribed fire, browsing, and grazing offer the most sustainable and cost-effective methods of maintaining healthy functioning rangelands. Fire It is well documented that, prior to European settlement, both prescribed and wild fires were disturbances that played key roles in shaping the different plant communities across the United States (Baker 1992; Foster 1917). Historically fires occurred during all months of the year (Higgins 1986; Komarek 1968), but summer fires were probably more frequent due to dry conditions combined with increased lightning frequency during the summer (Komarek 1968; Taylor 2001). Fire is a natural disturbance and the fire regime (i.e., frequency, intensity, and size of burns) often is an integral part of ecosystem function (Leitner et al. 1991). As the livestock industry developed across the continent, fire suppression was a major activity of the early European settlers (Scifres & Hamilton 1993). For example, in 1848 a state law was passed in Texas that made it illegal to fire the prairies between July 1 and February 15. In 1884 another Texas law was passed that made setting fire to any grass a felony. It wasn’t until 1999 that a law was passed in Texas that unambiguously stated that a landowner had the right to conduct a prescribed burn on his or her own property. The increased frequency and intensity of grazing also reduced the grass cover (i.e., fuel load), which helped fire proof a big part of the western rangelands. With the suppression of fire, woody species were able to invade rangelands (Baker 1992; McPherson 1997). Intense grazing pressure, which produced gaps in the herbaceous cover, concomitant with increased seed

57
dispersal by herbivores also may have contributed to increased establishment of woody plants (Brown & Archer 1989). Ecological theory provides a basis for examining hypotheses about the role of fire in rangeland ecosystems. The intermediate disturbance hypothesis suggests that intermediate disturbance frequencies control competitive dominant species allowing inferior competitors to be maintained in the landscape (Connell 1978). Only colonizing species are able to establish when disturbance is very frequent whereas, when disturbance is very rare, succession leads to colonizing species being supplanted by competitive dominant species. If historic rangelands were subjected to periodic wildfires then the historically dominant species should be well adapted to this disturbance regime but not competitively dominant in the absence of the disturbance. Susceptibility to fire and competitive ability are mainly governed by growth form/life form characteristics (Scifers 1980). Perennial grasses were historically dominant on many arid and semi arid rangelands (Cory 1949). The buds of perennial grasses are located at or below the ground making them resistant to fire. Invading woody species are potentially more susceptible to fire because their buds are elevated. However, many shrub and tree species can resprout from the roots or under ground crowns if fires are not intense enough to kill these tissues. Woody plants, once established, are better competitors than grasses because their root systems generally are deeper allowing access to ground water supplies during times of drought. Therefore, the historically dominant grasses generally are better adapted to the disturbance regime than are the invading woody species; however, grasses are less able to compete for required resources once woody plants have become established. Woody plants also affect nutrient cycling. In general, levels of organic carbon and total nitrogen are greater in soils beneath woody plants than in the grass dominated interspaces (McPherson 1997). Carbon and nitrogen accumulation under woody canopy cover probably results from increased litter and root biomass. The reintroduction of fire as a management tool should reestablish the disturbance regime of pre-settlement times allowing an optimal balance between the herbaceous and woody plant species. Moreover, diversity should be highest for areas where a fire regime has been reestablished because both inferior and competitive dominant species could be maintained in the landscape (Fuhlendorf & Engle 2001; Copeland et al. 2002). With the advent of hierarchical analysis of ecosystems and landscapes it is becoming possible to consider the long-term implications of prescribed burning and other management regimes on structure and functioning of rangeland ecosystems (Baker 1992). As we enter the 21st Century, prescribed fire faces an uncertain future. Historic use of prescribed fire by ranchers has never been widespread; however, with the rapid increase in population and increased “urbanization” of rangeland and air quality concerns, the implementation of fire will be even more difficult in the future. However, these problems should not lessen our enthusiasm for prescribed fire. In fact, now is the time to become bold and innovative in the use of prescribed fire, but also be prudent.

58
Because of its relatively low cost, prescribed fire, both cool and warm season fire (multi-seasonal) is viewed as an extremely viable tool (Engle & Bidwell 2001; Ansley & Taylor 2000). However, a combination of prescribed fire, coupled with proper grazing management (i.e., proper budgeting of grass to either forage or fuel) should offer the best-case scenario for managing noxious woody plants. Grazing Management and Prescribed Fire Grazing management and prescribed fire have often been treated as separate issues by rangeland managers. However, development and application of an effective prescribed burning program requires an understanding of the relationship between fire and grazing. For example, vegetation serves a dual role as forage for grazing animals and as fuel for prescribed burns. The manager must balance the amount of forage that is used by grazing animals and the amount that is used for fuel. The range manager should manage the stocking rate and grazing schedule to allocate enough forage to livestock to provide ranch income and also allocate enough to fuel for effective burning. Land managers can use The Grazing Manager (Kothmann & Hinnant 1994) to determine the most effective stocking rate and grazing schedule to reduce the cost of burning and increase the probability that burning can be implemented as required to manage the range resource. Where do you start? Planning and implementing a successful prescribed burning program to meet long-term goals and objectives requires basic knowledge in the areas of forage and animal production, grazing management, plant ecology, and prescribed fire. Before beginning a burning program, a manager should obtain training in these concepts and techniques. Also, it would be wise to initiate an inventory and monitoring system to measure current conditions and determine if goals and objectives are being met. Inventory The first step in planning a prescribed burning program is for the manager to inventory the current condition of both herbaceous and woody vegetation. The current status of the vegetation and the stocking rate will determine the potential for using prescribed fire and what may need to be changed prior to burning as well as the cost of implementing an initial burn. Also, the current status of the vegetation will determine the kind of plan that should be developed. To make this decision a decision aid would be helpful. Listed in Table 1 is an example of a decision aid that helps determine the status of a problem. This decision aid was developed for Texas rangelands that have the potential to be dominated by juniper. With this aid, pastures can be placed into 4 different categories and then an evaluation can be made, based on goals and objectives of the manager.

59
For example, a target pasture that has been heavily stocked, is in poor range condition, and has dense mature juniper would fit into category 4. Under these conditions there is almost no potential for initiating a cool-season, prescribed burning program until the mature juniper have been mechanically controlled (i.e., chaining, grubbing, roller chopped, etc.) and grazing management is improved. Cost of implementing a burning program under these conditions would be high for winter burning and moderate for summer burning. Initially the potential for prescribed burning is low for category 3; however, improved grazing management may provide adequate fuel before juniper becomes dense enough to seriously reduce forage production. Initiating a management program before the juniper reaches maturity and begins producing seeds is important. Years of heavy stocking reduces range condition, soil condition, and plant vigor. The pasture may not produce enough fuel to support an effective fire even if it is rested for a year prior to burning. In these cases, stocking rates should be reduced and pastures provided deferment to increase plant vigor and seed production of desirable species prior to burning. Burning prior to correcting grazing management problems will not yield good results. Pastures will need to be monitored to determine when vegetation fuel loads are sufficient for carrying an effective fire. It’s obvious that different management plans will have to be initiated for each category. An initial inventory will be required and then the rangeland will have to be monitored until sufficient kinds and amounts of fine fuel are grown to provide for effective burning. Pastures that fit into category 2 have a higher range condition than category 3 and 4; however, twenty-five percent of the juniper is mature. For winter burning, a pre-fire mechanical treatment might be required to kill the mature juniper, which will increase the cost significantly. A reclamation type burn could be initiated with a hot summer fire; however, risks would be greater and this would require a longer post-burn deferrement to allow for vegetation recovery. Marginal fuel loads would make it difficult for either summer or winter burns. Category 1 is the best-case scenario because good to excellent range condition is providing the best kinds of fine fuel (i.e., midgrasses) for hot fires. Also, juniper density is light with immature plants. Winter or summer fires would be very effective and pre- and post-burn deferment periods would probably be shorter than other categories. How do you graze and burn? A rancher acquaintance commented a while back that one could burn too much. He emphasized how difficult it was to make a living from ranching, especially with today’s operating costs, and that burning too much would jeopardize income to the ranch enterprise. It was a very honest comment and irrefutably, the ranching industry has fallen on hard times. It’s also apparent that burning grass costs money and, in the short-term, may reduce ranch income. Prescribed fire is a double-edged sword. Ranchers need fuel (grass) to burn and they also need income from livestock, which requires forage (grass, a major part of forage). In the short-term fire reduces carrying capacity for livestock but in the long-term fire increases grass production resulting in increased carrying capacity. Therefore, the answer to the rancher’s comment is, “budget your grass for both fuel and forage”.

60
How do you budget grass for fuel and forage and how much will it cost? Approximately 10 years ago it was decided to develop an intensive burning plan for the Texas A&M University Research Station at Sonora. The objectives are to compare the effectiveness of warm-season burning and cool-season burning and also the costs associated with not burning (controls). The burning project began with the goal of burning 25% of each grazing system each year, except for the controls. Treatments that represented warm-season burning, cool-season burning and control (no burning) were assigned to 36 pastures. All pastures were assigned to grazing management units (GMUs). Each GMU is represented by four equal size pastures, which represent one 4-pasture grazing system. Each GMU (grazing system) is assigned its own set of sheep and goats. Initially cattle were removed from grazing to reduce harvest of the fuel load. Once a more favorable balance is achieved through burning and browsing, cattle will be gradually integrated back into the grazing animal mixture. Each treatment is replicated with three GMUs. In terms of livestock production, the experimental unit is each GMU, which has 3 replicates (3 complete 4-pasture grazing systems per treatment). Management of the grazing systems follows the recommendations of Taylor et al. (1993). Livestock production, including pounds of deer harvested, is measured for each year. Because of the variation within and between pastures due to past grazing and brush control treatments, and differences in soils and topography, three years of base line data were collected. The Grazing Manager (TGM) was used to determine average carrying capacity for each pasture and GMU (Fig. 1). Also TGM was used to determine seasonality of forage production, monthly forage use ratings for each pasture and GMU and provide information for timely stock adjustments in response to forage supply (Kothmann & Hinnant 1994). By using the decision aid (Table 1) pastures can be placed into 4 different categories and then an evaluation is determined, based on goals and objectives, which pasture to burn first in each GMU. From a personal perspective, pastures that have the greatest and quickest potential to respond to a fire and are cheaply implemented should receive first priority. For example, if 4 pastures are evaluated and two fall into category 1, one in category 2, and one in category 4, I would plan on burning the pastures in categories 1 first. This is not to say that the other pastures would be ignored; in fact, proper grazing management would be required for the other pastures to improve in range condition, which would be part of the process of getting them into condition to eventually burn. I cannot over-state the value of The Grazing Manager (TGM) software as a tool in determining proper stocking rates and also as a monitoring device to determine the increase or decrease in carrying capacity. TGM projects forage production (expressed as animal unit days) and projects animal demand (also expressed as animal unit days), for each forage year (Figure 2). When animal demand is equal to forage production in the TGM program, use on the vegetation is moderate. When forage production values are greater than animal demand, it indicates a surplus of forage. For example, TGM is predicting that approximately 3,500 animal unit days (AUDs) are available for grazing through March for one GMU (Figure 2). Animal demand is

61
approximately 1700 AUDs; therefore, TGM is predicting that we could have increased our stocking rate for the past forage year by 1800 AUDs and still be moderately stocked. However, we could also consider a change in stocking rate at the end of September rather than waiting until the end of the forage year. Approximately 75% of total forage is produced by the end of September for most years for the southwestern region of Texas. Based on this knowledge and the use of the information from TGM, livestock numbers could be increased as early as September. So, it’s the manager’s decision, does he increase stocking rate to harvest the additional forage or does he burn? Look at what happens to animal demand if we burn one of the four pastures (Figure 3). TGM is showing us that we can burn one pasture and still have forage for grazing without reducing stocking rate for the total GMU. This data is from an actual forage year on the Texas A&M University Research Station at Sonora. By monitoring forage growth and animal demand, adjustments can be made in animal numbers to balance forage supply with animal demand. TGM assumes a 25% harvest efficiency of the forage by domestic livestock. TGM is an effective tool to allow one to budget grass to either fuel or forage and quantify changes in range productivity. Summary Sustainable management of most rangelands requires repeated applications of prescribed fire as well as proper grazing management. Prescribed fire has the potential to be an effective low-cost control method, but it requires greater levels of expertise and management than other control methods. Long-term application of prescribed fire also requires more attention to proper grazing management. Grazing management required for an effective prescribed burning program will also be effective for improving range condition; however, an active monitoring program will have to be initiated to quantify responses of forage growth so that adjustments in management can be done in a timely manner to meet rancher goals and objectives. Additional Reading Section Ansley, J.R. and C.A. Taylor, Jr. 2000. What’s next: The future of fire as a tool for managing
brush, pp. 159-169, in Rangeland weed and brush management: The next millennium. Texas Agricultural Experiment Station, San Angelo, Texas.
Baker, W.L. 1992. Effects of settlement and fire suppression on landscape structure. Ecology 73:1879-1887. Brown, J.R. and S. Archer. 1989. Woody plant invasion of grasslands: Establishment of honey mesquite (Prosopis glandulosa var. glandulosa) on sites differing in herbaceous biomass and grazing history. Oecologic 80:19-26. Connell, J.H. 1993. Diversity in tropical rainforests and coral reefs. Science 199:1302-1310.
62
Copeland, T.E., W. Sluis, and H.F. Howe. 2002. Fire season and dominance in an Illinois tallgrass prairie restoration. Restoration Ecology 10:315-323. Cory, V.L. 1949. On some grasses, chiefly of the Edwards Plateau of Texas. Field & Laboratory 17:41-52. Engle, D.M. and T.G. Bidwell. 2001. Viewpoint: The response of central North America prairies to seasonal fire. Journal of Range Management 54:2-10. Foster, J.H. 1917. The spread of timbered areas in central Texas. Journal of Forestry 15:442- 445. Fuhlendorf, S.D., and D.M. Engle. 2001. Restoring heterogeneity on rangelands: ecosystem management based on evolutionary grazing patterns. BioScience 51:625-632. Higgins, K.F. 1986. Interpretation and compendium of historical fire accounts in the Northern
Great Plains. U.S. Department of the Interior. Resource Publ. 161. USDI, Washington, DC.
Komarek, E.V. 1968. Lightning and lightning fire as ecological forces. Proc. Tall Timbers Fire Ecology Conference 7:169-197. Kothmann, M.M. and R.T. Himmant. 1994. The Grazing Manager and Grazing Management
Stock Adjustment Templates. Vol. 1 and 2. Tex. Agricultural Experiment Station Computer Software Documentation Series. MP-1760. Texas Agricultural Experiment Station, College Station, Texas.
Leitner, L.A., C.P. Dunn, G.R. Guntenspergen, F. Stearns, and D.M. Sharpe. 1991. Effects of
site, landscape features, and fire regime on vegetation patterns in presettlement southern Wisconsin. Landscape Ecology 5:203-217.
McPherson, G.R. 1997. Ecology and management of North American savannas. The University of Arizona Press. Tucson, Arizona. Scifres, C.J. 1980. Brush management: Principles and practices for Texas and the Southwest. Texas A&M University Press. College Station, Texas. Scifres, C.J. and W.T. Hamilton. 1993. Prescribed burning for brushland management. Texas A&M University Press. College Station, Texas. Taylor, C.A., Jr. 2001. Summer fire for the western region of the Edwards Plateau: a case study. Texas Agricultural Experiment Station Technical Report 01-2. Sonora, Texas.

63
Taylor, C.A., Jr. 2003. Rangeland monitoring and fire: wildfires and prescribed burning, nutrient cycling, and plant succession. Arid Land Research and Management 17:429-438.
Taylor, C.A., Jr., T.D. Brooks, and N.E. Garza. 1993. Effects of short duration and high
intensity, low-frequency grazing systems on forage production and composition. Journal of Range Management 46:118-122.
Table 1. A decision aid to help determine the status of a Juniper problem for Texas rangelands1. Categories 1 2 3 4 Stocking Rate Light Moderate Heavy Extreme Range Condition
Excellent/Good Good/Fair Fair/Poor Poor
Juniper Age Immature Immature/Mature 75:25 Ratio
Immature/Mature 50:50 Ratio
Immature/Mature 25:75 Ratio
1-Hour fine fuel load
Adequate Marginal Low Inadequate
Success of winter burn
High Moderate Low (may require mechanical
treatment preburn)
Very low (requires mechanical treatment preburn)
Cost of winter burn
Low Moderate High High
Success of summer burn
Very High High High/Moderate Moderate
Cost of summer burn
Low Low Moderate Moderate
1Source: Taylor 2003.

64
0
5
10
15
20
25
C1 C2 C3 W1 W2 W3 S1 S2 S3
Grazing Management Units
An
imal
Un
it D
ays/
Acr
e
Figure 1. Average carrying capacity of pastures on the Texas A&M University Research Station Prior to burning treatments. Determined from three years’ data by using The Grazing Manager software. C=control (no burn), W=winter burn pastures, and S=summer burn pastures. Four pastures represent one grazing management unit.
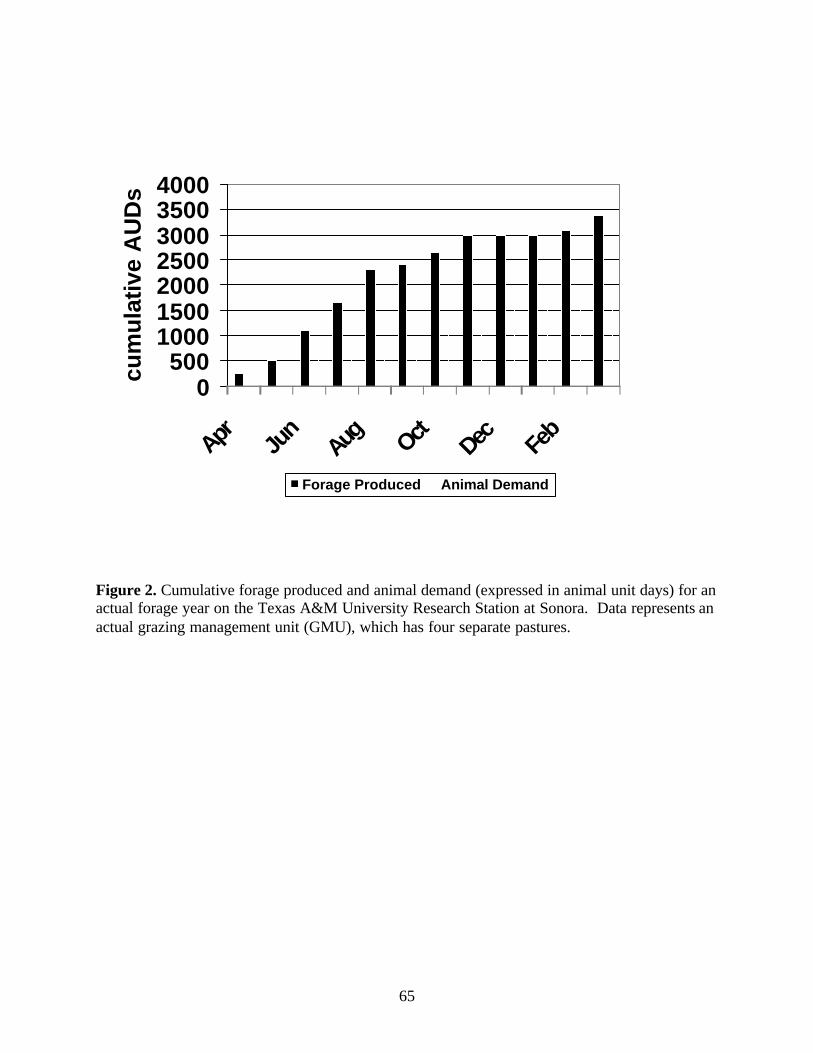
65
0500
1000150020002500300035004000
Apr Jun
Aug Oct Dec Feb
cum
ula
tive
AU
Ds
Forage Produced Animal Demand
Figure 2. Cumulative forage produced and animal demand (expressed in animal unit days) for an actual forage year on the Texas A&M University Research Station at Sonora. Data represents an actual grazing management unit (GMU), which has four separate pastures.

66
01000200030004000
Apr Jun
Aug OctDec Fe
b
Cu
mu
lativ
e A
UD
s
Forage Production Animal demand
Figure 3. Cumulative forage produced and animal demand (expressed in animal unit days) for an actual forage year on the Texas A&M University Research Station at Sonora. Data represents an actual grazing management unit (GMU) in which one of the four pastures is burned.

67
Where’s the Money for Follow-up Treatments for Brush Control?
Jason L. Johnson, Associate Professor & Extension EconomistTexas A&M University & Texas Cooperative Extension, San Angelo, Texas
From the landowner’s perspective, various follow-up treatments to initial brush control practices pose afinancial challenge. The two major issues relating to the economic effectiveness of follow-up treatmentsinvolve potential sources of cost-share funds for the follow-up practices and potential economicbenefits resulting from these treatments. This paper highlights the primary funding mechanism for cost-sharing follow-up treatments and finally presents estimates of the resulting grazing capacities resultingfrom alternative brush control practices.
The Primary Mechanism - The Environmental Quality Incentives Program (EQIP)
The primary cost-share program available to landowners to implement follow-up treatments to initialbrush control practices is the Environmental Quality Incentives Program (EQIP). EQIP wasestablished in the 1996 Farm Bill to provide a voluntary conservation program for farmers and rancherswho face serious threats to soil, water, and related natural resources. Nationally, this program providestechnical, financial (cost share), and educational assistance. EQIP was re-authorized through 2007 inthe Farm Security and Rural Investment Act of 2002 (Farm Bill) with authorized funding of $6.1 billionover 6 years, starting with $400 million in FY 2002, $700 million in FY2003, $1.0 billion in FY2004,$1.2 billion in FY2005 and FY2006, and $1.3 billion in FY 2007.
Through EQIP, farmers and ranchers may receive cost-share payments for implementation of eligibleconservation practices and incentive payments for implementation of land management practices. EQIPoffers contracts with a minimum term of one year after implementation of the last scheduled practiceand a maximum term of ten years. These contracts provide incentive payments and cost sharepayments for implementing conservation practices. Total cost-share and incentive payments are limitedto $450,000 per individual over the period of the 2002 Farm Bill, regardless of the number of farms orcontracts.
EQIP assists producers to comply with government regulations. The Natural Resources ConservationService (NRCS) administers EQIP and funding for the program comes from the Commodity CreditCorporation. Enrollment in this program requires an evaluation, or scoring, of conservation benefits ofan individual project. Higher priority will be given to those applications that address the local or statepriorities and provide the most environmental benefit. Money is then allocated to the projects withmore potential benefits.
The NRCS in Texas has implemented a lean and local process that streamlines the application andevaluation procedures. The State Technical Committee and local working groups convened by the

68
conservation district, advise NRCS on implementation of the program to address identified resourceneeds and concerns and recommend the practices eligible for cost share and the cost share rates thatwill be paid. Landowners and operators will choose the practices and evaluation system that best fitstheir needs.
EQIP activities are carried out according to an EQIP plan of operations developed in conjunction withthe producer. Producers have the option to receive technical assistance from NRCS or approvedthird-party providers, but, all work and practices must meet NRCS standards and specifications.
Producer Eligibility
Agricultural producers engaged in livestock or agricultural production may participate in EQIP. Thereare, however, circumstances that may limit an individual’s or entity’s participation. Federal and stategovernments and political subdivisions thereof, are not eligible. Second, the applicant must be incompliance with highly erodible land and wetland conservation provisions. Finally, the individual orentity may not be eligible due to Adjusted Gross Income provisions. No individual or entity mayreceive EQIP payments in any crop year in which the individual or entity’s adjusted gross income forthe preceding three years exceeds $2.5 million, unless 75 percent of that income is from farming,ranching, or forestry interests.
Ranking Pools
Eligible persons may select to apply in the county base programs recommended by the local workgroup or in one of the statewide resource concerns recommended by the state technical committee. The base program will vary from county to county depending on the priorities set by the local workgroup. Landowners interested in follow-up brush control treatments should consult their local NRCSoffice to determine the local priority resource concerns, amount of funds available to the county to fundprojects, eligible practices, ranking criteria and cost-share rates. Cost share rates will generally be 40-50% for most practices, however some practices may be as high as 75% and limited resourceproducers are often eligible for a higher cost share rate in many counties.
The remainder of this discussion about EQIP will relate to the pool of funds made available forstatewide resource concerns. The state resource concerns addressed in 2004 included: water quantity,water quality, animal feeding operations / concentrated animal feeding operations, wildlife, and invasivespecies. According to the state resource concerns for water quantity, 2004 EQIP funds will be usedto support brush control and improve irrigation efficiency for selected watersheds and aquifers. Initialefforts focused on cost share for initial control and follow-up brush control by local cooperators whoparticipate in the Texas Soil and Water Conservation Board’s brush control program and otherindependent brush control efforts in the watersheds. EQIP funds leverage state funds to increaseavailable water through brush control and grazing management.
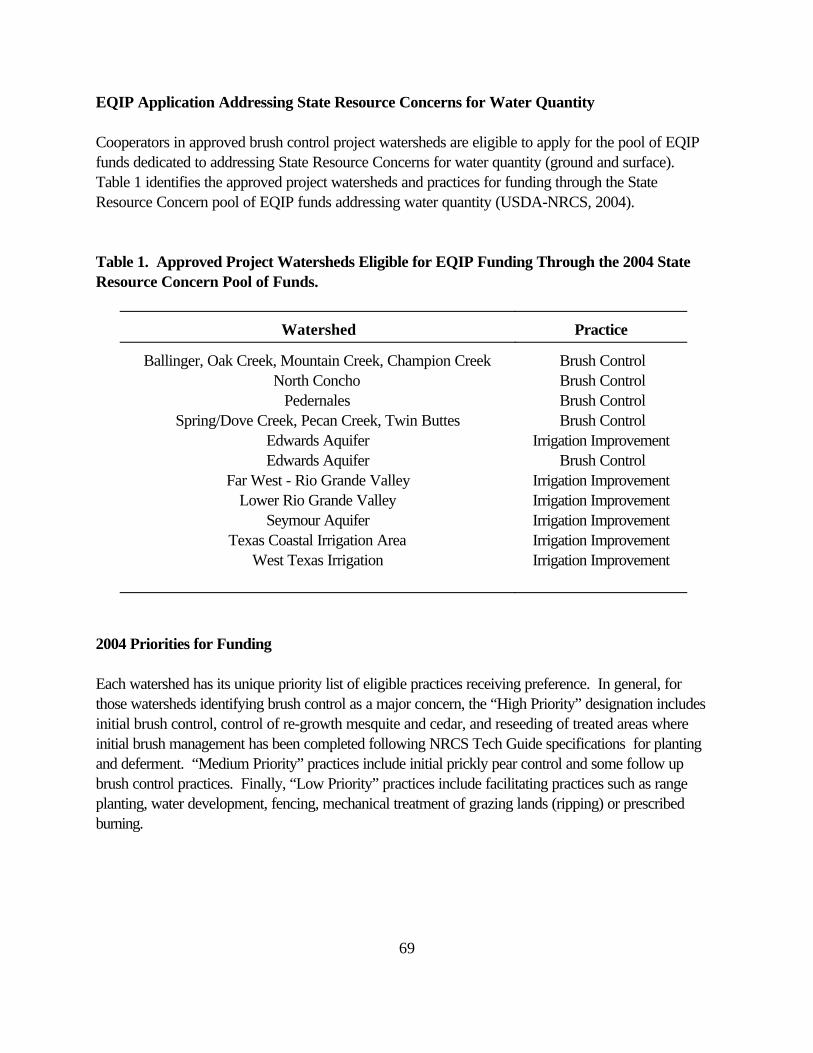
69
EQIP Application Addressing State Resource Concerns for Water Quantity
Cooperators in approved brush control project watersheds are eligible to apply for the pool of EQIPfunds dedicated to addressing State Resource Concerns for water quantity (ground and surface). Table 1 identifies the approved project watersheds and practices for funding through the StateResource Concern pool of EQIP funds addressing water quantity (USDA-NRCS, 2004).
Table 1. Approved Project Watersheds Eligible for EQIP Funding Through the 2004 StateResource Concern Pool of Funds.
Watershed Practice
Ballinger, Oak Creek, Mountain Creek, Champion CreekNorth Concho
PedernalesSpring/Dove Creek, Pecan Creek, Twin Buttes
Edwards AquiferEdwards Aquifer
Far West - Rio Grande ValleyLower Rio Grande Valley
Seymour AquiferTexas Coastal Irrigation Area
West Texas Irrigation
Brush ControlBrush ControlBrush ControlBrush Control
Irrigation ImprovementBrush Control
Irrigation ImprovementIrrigation ImprovementIrrigation ImprovementIrrigation ImprovementIrrigation Improvement
2004 Priorities for Funding
Each watershed has its unique priority list of eligible practices receiving preference. In general, forthose watersheds identifying brush control as a major concern, the “High Priority” designation includesinitial brush control, control of re-growth mesquite and cedar, and reseeding of treated areas whereinitial brush management has been completed following NRCS Tech Guide specifications for plantingand deferment. “Medium Priority” practices include initial prickly pear control and some follow upbrush control practices. Finally, “Low Priority” practices include facilitating practices such as rangeplanting, water development, fencing, mechanical treatment of grazing lands (ripping) or prescribedburning.

70
Cost-Share Rates
Costs to be shared were based on the established county average cost of the practice. The cost-sharerates established for practices were set at 60% for limited resource producers and 50% for beginningproducers and all others. Limited resource producers are generally those with total operator householdincome under $20,000, total farm assets under $150,000, and gross sales under $100,000. The basiccriterion for a beginning farmer or rancher is an individual or entity that has operated a farm or ranch fornot more than ten years. Incentive payments of $2 per acre per year were paid for prescribed grazing. This incentive was limited to acres with planned brush management or range planting (maximum oneyear) or limited to acres prior to and/or following planned prescribed burning (maximum two years).
Landowner Benefits from Brush Control Program Participation
From an investment perspective, the decision to participate in a brush control program involvescomparing program benefits with program costs. Grazing capacity estimates are the cornerstone ofcalculating expected benefits to landowners from participating in a brush control program. Specifically,these estimates represent forage response over time to the alternative brush control program scenariosconsidered.
Changes in grazing capacity influence the landowner’s ability to adjust livestock numbers in a manner toimprove economic returns. An initial Upper Colorado River Authority (UCRA) study presentedgrazing capacity estimates for two brush program scenarios (identified as uncontrolled and controlled)by brush type-densities and by region within the Concho river basin (northwest and southeast). Differences in soils and climate translated into differing grazing capacity limits between regions makingthis distinction necessary. These grazing capacity estimates (in acres per animal unit) for each brushtype-density and by region are provided for the northwest region and southeast region of the NorthConcho watershed basin in Tables 2 and 3, respectively (Ecological Restoration and ManagementConsultants, 2002).
The “no control” scenario corresponds to grazing capacity estimates for land where brush wasuncontrolled. The no control scenario incorporates the effect of reduced grazing capacity (or increasesin acres per animal unit) over time as brush densities increase and encroach upon forage production. Grazing capacities for the initial control + follow up treatment scenario correspond to the State BrushControl program’s characterization of controlled brush. Initial control of brush and follow uptreatments result in an improvement in grazing capacity (or reductions in acres per animal unit) followedby a maintenance of grazing capacity over time. Grazing capacities for the initial control only scenariodepict an initial improvement in grazing capacities followed by gradual reductions as initial brush controlimpacts erode over time.
Grazing capacity estimates for the initial control + follow up treatment + deferment depict a 25%reduction in grazing capacities for Years 1 - 3 followed by six years of grazing capacities reflecting a

71
5% improvement in grazing capacity above the initial control + follow up treatment scenario. Addingreseeding to the scenario entails a 50% reduction in grazing capacities for Years 1-3 but an additional5% improvement in grazing capacity above the deferment scenario. Responses from reseeding areonly available from those mechanically treated brush control practices (i.e. juniper control treatments). Grazing capacity estimates for reseeding are identical to those for deferment for treatments of mesquite.
Accurately converting these grazing capacities into dollars is an exercise which requires the individuallandowner to apply their own estimates of additional returns per acre from livestock and wildlife thatare permitted from the various brush treatment regimes (i.e. How much additional revenue does thelandowner realize when the land can support one animal unit for every 24 acres versus one animal unitfor every 32 acres? How much more revenue can be generated from wildlife as a result of these landmanagement changes? ). Needless to say, these answers will vary from producer to producer, but thegrazing capacity estimates should provide a framework that will allow the landowner to begin estimatedthese additional benefits.

72
Table 2. Northwest Region Grazing Capacity Estimates for Brush Type-Densities andAlternative Brush Control Program Scenarios, Acres per Animal Unit, Year 0 through Year 9.
Year
0 1 2 3 4 5 6 7 8 9
- - - - - - - - - - - - - - - acres per animal unit - - - - - - - - - - - - - - -
Heavy MesquiteNo ControlInitial Control (IC)IC + Follow up (F)IC + F + Deferment (D)IC + F + D + Reseeding
32.032.032.032.032.0
32.229.129.142.742.7
32.326.726.742.742.7
32.527.025.642.742.7
32.727.425.624.324.3
32.827.725.624.324.3
33.027.925.624.324.3
33.328.325.624.324.3
33.528.725.624.324.3
33.729.125.624.324.3
Heavy JuniperNo ControlInitial Control (IC)IC + Follow up (F)IC + F + Deferment (D)IC + F + D + Reseeding
45.145.145.145.145.1
45.137.437.459.890.1
45.432.232.259.890.1
45.730.030.059.890.1
46.030.930.028.627.4
46.431.830.028.627.4
46.632.730.028.627.4
46.733.730.028.627.4
47.134.830.028.627.4
47.436.030.028.627.4
Moderate MesquiteNo ControlInitial Control (IC)IC + Follow up (F)IC + F + Deferment (D)IC + F + D + Reseeding
27.027.027.027.027.0
27.226.026.036.036.0
27.525.625.636.036.0
27.725.725.636.036.0
28.125.825.624.324.3
28.425.925.624.324.3
28.826.025.624.324.3
29.226.125.624.324.3
29.626.225.624.324.3
30.026.325.624.324.3
Moderate JuniperNo ControlInitial Control (IC)IC + Follow up (F)IC + F + Deferment (D)IC + F + D + Reseeding
33.033.033.033.033.0
33.332.032.044.066.0
33.730.030.044.066.0
34.030.230.044.066.0
34.430.530.028.627.4
35.030.630.028.627.4
35.430.930.028.627.4
35.831.130.028.627.4
36.231.430.028.627.4
36.631.530.028.627.4
Light MesquiteNo ControlInitial Control (IC)IC + Follow up (F)IC + F + Deferment (D)IC + F + D + Reseeding
25.625.625.625.625.6
25.925.625.634.134.1
26.225.625.634.134.1
26.625.625.634.134.1
26.925.625.624.324.3
27.225.925.624.324.3
27.626.625.624.324.3
27.926.625.624.324.3
28.226.925.624.324.3
28.427.225.624.324.3
Light JuniperNo ControlInitial Control (IC)IC + Follow up (F)IC + F + Deferment (D)IC + F + D + Reseeding
30.030.030.030.030.0
30.330.030.040.160.1
30.630.030.040.160.1
30.930.030.040.160.1
31.230.030.028.627.4
31.530.330.028.627.4
31.830.630.028.627.4
32.330.930.028.627.4
32.831.230.028.627.4
33.331.530.028.627.4

73
Table 3. Southeast Region Grazing Capacity Estimates for Brush Type-Densities andAlternative Brush Control Program Scenarios, Acres per Animal Unit, Year 0 through Year 9.
Year
0 1 2 3 4 5 6 7 8 9
- - - - - - - - - - - - - - - acres per animal unit - - - - - - - - - - - - - - -
Heavy MesquiteNo ControlInitial Control (IC)IC + Follow up (F)IC + F + Deferment (D)IC + F + D + Reseeding
23.023.023.023.023.0
23.120.920.930.630.6
23.319.219.230.630.6
23.418.418.430.630.6
23.518.718.417.517.5
23.619.018.417.517.5
23.819.418.417.517.5
23.919.718.417.517.5
24.120.118.417.517.5
24.220.418.4 17.517.5
Heavy JuniperNo ControlInitial Control (IC)IC + Follow up (F)IC + F + Deferment (D)IC + F + D + Reseeding
35.035.035.035.035.0
35.229.029.046.669.9
35.425.025.046.669.6
35.623.023.046.669.6
35.823.723.021.920.9
36.024.423.021.920.9
36.225.223.021.920.9
36.426.023.021.920.9
36.626.923.021.920.9
36.827.823.021.920.9
Moderate MesquiteNo ControlInitial Control (IC)IC + Follow up (F)IC + F + Deferment (D)IC + F + D + Reseeding
20.020.020.020.020.0
20.319.419.426.726.7
20.519.019.026.726.7
20.819.119.026.726.7
21.119.219.018.118.1
21.319.219.018.118.1
21.619.319.018.118.1
21.919.419.018.118.1
22.219.519.018.118.1
22.519.519.018.118.1
Moderate JuniperNo ControlInitial Control (IC)IC + Follow up (F)IC + F + Deferment (D)IC + F + D + Reseeding
25.325.325.325.325.3
25.624.424.433.750.4
25.923.023.033.750.4
26.223.223.033.750.4
26.623.323.021.920.9
26.923.423.021.920.9
27.223.623.021.920.9
27.623.823.021.920.9
27.924.023.021.920.9
28.324.123.021.920.9
Light MesquiteNo ControlInitial Control (IC)IC + Follow up (F)IC + F + Deferment (D)IC + F + D + Reseeding
19.019.019.019.019.0
19.219.019.025.425.4
19.419.019.025.425.4
19.619.019.025.425.4
19.819.019.018.118.1
19.919.219.018.118.1
20.219.419.018.118.1
20.419.619.018.118.1
20.619.819.018.118.1
20.919.919.018.118.1
Light JuniperNo ControlInitial Control (IC)IC + Follow up (F)IC + F + Deferment (D)IC + F + D + Reseeding
23.023.023.023.023.0
23.323.023.030.646.0
23.523.023.030.646.0
23.723.023.030.646.0
24.023.023.021.920.9
24.223.323.021.920.9
24.523.523.021.920.9
24.823.723.021.920.9
25.224.023.021.920.9
25.624.223.021.920.9

74
Brush Control Treatment Cost Estimates
Brush control practices, treatment costs, and present value in dollars per acre are reported for sixalternative brush type-densities in Tables 4 - 10. Two alternatives for control practices of heavy juniper(tree doze or two-way chaining) are included. Each brush type-density listed has a set of alternativecontrol practice scenarios and per-acre estimated treatment costs with present values (assuming an 8%discount rate - opportunity cost for rancher capital). These present values are necessary to equatescenarios requiring investment outlays initially to those scenarios requiring investment outlays insubsequent years. Year 0 is the year that the initial practice is applied while Years 1 - 9 refer to thenumber of years following the initial practice. In each instance, treatment costs reflect the best estimateby Texas Agricultural Experiment Station and Cooperative Extension scientists. These estimated costscan be reduced by the amount of cost-share funds that are secured through state or federally supportedprograms.
The “initial control” scenarios represent a program where only the initial brush control practice wereimplemented. This type of program would likely fail to achieve the desired brush canopy reductionsand initial results would not be maintained. The “initial control + follow up treatment” scenarios mimicthe brush control practices defined by the State Brush Control Program.
The “initial control + follow up treatments + deferment” scenarios build upon the initial control + followup treatment scenario by adding an incentive payment to the landowner for growing-season defermentof treated acreage. For these estimates, the cost assessed for growing-season deferment was 5% ofthe initial treatment cost of the practice in Year 0. In reality, the actual costs of deferment will varywidely and be most likely evident through reduced grazing capacities (see tables 2 and 3).
The final program scenario examined adds reseeding to the initial control + follow up treatments +deferment program. It should be noted that this option is only applicable to scenarios utilizingmechanical treatment practices which provide sufficient soil disturbance (i.e. pits) to improve theprobability of successful plant establishment. In reality, reseeding would only be advised for sitespecific locations where the desirable plant species were less than 10% of herbaceous composition. Itwas assumed that the costs for reseeding would be proportional to the amount of soil disturbancegenerated from the initial mechanical treatment. Accordingly, reseeding costs of $20, $10, and $5 peracre were used for mechanically-treated heavy, moderate, and light density juniper treatments,respectively. Reseeding would require prolonged grazing deferment by the landowner which is alsorecognized in the specification of landowner benefits from program participation.

75
Table 4. Brush Control Practices, Treatment Costs, and Present Value in Dollars per Acrefor Heavy Mesquite .
Initial Control
Year Treatment DescriptionTreatment
CostPresent Value (PV) of
Treatment Cost
0 Aerial Herbicide $25.00 $25.00
Totals $25.00 $25.00
Initial Control + Follow up Treatments
Year Treatment DescriptionTreatment
CostsPresent Value (PV) of
Treatment Costs
0 Aerial Herbicide $25.00 $25.00
2 or 3 Chemical IPT $25.00 $21.43
7 Prescribed Burn $12.50 $7.30
Totals $62.50 $53.73
Initial Control + Follow up Treatments + Deferment
Year Treatment DescriptionTreatment
CostsPresent Value (PV) of
Treatment Costs
0 Aerial Herbicide $25.00 $25.00
0 Deferment $1.25 $1.25
2 or 3 Chemical IPT $25.00 $21.43
7 Prescribed Burn $12.50 $7.30
Totals $63.75 $54.98
Initial Control + Follow up Treatments + Deferment + Reseeding is NOT APPLICABLE

76
Table 5. Brush Control Practices, Treatment Costs, and Present Value in Dollars per Acrefor Heavy Juniper - Alternative 1
Initial Control
Year Treatment DescriptionTreatment
CostsPresent Value (PV) of
Treatment Costs
0 Tree Doze and Burn $70.00 $70.00
Totals $70.00 $70.00
Initial Control + Follow up Treatments
Year Treatment DescriptionTreatment
CostsPresent Value (PV) of
Treatment Costs
0 Tree Doze and Burn $70.00 $70.00
6 Mechanical IPT or Prescribed Burn $12.50 $7.88
Totals $82.50 $77.88
Initial Control + Follow up Treatments + Deferment
Year Treatment DescriptionTreatment
CostsPresent Value (PV) of
Treatment Costs
0 Tree Doze and Burn $70.00 $70.00
0 Deferment $3.50 $3.50
6 Mechanical IPT or Prescribed Burn $12.50 $7.88
Totals $86.00 $81.38
Initial Control + Follow up Treatments + Deferment + Reseeding
Year Treatment DescriptionTreatment
CostsPresent Value (PV) of
Treatment Costs
0 Tree Doze and Burn $70.00 $70.00
0 Deferment $3.50 $3.50
0 Reseed Pits $20.00 $20.00
6 Mechanical IPT or Prescribed Burn $12.50 $7.88
Totals $106.00 $101.38
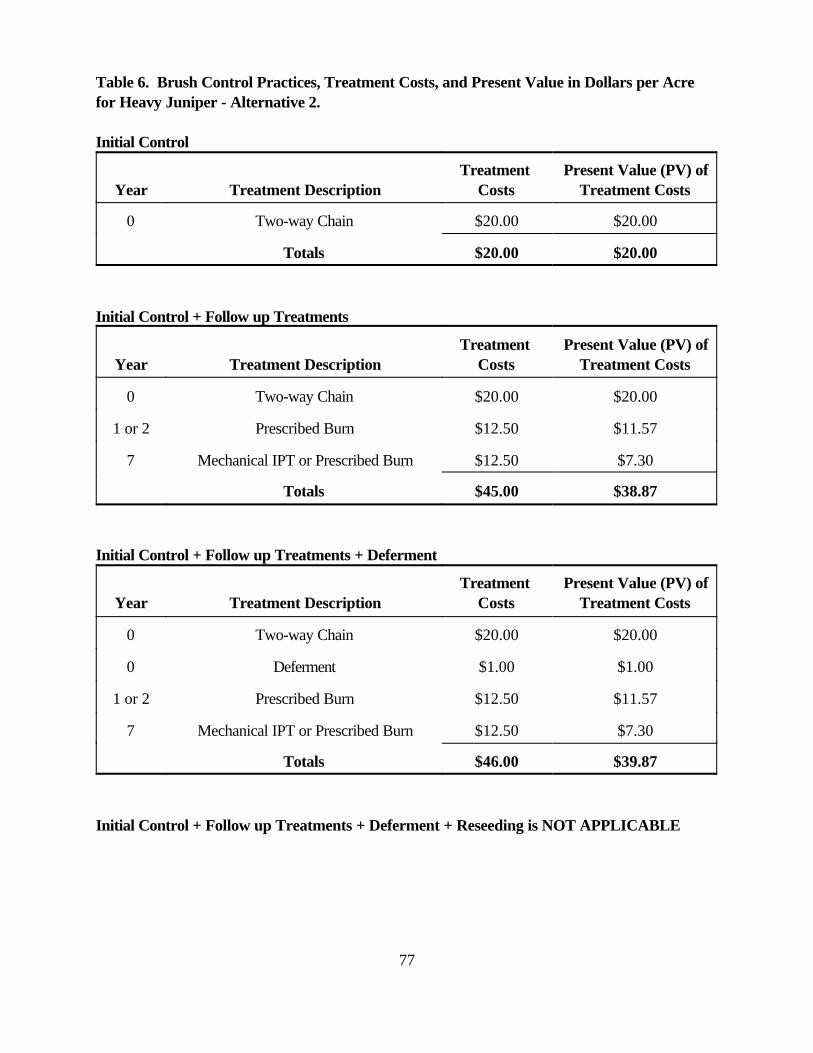
77
Table 6. Brush Control Practices, Treatment Costs, and Present Value in Dollars per Acrefor Heavy Juniper - Alternative 2.
Initial Control
Year Treatment DescriptionTreatment
CostsPresent Value (PV) of
Treatment Costs
0 Two-way Chain $20.00 $20.00
Totals $20.00 $20.00
Initial Control + Follow up Treatments
Year Treatment DescriptionTreatment
CostsPresent Value (PV) of
Treatment Costs
0 Two-way Chain $20.00 $20.00
1 or 2 Prescribed Burn $12.50 $11.57
7 Mechanical IPT or Prescribed Burn $12.50 $7.30
Totals $45.00 $38.87
Initial Control + Follow up Treatments + Deferment
Year Treatment DescriptionTreatment
CostsPresent Value (PV) of
Treatment Costs
0 Two-way Chain $20.00 $20.00
0 Deferment $1.00 $1.00
1 or 2 Prescribed Burn $12.50 $11.57
7 Mechanical IPT or Prescribed Burn $12.50 $7.30
Totals $46.00 $39.87
Initial Control + Follow up Treatments + Deferment + Reseeding is NOT APPLICABLE

78
Table 7. Brush Control Practices, Treatment Costs, and Present Value in Dollars per Acrefor Moderate Mesquite.
Initial Control
Year Treatment DescriptionTreatment
CostsPresent Value (PV) of
Treatment Costs
0 Chemical IPT $25.00 $25.00
Totals $25.00 $25.00
Initial Control + Follow up Treatments
Year Treatment DescriptionTreatment
CostsPresent Value (PV) of
Treatment Costs
0 Chemical IPT $25.00 $25.00
6 Chemical IPT or Prescribed Burn $12.50 $7.88
Totals $37.50 $32.88
Initial Control + Follow up Treatments + Deferment
Year Treatment DescriptionTreatment
CostsPresent Value (PV) of
Treatment Costs
0 Chemical IPT $25.00 $25.00
0 Deferment $1.25 $1.25
6 Chemical IPT or Prescribed Burn $12.50 $7.88
Totals $38.75 $34.13
Initial Control + Follow up Treatments + Deferment + Reseeding is NOT APPLICABLE

79
Table 8. Brush Control Practices, Treatment Costs, and Present Value in Dollars per Acrefor Moderate Juniper.
Initial Control
Year Treatment DescriptionTreatment
CostsPresent Value (PV) of
Treatment Costs
0 Chemical IPT, Grubbing or Tree Shear $20.00 $20.00
Totals $20.00 $20.00
Initial Control + Follow up Treatments
Year Treatment DescriptionTreatment
CostsPresent Value (PV) of
Treatment Costs
0 Chemical IPT, Grubbing or Tree Shear $20.00 $20.00
6 IPT or Prescribed Burn $12.50 $7.88
Totals $32.50 $27.88
Initial Control + Follow up Treatments + Deferment
Year Treatment DescriptionTreatment
CostsPresent Value (PV) of
Treatment Costs
0 Chemical IPT, Grubbing or Tree Shear $20.00 $20.00
0 Deferment $1.00 $1.00
6 IPT or Prescribed Burn $12.50 $7.88
Totals $33.50 $28.88
Initial Control + Follow up Treatments + Deferment + Reseeding
Year Treatment DescriptionTreatment
CostsPresent Value (PV) of
Treatment Costs
0 Chemical IPT, Grubbing or Tree Shear $20.00 $20.00
0 Deferment $1.00 $1.00
0 Reseed Pits $10.00 $10.00
6 IPT or Prescribed Burn $12.50 $7.88
Totals $43.50 $38.88

80
Table 9. Brush Control Practices, Treatment Costs, and Present Value in Dollars per Acrefor Light Mesquite.
Initial Control
Year Treatment DescriptionTreatment
CostsPresent Value (PV) of
Treatment Costs
0 Chemical IPT $15.00 $15.00
Totals $15.00 $15.00
Initial Control + Follow up Treatments
Year Treatment DescriptionTreatment
CostsPresent Value (PV) of
Treatment Costs
0 Chemical IPT $15.00 $15.00
6 Chemical IPT or Prescribed Burn $8.60 $5.42
Totals $23.60 $20.42
Initial Control + Follow up Treatments + Deferment
Year Treatment DescriptionTreatment
CostsPresent Value (PV) of
Treatment Costs
0 Chemical IPT $15.00 $15.00
0 Deferment $0.75 $0.75
6 Chemical IPT or Prescribed Burn $8.60 $5.42
Totals $24.35 $21.17
Initial Control + Follow up Treatments + Deferment + Reseeding is NOT APPLICABLE

81
Table 10. Brush Control Practices, Treatment Costs, and Present Value in Dollars per Acrefor Light Juniper.
Initial Control
Year Treatment DescriptionTreatment
CostsPresent Value (PV) of
Treatment Costs
0 IPT (Chemical or Mechanical) $15.00 $15.00
Totals $15.00 $15.00
Initial Control + Follow up Treatments
Year Treatment DescriptionTreatment
CostsPresent Value (PV) of
Treatment Costs
0 IPT (Chemical or Mechanical) $15.00 $15.00
6 Chemical IPT or Prescribed Burn $8.60 $5.42
Totals $23.60 $20.42
Initial Control + Follow up Treatments + Deferment
Year Treatment DescriptionTreatment
CostsPresent Value (PV) of
Treatment Costs
0 IPT (Chemical or Mechanical) $15.00 $15.00
0 Deferment $0.75 $0.75
6 Chemical IPT or Prescribed Burn $8.60 $5.42
Totals $24.35 $21.17
Initial Control + Follow up Treatments + Deferment + Reseeding
Year Treatment DescriptionTreatment
CostsPresent Value (PV) of
Treatment Costs
0 IPT (Chemical or Mechanical) $15.00 $15.00
0 Deferment $0.75 $0.75
0 Reseed Pits $5.00 $5.00
6 Chemical IPT or Prescribed Burn $8.60 $5.42
Totals $29.35 $26.17
82
Conclusion
The EQIP program has been a popular program among producers and has been over-subscribed by aratio of five to one as a result of insufficient funding to meet producer requests. Many producers inTexas are already making use of EQIP, however annual increases in funding may make limited dollarsavailable to more operations. The current organization of two separate pools of EQIP funds allowsproducers to choose the most appropriate avenue in which to apply.
The ultimate economic results realized from follow-up brush control treatment will depend on the actualout-of-pocket expenses incurred by the landowner, amount of cost-share funds obtained, extended lifeof the initial brush control practice, and efficient utilization of the additional forage produced throughinitial and follow-up brush control treatments. While these economic results will vary from onelandowner to another, the estimates of grazing capacities resulting from alternative brush treatmentpractices should provide a basis for landowners to estimate their potential benefits and revenuesgenerated by livestock production and wildlife.
With regard to the grazing capacity estimates, one essential point to keep in mind is that these estimatesonly reflect forage response to alternative brush control treatments during a 10-year time frame. Potential benefits from several of the scenarios might very well extend beyond 10 years. In the case ofgrowing-season deferment and reseeding, these benefits are likely to be significant, especially if theyfoster sustainable actions by the landowner to manage and utilize forage production. As a riskmanagement tool (especially drought risk management), practices such as growing-season defermentand targeted reseeding efforts may have economic merit even if a purely investment approach does notindicate a break-even return result.
References
United States Department of Agriculture, Natural Resources Conservation Service, (USDA-NRCS),2003, http://www.nrcs.usda.gov/programs/.
Ecological Restoration and Management Consultants. 2002. Alternative management strategies formeeting the spirit of the Texas Brush Control Law and how alternative strategies may affectlandowner participation and societal benefits. FY 2002 - 2003 Texas Brush Control ProgramResearch Report funded by the Texas State Soil and Water Conservation Board.


