The most comprehensive examination to date of the Houston-area restaurant industry
44
Behind the Kitchen Door: Extreme Inequality and Opportunity in Houston’s Vibrant Restaurant Economy BY: the Restaurant Opportunities Center of Houston, the Restaurant Opportunities Centers United, and the Houston Restaurant Industry Coalition November 12, 2015 FUNDING PROVIDED BY: Embrey Family Foundation H O U S T O N
Transcript
Behind the Kitchen Door:Extreme Inequality and Opportunity in Houston’s Vibrant Restaurant Economy
BY: the Restaurant Opportunities Center of Houston, the Restaurant Opportunities Centers United, and the Houston Restaurant Industry Coalition
November 12, 2015
FUNDING PROVIDED BY:
Embrey Family Foundation
HOUSTON
Behind the Kitchen Door:Extreme Inequality and Opportunity in Houston’s Vibrant Restaurant Economy
BY: the Restaurant Opportunities Center of Houston, the Restaurant Opportunities Centers United, and the Houston Restaurant Industry Coalition
November 12, 2015
HOUSTON
Table of Contents
EXECUTIVE SUMMARY 1
I. INTRODUCTION AND METHODOLOGY 5
II. OVERVIEW OF THE HOUSTON RESTAURANT INDUSTRY 7
III. WORKERS’ PERSPECTIVES 13
Low Wages and Few Benefits 14
Wage Law and Working Conditions Violations 16
Mobility and Discrimination 18
Social Cost of Low-Wage Jobs 23
IV. EMPLOYERS’ PERSPECTIVES 27
V. CONCLUSION AND POLICY RECOMMENDATIONS 31
APPENDIX 34
ACKNOWLEDGMENTS 35
NOTES 36
Behind the Kitchen Door:Extreme Inequality and Opportunity in Houston’s Vibrant Restaurant Economy
1
ehind the Kitchen Door: Extreme Inequality and Opportunity in Houston’s Vibrant Restau-rant Economy draws on 553 worker surveys, 27 structured interviews with restaurant workers and 13 employer interviews, along with other industry and government data, to
assemble to most comprehensive research analysis of the restaurant industry in Houston to date. Houston is America’s fastest-growing city1 and its vibrant restaurant industry has been called
the ‘most dynamic and diverse food and drink scene in the nation.’2 However, our research indicates that the restaurant workers whose labor makes Houston’s growth possible are being left behind. The majority of restaurant jobs in Houston remain low-road jobs defined by low wages, few benefits, and poor working conditions.
A DYNAMIC AND GROWING INDUSTRY
Houston’s booming restaurant industry grew 20 percent between 2007 and 2013.3 Today there are 236,100 restaurant workers in 10,444 establishments generating $11.2 billion in annual
revenue and accounting for an estimated $699 million in sales tax for the state and $124 million for the city.4 However, despite the restaurant industry’s importance for the regional economy (see Fig-ure 1), working conditions in Houston’s restaurants remain poor.
LOW WAGES AND ILLEGAL WORKPLACE PRACTICES
While some employers take the ‘high road’ to profitability by pro-viding fair wages and benefits, the majority of Houston’s restaurant employers are taking the ‘low road’ These low-wage jobs have few benefits or opportunities for advancement and many expose workers to dangerous and unlawful working conditions.
Our survey research found that 51% of Houston’s restaurant workers are paid an hourly wage that would not support a family
Executive Summary
FOOD SERVICES AND DRINKING PLACES IN HOUSTON AS A PERCENT OF TOTAL PRIVATE SECTOR JOBS
FIGURE 1
Executive Summary
EX
EC
UT
IVE
SU
MM
AR
Y
In the last decade, restaurants have grown in importance as a percentage of the Houston region’s economy.
Source: Bureau of Labor Statistics, Current Employment Statistics, 2005-2014.
9.2%9.0%8.8%8.6%8.4%8.2%8.0%7.8%7.6%7.4%
2005 2006 2007 2008 2009 2010 2011 2012 2013 2014
B
2
of three above the poverty level in Houston, as defined by the Department of Labor’s Lower Living Standard Income Level (see Table 1). Workers in our study also reported overtime and minimum wage violations, a lack of training, and unsafe workplaces. Nearly twenty percent (18.2%) reported working over 40 hours a week in the past 12 months without being paid the legally mandated overtime rate of time and a half. More than half (54.7%) of restaurant workers reported some sort of safety violation, including missing floor mats, or cutting guards or fire hazards being present in the restaurant
OCCUPATIONAL SEGREGATION AND DISCRIMINATION
Workers of color are concentrated in the restaurant industry’s lower-paying segments and positions — quick serve restaurants and Back-of-the-House positions. As a consequence of occupational segregation 51.9% of workers of color in the industry earn below poverty wages, while 34.3% of white restaurant workers earn below the poverty line. White workers earn a median wage of $11.82, compared to $8.32 among workers of color.
THE SOCIAL COSTS OF LOW-ROAD JOBS
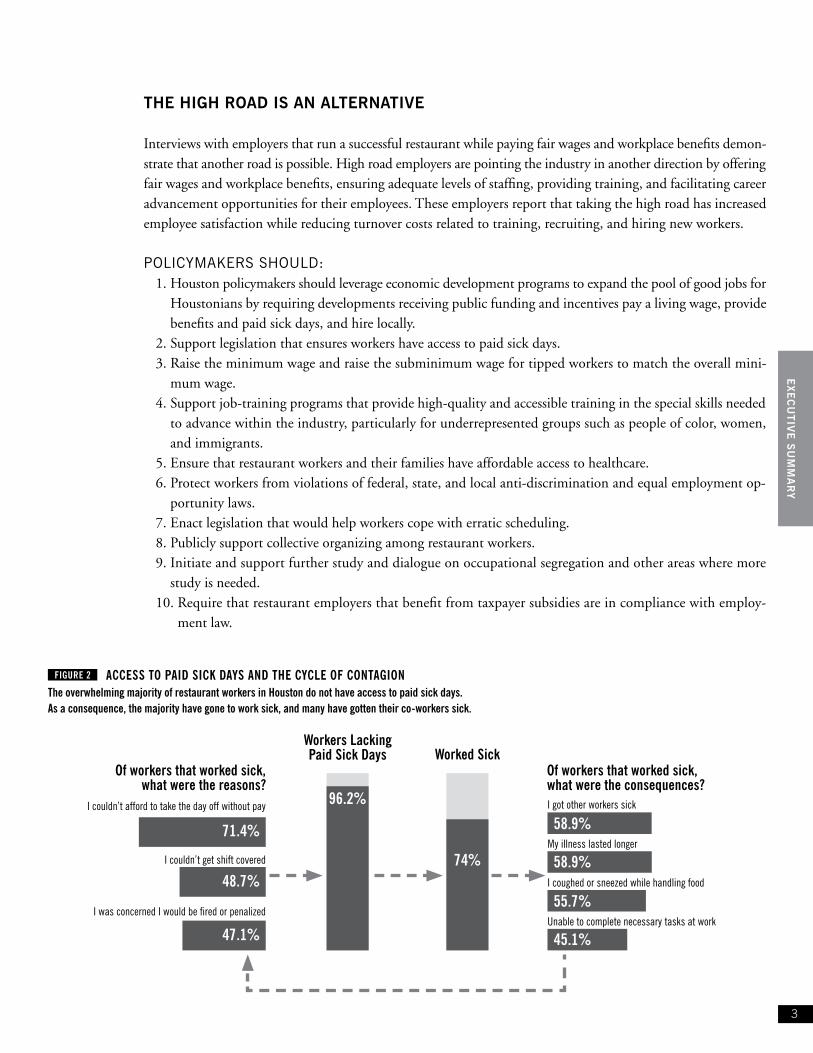
Our research surfaced the hidden costs to customers and taxpayers of pervasive low-road practices in the restau-rant industry. As illustrated in Figure 2, nearly all restaurant workers in Houston (96.2%) lack access to paid sick days, and 74% of these have prepared or served food while sick. When restaurant workers are in a position where they feel compelled to work while sick both customers and their coworkers are at risk of contagion. Over half (55.7%) of restaurant workers that worked while sick said that they have coughed or sneezed while handling food, potentially exposing customers to illness.
Nearly all (93.1%) of surveyed workers were not offered employer-provided health insurance, and almost two-thirds (61.3%) have no health insurance at all. As a product of not having access to healthcare or paid sick leave, many workers are preparing and handling food while sick. Without an environment that protects workers right to basic health conditions, many restaurants pose a health and economic risk to both workers and customers.
TABLE 1
Men Women White People of Color All
All $9.76 $8.79 $11.82 $8.32 $9.16
Fine Dining $13.12 $11.81 $14.50 $11.09 $12.51
Casual Full Service Primarily Tipped Occupations $9.86 $8.30 $10.43 $8.35 $8.96
Quick Serve Fast Food $8.56 $8.13 $8.64 $8.39 $8.51
Quick serve wage data not weighted due to sample constraints.
MEDIAN WAGES IN SELECT RESTAURANT SEGMENTS BY RACE AND GENDER
Wages in Houston’s Restaurants: Restaurant worker wages are among the lowest of all workers in the region. Great disparities exist by race, gender, and segment, with the highest wages earned by white and male workers in fine dining, and the lowest wages earned by workers of color and women in quick serve, or fast food.
3
ACCESS TO PAID SICK DAYS AND THE CYCLE OF CONTAGIONFIGURE 2
The overwhelming majority of restaurant workers in Houston do not have access to paid sick days. As a consequence, the majority have gone to work sick, and many have gotten their co-workers sick.
I got other workers sick
My illness lasted longer
I coughed or sneezed while handling food
Unable to complete necessary tasks at work
Of workers that worked sick, what were the consequences?
Of workers that worked sick, what were the reasons?
I couldn’t afford to take the day off without pay
I couldn’t get shift covered
I was concerned I would be fired or penalized
71.4%
48.7%
47.1%
58.9%
58.9%
55.7%
45.1%
THE HIGH ROAD IS AN ALTERNATIVE
Interviews with employers that run a successful restaurant while paying fair wages and workplace benefits demon-strate that another road is possible. High road employers are pointing the industry in another direction by offering fair wages and workplace benefits, ensuring adequate levels of staffing, providing training, and facilitating career advancement opportunities for their employees. These employers report that taking the high road has increased employee satisfaction while reducing turnover costs related to training, recruiting, and hiring new workers.
POLICYMAKERS SHOULD:1. Houston policymakers should leverage economic development programs to expand the pool of good jobs for
Houstonians by requiring developments receiving public funding and incentives pay a living wage, provide benefits and paid sick days, and hire locally.
2. Support legislation that ensures workers have access to paid sick days. 3. Raise the minimum wage and raise the subminimum wage for tipped workers to match the overall mini-
mum wage. 4. Support job-training programs that provide high-quality and accessible training in the special skills needed
to advance within the industry, particularly for underrepresented groups such as people of color, women, and immigrants.
5. Ensure that restaurant workers and their families have affordable access to healthcare. 6. Protect workers from violations of federal, state, and local anti-discrimination and equal employment op-
portunity laws.7. Enact legislation that would help workers cope with erratic scheduling.8. Publicly support collective organizing among restaurant workers.9. Initiate and support further study and dialogue on occupational segregation and other areas where more
study is needed.10. Require that restaurant employers that benefit from taxpayer subsidies are in compliance with employ-
ment law.
Workers Lacking Paid Sick Days Worked Sick
96.2%
74%
EMPLOYERS SHOULD:1. Adopt systematic and fair hiring and promotions practices, including anti-discrimination
and harassment policies.2. Enhance job quality and employee retention by increasing wages and developing scheduling
practices that meet both employer and worker needs.3. Learn techniques that successful restaurant employers use to implement livable wages,
benefits, scheduling control, and career ladders. ROC-Houston can act as a resource to provide technical assistance to employers.
CUSTOMERS SHOULD:1. Support responsible restaurant owners who provide fair wages, benefits, and opportunities
for workers to advance. Many of these restaurants can be found in the Restaurant Oppor-tunities Centers’ National Diners’ Guide (www.rocunited.org/dinersguide).
2. Speak to employers every time you eat out and let them know you care about livable wages, benefits, and opportunities for women and people of color to advance in the restaurant industry.
3. Where workers have filed legal charges against employers who are violating the law, call the company and let them know that you will not support illegal practices.
WORKERS SHOULD:1. Become involved in the Houston restaurant worker movement. There are many opportuni-
ties for involvement in worker-led committees, trainings and more.
2. Workers should know their legal rights as persons and workers, document unfair and poten-tially illegal practices they encounter at work, and take concerted action when appropriate.
5
Greater Houston is the fifth largest metropolitan area in the United States, and has benefitted from tremendous growth in the restaurant industry. Houston’s vibrant res-taurant industry has been called the ‘most dynamic and diverse food and drink scene
in the nation.’5 At the same time, Houston restaurant workers have among the lowest wages in the region, with 51% earning below the poverty wage of $9.40. Houston is preempted by Texas state law from raising the minimum wage, or ensuring a basic standard of benefits to address the tremendous disparity faced by low wage workers. As a result, a majority of workers
have jobs that offer no health insurance, no sick or vacation days, few advancement opportunities, and expose them to unhealthy and unsafe workplace conditions.
Through integrating 553 in-person worker surveys with worker and employer interviews, and analysis of government data, we have assem-bled the most comprehensive picture of the state of Houston’s restaurant industry to date. Our research suggests that the majority of restaurants take the low road to profitability in the Houston restaurant industry, but that the high road is a viable option for Houston restaurants to adopt. Restaurant employers who take the high road are the source of the best jobs in the industry: jobs that offer career advancement, wages that support a family, and a healthy workplace. Taking the low road to profitability, on the other hand, creates low-wage jobs with few ben-efits, long hours, and little opportunity for advancement. This not only harms workers, but also high-road restaurant employers, consumers, and
taxpayers. Low road practices also create negative public health implications such as customers being served food by sick restaurant workers.
Our research reveals that Houston has a long way to go to improve working conditions for the restaurant industry’s workforce. The majority of employers take the low road to profitability. Our primary research — interviews and surveys with restaurant workers, coupled with govern-ment and industry statistics — provides the most comprehensive look at working conditions in Houston’s restaurant industry. The result is an invaluable overview of the characteristics of workers in the industry, their wages, benefits, and working conditions, and provides a map to addressing and overcoming these challenges.
Introduction and Methodology
Chapter I
INTR
O A
ND
ME
THO
DO
LOG
Y
6
METHODOLOGY
INTERVIEW METHODOLOGYIn order to obtain a holistic picture of the daily lives of restaurant workers, and to gain detailed information about the nature of working conditions, in-depth, open-ended, one-on-one interviews were conducted with 27 workers. Similarly, in-depth, open-ended, one-on-one interviews were conducted with 13 employers and managers in order to gain a deeper understanding of the constraints and needs of restaurant establishments, and to gain detailed information about current trends in the industry. Names were changed to protect interviewees’ confidentiality.
In-depth interview guides were used to structure interviews and ensure that all interviews of workers, and separately all interviews of employers, covered the same general topics, but respondents were also given the space to discuss issues and lead the conversation in directions that they considered relevant or important. Interviewers were trained in how to use the guides to conduct structured, open-ended interviews. The interviews were recorded and analyzed using Dedoose software.
SURVEY METHODLOGYThe survey was administered from July 2012 to June 2014 by staff, members, and volunteers from the Restaurant Opportunities Center of Houston (ROC – Houston), a community-based organization with significant contacts among restaurant workers and access to workplaces in the industry. A total of 553 surveys were conducted face-to-face with restaurant workers in the Houston Metropolitan Area. Unless otherwise specified, Houston refers to the Houston-The Woodland-Sugar Land Metropolitan Statistical Area (MSA). Our sample consisted entirely of workers currently employed in the restaurant industry, with 58% of respondents with four years of experience or more at their current employer, within the Houston (MSA). We sought to capture a wide range of experiences in each of the three main segments of the industry — fine dining, casual dining, and quick serve. The sample was stratified to ensure that the workers interviewed were as representative as possible by gender, race, age, and segment, with an oversample in fine dining. No more than two workers were interviewed from any one establishment. To add to the rigor of the survey data analysis, we weighted the data according to proportions of Front and Back-of-the-House workers within full-service and limited-service restaurants to appropriately reflect the actual distribution of posi-tions in the industry. Resulting statistics were analyzed using Stata SE12 statistical data analysis software. Results from this survey refer to the weighted figures unless otherwise stated, with the exception of race by segment which was not weighted since it closely matched industry figures.
WAGE METHODOLOGYSurveys were conducted over a two-year period, so wage data were normalized across the survey population to 2014 by accounting for year-to-year increases in inflation ac-cording to the Consumer Price Index. Due to the average tenure of workers sampled and fine dining oversample, the median wage might be higher for our sample than the overall wages recorded by employers in the Houston-The Woodlands-Sugar Land Metropolitan region, yet provides an accurate snapshot of differences in wages by race, gender, and occupation within the Houston restaurant industry.
Front of the House and Back of the
House refer to restaurant industry
terms for the placement and function
of workers in a restaurant setting.
Front of the house generally refers to
those interacting with customers in
the front of the restaurant including
wait staff, bussers and runners.
Back of the house workers generally
refers to kitchen staff including
chefs, cooks, food preparation staff,
dishwashers, and cleaners.
High road and low road are industry
terms referring to opposing business
strategies for achieving productivity
and profitability. In this report, the
former is used to denote employer
practices that involve investing in
workers by paying livable wages,
providing comprehensive benefits,
opportunities for career advancement,
and safe workplace conditions as
means to maximize productivity. The
results are often reduced turnover
as well as better quality food and
service. The latter refers to strategies
that involve chronic understaffing,
failing to provide benefits, pushing
workers to cut corners, and violating
labor, employment and health and
safety standards. Low-road practices
are not simply illegal practices —
they are employment practices, such
as providing low wages and little or
no access to benefits, that are not
sustainable for workers and their
families, and that have a long-term
negative impact on both consumers
and employers.
TERMS USED IN THIS REPORT
7
Houston’s restaurant industry has shown consistent growth over the last decade, and is a key driver in the local economy’s growth and success (see Figure 3). Between 2007 and 2013, the number of
food service and drinking establishments in the Houston area has increased 20 percent, from 8,735 to 10,444.6 In 2012, Houston restaurants generated $11.2 billion in revenue, accounting for an estimated $699 million in sales tax for the state and $124 million for the city proper.7 Moreover, the city’s restaurant industry has played a critical role in establishing Houston’s status
as “America’s next great global city.”8
In order to assemble a comprehensive analysis of the issues restaurant workers face in the Houston-area, we collected 553 worker surveys, and conducted 27 in-depth interviews with workers, and 13 interviews with employers, over a 23-month period. This primary research is supplemented with analyses of industry and government data and reviews of existing academic literature. Houston’s growing restaurant industry includes more than 236,100 workers in 10,444 establishments, which con-tribute to the region’s tourism, hospitality, and entertainment sectors. Houston restaurant workers comprise 9% of the total local private sector employment. Our survey research found that 51% of Houston restaurant workers are paid an hourly wage that would not support a family of three above the pov-erty level in Houston.
HOW MANY JOBS?
The restaurant industry is the fifth largest private sector em-ployer in Houston. In 2014, according to the Bureau of Labor Statistics, the Houston restaurant industry employed 236,100 workers, 9% of all private sector employees.10
Since 2005, the Houston restaurant industry’s share of
Overview of the Houston Restaurant Industry
Chapter II
OV
ER
VIE
W O
F IN
DU
ST
RY
EIGHT LARGEST PRIVATE SECTOR EMPLOYERS IN HOUSTONThe restaurant industry is the fifth largest private sector employer in the Houston area.
Source: Bureau of Labor Statistics, Quarterly Census of Employment and Wages, 2005-2014.
FIGURE 3
TRADE, TRANSPORTATION & UTILITIES
PROFESSIONAL & BUSINESS SERVICES
EDUCATION & HEALTH SERVICES
MANUFACTURING
FOOD SERVICES AND DRINKING PLACES
CONSTRUCTION
FINANCIAL ACTIVITIES
OIL AND GAS EXTRACTION
700,000
600,000
500,000
400,000
300,000
200,000
100,000
2005 2006 2007 2008 2009 2010 2011 2012 2013 2014
8
SEGMENTThe North American Industry Classification System
(NAICS) categorizes the restaurant industry (“Food Services
and Drinking Places”) into four segments: full-service
restaurants, which have table service where the consumer
orders from a menu at a table; limited-service restaurants,
which have no table service; special food services, which
provide services such as catering; and drinking places,
which serve drinks but not food.9 The restaurant categories
used in this report align with the NAICS categories, with
the addition of a distinction within full-service between ‘fine
dining’ and ‘casual restaurants.’ Distinguishing between
these two categories is critical to our analysis because job
quality, employer practices, and patterns for ethnic and
racial employment and occupational segregation differ
across the two segments. The categories used in this report
are as follows:
1 FINE DINING includes full-service restaurants commonly
referred to as “upscale” restaurants. The typical dining
tab per person is above $30.
2 CASUAL RESTAURANTS, also described as ‘casual
dining’ or ‘family style’ restaurants, are moderately priced
full-service restaurants. They include franchise or chain
restaurants, such as Olive Garden or Applebee’s, as well
as independently owned establishments.
3 QUICK SERVE, limited service restaurants, serve
food without table service. Examples include ‘fast food’
restaurants like McDonald’s, or ‘fast casual’ restaurants,
like Chipotle, that may have higher prices and cater to
different clientele.
4 BARS AND OTHER includes catering, and bars that do
not serve food.
POSITIONJobs in the restaurant industry generally fall into one of
three basic categories, each corresponding to different levels
of compensation, potential for mobility, access to training,
workplace conditions, and other indicators of job quality:
1 MANAGERS AND SUPERVISORS,
INCLUDING CHEFS.
2 FRONT-OF-THE-HOUSE POSITIONS, including all staff
that has direct contact with customers, such as servers,
bartenders, hosts, and bussers.
3 BACK-OF-THE-HOUSE POSITIONS, or those that
do not involve direct contact with customers, but are
essential to a restaurant’s functions, such as dishwashers
and cooks. Many quick service employees work a
combined back of the house and front of the house
position. Quick serve jobs are categorized as Back-of-
the-House in this study because wages and working
conditions in them are similar to those in Back-of-the-
House jobs.
RESTAURANT TERMINOLOGY
As shown throughout the report, wages and working conditions vary markedly between position and industry segment.
9
OV
ER
VIE
W O
F IN
DU
ST
RY
private sector employment has risen from 7.9% to 9% (see Figure 4).11 While industry employment growth was nearly flat during the Great Recession in 2009, it quickly rebounded and continued its growth trajectory.
WHAT ARE THE CHARACTERISTICS OF THE WORKFORCE?
Most jobs in the restaurant industry do not require formal education, with the exception of chefs and sommeliers (wine stewards). There is no formalized training or universally accepted certification for most restaurant jobs; instead most employees obtain job skills during on-site training. Back of the house workers, often working in hot, cramped spaces, must be able to fill orders in a timely fashion in a high-pressure environment. Front of the house staff and other employees who interact with customers need strong interpersonal skills, time and task management skills, and a working knowledge of food preparation and presentation.
Census data shows that the Houston restaurant industry is generally younger, has greater represen-tation of women and people of color, with a higher proportion of foreign-born workers and workers without a college degree than the overall workforce (see Table 2). Some key statistics include:
GENDERWomen make up over half of the industry’s overall workforce, and make up 61% of the industry’s tipped restaurant occupations, and 65% of servers, compared to 44% of the overall economy.12
AGEHouston restaurant workers are younger on average than the overall labor force of the city, but the industry is an important source of jobs for workers in all age brackets. The median age of restaurant employees is 31 compared to 40 in the overall work force. Over 33% of restaurant industry workers are between the ages of 16 and 24, nearly three times the rate of all Houston workers in the same age category, and the share of workers between the ages of 45 and 64 is 22%, or nearly two-thirds as many as the 36% among all workers. However, in the restaurant industry nearly 44% of workers are between the ages of 25 to 44, closer to the 48% in the economy overall.13
FOOD SERVICES AND DRINKING PLACES JOBS IN HOUSTON AS A PERCENT OF TOTAL PRIVATE SECTOR JOBS
In the last decade, restaurants have grown in importance as a percentage of the Houston region’s economy.
Source: Bureau of Labor Statistics, Current Employment Statistics, 2005-2014.
RACEApproximately 77% of the restaurant labor force in 2010 was comprised of Blacks, Asians, Latinos, and other workers of color, compared to only 59% among all Houston workers. Latino workers com-prise the largest single group overall, at 56%, compared to 34% among the total workforce. Blacks and Asians are slightly underrepresented in the restaurant industry, compared to the total economy, at 13% and 6% of restaurant workers, compared to 16% and 7% of all workers, respectively. White workers are only 23% of restaurant workers, compared to 41% of all workers in Houston.14 In total, the restaurant industry provides greater opportunities for workers of color than the rest of the economy, but as shown in Chapter III, tends to segregate them in the lower earning segments of the industry.
FOREIGN BORNIn Houston, 47% of workers employed in the restaurant industry are foreign born, compared to 31% in all industries.15
EDUCATIONThe restaurant industry provides greater opportunities for workers without extensive education, 35% have less than a high school degree, and 38% have a high school diploma, compared to 14% and 30% of all Houston workers, respectively. Twenty six percent of restaurant workers have at least some college, compared to 56% among all workers.16
WHAT DO THE JOBS PAY?
While Houston restaurant industry employment has grown in the past decade, wages in the region have not kept pace. According to the Bureau of Labor Statistics’ Occupational Employment Statistics (OES) survey of employers, in 2014, the median hourly wage for a worker in metro Houston’s restaurant in-dustry was only $9.02 per hour, or about 51% of the $17.73 median wage per hour for all occupations (see Table 3).17 The average annual salary was $18,770 in the restaurant industry, slightly more than half the average salary of $36,880 among all occupations. Moreover, according to the OES, over 80% of the workers in the restaurant industry are employed in positions that earn an hourly median wage below $9.40, the 2015 poverty wage needed to reach a low standard of living for a family of three in the metropolitan Houston area if a person works full-time, year round (2,080 hours; see Chapter III). Our survey data of restaurant workers in the Houston area found a $9.16 median wage, with 51% of workers earning below $9.40 per hour.
ECONOMIC DYNAMISM OR DANGEROUSLY LOW STANDARDS FOR HOUSTON JOBS?
The data presented in this chapter demonstrate the robust growth of the restaurant industry in Hou-ston and its centrality to the city’s economic life. However, they also call attention to the fact that the growth of the restaurant industry has meant that a growing number of Houston jobs do not pay enough to support a family. The patterns observed in the Houston restaurant industry are part of an unsettling broader dynamic in the U.S. labor market of growing inequality with economic growth centered on low-wage service occupations.
11
OV
ER
VIE
W O
F IN
DU
ST
RY
OCC CODE OCC TITLE H Median A Median H Average A Average00-0000 All Occupations $17.73 $36,880 $24.44 $50,83035-0000 Food Preparation and Serving Related Occupations $9.02 $18,770 $10.37 $21,58035-1011 Chefs and Head Cooks $19.12 $39,770 $22.01 $45,78035-1012 First-Line Supervisors of Food Preparation and Serving Workers $15.49 $32,230 $17.24 $35,86035-2011 Cooks, Fast Food $8.52 $17,720 $8.50 $17,69035-2012 Cooks, Institution and Cafeteria $10.60 $22,040 $11.18 $23,26035-2014 Cooks, Restaurant $10.38 $21,600 $10.61 $22,08035-2015 Cooks, Short Order $9.14 $19,020 $9.63 $20,03035-2019 Cooks, All Other $10.08 $20,960 $12.35 $25,70035-2021 Food Preparation Workers $9.31 $19,370 $9.79 $20,36035-3011 Bartenders $8.97 $18,660 $11.38 $23,68035-3021 Combined Food Preparation and Serving Workers, Including Fast Food $8.66 $18,020 $8.80 $18,30035-3022 Counter Attendants, Cafeteria, Food Concession, and Coffee Shop $8.63 $17,950 $9.00 $18,73035-3031 Waiters and Waitresses $8.99 $18,700 $10.78 $22,43035-3041 Food Servers, Nonrestaurant $8.85 $18,410 $9.53 $19,82035-9011 Dining Room and Cafeteria Attendants and Bartender Helpers $8.71 $18,130 $9.18 $19,09035-9021 Dishwashers $8.86 $18,420 $8.96 $18,65035-9031 Hosts and Hostesses, Restaurant, Lounge, and Coffee Shop $8.74 $18,180 $8.93 $18,56035-9099 Food Preparation and Serving Related Workers, All Other $8.88 $18,480 $9.53 $19,820Source: Bureau of Labor Statistics, Occupational Employment Statistics, 2014
Houston restaurant workers All Houston workersGENDER Male 46.6% 55.7%Female 53.4% 44.3%
NATIVITY Citizen 64.4% 81.8%Not a citizen 35.6% 18.2%Birth citizen 54.3% 70.3%Foreign born 46.5% 30.7%
Houston restaurant workers All Houston workersPLACE OF BIRTHU.S. 53.5% 69.3%Latin America 39.2% 20.3%Europe 0.8% 1.7%Asia 6% 7.1%Africa 0.5% 1.3%Other 0% 0.4%
YEARS IN THE U.S.Born in the U.S. 53.4% 68.9%0-5 years 7.2% 3.5%6-10 years 8.8% 4.5%11-15 years 10.7% 5.6%16-20 years 6.7% 4.5%21 or more 13.3% 13.0%
ABILITY TO SPEAK ENGLISH Speaks only English 42.9% 61.4%Speaks very well 20.6% 20.8%Speaks well 12.4% 7.9%Speaks, but not well 17.6% 6.9%Does not speak English 6.5% 3.1%
EDUCATION Less than high school degree 35.4% 13.9%High School Degree 38.4% 29.8%Some college 20.7% 24.1%Bachelor’s degree and higher 5.6% 32.3%
Source: ROC United analysis of American Community Survey (2010-2013). Ruggles, Steven, Alexander J. Trent, Genadek Katie, Goeken Ronald, Schroeder Matthew B., and Soebek Matthew, Integrated Public Use Microdata Se-ries: Version 5.0 [Machine-readable database], (Minneapolis: Minnesota Population Center, 2010).
DEMOGRAPHIC PROFILE OF HOUSTON-THE WOODLANDS-SUGAR LAND’S RESTAURANT WORKERS, 2010-2013
MEDIAN AND AVERAGE WAGES FOR RESTAURANT OCCUPATIONS IN THE SEATTLE-TACOMA-BELLEVUE METROPOLITAN REGION
TABLE 2
TABLE 3
13
Chapter III
WO
RK
ER
S’ P
ER
SP
EC
TIV
ES
The following chapter shares the findings of over 550 surveys and 27 in-depth interviews conducted with restaurant workers in Houston. The results paint a detailed picture of the demographics and experiences of workers, going deeper than government data
alone. Some key findings:
LOW WAGES AND FEW BENEFITS• Over two thirds (69%) of Houston workers are low wage workers or below (less than $14.10
per hour). While slightly under a fifth (18%) of restaurant workers responding to our survey reported making wages equal to 150% of the poverty line ($14.10 per hour), 13% earn a living wage (over $25.58 per hour).
• An overwhelming majority do not have employer-provided health insurance (93.1%), and almost two-thirds (61.3%) have no health insurance at all.
• The vast majority of workers receives no paid sick days (96.2%) or paid vacation days (81%). As a result, 71% have gone to work sick.
WAGE LAW AND WORKING CONDITION VIOLATIONS• About one out of every 42 (2.4%) workers reported being paid below the mandated mini-
mum wage of $7.25 per hour.• Nearly a fifth (18.2%) reported working over 40 hours a week in the past 12 months with-
out being paid the legally mandated overtime rate of time and a half, a violation of both state and federal wage law.
• More than half (54.7) reported some sort of safety violation, including missing floor mats, or cutting guards or fire hazards being present in the restaurant.
• More than a quarter (25.6%) of workers surveyed reported never receiving instructions or training on workplace safety, and 30.4% had done something in the past 12 months that had endangered their own safety.
MOBILITY AND DISCRIMINATION• More than 60% (62.6%) of workers said that their schedule changed after it was posted,
with 13.3% of those workers saying it happens frequently.• Of the 29.9% of workers who reported being unfairly passed over for a promotion, 26.0%
Workers’ Perspectives
14
believed that race or ethnicity was a factor in shaping that deci-sion. Over 23% reported that gender was a factor.
• Eighty eight percent of workers in the quick serve sector are work-ers of color compared to 12% of white workers. In comparison, 68% of workers in fine dining are workers of color and 32% are white (these figures are 75% and 25%, respectively, in the industry overall).
• Sixty percent of workers in quick serve reported wages below the poverty line, compared to 34% of workers in fine dining.
LOW WAGES AND FEW BENEFITS
The following chapter takes an in-depth look at the characteristics, ex-periences and problems faced by restaurant workers in Houston. The survey instrument used explores wage and benefits data, workplace conditions, issues of discrimination and harassment, and promotion practices. For more information on methodological details, please refer to Chapter I.
EARNINGS
Because I’ve done it for so long I’ve accepted the fact that you work in a restaurant, you don’t get benefits. You don’t get paid. When you take off work, you don’t get paid. That’s just . . . it’s like a learned helplessness that you get when you work in that industry for so long. That’s the way it is, and that’s the way it’s always going to be. And you deal with it, and you hate it all the way. —White female server, 18 years in the industry
Although reported wages are higher than other cities examined, Hou-ston restaurant workers still earn low wages, with a median wage of $9.16 falling below the poverty line. As seen in Table 4, the majority of workers (68.8%) fall into low wage or below, with 51% earning poverty level wages. Texas’ tipped minimum wage law allowed em-ployers to pay tipped workers as little as $2.13 per hour, and while 18% of workers earn more than 150% of the poverty live wage, only 13% earn a livable wage. Like many low-wage industries, workers in our sample turn to have more than one job to makes ends meet. More than a quarter (26.7%) of workers surveyed reported working a second job.
HOUSING Houston restaurant workers also struggle with affording housing. The standard on housing affordability is that rent should equal no more than 30% of income. Using this standard, a restaurant worker work-
51% Below Poverty Line ($9.40)
17.8% Low Wage ($9.41 – $14.09)
17.8% Over 150% of Poverty ($14.10-$25.57)
13.5% Living Wage ($25.58 and higher)
WAGES EARNED BY RESTAURANT WORKERS IN HOUSTON
TABLE 4
Since 1991, the federal tipped sub-minimum wage has been set at $2.13 per hour. States may establish a minimum wage that is higher than the federal government’s. This has resulted in a patchwork of state policies in which, effectively, restaurant workers in 18 states receive the federal sub-minimum wage of $2.13 per hour, restaurant workers in 25 states receive a state sub-minimum wage higher than $2.13 per hour but less than the full minimum wage, and restaurant workers in seven states receive the full minimum wage because those states have chosen to pay an equal wage to both tipped and non-tipped workers. Poverty rates for tipped workers, particularly for women, who make up 61%, and for people of color, who make up 66.3% of tipped restaurant workers — are higher in states that pay a $2.13 sub-minimum wage than in states that pay one minimum wage for tipped and non-tipped workers. In Houston, tipped restaurant workers live in poverty at 1.7 times the rate of the overall workforce. In our survey, primarily tipped casual full service occupations reported earning median wages of $8.96 per hour. That’s 20 cents per hour below the median wage reported by restaurant workers generally in the Houston area. Women in this segment reported earning a median wage of only $8.30 per hour. To make matters worse, 12.6% of tipped workers report management took a share of their tips. Nearly 55% of women tipped restaurant workers reported experiencing sexual harassment from customers. Tipped workers feel forced to accept sexual harassment since they depend almost entirely on tips for their income.12, 20
THE TIPPED SUBMINIMUM WAGE
15
ing 35 hours (the median weekly hours worked), earning a median wage of $11.50 can only afford $575 in rent per month. According to the National Low Income Housing Coalition (NLIHC), the fair market rent for a two-bedroom unit in the Houston met-ropolitan region is $864.18 A restaurant worker would have to work nearly 75 hours per week, if working several jobs without overtime, or 63.4 hours if being paid overtime.
According to our data, workers spend on average $600 per month on rent, $25 over the $575 figure of what is considered affordable,19 and $264 below the fair mar-ket rate for a two bedroom in the Houston metro area. To offset the costs of housing, many workers live with others; the majority of workers (81.8%) live with between one and four other people. Over 40% (44.2%) of workers earning below poverty wages live with at least four other people, compared to 36.3% of those earning 150% of the poverty wage. Nearly 7% of workers earning below the poverty line live with six or more people.
BENEFITS
“They had this policy where if you do call out sick [you] have to provide a doctor’s note. In my situation, I didn’t have insurance and I thought ok how am going to get a doctor’s note if I can’t afford to go to the doctor.” —Latina server
Similar to restaurant workers across the county, the majority of restaurant workers surveyed in Houston do not receive basic workplace benefits. Table 5 shows how per-
TABLE 5
WORKER PROFILE
JOB BENEFITS AND HEALTH REPORTED BY RESTAURANT WORKERS
Does not receive health insurance from employer
93.1%
Do not have any health insurance coverage
61.3%
Gone to the ER without being able to pay in the past year
20%
Do not get paid sick days 96.2%
Do not get paid vacation days 81%
Have worked when sick 71%
Barry has had a varied and international career in the restau-rant industry. Overall, restaurant work has served him well, providing a flexible schedule and allowing him to travel. He has worked positions in both the back and front of house, but feels more at home interacting with customers in the front of the house, currently as a bartender. Over the course of his 13-year career, Barry has worked for restaurant chains and corporations, including the British celebrity chef, Jamie Oliver. Barry has experienced first hand bad practices in his work-places. He has witnessed employees work off the clock, work while sick, and inflexible managers who are too concerned with bottom line numbers and not in touch with on the floor best practices to keep the restaurant running smoothly.
However, Barry has also worked for good employers, but he notes this is the exception in the industry. His experience working in the United Kingdom showed him an alternative model where training and promotion from within were valued and a livable wage with benefits was commonplace. “The exception is working for Jamie Oliver, the celebrity chef, work-ing for [him] was a model for the way restaurants should be [run]. I mean, we were paid a fair hourly wage, and we were tipped as well. Our hourly wage came on our paychecks; our
tips came on our paychecks too. So we were guaranteed to claim them. Our healthcare was government sponsored be-cause it was in the United Kingdom, however there [were] retirement benefit plans for hourly employees. There were op-portunities to move into management very quickly if that’s what you wanted.”
There have been moments when Barry, recognizing his position as a white male, has acted as an advocate for his co-workers. Whether it is as a translator for the back of house staff, or concern for a fellow server who will be out of work for weeks without pay due to surgery, he looks out for his cowork-ers. Recently Barry insisted that a fellow server with pink eye go home. Barry said, “the manager tried to make them work. And they probably would have if I had not gone to the manager and the other employees and said this is a potential food-borne virus that is spreadable to our guests. He cannot work, I will not work with him, I want you to send him home now and if you don’t, I’m going to call the health department myself.” Un-fortunately, unsafe and unfair practices like this are pervasive in the restaurant industry and often workers, unlike Barry, are afraid they will lose their job if they speak up about it.
Barry 13 years in the industry, bartender and server
WO
RK
ER
S’ P
ER
SP
EC
TIV
ES
16
vasive the lack of benefits are, with 93.1% of workers not receiving insurance through their employer, and 61.3% having no insurance at all. Additionally, 96.2% have no sick days, and 81% have no vacation days. As a result, 71% have reported working while sick (see later in this section for a comprehensive discussion about the public health risks associated with the lack of sick days), and 20% have reported going to the ER without being able to pay in the last year.
WAGE LAW AND WORKING CONDITIONS VIOLATIONS
SCHEDULING ISSUESInconsistent scheduling is a major issue in the restaurant industry across the country. In Houston, more than six in ten (62.6%) workers said that their schedule changed after it was posted, with 13.3% of those workers saying it happens frequently. Even once they arrive at work, restaurant workers often have issues of either being sent home early when a shift was slow (35.9%) or being kept past the end of their shift when it was busy (64.8%). Beyond inconvenience, these frequent changes in schedule with little to no notice have an impact on the lives of restaurant workers, especially when it comes to childcare.
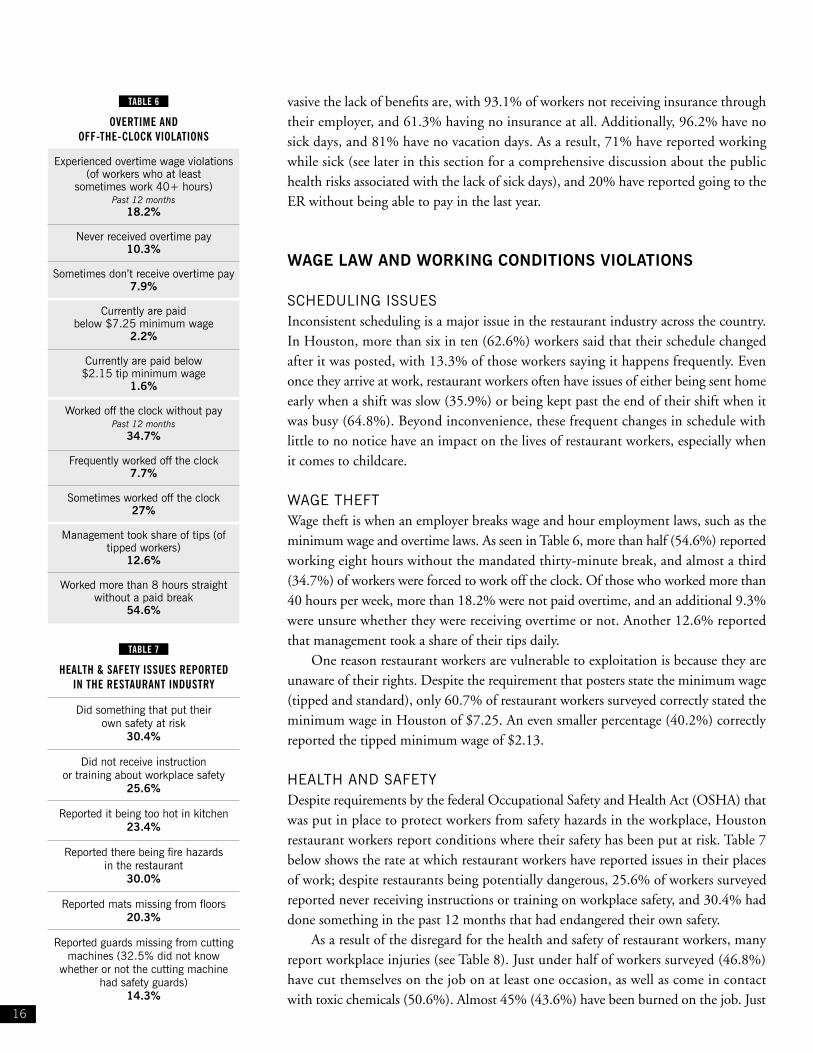
WAGE THEFTWage theft is when an employer breaks wage and hour employment laws, such as the minimum wage and overtime laws. As seen in Table 6, more than half (54.6%) reported working eight hours without the mandated thirty-minute break, and almost a third (34.7%) of workers were forced to work off the clock. Of those who worked more than 40 hours per week, more than 18.2% were not paid overtime, and an additional 9.3% were unsure whether they were receiving overtime or not. Another 12.6% reported that management took a share of their tips daily.
One reason restaurant workers are vulnerable to exploitation is because they are unaware of their rights. Despite the requirement that posters state the minimum wage (tipped and standard), only 60.7% of restaurant workers surveyed correctly stated the minimum wage in Houston of $7.25. An even smaller percentage (40.2%) correctly reported the tipped minimum wage of $2.13.
HEALTH AND SAFETYDespite requirements by the federal Occupational Safety and Health Act (OSHA) that was put in place to protect workers from safety hazards in the workplace, Houston restaurant workers report conditions where their safety has been put at risk. Table 7 below shows the rate at which restaurant workers have reported issues in their places of work; despite restaurants being potentially dangerous, 25.6% of workers surveyed reported never receiving instructions or training on workplace safety, and 30.4% had done something in the past 12 months that had endangered their own safety.
As a result of the disregard for the health and safety of restaurant workers, many report workplace injuries (see Table 8). Just under half of workers surveyed (46.8%) have cut themselves on the job on at least one occasion, as well as come in contact with toxic chemicals (50.6%). Almost 45% (43.6%) have been burned on the job. Just
TABLE 6
OVERTIME AND OFF-THE-CLOCK VIOLATIONS
Experienced overtime wage violations (of workers who at least
sometimes work 40+ hours) Past 12 months
18.2%
Never received overtime pay 10.3%
Sometimes don’t receive overtime pay 7.9%
Currently are paid below $7.25 minimum wage
2.2%
Currently are paid below $2.15 tip minimum wage
1.6%
Worked off the clock without pay Past 12 months
34.7%
Frequently worked off the clock 7.7%
Sometimes worked off the clock 27%
Management took share of tips (of tipped workers)
12.6%
Worked more than 8 hours straight without a paid break
54.6%
TABLE 7
HEALTH & SAFETY ISSUES REPORTED IN THE RESTAURANT INDUSTRY
Did something that put their own safety at risk
30.4%
Did not receive instruction or training about workplace safety
25.6%
Reported it being too hot in kitchen 23.4%
Reported there being fire hazards in the restaurant
30.0%
Reported mats missing from floors 20.3%
Reported guards missing from cutting machines (32.5% did not know
whether or not the cutting machine had safety guards)
14.3%
17
WO
RK
ER
S’ P
ER
SP
EC
TIV
ES
over one fifth (21.7%) of workers have slipped on the job. Job requirements also take a toll on workers; more than 60% (61.1%) of workers surveyed use the same motion repeatedly for more than an hour a day, 37.9% regularly lift 20 pounds or more without help, and 18.7% regularly lift 50 pounds or more. As a result, nearly one in five (17.2%) workers say that they suffer from chronic pain that is worsened by the job.
Perhaps unsurprisingly, many workers report staffing issues leading to safety risks. Table 9 shows the rates of workers who have faced issues with staff-ing and safety; more than 80% (80.1%) have worked when the restaurant was understaffed, with just over 70% (72.8%) have had to perform several jobs at once. Over half (52.6%) of workers have performed tasks that they were not trained for. As a result of these issues, just under a third of workers have either done something that put their safety at risk, or done
TABLE 9
UNDERSTAFFING AND CUSTOMER SAFETY
Worked when restaurant was understaffed
80.1%
Performed multiple jobs at once 72.8%
Forced to perform tasks without proper training
52.6%
Forced to take actions that put their safety at risk
30.6%
Forced to take actions that put customers at risk
22.8%
TABLE 8
INJURIES ON THE JOB
Burned on job 43.6%
Cut 46.8%
Have slipped 21.7%
Have come in contact with toxic chemicals
50.6%
Have chronic pain worsened by the job
17.2%
Use the same motion repeatedly for more than a hour/day
61.1%
Lift 20lbs or more w/o help 37.9%
Lift 50lbs or more 18.7%
Jane bartender and server
Jane is a seasoned front of house worker who has seen the ef-fects working for tips has on women in the restaurant industry. In addition to the income insecurity of working for tips, it also promotes an atmosphere of sexual harassment.
Jane recalled a previous job where she got paid the tipped minimum wage of $2.13 an hour for cleaning and setting up the restaurant before opening. As the business was not open, there were no tipping customers to make up the difference between her hourly and the minimum wage. “I had to sweep and mop the entire bar, restock everything, check the beer cooler, wipe everything down, set up all the boxes, I did all the garnishes and everything at the tipped minimum wage . . . Basically I did an hour’s worth of side work for the minimum for the $2.13, whatever, an hour.”
Jane even experienced working for free while training for a position at Marriott. Marriott’s policy was to only pay the tipped minimum wage and trainees kept 30% of the tips they made while training. After two days Jane decided this was not the place for her and quit. She never received her meager $2.13 an hour from Marriott for the two days she trained because she did not complete the whole four-day training period. Frustrated, Jane told us, “but at this point, I give up. I’m not going to get into some big battle with Marriott over $2.13 an hour for two shifts. I give up. And I’m sure that’s how they get away with it.”
However, even when restaurants are acting within the
law it is precarious work for a tipped worker. “If I take care of someone really well and they don’t tip me anything, or [a] dol-lar, there’s nothing I can do about that. And if I say something about it I could get fired from that job… I should be able to get paid for the work that I do by the person who employed me, not the person who chose to go to the restaurant that may have had a bad day or didn’t realize that the drink was $10 instead of $8 and is taking that out of my tip because they only brought so much cash with them.”
Perhaps worst of all is the treatment that women work-ing for tips must endure to ensure they are making a livable wage. Jane laid out the consequences of not tolerating men touching her on the job in no uncertain terms: less money. Jane described consistently making less money than an older co-worker who needed to support her two children and as a result tolerated the sexual harassment at work. Jane says, “I would talk to her about it as we’re counting all her money and she was like ‘yeah, I know, I hate it, but I make really good money.’ And she always did make more tips than I did. She made a lot more. Because they would do things like pinch her ass and she’d walk it off, and go in the bathroom and throw toilet paper rolls against the wall.” No individual should be treated like that and certainly not at work, but it is commonplace for women in the restaurant industry to come to expect it as the norm.
WORKER PROFILE
18
something due to time pressure that could have harmed the health and safety of customers (30.4% and 22.8%, respectively).
EMPLOYEE TURNOVER Employee turnover is a major issue in the restaurant industry, leading to high-er costs of recruitment and training, lower productivity, and lower service quality. In our survey, workers who had worked at more than one restaurant reported multiple reasons for leaving their previous job, outlined in Table 10. While many left because they moved (24.7%), over one in ten left for a better job (11.7%) or because they were unsatisfied with pay and benefits (17.6%). Other reasons included abusive environments (5.6%), scheduling difficulties (3.4%), and the inability to move up in position (6.2%).
Workers, on average, had been at their current restaurant for 5.3 years (the median was 4 years). After controlling for factors such as sex, age, race and nationality, results showed that workers who were paid poverty wages were with a restaurant on average 1.4 years less than those who were paid above the poverty line. The amount of hours a worker received also had an impact on how long they stayed at a restaurant, with every additional 10 hours of work increasing a worker’s stay by 7.0 months.
John moved from Miami to Houston hoping to advance his career. He has worked for one fine dining restaurant for nearly all ten of his years in the industry. During his career John has been unable to quickly climb the restaurant hierarchy. He started as a food runner and eventually became a server assistant, but it took a long time to become a full server. John only recently became a server when he moved locations. He sees the transfer as the reason he was able to become a server: “If I’d have walked in as a black guy, they wouldn’t have hired me.”
John commented that there is generally more upward mobility in the back of the house compared to the front of the house where the better money is. For this reason John wanted to become a server, but was often dissuaded. “I was told that I needed to stay where I am, and when I asked for a position they didn’t think I was ready. I didn’t know my food specs and stuff like that. I thought that since I worked with the food as a food runner . . . I don’t know why they’d say that.”
According to John promotions in the front of the house occur within a network of people, mostly white people. He says, “pretty much if you start as a busboy, you stay as a busboy.” Even if an outsider is able to get the promotion to full server there is still the issue of favoritism with section as-signments. John explains, “They have their people who they like. There’s waiters they favor because they get the better station… I mean, you could work every day and if you get left [in a bad] station, you’re not going to make any money.”
The things that concern John most about being a server in the restaurant industry is the lack of job security and a general feeling of being devalued. When asked what’s the one thing he would change about the restaurant industry John answered, “promotions… make it feel more like a career, because as a matter of fact, there’s no stability. You can lose your job at the drop of a dime. You can get one anal manager that doesn’t like you and you’re gone…That’s how I feel. I don’t feel like I’m valued. That my work isn’t appreciated.”
John African American server, 10 years in the industry
WORKER PROFILE
TABLE 10
WHY DOES TURNOVER HAPPEN?
I moved 24.70%
Unsatisfied with pay and benefits 17.6%
Unable to move up in position 6.2%
Found a better restaurant job (higher pay or benefits)
11.7%
There was a negative environment due to verbal or physical abuse
I will say this . . . Amongst bars, there is a gigantic ceiling . . . Thick, thick, ceiling between barback and bartender. If you feel as though . . . If you walk into any bar people will automatically assume, all people will automatically assume that the Hispanic person working is the barback. And nine times out of ten they will be correct because the Hispanic person rarely ever gets promoted. – White female bartender
Our research indicates that there is tremendous variation in earn-ings potential and job quality based on a worker’s occupation type (Front-of-the-House or Back-of the House) and industry segment (fine dining, casual, and quick serve). The highest-paid workers were Front-of-the-House workers in fine dining establishments, jobs dis-proportionately held by white men. In contrast, workers of color were concentrated in those industry segments and occupations with the lowest earnings and worst working conditions – quick serve restau-rants and Back-of-the-House positions.
White Workers Workers of Color
Below Poverty Line ($7.25 – $9.40) 34.3% 51.9%
Low Wage ($9.41 – $14.09) 26.3% 13.0%
Over 150% of Poverty ($14.10-$25.57 27.7% 12.8%
Living Wage ($25.58 and higher) 11.7% 22.2%
WORKPLACE CONDITIONS Front-of-the-House Back-of-the-House Total
Employer does not provide health insurance 91.8% 96.2% 93.8%
Did not receive on-going job training needed to be promoted 46.3% 50.2% 47.5%
Unsafely hot in the kitchen 23.9% 22.8% 23.5%
WORKPLACE INJURIES
Have been burned while on the job 47.5% 35.4% 43.7%
Have been cut while on the job 53.1% 33.2% 46.9%
Have come into contact with toxic chemicals 48.4% 55.4% 50.6%
Median Wage
White workers $11.82
Workers of color $8.32
WAGES EARNED BY RESTAURANT WORKERS IN HOUSTON MEDIAN WAGE OF WORKERS OF COLOR V. WHITE WORKERS
WORKPLACE CONDITIONS BY JOB TYPE
JOB TYPE DISTRIBUTION BY RACE
TABLE 11 TABLE 12
TABLE 13
FIGURE 5
100%
90%
80%
70%
60%
50%
40%
30%
20%
10%
LATINO BLACK ASIAN WHITE
Front-of-the-HouseBack-of-the-House
22%
78%
61%
39%
45%
55%
62%
38%
20
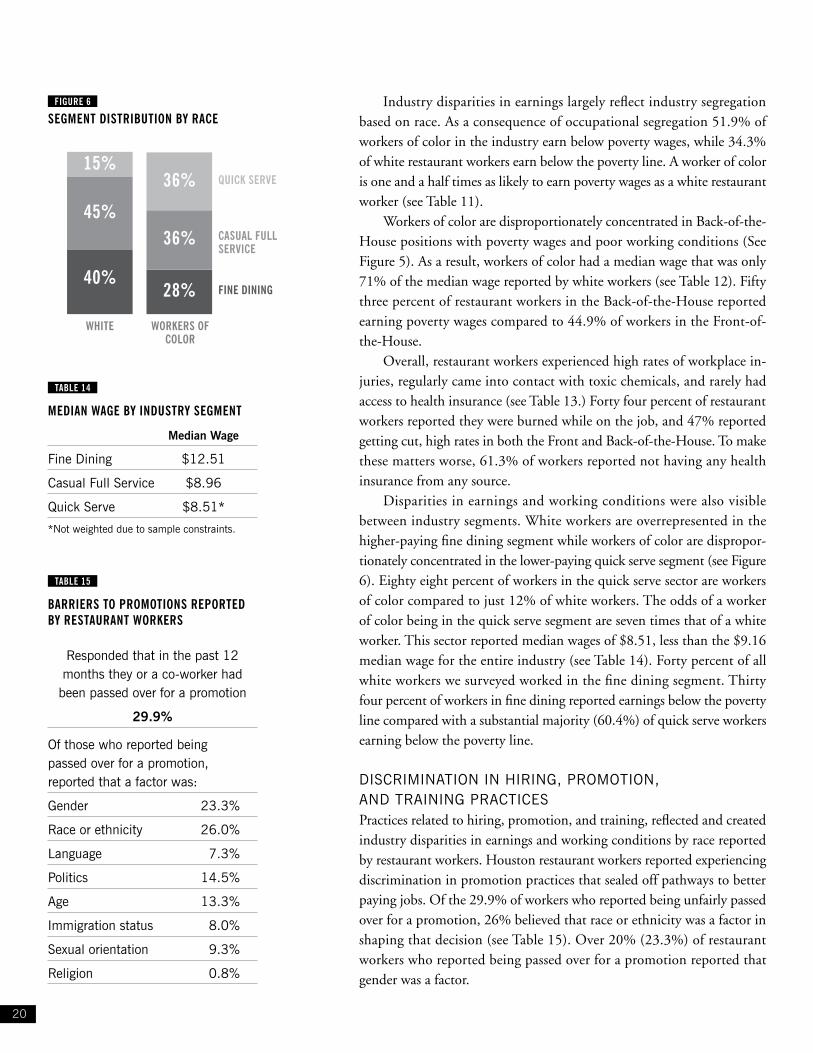
Industry disparities in earnings largely reflect industry segregation based on race. As a consequence of occupational segregation 51.9% of workers of color in the industry earn below poverty wages, while 34.3% of white restaurant workers earn below the poverty line. A worker of color is one and a half times as likely to earn poverty wages as a white restaurant worker (see Table 11).
Workers of color are disproportionately concentrated in Back-of-the-House positions with poverty wages and poor working conditions (See Figure 5). As a result, workers of color had a median wage that was only 71% of the median wage reported by white workers (see Table 12). Fifty three percent of restaurant workers in the Back-of-the-House reported earning poverty wages compared to 44.9% of workers in the Front-of-the-House.
Overall, restaurant workers experienced high rates of workplace in-juries, regularly came into contact with toxic chemicals, and rarely had access to health insurance (see Table 13.) Forty four percent of restaurant workers reported they were burned while on the job, and 47% reported getting cut, high rates in both the Front and Back-of-the-House. To make these matters worse, 61.3% of workers reported not having any health insurance from any source.
Disparities in earnings and working conditions were also visible between industry segments. White workers are overrepresented in the higher-paying fine dining segment while workers of color are dispropor-tionately concentrated in the lower-paying quick serve segment (see Figure 6). Eighty eight percent of workers in the quick serve sector are workers of color compared to just 12% of white workers. The odds of a worker of color being in the quick serve segment are seven times that of a white worker. This sector reported median wages of $8.51, less than the $9.16 median wage for the entire industry (see Table 14). Forty percent of all white workers we surveyed worked in the fine dining segment. Thirty four percent of workers in fine dining reported earnings below the poverty line compared with a substantial majority (60.4%) of quick serve workers earning below the poverty line.
DISCRIMINATION IN HIRING, PROMOTION, AND TRAINING PRACTICESPractices related to hiring, promotion, and training, reflected and created industry disparities in earnings and working conditions by race reported by restaurant workers. Houston restaurant workers reported experiencing discrimination in promotion practices that sealed off pathways to better paying jobs. Of the 29.9% of workers who reported being unfairly passed over for a promotion, 26% believed that race or ethnicity was a factor in shaping that decision (see Table 15). Over 20% (23.3%) of restaurant workers who reported being passed over for a promotion reported that gender was a factor.
SEGMENT DISTRIBUTION BY RACEFIGURE 6
WHITE WORKERS OF COLOR
QUICK SERVE
CASUAL FULLSERVICE
FINE DINING
Median Wage
Fine Dining $12.51
Casual Full Service $8.96
Quick Serve $8.51*
*Not weighted due to sample constraints.
MEDIAN WAGE BY INDUSTRY SEGMENT
TABLE 14
Responded that in the past 12 months they or a co-worker had
been passed over for a promotion
29.9% Of those who reported being passed over for a promotion, reported that a factor was:
Gender 23.3%
Race or ethnicity 26.0%
Language 7.3%
Politics 14.5%
Age 13.3%
Immigration status 8.0%
Sexual orientation 9.3%
Religion 0.8%
BARRIERS TO PROMOTIONS REPORTED BY RESTAURANT WORKERS
TABLE 15
15%
45%
40%28%
36%
36%
21
WO
RK
ER
S’ P
ER
SP
EC
TIV
ES
Responded that in the past 12 months they or a co-worker had been disciplined more often
or severely than others
25.7% Of those who reported frequent or more severe discipline, reported that a factor was:
Race or ethnicity 31.1%
Gender 23.3%
Age 14.9%
Politics 12.7%
Sexual orientation 9.9%
Language 7.8%
Immigration status 10.6%
Religion 2.8%
UNEVEN APPLICATION OF DISCIPLINE
Responded that in the past 12 months they or a co-worker had
experienced verbal abuse
25.8% Of those who reported experiencing verbal abuse, reported that a factor was:
Gender 32.9%
Race or ethnicity 30.9%
Language 10.5%
Sexual orientation 13.0%
Immigration status 11.9%
Religion 4.1%
Politics 14.0%
Age 18.2%
EXPERIENCE OF VERBAL ABUSE
TABLE 17TABLE 16
Maria has only worked two years in the restaurant in-dustry, but in that short amount of time she saw the worst of the industry. Maria worked at a 24-hour Taque-ria joint during the 12 p.m. to 6 a.m. shift. She only earned $2.15 an hour. Her tips were assumed to cover the difference to make minimum wage, but they rarely did. During the night shift it was slow, and when she did have customers, they were usually too drunk, so they did not tip well. When she asked to change her schedule to the daytime the owner would not let her because he wanted to work the day shift himself.
Even worse than working for $2.15 an hour is working for zero. At times Maria would work off the clock for free when the owner wanted her to clean or wash dishes. She wouldn’t be on the floor, so unable to make tips and often she would already be clocked out while she was cleaning. Obviously, living off her tips in this way proved unsustainable. Maria could not maintain her rent payments and ended up having to move in with a friend for nine months.
Maria observed the clear color hierarchy in the restaurant. “The back positions were Latino, African-American, they were for the cleaner, the lowest of the kitchen. The best position would be the owner or man-ager, white people.” She said that African-American and Latino workers wouldn’t even ask for a promotion because they knew they would never get one. “No, you didn’t ask anything, you were low.” These employees thought they were low because they were treated like they were low. Maria recalls hearing insults in the kitch-en and being called “stupid” at work.
Maria decided to find better work as a babysitter where the pay is not great, but at least it is consistent and she can count on the set amount each week. The reasons she left the restaurant she sees as easily fixable. It requires being a fair employer and keeping employees happy through a livable wage and benefits because as Maria says, “when a worker is not happy he doesn’t do anything good.”
Maria undocumented Latina server
WORKER PROFILE
UNFAIR APPLICATION OF DISCIPLINEA quarter of restaurant workers reported that they’ve experienced instances of unfair application of discipline, many on the ba-sis of their race, gender, age, immigration status, or sexual orientation. Thirty one percent of those workers who have expe-rienced unfair discipline cited race as the reason they were singled out for more se-vere discipline. Nearly eleven percent was unfairly disciplined on the basis of their im-migration status and 9.9% on the basis of their sexual orientation (see Table 16). Over a quarter (25.8%) of workers reported ex-periencing or observing verbal abuse, with race and gender being the most cited factors in determining that abuse (see Table 17)
22
SEXUAL HARASSMENTSexual harassment runs rampant in the restaurant industry, the single larg-est source of harassment complaints in the country.20 Moreover, since tipped workers in Houston earn $2.13 per hour, nearly all of their income comes directly from customer tips. As a result, tipped workers often feel forced to endure harassment from customers to ensure that they receive a gratuity. Of workers surveyed, 32.9% reported that they had either seen or experienced sexual harassment in the past 12 months (see Table 18). While nearly 97% of those who reported being harassed said the source was a customer, just under 72% reported it was from coworkers, and 84.9% reported they received or saw coworkers receive harassment from management. When broken down by gender, we see that women bear the brunt of sexual harassment: 84.7% of those who reported being sexually harassed were women. Overall, nearly half (47.6%) of all women restaurant workers, and over half (54.7%) of women who received tips reported observing or experiencing sexual harassment. A
previous study that examined an exhaustive list of sexually harassing behaviors found that 80% of restaurant workers in the industry have expe-rienced some form of sexual harassment.21
WAGE THEFT AND IMMIGRATION STATUSWhen committing wage theft, many employers target immigrant workers, who may have lan-guage barriers, lack information on wage and hour laws, or fear detention or deportation. As shown in Table 19, not being paid overtime or working off the clock without pay often affected immigrant workers at higher rates than their US-born counterparts.
Immigrant workers were nearly a third of the sample (30.9%), and of these, 20% respond-ed that they were undocumented. An additional 55.6% either declined to respond to questions about their documented status or did not know. In total, 24% of all restaurant workers surveyed reported that they were undocumented, de-clined to provide their status, or did not know.
Born in the U.S. Immigrants
Worked off the clock without pay 32.5% 38.2%
Not paid overtime 15.1% 17.1%
Management took share of tips 13.9% 12.2%
Experienced minimum wage violations 2.8% 1.2%
IMMIGRANT WORKERS EXPERIENCE HIGHER RATES OF WAGE THEFT THAN THEIR US BORN COUNTERPARTS
TABLE 19
Responded that in the past 12 months they or a co-worker had experienced sexual harassment or observed it with coworkers
32.9% Those that reported sexual harassment reported the sources:
Guests/Customers 96.5%
Coworkers 71.8%
Management 84.9%
EXPERIENCE OF SEXUAL HARASSMENT
TABLE 18
23
WORKING WHILE SICKFIGURE 7
The overwhelming majority of restaurant workers in Houston do not have access to paid sick days. As a consequence, the majority have gone to work sick, and many have gotten their co-workers sick.
I got other workers sick
My illness lasted longer
I coughed or sneezed while handling food
Unable to complete necessary tasks at work
Of workers that worked sick, what were the consequences?
Of workers that worked sick, what were the reasons?
I couldn’t afford to take the day off without pay
I couldn’t get shift covered
I was concerned I would be fired or penalized
71.4%
48.7%
47.1%
58.9%
58.9%
55.7%
45.1%
Workers Lacking Paid Sick Days Worked Sick
96.2%
74%
WO
RK
ER
S’ P
ER
SP
EC
TIV
ES
SOCIAL COST OF LOW-WAGE JOBS
“I’ve seen a lot of people come in sick as a dog. Because they need the money and can’t take off.” —White male server
Low wage jobs do not just affect the workers that work them. Customers and taxpayers also share the load of low wage work, most commonly by being exposed to sick workers who cannot afford to take a sick day, and by funding the subsidies and public benefits that workers are forced to take because their low wages prevent them from making ends meet.
Working while sick presents major public health risks, and yet our research shows that an over-whelming majority of workers (96.2%) do not have access to paid sick days and feel forced to go to work sick because they cannot afford to take a day off (see Figure 7). Over seven out of ten workers surveyed (71%) have gone to work sick (74% of those without access to paid sick days). The top three reasons given for going to work sick were:
• They couldn’t afford to take a day off without pay (71.4%)• They were concerned about being fired or penalized (47.1%)• They couldn’t get the day off, or get someone to cover their shift (48.7%)
Others also spoke of being worried about “letting their team down,” or worried that they weren’t sick enough. There are severe consequences of having sick workers in restaurants, whether for the work-ers themselves, or their coworkers, or customers. Over half (55.7%) coughed or sneezed while handling food, potentially exposing customers to illness. Almost six in ten (58.9%) said that their illness got worse or lasted longer, with 45.1% saying that they were unable to complete necessary tasks for work. When workers stay sick and are impaired on the job due to illness, they put themselves at risk of injury. Well over half of workers surveyed (58.9%) said that they got someone else at work sick, starting the cycle over again, as coworkers who also lack sick days face the same dilemma: work sick or lose income.
24
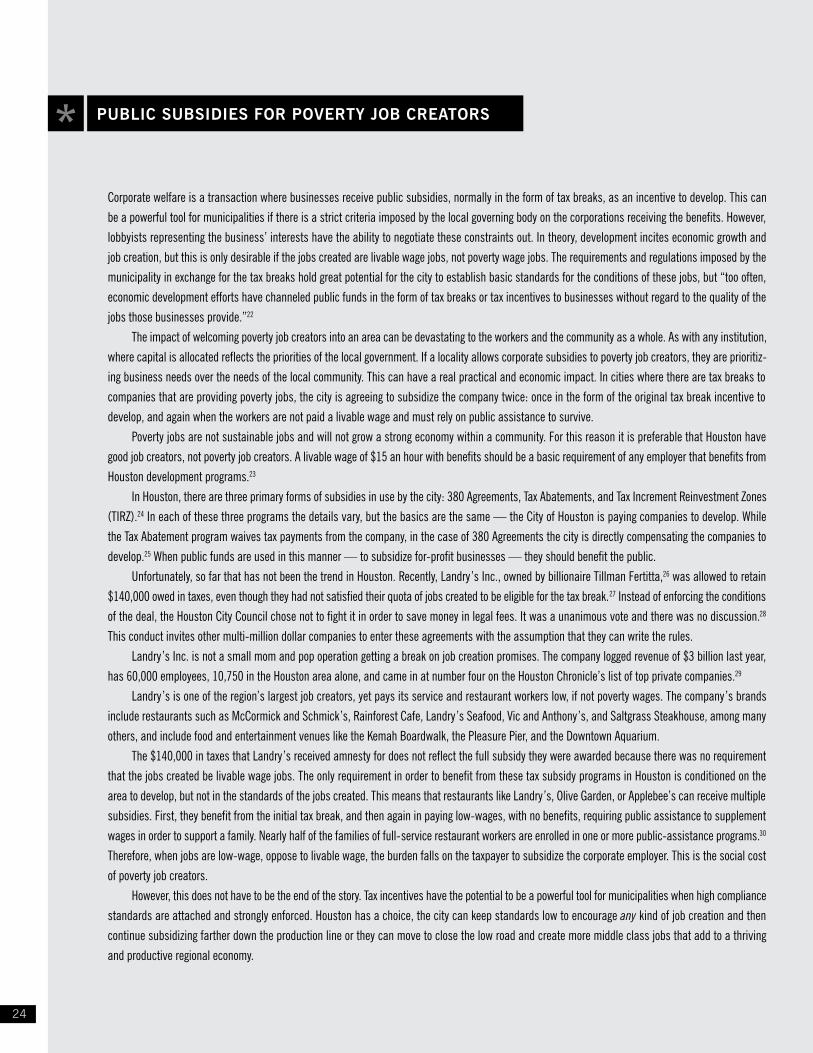
Corporate welfare is a transaction where businesses receive public subsidies, normally in the form of tax breaks, as an incentive to develop. This can be a powerful tool for municipalities if there is a strict criteria imposed by the local governing body on the corporations receiving the benefits. However, lobbyists representing the business’ interests have the ability to negotiate these constraints out. In theory, development incites economic growth and job creation, but this is only desirable if the jobs created are livable wage jobs, not poverty wage jobs. The requirements and regulations imposed by the municipality in exchange for the tax breaks hold great potential for the city to establish basic standards for the conditions of these jobs, but “too often, economic development efforts have channeled public funds in the form of tax breaks or tax incentives to businesses without regard to the quality of the jobs those businesses provide.”22
The impact of welcoming poverty job creators into an area can be devastating to the workers and the community as a whole. As with any institution, where capital is allocated reflects the priorities of the local government. If a locality allows corporate subsidies to poverty job creators, they are prioritiz-ing business needs over the needs of the local community. This can have a real practical and economic impact. In cities where there are tax breaks to companies that are providing poverty jobs, the city is agreeing to subsidize the company twice: once in the form of the original tax break incentive to develop, and again when the workers are not paid a livable wage and must rely on public assistance to survive.
Poverty jobs are not sustainable jobs and will not grow a strong economy within a community. For this reason it is preferable that Houston have good job creators, not poverty job creators. A livable wage of $15 an hour with benefits should be a basic requirement of any employer that benefits from Houston development programs.23
In Houston, there are three primary forms of subsidies in use by the city: 380 Agreements, Tax Abatements, and Tax Increment Reinvestment Zones (TIRZ).24 In each of these three programs the details vary, but the basics are the same — the City of Houston is paying companies to develop. While the Tax Abatement program waives tax payments from the company, in the case of 380 Agreements the city is directly compensating the companies to develop.25 When public funds are used in this manner — to subsidize for-profit businesses — they should benefit the public.
Unfortunately, so far that has not been the trend in Houston. Recently, Landry’s Inc., owned by billionaire Tillman Fertitta,26 was allowed to retain $140,000 owed in taxes, even though they had not satisfied their quota of jobs created to be eligible for the tax break.27 Instead of enforcing the conditions of the deal, the Houston City Council chose not to fight it in order to save money in legal fees. It was a unanimous vote and there was no discussion.28
This conduct invites other multi-million dollar companies to enter these agreements with the assumption that they can write the rules.Landry’s Inc. is not a small mom and pop operation getting a break on job creation promises. The company logged revenue of $3 billion last year,
has 60,000 employees, 10,750 in the Houston area alone, and came in at number four on the Houston Chronicle’s list of top private companies.29
Landry’s is one of the region’s largest job creators, yet pays its service and restaurant workers low, if not poverty wages. The company’s brands include restaurants such as McCormick and Schmick’s, Rainforest Cafe, Landry’s Seafood, Vic and Anthony’s, and Saltgrass Steakhouse, among many others, and include food and entertainment venues like the Kemah Boardwalk, the Pleasure Pier, and the Downtown Aquarium.
The $140,000 in taxes that Landry’s received amnesty for does not reflect the full subsidy they were awarded because there was no requirement that the jobs created be livable wage jobs. The only requirement in order to benefit from these tax subsidy programs in Houston is conditioned on the area to develop, but not in the standards of the jobs created. This means that restaurants like Landry’s, Olive Garden, or Applebee’s can receive multiple subsidies. First, they benefit from the initial tax break, and then again in paying low-wages, with no benefits, requiring public assistance to supplement wages in order to support a family. Nearly half of the families of full-service restaurant workers are enrolled in one or more public-assistance programs.30 Therefore, when jobs are low-wage, oppose to livable wage, the burden falls on the taxpayer to subsidize the corporate employer. This is the social cost of poverty job creators.
However, this does not have to be the end of the story. Tax incentives have the potential to be a powerful tool for municipalities when high compliance standards are attached and strongly enforced. Houston has a choice, the city can keep standards low to encourage any kind of job creation and then continue subsidizing farther down the production line or they can move to close the low road and create more middle class jobs that add to a thriving and productive regional economy.
PUBLIC SUBSIDIES FOR POVERTY JOB CREATORS
25
WO
RK
ER
S’ P
ER
SP
EC
TIV
ES
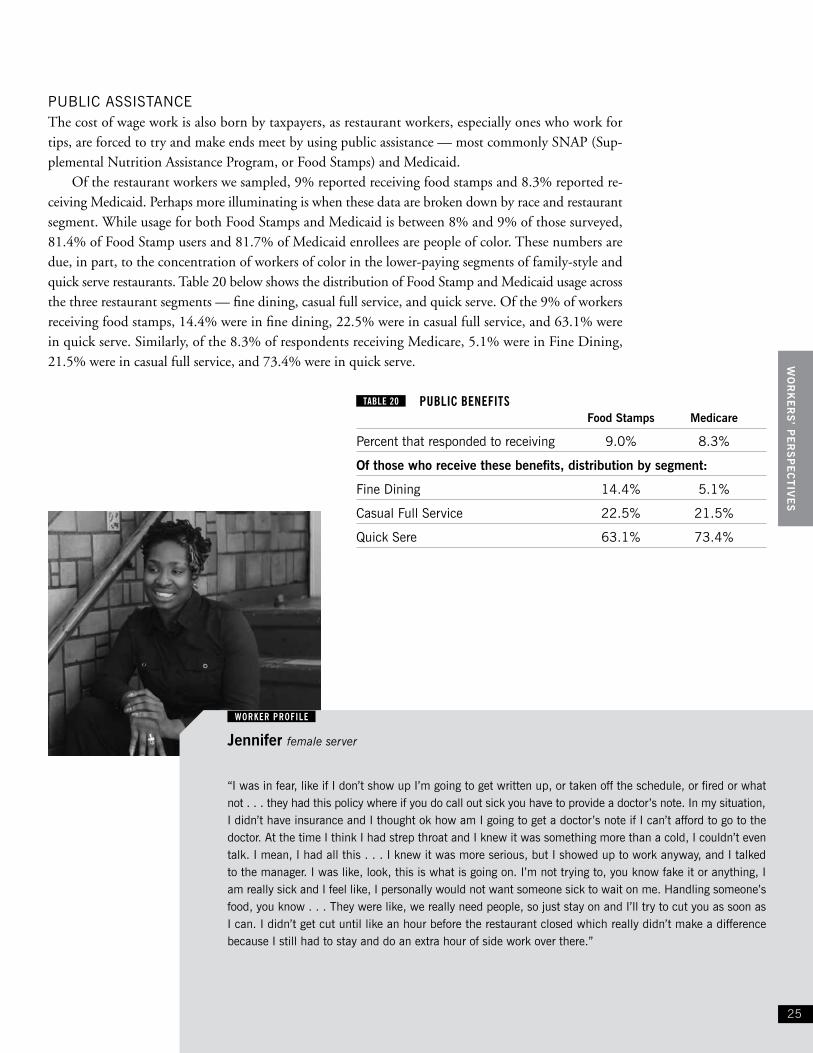
“I was in fear, like if I don’t show up I’m going to get written up, or taken off the schedule, or fired or what not . . . they had this policy where if you do call out sick you have to provide a doctor’s note. In my situation, I didn’t have insurance and I thought ok how am I going to get a doctor’s note if I can’t afford to go to the doctor. At the time I think I had strep throat and I knew it was something more than a cold, I couldn’t even talk. I mean, I had all this . . . I knew it was more serious, but I showed up to work anyway, and I talked to the manager. I was like, look, this is what is going on. I’m not trying to, you know fake it or anything, I am really sick and I feel like, I personally would not want someone sick to wait on me. Handling someone’s food, you know . . . They were like, we really need people, so just stay on and I’ll try to cut you as soon as I can. I didn’t get cut until like an hour before the restaurant closed which really didn’t make a difference because I still had to stay and do an extra hour of side work over there.”
Jennifer female server
WORKER PROFILE
PUBLIC ASSISTANCEThe cost of wage work is also born by taxpayers, as restaurant workers, especially ones who work for tips, are forced to try and make ends meet by using public assistance — most commonly SNAP (Sup-plemental Nutrition Assistance Program, or Food Stamps) and Medicaid.
Of the restaurant workers we sampled, 9% reported receiving food stamps and 8.3% reported re-ceiving Medicaid. Perhaps more illuminating is when these data are broken down by race and restaurant segment. While usage for both Food Stamps and Medicaid is between 8% and 9% of those surveyed, 81.4% of Food Stamp users and 81.7% of Medicaid enrollees are people of color. These numbers are due, in part, to the concentration of workers of color in the lower-paying segments of family-style and quick serve restaurants. Table 20 below shows the distribution of Food Stamp and Medicaid usage across the three restaurant segments — fine dining, casual full service, and quick serve. Of the 9% of workers receiving food stamps, 14.4% were in fine dining, 22.5% were in casual full service, and 63.1% were in quick serve. Similarly, of the 8.3% of respondents receiving Medicare, 5.1% were in Fine Dining, 21.5% were in casual full service, and 73.4% were in quick serve.
Food Stamps Medicare
Percent that responded to receiving 9.0% 8.3%
Of those who receive these benefits, distribution by segment:
Fine Dining 14.4% 5.1%
Casual Full Service 22.5% 21.5%
Quick Sere 63.1% 73.4%
PUBLIC BENEFITSTABLE 20
27
Chapter IV
EM
PLO
YE
RS
’ PE
RS
PE
CT
IVE
S
Through in-depth interviews, thirteen greater Houston area restaurant employers de-scribed challenges they face and their perspectives on how to improve the industry. Employers generally expressed that employee turnover and productivity are major
factors in running a successful restaurant. At the family-owned restaurants, regardless of size, employee turnover was reported as extremely low. This was attributed to the way the employees were treated: “like family.”
While some employers noted the economic benefits of paying a higher wage to retain quality employees, others asserted that labor costs were already one of their highest expenses,
generally coming in right behind food. The majority of employ-ers interviewed agreed that bad actors that violate labor laws create an untenable situation for the rest of the employers who are following minimum wage and overtime laws.
In Houston, there are a large number of undocumented employees in the workforce. Most employers hoped for immigra-tion reform to curb unfair competition and dissuade competing employers from paying sub-minimum wages to these more vul-nerable workers.
Almost all the restaurants interviewed had some system of training in place for new hires, although many were informal models. A lot of the employers expressed a preference for promot-ing from within, but found that it wasn’t always feasible. A main reason stated for not being able to make internal promotions was due to language barriers.
Finally, a few interviewed employers demonstrated that the high road to profitability is possible and are reaping the rewards — both economic and personal — of satisfied, productive, work-
ers that remain with the restaurant.The perspectives summarized in this chapter can serve to guide further study of the indus-
try, and perhaps most importantly, lay the groundwork for initiatives developed in partnership with workers and employers alike.
Employers’ Perspectives
28
METHODOLOGY
In order to obtain a better understanding of factors that drive workplace practices, ROC conducted thirteen in-depth interviews with restaurant employers in 2014. Re-searchers requested interviews from owners and managers of restaurants that reflect the different industry segments — fine dining, casual restaurants, and quick serve. Using a structured guide interviewers asked employers about industry trends, business strategies, workplace practices and the role of immigrants in the restaurant industry.
EXTERNAL FACTORS AFFECTING WORKPLACE PRACTICES
To better understand the dynamics that affect both employers and workers in the Houston restaurant industry, it is important to consider the salient external pressures
on restaurants. The employers we interviewed referred to several factors that im-pact their business practices, including customer demand for organic, healthy, quality food and the difficulties of running a business with the lasting effects of the Great Recession on their customer’s wallets.
One restaurant owner explained her resistance to the minimum wage in-crease for tipped employees: “The idea of raising the minimum wage to $10.00 an hour is frightening. I think there would be some small places like us that couldn’t . . . We would have to pass those costs on to our customers and our customers would not be willing to pay $2-$3 extra per menu item to make up that cost. So, I don’t . . . that makes me . . . I’m not a fan.” She continued to say that her tipped staff already makes a living wage and that the increase in pay is not necessary for them.
Other employers were split over their willingness to increase menu prices to compensate for providing benefits to their employees. One restaurant saw this as an opportunity to educate their customers as to what the increased prices were paying for and raise the awareness of industry-wide labor issues. “I think we have a really ethically based clientele, but there’s always going to
be people that don’t understand what we do . . . understand that our shepherd’s pie is $13 instead of $6 or something because for one, our average wage is like, $16 an hour right now in the kitchen. That just having people touch the food makes the food more expensive. That’s constantly having to educate people on what we’re doing and how that affects what goes on their plate.” The reaction of employers to different trends heavily depended on their customer base and location of their restaurant.
Another issue that is location specific is seasonal destinations and the effect on the local economy. One restaurant owner in Galveston lamented the fact that his sales drastically decrease in the winter months. This means that he does not need the full staff that he requires in the summer months. However, his servers are also making less in the winter months and consequently need to work more shifts to compensate for the decline in sales.
29
STRATEGIES FOR PROFIT
To deal with the external pressures outlined above, employ-ers generally agreed that one of the most important elements is reducing employee turnover and having a satisfied work-force. Apart from the strictly economic benefits of not losing productivity on training periods for a constant flow of new employees, employers expressed other more subtle advantages that also affected their bottom lines.
“Nobody wins when you’re cheating your employees, the only people who lose are the restaurant. You know. Word gets around very quick. And that’s the last thing you want to be known as, with a bad reputation for treating people. That’s very bad. If you can’t have respect for workers, no one’s gonna respect your business.” —Manager/Owner of a casual full service restaurant, with 20 years experience
The issue of retaining a satisfied workforce is especially important in the restaurant industry where employees are the face of the business. In the family owned restaurants in particular this was a concern—they expressed a desire for the employees to feel an integral part of the success. “I treat them fairly,” was the simple and common response to why turno-ver was so low in the majority of restaurants studied here.
Another issue that was raised was that by retaining em-ployees for a long time employers felt more comfortable trusting them with greater responsibilities. Another consid-eration in a neighborhood-focused establishment was the need for consistency of faces serving their regular customers. A manager described where she worked as “a neighborhood-y spot [where] the customers know our staff and vice versa.” She continued, “there’s the “Cheers” aspect that you lose when you have constant turnover,” meaning that staff are not able to develop a long-lasting relationship with customers.
While the majority of the restaurants in the study did not have a formalized internal training structure, many of them preferred to promote from within when possible. When that was not possible, a family member or referral from a current employee was generally how they hired. More than one restaurant, however, demonstrated a high level of hu-man capital investment in their employees, including tuition reimbursement for language classes and benefits such as paid vacations.
Monica Pope is the “German-born, Texas-reared” chef-owner of two Houston restaurants—Beaver’s and Sparrow. In the male dominated world of restaurant owners Monica has made a name for herself. She is the only female Texas chef to be named Best New Chef by Food & Wine magazine and earned national recognition when she was nominated for a James Beard award.
Aside from the awards, Monica understands how to run a successful and profitable restaurant. It starts with a happy staff to reduce costly turnover. “I have had a lot of these guys for 15, 20 years. We have al-ways paid a living wage.” Monica says colleagues are always “shocked” to discover that people have been with her for that long. Monica’s secret to success is actually pretty simple: paying her staff decent wages and treating them fairly.
Perhaps it is because she was born in Europe that Monica is more cognizant of an alternative model. “Just the quality of life, living wage, paid vacations. This country just doesn’t understand. We close the restau-rant two weeks a year. I mean, we work really hard; we need the time off. But that was a mind shift for everyone. In Europe, they get 6 weeks off a year, or something like that.”
When people are sick she lets them go home rath-er than making them work. Unlike many restaurant owners, this seems logical to Monica from a public health aspect.
In terms of promotions Monica says, “We try for no division between the front and back of the house.” There is an open door policy. If someone feels like they want to move into a different position Monica’s em-ployees feel comfortable enough to ask her and she will assess if they are ready or need more training first. Recently, a host wanted to become a server because he would make more money. Monica thought he was ready so they hired another host and put him on the floor. “You get a promotion because you express a de-sire. You have to be willing to ask questions and learn from others.”
Monica’s management style of basic fairness has proved to be a smart business model. It has enabled her to expand her restaurants with the support of a stable and reliable staff. Her staff supports Monica be-cause she supports them.
THE HIGH ROAD IS POSSIBLE
EMPLOYER PROFILE
EM
PLO
YE
RS
’ PE
RS
PE
CT
IVE
S
30
CONTRADICTIONS IN THEORY AND PRACTICE
While many employers interviewed here asserted that there is direct connection between a restaurant’s success and maintaining employee satisfaction, there was also recognition that em-ployers often pursue the low road to striving for profitability, choosing to push workers hard for little pay. None of the employers interviewed reported engaging in any form of wage, overtime, or immigration violations, but many of them recognized it as a problem for the industry as a whole.
Only two out of the thirteen employers interviewed provided health insurance to their workers. The rest expressed a desire to, but cited prohibitive costs as the reason they were not able to. Not one employer explicitly thought that their employees weren’t entitled to such ben-efits, although they were concerned about how the Affordable Care Act would influence their businesses. One manager admitted, “another thing that’s really creating a lot of turbulence is the addition of Obamacare. We’re cutting hours and hiring more folks so that we can keep costs low.” Some restaurants do not fully understand the implications of the Affordable Care Act and their solution is to decrease employee hours.
31
Through integrating in-person worker surveys with interviews and analysis of gov-ernment data, we have developed the most comprehensive analysis of the Houston restaurant industry to date. Our research suggests that while some restaurants are taking
the high road and offering their employees fair wages, benefits, and working conditions, many restaurants are choosing the low road approach. The majority of Houston restaurant jobs are defined by low wages, no benefits, and unsafe working conditions. Low-road practices such as these compromise the health and safety of workers as well as customers and indicate the need for policy that increases earnings and expands protections for restaurant workers. Because of its importance to Houston, all stakeholders must be brought into alignment to reform the city’s restaurant industry.
POLICYMAKERS SHOULD:
1. Houston policymakers should leverage economic development programs to expand the pool of good jobs for Houstonians by requiring developments receiving public funding and incentives pay a living wage, provide benefits and paid sick days, and hire locally.
2. Support legislation that ensures workers have access to paid sick days. When workers can stay home to take care of their illness without losing needed income the public benefits from a reduced exposure to contagious disease.
3. To enforce existing labor laws, collaborate with community groups with expertise in those sectors with large concentrations of vulnerable workers.
4. Raise the subminimum wage for tipped workers to match the overall minimum wage. Employers that move away from tipping should practice open book management so that workers have a clear sense of whether they are receiving their fair share.
5. Support job-training programs that provide high-quality and accessible training in the special skills needed to advance within the industry, particularly for underrepresented groups such as people of color, women, and immigrants. Policymakers can provide:
Chapter V
CO
NC
LUS
ION
Conclusion and Policy Recommendations
32
a. Incentives to employers who provide on-the job-or off-premises training of this nature.
b. Training programs for underrepresented populations to obtain skills to advance to living-wage positions within the industry.
6. Strengthen and enforce employment laws in the restaurant industry and penalize viola-tors at a level that will deter other employers from violating laws in the first place. This includes:
a. Wage theft: Higher penalties are needed so that risk of potential damages outweighs immediate gains.
b. Similar measures should also be taken to enforce health and safety standards.
c. Employers must be educated about their legal responsibilities to their employees, and employees must be educated about their legal rights.
7. Ensure that restaurant workers and their families have affordable access to healthcare. Restaurant workers too often have to rely on emergency room treatment, which raises healthcare costs for the broader community.
8. Protect workers from violations of federal, state, and local anti-discrimination and equal employment opportunity laws.
a. Assist advocates engaged in anti-discrimination campaigns through intervention aimed at encouraging employers to change their discriminatory practices. Addition-ally, by increasing penalties against employers who violate anti-discrimination laws, legislators can create a deterrent to such discrimination.
b. Ensure that employees understand their rights under anti-discrimination laws and make enforcement of such laws within the restaurant industry a priority.
c. Adopt legislation that would provide incentives or require employers to provide regular, ongoing sexual harassment training with all employees, including managers.
9. Enact legislation that would help workers cope with erratic scheduling.
a. Several states have passed reporting-time pay legislation, which requires employers to pay workers for a few hours of their time when they report to work and are sent home immediately.
b. Other policymakers have enacted protections against erratic and unreliable schedules by requiring that employees receive their schedules with enough advanced notice to plan their lives.
10. Publicly support collective organizing among restaurant workers.
11. Initiate and support further study and dialogue on occupational segregation and other areas where more study is needed.
33
EMPLOYERS SHOULD:
1. Adopt systematic and fair hiring and promotions practices.
2. Adopt and clearly communicate policies and procedures, including anti-discrimination and harassment policies, to protect the well being of all workers.
3. Clearly communicate to workers about their benefits, such as earned sick days.
4. Enhance job quality and employee retention by increasing wages and developing sched-uling practices that meet both employer and worker needs.
5. Learn techniques that successful restaurant employers use to implement livable wages, benefits, scheduling control, and career ladders. ROC-Houston can act as a resource to provide technical assistance to employers.
CUSTOMERS SHOULD:
1. Support responsible restaurant owners who provide fair wages, benefits, and opportuni-ties for workers to advance. Many of these restaurants can be found in the Restaurant Opportunities Centers’ National Diners’ Guide (www.rocunited.org/dinersguide).
2. Speak to employers every time you eat out and let them know you care about livable wages, benefits, and opportunities for women and people of color to advance in the restaurant industry.
3. Where workers have filed legal charges against employers who are violating the law, call the company and let them know that you will not support illegal practices.
WORKERS SHOULD:
1. Become involved in the Houston restaurant worker movement. There are many oppor-tunities for involvement in worker-led committees, trainings and more.
2. Workers should know their legal rights as persons and workers, document unfair and potentially illegal practices they encounter at work, and take concerted action when appropriate.
CO
NC
LUS
ION
34
Appendix
AGE % OF SAMPLE
25 and under 46.4%
26-35 34.6%
36-45 10.5%
46-55 6.4%
Over 55 2.1%
RESTAURANT SEGMENT
Fine dining 28.8%
Family style 36.2%
Quick service 28.7%
Bars and other 6.3%
NATIVITY
Born in the U.S. 69.1%
Foreign born 30.9%
GENDER
Female 51.3%
Male 48.5%
Transgender and other 0.2%
RACE/ETHNICITY % OF SAMPLE
White 24.8%
Black 22.8%
Latino 39.2%
Asian 9.9%
Other 3.3%
LOCATION OF RESTAURANT
Central Houston 5.6%
Inner Loop North 6.3%
Inner Loop South 15.2%
Outer Loop North 26.8%
Outer Loop South 21.5%
Other (Sugar Land, Woodlands, Galveston, etc.)
24.6%
POSITION
Front-of-house 67.3%
Back-of-house 32.7%
Source: Houston Restaurant Industry Coalition survey data
UNWEIGHTED SURVEY DEMOGRAPHICS SAMPLE SIZE = 553
35
Acknowledgments
We gratefully acknowledge the funding support provided by Embrey Family Foundation.
THIS REPORT WAS RESEARCHED AND WRITTEN BY:
Isaac Sederbaum, Tallulah Knopp, Maxine Jean-Louis, Mike Rodriguez, Strategic Research
Associate, and Teófilo Reyes, Research Director, Restaurant Opportunities Centers United.
RESTAURANT OPPORTUNITIES CENTERS UNITED WOULD LIKE TO THANK the many res-
taurant workers, restaurant owners, students, interns, and volunteers who devoted their time to
conducting surveys, interviews, data analysis, and reviewing early drafts. In particular we would
like to thank the following for their assistance in this project: Ashley Hernandez, Kemi Bello,
Claudia Muñoz, Jonathan Hogstad, Yvonne Yen Liu, Meryl OBrian, Sarah Quiroz (University
of Houston-Clear Lake), Joy Vinson (University of Texas School of Public Health), Anna Gar-
rett, Eden Landers, Caroline Regenhardt Keegan, Julia Krupski, and Neha Dutta. We would
also like to thank Christine Kovic’s Anthropology students at the University of Houston-Clear
Lake who conducted some of the surveys. We would like to especially thank ROC Houston
Advisory Board members Pancho Arguelles, Living Hope Wheelchair Association, David At-
wood, Houston Peace and Justice Center, Michael Espinoza, SEIU, Maria Jimenez, Migrant
Rights Collective, Hany Khalil, Houston Federation of Teachers and Community Voices for
Public Education, Christine Kovic, University of Houston-Clear Lake, Reverend Ron Lister,
International Center for Spiritual and Social Activism, Juan Madera, University of Houston,
Laura Perez-Boston, Fe y Justicia Center and Texas Organizing Project, and Richard C. Shaw,
Harris County Labor Assembly, AFL-CIO (organizational affiliations are included for identifi-
cation purposes only). This report would not be possible without their support.
THIS REPORT SHOULD BE CITED AS:
Restaurant Opportunities Centers United, Behind the Kitchen Door: Extreme Inequality and
Opportunity in Houston’s Vibrant Restaurant Economy, (New York, NY: ROC United, 2015).
1 Carlyle, E. (2015) “America’s Fastest-Growing Cities 2015.” Forbes. Accessed October 15, 2015: http://www.forbes.com/sites/erincarlyle/2015/01/27/americas-fastest-growing-cities-2015/.
2 Sandler, E. (2013) “Houston Has ‘The Most Dynamic and Diverse Food and Drink Scene in the Nation.’” Eater. Accessed October 15, 2015: http://hou-ston.eater.com/2013/7/1/6411319/houston-has-the-most-dynamic-and-diverse-food-and-drink-scene-in-the.
3 Bureau of Labor Statistics, Current Employment Statistics, 2005-2014. Available at: http://www.bls.gov/ces.
4 US Census, “2012 Economic Census”. Available at: http://www.census.gov/econ/. Estimate uses 6.25% sales tax for the state and 2% for the city. City revenues are based on an estimate of $6 billion in sales within the city proper.
5 Sandler, E. (2013) “Houston Has ‘The Most Dynamic and Diverse Food and Drink Scene in the Nation.’” Eater. Accessed October 15, 2015: http://hou-ston.eater.com/2013/7/1/6411319/houston-has-the-most-dynamic-and-diverse-food-and-drink-scene-in-the.
6 Bureau of Labor Statistics, Current Employment Statistics, 2005-2014. Available at: http://www.bls.gov/ces.
7 US Census, “2012 Economic Census”. Available at: http://www.census.gov/econ/. Estimate uses 6.25% sales tax for the state and 2% for the city. City revenues are based on an estimate of $6 billion in sales within the city proper.
8 Kotin J, Schill, M. (2013). “A Map of America’s Future: Where Growth Will Be Over The Next Decade.” Forbes. Accessed November 2, 2015: http://www.forbes.com/sites/joelkotkin/2013/09/04/a-map-of-americas-future-where-growth-will-be-over-the-next-decade/.
9 US Census, North American Industry Classification System, 2015. Available at: http://www.census.gov/eos/www/naics/.
10 Bureau of Labor Statistics, “Quarterly Census of Employment and Wages 2004-2014.” Available at: http://data.bls.gov/cew.
11 Ibid.
12 ROC United analysis of American Community Survey (2010-2013) for Houston-The Woodlands-Sugar Land Metropolitan Statistical Area (2010-2013). Ruggles, Steven, Alexander J. Trent, Genadek Katie, Goeken Ronald, Schroeder Matthew B., and Soebek Matthew, Integrated Public Use Microdata Series: Version 5.0 [Machine-readable database], (Minneapolis: Minnesota Population Center, 2010).
13 Ibid.
14 Ibid.
15 Ibid.
16 Ibid.
17 Bureau of Labor Statistics, Occupational Employment Statistics, 2014. Available at: http://www.bls.gov/oes.
18 Bolton, Megan, Elina Bravve, Emily Miller, Sheila Crowley, Ellen Errico. (2015) “Out of Reach 2015: America’s Forgotten Housing Crisis.” National Low Income Housing Coalition: 1-264. Available at: http://nlihc.org/sites/default/files/oor/OOR_2015_FULL.pdf.
19 Ibid.
20 Restaurant Opportunities Centers United, Forward Together, et al., October 7th, 2014. The Glass Floor: Sexual Harassment in the Restaurant Industry. New York, NY: ROC United. Available at: http://rocunited.org/wp-content/uploads/2014/10/REPORT_The-Glass-Floor-Sexual-Harassment-in-the-Restaurant-Industry2.pdf.
21 Ibid.
22 Chapman, Jeff and Thompson, Jeff. “The Economic Impact of Local Living Wages,” Economic Policy Institute, 2006. Available at: http://www.epi.org/publication/bp170/.
23 U.S. Department of Health & Human Services 2015 Poverty Guidelines. Available at: http://aspe.hhs.gov/poverty/15poverty.cfm.
24 The City of Houston Official Site, “Economic Development.” Accessed October 6, 2015: http://www.houstontx.gov/ecodev/.
25 Ibid.
26 Forbes 400. Accessed November 2, 2015: http://www.forbes.com/profile/tilman-fertitta/
27 “Houston cuts tax deal with Landry’s.” KHOU 3 July 2012. Accessed October 6, 2015: http://www.khou.com/story/news/2014/07/20/11751974/.
30 Restaurant Opportunities Centers United, April 15, 2015. Picking Up the NRA’s Tab: The Public Cost of Low Wages in the Full-Service Restaurant Industry. New York, NY: ROC United, 2015. Available at: http://rocunited.org/wp2015b/wp-content/uploads/2015/04/REPORT_Public-Cost-of-Low-Wages-in-Full-Service-Restaurant-Industry.pdf.
ROC HoustonROC United275 7th Ave, Suite 1703New York, NY 10001212-343-1771rocunited.org
HOUSTON
Behind the Kitchen Door:Extreme Inequality and Opportunity in Houston’s Vibrant Restaurant Economy