36
Being a Foreigner Among Domestic Banks: Asset or Liability? Stijn Claessens and Neeltje van Horen WP/09/273

Being a Foreigner Among Domestic Banks: Asset or Liability?
Stijn Claessens and Neeltje van Horen
WP/09/273

© 2009 International Monetary Fund WP/09/273 IMF Working Paper Research Department
Being a Foreigner Among Domestic Banks: Asset or Liability?
Prepared by Stijn Claessens and Neeltje van Horen1
December 2009
Abstract
This Working Paper should not be reported as representing the views of the IMF. The views expressed in this Working Paper are those of the author(s) and do not necessarily represent those of the IMF or IMF policy. Working Papers describe research in progress by the author(s) and are published to elicit comments and to further debate.
Studying a large number of banks in various countries between 1999 and 2006, we document that foreign banks perform better when from a high income country, when host country competition is limited, and when they are large and rely more on deposits for funding. Foreign banks’ performance improves over time, possibly as they adapt, and is better when the home country is geographical or cultural (but not institutional) close to the host country. These findings show the importance of controlling for heterogeneity among foreign banks and help reconcile some contradictory results found in the literature on foreign banks’ performance. JEL Classification Numbers: F21; F23; G21 Keywords: Foreign direct investment; international banking; performance; distance Author’s E-Mail Address: [email protected] ; [email protected]
1 The paper was started while the authors were at the World Bank. We are grateful to Allaeddin Twebti, Matias Gutierrez and especially Tugba Gurcanlar and Joaquin Mercado for their help with collecting the data and to Mattia Landoni and Deimante Morkunaite for providing excellent research assistance and Zeynep Elif Aksoy for help with the data. We would like to thank Harry Huizinga, Luc Laeven, Joe Peek and seminar participants at the Central Bank of the Netherlands, the European Bank for Reconstruction and Development, the University of Amsterdam and the 24th Annual European Economic Association Meetings (Barcelona) for comments. Financial support for this project from the World Bank’s Research Support Budget and the United Kingdom's Department for International Development (DECRG trade and services project) is gratefully acknowledged. The views expressed in this paper are those of the authors and do not necessarily represent those of the institutions with which they are or have been affiliated.

2
Contents Page
I. Introduction ............................................................................................................................3
II. Theoretical predictions and related literature ........................................................................6
III. Data and Empirical Methodology ........................................................................................8
IV. Empirical Results ...............................................................................................................13
V. Conclusions .........................................................................................................................17 Tables 1, Review of Foreign Banking Performance Studies…………………………………….....20 2. Country Coverage and Characteristics of Banking Sector……………………………….25 3. Summary Statistics……………………………………………………………………….26 4. Impact of Foreign Ownership on Profitability─Individual Country Regressions…….....27 5. Impact of Foreign Ownership on Profitability─Home and Host Characteristics………..28 6. Impact of Foreign Ownership on Profitability─Distance…………………………….….29 Appendix Table 1. Variable Definitions and Sources…………………………………………………….......30 References………………………………………………………………………………..…31

3
I. INTRODUCTION
Banking has increasingly become more globalized, driven by deregulation, advances in communications and technology, and more general economic integration. Especially, foreign bank entry has increased sharply in the last few decades. As a result, policy makers and academics are keenly interested in the functioning of foreign banks in host countries. Existing studies that compare the performance of foreign banks to that of domestic banks have, however, found different results. One reason for these differences may be that whether being a foreigner is a liability or an asset depends on particular foreign bank’s characteristics and local market conditions that influence the bank’s ability to do business in a particular host country. However, few studies have tried to analyze the role of such factors. This paper attempts to shed light on some key factors.
Foreign banks can have a number of advantages compared to domestic banks. By servicing clients active in more than one country, they may achieve efficiency gains. In addition, they may achieve benefits from spreading best-practice policies and procedures over more than one country. Furthermore, they might be able to diversify risk better, allowing them to undertake higher risk, but also higher return investments. For example, foreign banks may have advantages in the form of more diversified funding bases, including having access to external liquidity from their parent banks, which may lower their funding costs. By being larger, they may achieve other scale advantages; for example, they may be able to afford more sophisticated models giving them superior risk management skills.
At the same time, foreign banks are likely to incur additional costs and face more
barriers compared to domestic banks. They may have less information compared to local banks on how to do business in the host country, putting them at a disadvantage, at least until they have been in the country for some time. Furthermore, foreign banks might be exposed to discrimination by host country government and customers. And diseconomies might arise because of difficulties operating and monitoring from a distance or in an institutional environment that is culturally different. Depending on which effects are stronger, foreign banks may perform better or worse compared to domestic banks in the host country.
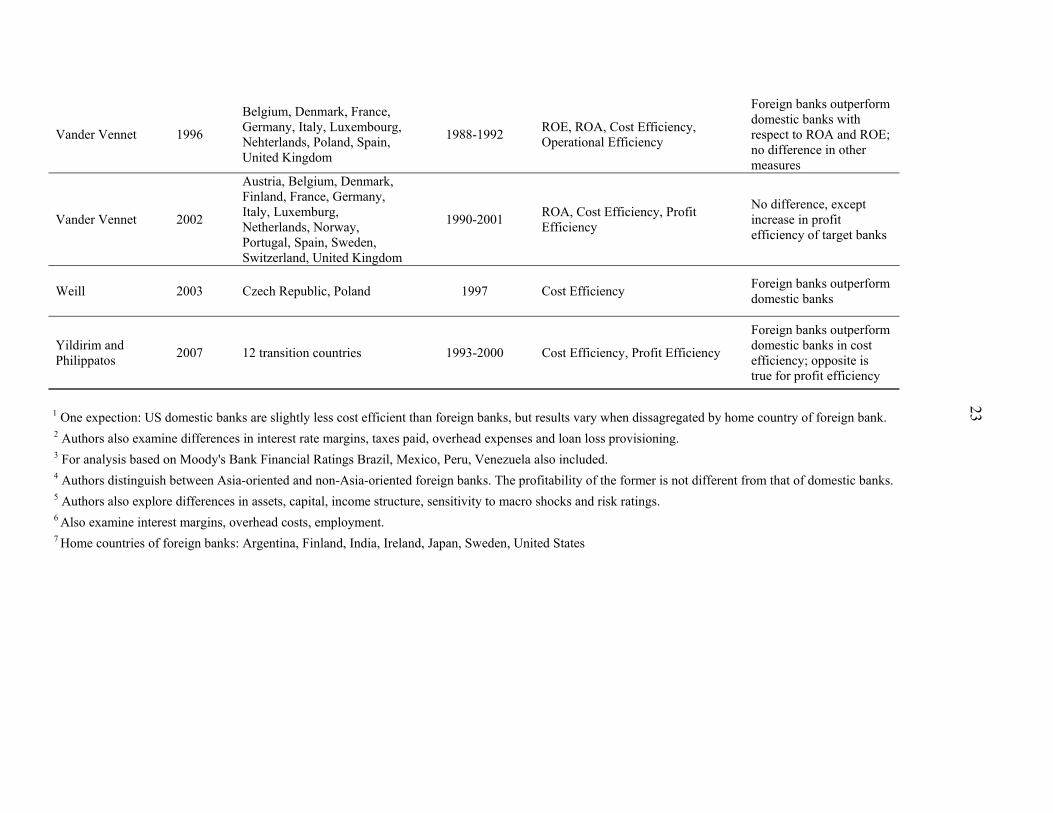
Empirically, the existing literature is ambivalent on the relative performance of
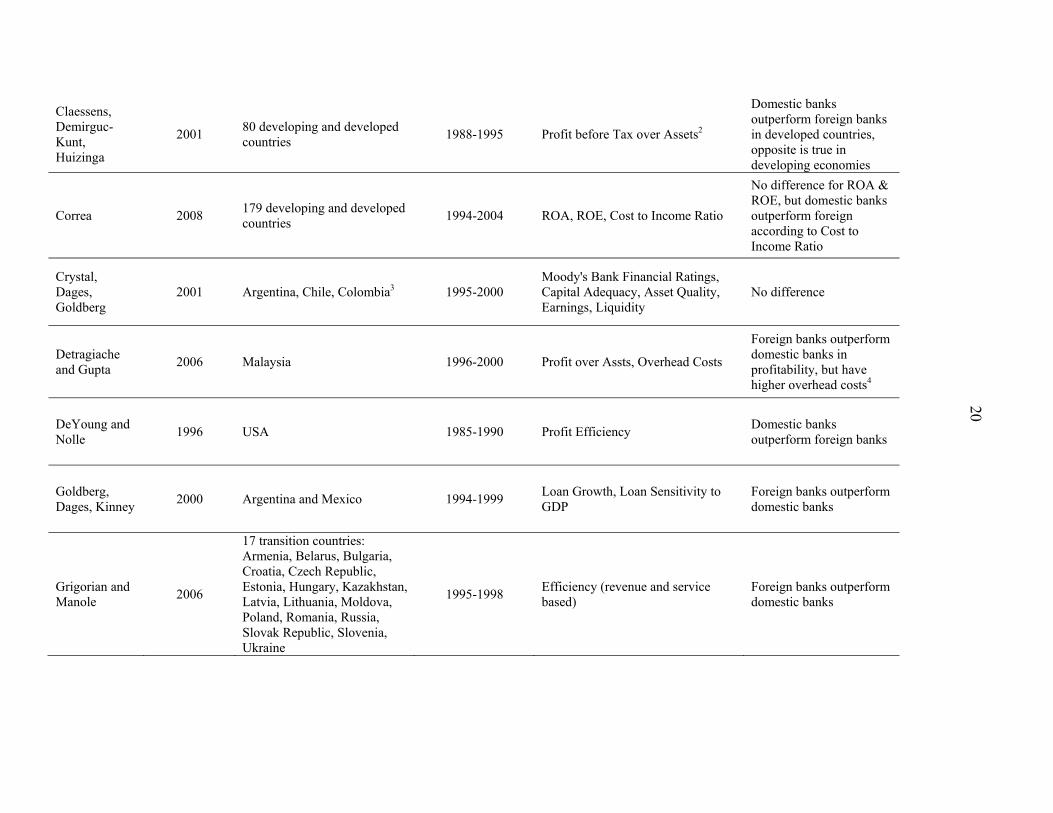
foreign banks.2 Table 1 summarizes the results of some 35 studies on the performance of foreign banks. The ambiguity found in the literature is clearly demonstrated in the variation across studies on the findings of foreign banks’ performance. A total of 15 studies found that foreign banks perform better than domestic banks on all performance measures, while 9 studies found worse or no statistically significant difference on all measures. The other studies were ambiguous as on some measures foreign banks performed better than domestic banks and on others worse or equal.
2 As well as on the contribution of foreign banks to overall financial sector development, access to financial services, financial stability, but those aspects are not analyzed here

4
Some of these differences in results may reflect differences in sample periods and country coverage. From Table 1 it is clear that, among the studies reviewed, there exists a wide variety in country coverage, from many single country studies to broader cross-country studies, and varying sample periods. Studies focusing on the US found that foreign owned banks perform significant worse than domestic banks (see, among others, DeYoung and Nolle 1996, and Mahajan, Rangan and Zardkoohi 1996). Using data from other industrialized countries, however, studies have documented that foreign banks perform better (Sturm and Williams 2004) or that no differences between foreign and domestic banks exist (Vander Vennet 1996). When studying foreign banks in developing countries, a number of studies have found that foreign banks outperform domestic banks (Grigorian and Manole 2006; Berger, Hasan and Zhou 2009). Others, however, have found the opposite result (Nikiel and Opiela 2002; Yildirim and Philippatos 2007) or no significant difference between domestic and foreign banks (Crystal, Dages and Goldberg 2001; Mian 2003).
Differences in results also reflect varying performance measures and econometric techniques used. Table 1 shows the variety in performance measures: some studies have used profitability measured in various ways, like profit before taxes as share of assets, net income after taxes as ratios of the book amount of equity (ROE) or of assets (ROA). Also, non-performing loans, loan growth, operational cost (to income) or other efficiency, and market valuation measures have been used as performance measures. These measures, however, capture quite different aspects, such as the bank’s performance with respect to profitability, stability or the efficiency with which it uses inputs. Furthermore, specific econometric techniques used have varied, from simple two-way comparisons to using regressions controlling for some bank and country characteristics.
The differences in countries, time periods and measures studied could explain the variety in findings. Although hard to tell, this unlikely explains all differences, however. Differences likely also reflect that in general studies do not account for the diversity among foreign banks and the circumstances under which they operate. Diversity exists in a number of dimensions. For one, several studies suggest that home and host country characteristics play an important role in performance. Berger, DeYoung, Genay and Udell (2000) find that, for the five industrialized countries they study, the performance of foreign banks compared to their domestic counterparts depends on the country of origin of the foreign bank. Claessens, Demirgüç-Kunt and Huizinga (2001) and Micco, Panizza and Yanez (2007) find that foreign banks tend to have lower profits than domestic banks in developed countries, but the opposite in developing countries, suggesting that the advantages of being foreign do not offset the costs as much in industrialized compared to in developing countries. Using data for 13 (mostly developed) host countries, Miller and Parkhe (2002) find some evidence that the performance of a foreign bank is influenced by the competitiveness of both home and host countries.
In addition to home and host country characteristics, cultural, geographical or institutional distance might impact the relative performance of foreign banks. Distance in the various dimensions between borrower and lender increases not only transaction costs, but also the information problems a bank faces in its lending decisions and therefore likely affects its profitability. Mian (2006) finds that foreign banks that are geographically close to
5
the host country are better able to deal with local (soft) information. Berger, Klapper and Udell (2001) find similar results, with foreign banks with parents in other Latin American countries more likely to lend to small, informational opaque Argentine firms than other foreign banks do. Correa (2008) finds that in industrialized countries the post-acquisition performance of cross-border banks is higher when host and home country share the same language but lower when they share the same legal system. And, as an example from capital markets on the importance of distance, Coval and Moskowitz (2001) show that fund managers are better equipped to earn substantial abnormal returns in geographical more proximate investments.
Bank characteristics likely play a role as well. Size can be an important factor in determining bank performance (see Berger 2007 for a review of the literature on economies of scale). And it has long been documented that funding and asset mixes affect bank performance (e.g., Berger and Mester, 1997). Also the amount of time the foreign bank has already been present in the host country can be important as an indicator how well it may have adjusted to the local institutional environment.
There have been some papers that have highlighted these differences and pointed
towards some explanations, but few have tried to do it comprehensively. To analyze these factors more completely requires a large data set of foreign and domestic banks, preferably in a panel format, with a broad spectrum of home-host combinations, diversity in bank characteristics, etc. At the same time, the list of factors to include and control for has to remain manageable. This study does so.
By examining the relative performance of foreign banks, as measured in terms of
profitability, in a large group of countries over the period 1999-2006 in a regression framework including these factors, we systematically analyze which factors have an important impact on the advantage or disadvantage of being foreign. The large number of countries in our database enables us to exploit the variation in host country and home country characteristics and the distance between the two. The use of bank characteristics allows us to control for and study key bank characteristics that can play a role in performance. In addition, the panel structure of our data allows us to disentangle possible differences in short and long-term effects of foreign ownership. We find that the location of the parent bank, the competitiveness in the host country, the geographical and cultural distance between host and home countries, and the bank’s size and time it has been present in the country, as well as its funding structure, are important factors explaining the relative performance of foreign banks.
Our work adds to the literature in several ways. Most importantly, it extends the
literature on the performance of foreign banks by documenting some of the factors that impact a foreign bank’s ability to operate in a host country. As such, it provides an explanation for some of the contradicting results found in the literature. Second, by studying how distance influences the performance of foreign banks, our study contributes to the rapidly increasing literature on the impact of distance on the activities and performance of financial intermediaries. This includes studies that find evidence of the considerable impact of distance on international investment decisions (Buch 2003), loan rates (DeGryse and Ongena 2005), lending decisions (Mian 2006) and bank branching (Grosse and Goldberg

6
1991). Third, most studies focus only on one or a small group of (developed or developing) countries, with some notably exceptions, such as Claessens, Demirgüç-Kunt and Huizinga (2001) and Micco, Panizza and Yanez (2007), whereas our results reflect evidence from a large number of countries. Fourth, we explicitly analyze the impacts of some specific bank characteristics. Especially the dynamics behind the performance of foreign banks has received limited attention in the literature, with a few notable exceptions (such as Majnoni, Shankar and Varhegyi 2003 and Berger, Clarke, Cull, Klapper and Udell 2005).
We organize the rest of the paper as follows. The next section reviews the theoretical
predictions regarding the factors that will affect the advantages and disadvantages of being foreign and the resulting impact of being foreign on performance. Section 3 introduces the data and discusses the empirical methodology we employ. Section 4 shows and discusses the empirical results. Section 5 concludes.
II. THEORETICAL PREDICTIONS AND RELATED LITERATURE
If the advantages of being foreign outweigh the disadvantages, foreign banks should outperform domestic banks. If the opposite is the case, domestic banks should perform better than their foreign counterparts. As some previous studies find different results this may be because a number of factors influence the extent to which being foreign is an asset or a liability. The literature provides suggestions for several factors that could potentially have an impact. Home country characteristics
Berger, DeYoung, Genay and Udell (2000) find for a number of OECD countries that on average domestic banks are more efficient than foreign banks are but that these aggregate results mask considerable heterogeneity across foreign banks. Their results suggest that only some banks from a limited number of countries with specific favorable market or regulatory/supervisory conditions can outperform domestic banks in their host countries. They however do not provide an answer as to which home market conditions might give these banks an advantage.
A first factor that might have a positive impact on the performance of a foreign bank
is the overall development of the home market. For example, the fact that the labor force is highly educated makes it easier for a bank to adopt new risk management techniques, new financial instruments and new technologies (Berger, DeYoung, Genay and Udell 2000). Furthermore, more advanced countries in general will have well developed regulatory systems, including a relatively strong safety net. This allows banks to undertake higher risk-higher return projects, including investing in another country.
In addition, the degree of competition in the home country might provide foreign
banks with an advantage in their host country. As in other industries, the degree of competition in the financial sector can affect the efficiency of the production of services, the quality of products, and the degree of innovation in that sector. A bank that has learned to work in a competitive environment with demanding customers in its home country has learned to innovate, pursue new business segments and adjust to changing circumstances

7
(Aghion and Howitt 1998). Greater competition at home can thus lead to more efficient operations abroad. Host country characteristics
In some type of countries it might be easier for foreign banks to acquire market share and thus perform better. As Claessens, Demirgüç-Kunt and Huizinga (2001) point out in countries where the banking sector is inefficient, banking practices are outmoded and credit is not allocated based on commercial criteria, foreign banks might be able to reap higher profits than domestic banks. In addition, the development of the financial sector could have an impact on the performance of a foreign bank. In a country where a large part of the population does not yet have access to financial services it is easier to gain market share and therefore likely easier to make a higher profit. In contrast, in countries with a well developed banking sector, both domestic and foreign participants may be sophisticated. Even when foreign banks have technical advantages, they might not be enough to offset the informational disadvantages they face relative to domestic banks. Furthermore, in a market that is highly competitive it might be more difficult for a foreign bank to outperform domestic banks operating in the country as profit margins are small. Distance
Distance might also have an impact on the benefits and costs of being foreign. The
theory of financial intermediation (Diamond 1984, Boyd and Prescott 1986, Boot and Thakor 1997) builds on the notion that intermediaries serve to reduce transaction costs and information asymmetries. However, the severity of the asymmetric problem itself may be a function of distance (Hauswald and Marquez 2006). As such, it would be harder to make profitable investments when distance is large. Results from Coval and Moskowitz (2001) support this idea. They find that in the mutual funds sector, where information is a lot less opaque and agency issues less severe compared to banking, managers still earn substantial abnormal returns in investments that are geographically close.
Distance can also impact a foreign bank’s performance as it may impede the flow of
information within the bank. In a theoretical model, Stein (2002) shows that greater distance decreases the incentives of a bank manager to collect soft information. Mian (2006), using data for Pakistan, tests this theory, arguing that distance is especially large for foreign banks as loan officer and CEO reside in different countries. He shows that greater cultural distance makes it more costly for foreign banks to collect and communicate soft information. Similar Berger, Klapper and Udell (2001) find that foreign banks that are culturally close have less problems extending loans to opaque small Argentine firms than culturally distant foreign banks. These results suggest that distance can have a potentially strong impact on the performance of foreign banks. Especially when bank activities require local knowledge (like local deposit taking or lending to SMEs) it can be expected that domestic banks that are familiar with local customs and better equipped to work with (soft) information outperform foreign banks.
Finally, distance can affect the performance of a foreign bank as it may increase the cost of management or reduce efficiency in other ways. Berger and DeYoung (2001, 2006)

8
find that distance determines the effectiveness of internal control mechanisms within bank holding companies. In addition, research on the barriers faced by foreign owned institutions suggests that distance and cultural differences deter cross-border M&As (Buch and DeLong 2004).
In summary, theory predicts that distance between host and home country has a
negative impact on the performance of a foreign bank compared to its domestic counterparts. Information availability in the host country, experience and bank activities may affect the strength with which distance influences performance. Bank characteristics
Size and other bank characteristics have been found to be important for explaining performance of any bank. Studies have found differences between small and large banks, driven in part by different economies of scale and the fact that such banks operate in different niches, leading to differences in performance (see Berger and Humphrey 1997 for a review). Ownership structures and other corporate governance aspects have been found to affect bank performance (Laeven and Levine, 2008). And funding and asset mix have been used as control variables as they can affect performance. For our study, one other important aspect is how long the foreign bank has been present in the host country. This can be expected to make a difference on the bank’s current performance. For example, if there are set-up costs, including learning of the local environment, performance may become better over time.
III. DATA AND EMPIRICAL METHODOLOGY
Basic Data Description
We use a newly constructed database on bank ownership (see Claessens, Van Horen, Gurcanlar and Mercado 2008 for a complete description of the database). The database contains ownership and balance sheet information of banks in all developing countries over the period 1995-2006.3 The coverage is comprehensive, with in the latter part of the period banks included roughly accounting for 90 percent or more of the banking system assets in each country. The database includes all currently and past active commercial banks that are or have been reporting to Bankscope during the sample period.4 For each bank, we determine the year of its establishment and, if applicable, the year it became inactive. We treat mergers and acquisitions carefully to avoid double counting.
An important feature of the database is that for each year the bank is active over the
period 1995-2006 its ownership is determined. Furthermore, if a bank is foreign owned, the 3 The database does not include countries with less than five active banks in Bankscope. The cutoff of 2006 avoids any inference from the 2007-08 global financial crisis.
4 The full database also includes saving banks, cooperatives, bank holding companies and long term credit banks, however to keep the banks in the database as homogeneous as possible we only use commercial banks in this paper. Commercial banks account for 90% of all the banks in the database.

9
country of residence of the owner is tracked. As such the database allows us to look at the impact of home and host country characteristics as well as linkages between these countries on the performance of foreign banks. We use the definition generally applied in the literature on foreign banking (e.g., Clarke, Cull, Martinez Peria and Sanchez 2003; Claessens, Demirgüç-Kunt and Huizinga 2001) and consider a bank as foreign owned if 50 percent or more of its shares is owned by foreigners. To determine the home country of ownership, we sum the percentages of shares held by foreigners by the country of residence, with the country with the highest percentage of shares then considered the home country. Ownership is based on direct ownership, i.e., we do not consider indirect ownership. However, when the direct owner is an entity just established for tax purposes, we do not use the direct, but rather the relevant next level of ownership.
To track ownership and changes therein we use as our primary source information
available in Bankscope. We complement this information, however, with information from several other sources, including individual banks’ websites and annual reports, parent companies websites, banking regulatory agency/Central Bank websites, reports on corporate governance, local stock exchanges, SEC’s Form F-20, and country experts. Through extensive searches we are able to obtain ownership information for almost 95 percent of the banks in our sample for the entire period in which they were active.5 Balance sheet information of the banks in the database is collected from Bankscope.
Although the database covers almost all developing countries, for our purposes it is
preferable to only use a subset of countries. When testing how ownership affects performance in a multi-country setting one has to deal with an endogeneity problem. The decision of a bank to enter a certain country is conditional on the state of the local market (structure and concentration of the banking system, general profitability, quality of regulation and supervision, the contracting environment, etc.). As such, a selection bias can exist with foreign banks seeking out those markets where they can operate best. Most of this bias, however, can be overcome by including country control variables and having a control group of local banks. Therefore, in order to limit the endogeneity bias, we only include countries that are sufficiently open for foreign entry (at least 3 foreign banks are active over the entire sample period) and for which there is a large enough control group of domestic banks (at least 3 domestic banks are active over the entire sample period). These two conditions would limit our sample to only 33 countries. However, if we shorten the time period from 1999-2006 our subsample includes 51 countries.6 By shortening the time period we do not lose much information as balance sheet information is rather scarce between 1995 and 1999. Our results are robust to different samples though (results available upon request).
5 While our coverage is good, there are data limitations. For example, some foreign shareholders are trusts that hold shares on behalf of investors, which may or may not be foreigners, but available data do not provide this information.
6 Zimbabwe also qualified, but as the economic situation in this country deteriorated so rapidly in the last few years we exclude it from the sample.

10
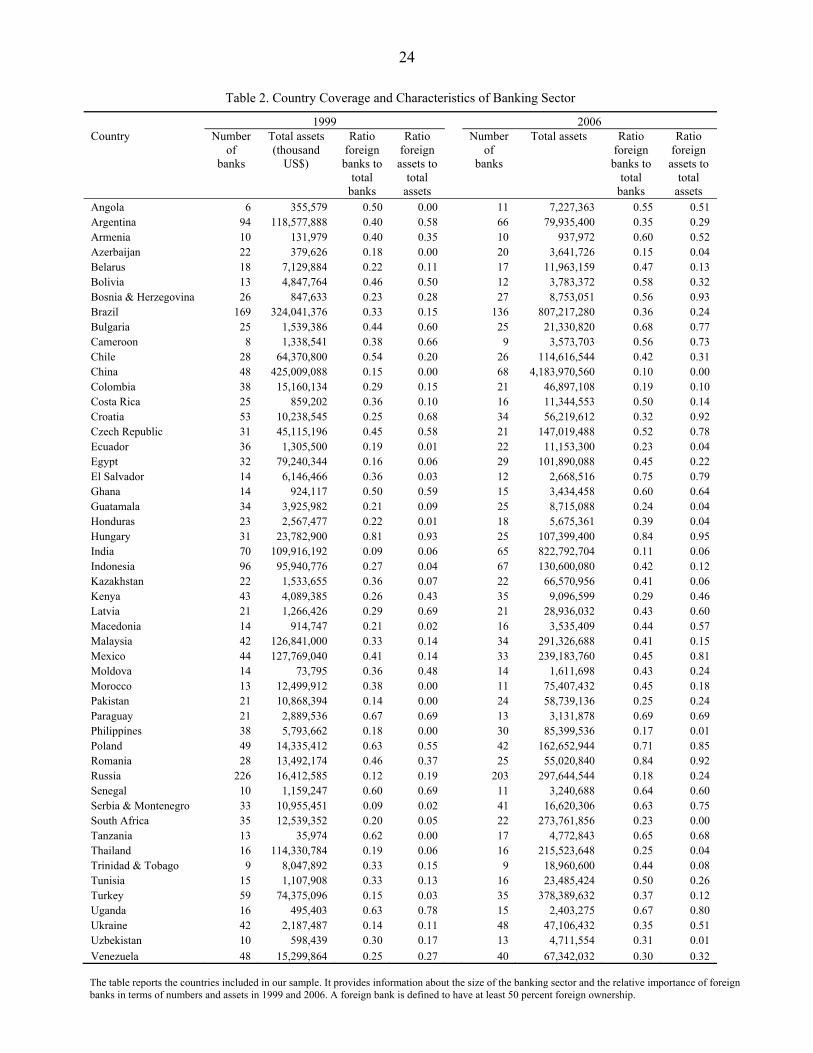
Table 2 provides a list of all the countries in our sample. Even when using a sub-sample our database includes a wide variety of income levels. Ten countries are low income, 26 lower middle income and 15 countries are upper middle income countries.7 The table shows the size of the banking system of each country in terms of number and total assets in 1999 and 2006. In addition, it shows the relative importance of foreign banks in the country. Countries vary substantially in size of the financial system and importance of foreign banks. In 1999 the number of banks ranges from the minimum number of 6 in Angola to 226 in Russia. In 2006 Cameroon and Trinidad and Tobago have the smallest number of banks (9), while Russia is still front runner with 203 banks. The relative size of the banking sector and its growth over time in terms of assets should be interpreted carefully as asset information is not always available (especially in 1999). Based on our information, Tanzania has the smallest and China the largest banking sector in 1999. In 2006, Armenia has the least assets while China again topped all countries with a vast margin. In terms of number of banks, the relative importance of foreign banks ranges in 1999 from 9% (India and Serbia and Montenegro) to 81% (Hungary) and in 2006 from 10% (China) to 84% (Hungary and Romania). In terms of assets the relative importance of foreign banks ranges in 1999 from 0% (which indicates missing information, i.e., is fictive) to 93% in Hungary. In 2006 the assets of foreign banks surpass 90% of total assets in four Eastern European countries (Bosnia & Herzegovina, Croatia, Hungary and Romania). Home and host country characteristics
To capture the overall level of development of the home and host country we use GDP per capita (gdpcap). In addition, to see if it matters whether the parent bank is located in a high-income or a developing country we construct a dummy variable developing. This dummy is one if the foreign bank is from a developing country and zero if from a high income country. The division between developing and high income is based on the World Bank classification in 2006. To capture potential differences between the performance of foreign banks in low income and middle income countries we construct a dummy variable low which is one if the host country is a lower income country based on World Bank 2006 definitions. To measure financial development (findev) in the host country we use a simple measure often applied in the literature: M2 divided by GDP.
Measuring competition, however, is less straightforward. As Claessens and Laeven
(2004) point out competitiveness of an industry cannot be measured by market structure indicators or performance measures alone. In order to capture the degree of effective competition it is preferable to use a structural model. As such we use their measure of competitiveness: the H-statistic based on the Panzar Rosse (1987) methodology. The Panzar Rosse H-statistic is calculated per country from reduced-form bank revenue equations and measures the sum of the elasticities of the total revenue of the banks with respect to their input prices. H<0 indicates a monopoly, H=1 reflects perfect competition and 0<H<1 indicates monopolistic competition. As calculation is very data intensive the H-statistic is not time-varying and can only be calculated for a select number of countries (50 in total). As a
7 As defined by the World Bank in 2006.

11
result, in the regressions where we examine the impact of competition in host and home country on the performance of foreign banks our sample will be reduced. For the exact calculation of the H-statistics and the countries for which the statistic is available, see Claessens and Laeven (2004). Measuring Distance
There are different ways one can measure distance. The measure most commonly used in the literature captures geographical or cultural distance.8 We proxy these types of distance by two dummies. Following Mian (2006) one of the dummies, samereg, equals one if host and home country are located in the same region (as defined by the World Bank).9 The other, comlang, equals one if both countries share the same language
Distance can also be measured by the difference in institutional quality between host
and home country. As banking is a highly institutionally sensitive activity, familiarity to deal with the institutional environment likely affects the ease with which a bank can use available information. A number of studies have found that institutional similarity matters in the location decisions of foreign banks (Galindo, Micco and Serra, 2003; Claessens and Van Horen 2008). We create a dummy variable, instfam, that captures institutional distance between home and host countries. The variable is based on the governance indicators of Kaufmann, Kraay and Mastruzzi (KKM, 2008). The KKM-indicators measure six dimensions of institutional quality: (1) voice and accountability, (2) political instability and violence, (3) government effectiveness, (4) regulatory quality, (5) rule of law and (6) control of corruption. For each dimension, indexes range from -2.5 to 2.5 with higher values indicating a better institutional environment.10 We take the simple average of these six governance indicators and then calculate the absolute difference between the institutional quality in host and home country. When the difference between host and home country is smaller than the median difference instfam has a value one, if it is higher it is zero.11 We expect the relative performance of foreign banks to be better when geographical and cultural or institutional distance between host and home country is small.
8In general geographical distance is highly correlated with cultural difference, so we treat geographical and cultural distance as synonym.
9 The World Bank categorizes developing countries in six regions, that is Eastern Europe and Central Asia, Latin America and the Caribbean, Sub-Saharan Africa, Middle East and Northern Africa, East Asia and Pacific and South Asia. We employ these same regions and add one: high income-OECD countries. This leaves us with a group of non-developing non-OECD countries. These countries are added to one of the regions based on their location.
10 The measures are currently collected on an annual basis, but before 2002 only on a bi-annual basis. We use the value of the previous year for the years in which no indicator is available.
11 We tested whether we found different results when using a continuous variable capturing institutional distance between host and home country. This was not the case.
12
Bank level data
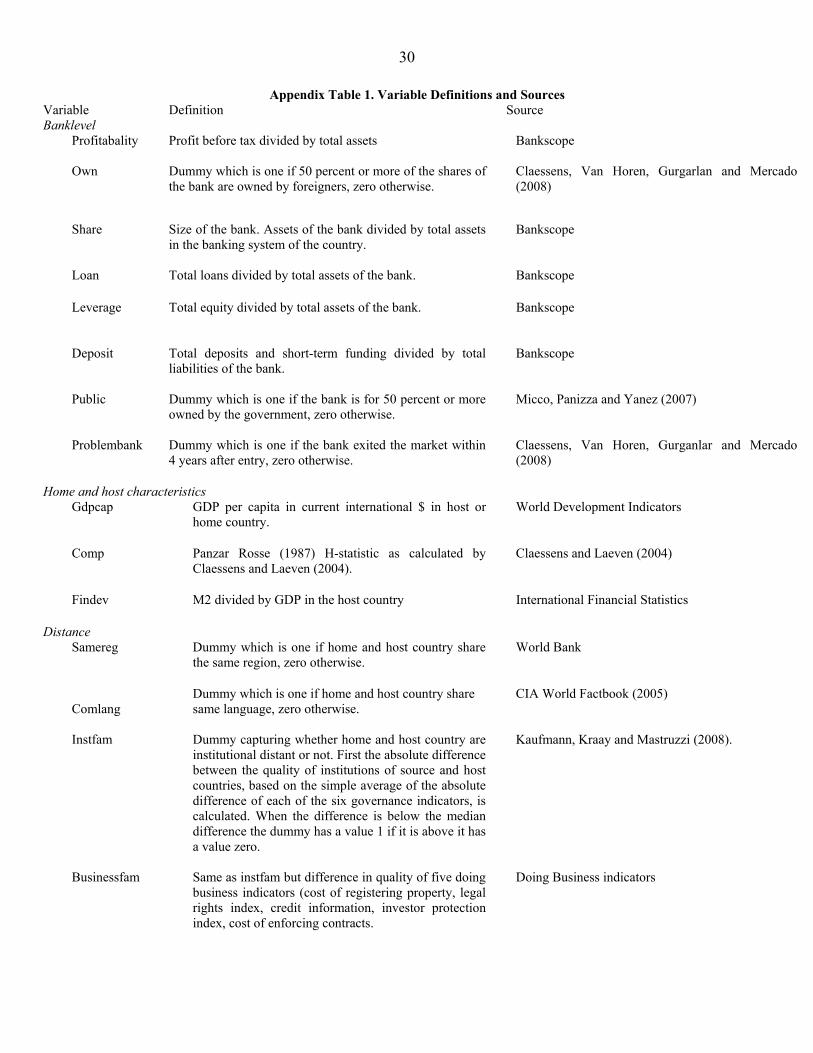
We look at a number of bank level variables: size (both in absolute terms as well as relative to the domestic banking sector), funding structure, asset structure and age. For each variable (except age) we determine the median across all (foreign and domestic) banks and create a dummy which is one if the specific bank is above the median value and zero otherwise. Then we interact these variables with the ownership of the bank to create four different groups. For example, in the case of size we have different dummies for small domestic banks, large domestic banks, small foreign banks and large foreign banks. This way it is easy to compare performance across different types of banks (like small domestic versus small foreign banks).12 In addition, for age we create two categories: old and new banks and similarly interact these dummies with the ownership of the bank. We measure size of the bank by the share of the domestic banking market it captures (share). Funding structure is captured by ratio of deposits to liabilities (deposit) and asset structure by the loan to asset ratio (loan). For age (age), we use a cutoff of 8 years to create the old and new categories. Table 3 reports the summary statistics of all the variables employed in the empirical specifications.13 The Appendix Table 1 provides a complete description of all variables used.
Empirical methodology
There are several dimensions by which to study the performance of foreign banks. We opt for a very straightforward one and study the impact of bank ownership on the profitability (as measured by profit before taxes divided by total assets) of a bank. More specifically we use a panel model relating performance to bank ownership, the abovementioned interaction variables and a number of controls. We use country-year fixed effects to control for unobserved country characteristics that are allowed to vary over time. This way we can estimate whether in a given country foreign banks tend to outperform domestic banks. Our model thus already controls for those country characteristics that have proven to have explanatory power for bank performance, such as the general level of development, financial depth, banking market structure, the quality of information infrastructure, property rights and aspects of macro-economic policy of the country. Furthermore, this way we control for (country dependent) variation in profitability over time due to, for example, interest rate cycles and macroeconomic cycles.
We do, however, include a number of bank level controls. We include, as continuous
variables instead as dummies, the bank characteristics share, loan and deposits. In addition, we control for the leverage of the bank (leverage) defined as equity divided by assets.
12 Alternatively, we could interact the ownership dummy with the continuous bank characteristic variable. This, however, implies that we test whether large foreign banks are more profitable compared to the group of small foreign banks and all domestic banks combined. In our view, this comparison is less insightful. We did, however, run such regressions as well and conclusions drawn from these are the same as those presented in the paper.
13 We do not have summary statistics for the age of the bank as we do not know the exact age of the foreign banks that entered the country before 1995.

13
Furthermore, we include a dummy (public) which is one if a domestic banks is majority owned by the government as to control for the fact that government owned banks tend to be relatively weak performers. Finally, we include a dummy variable, problembank, which is one if the bank (foreign or domestic) has exited the market within four years after entry.14 Banks that exit the market soon after entry are likely banks that have underperformed. Not correcting for this could potentially bias the estimation.
To summarize, we test what factors affect the profitability of foreign banks using the
following specification:
ictictictictictict XFOwnOwn '* 1210 (1)
where ict is profitability of bank i, in country c at year t. j indicates the home country of the foreign bank. Own is the ownership dummy, which is one if the bank is foreign owned.
ictF represents one of the factors (distance, home or host country characteristics) that might
explain the differential impact of foreign ownership on profitability. ictX is a vector of bank level variables. We estimate the model using OLS. All standard errors are robust and allow for clustering at the host country level.15 We weigh the observations with the weights equal to the inverse of the number of banks in the host country to prevent any bias due to differences in market size. Since in the first years after starting up a bank or acquiring an existing bank the profitability likely is affected by start-up costs we exclude observations in the first 2 years the (foreign or domestic) bank is active or acquired.
IV. EMPIRICAL RESULTS
Individual country regression
Before examining which factors can explain the cost of being foreign, we first look at individual country results. This enables us to see if indeed differences exist between countries with respect to the performance of foreign banks. For the individual country regressions we apply model (1) without country-year fixed effects but with year fixed effects
Results are summarized in Table 4. The table divides the countries in our sample in 4
groups. The first group (upper left quadrant) consists of countries for which the impact of ownership is positive and significant. In these countries foreign banks are on average more profitable than domestic banks. The second group (upper right quadrant) contains countries 14 For the banks that entered after 2002 we do not know whether they are “problem” banks or not. In our regressions we err on the side of caution and include these banks in the group of “problem” banks. However, our results are robust to including these banks in the group of normal banks.
15 We also ran regressions with clustering at the home country level. The main results are not affected under this specification. However, we prefer clustering at the host country since errors are more likely correlated between foreign and domestic banks active in the same country than between foreign banks from the same home country operating in different host countries.

14
with a positive but insignificant parameter for ownership. Countries in which domestic banks tend to outperform foreign banks (negative and significant sign for ownership) are located in the lower left quadrant. The last group (lower right quadrant) displays those countries for which ownership has a negative but insignificant sign.
The table indicates that in our group of 51 countries, all four cases occur. Foreign
banks are performing better than domestic banks in 14 countries and worse in 8 countries. In the majority of countries there does not seem to be a significant difference between domestic and foreign banks. Of this group ownership has a positive sign in 14 countries and a negative sign in 15 countries.
These results reinforce the results of previous studies: when looking at aggregate data
there is no straightforward relationship between bank ownership and performance. Apparently under some conditions being a foreigner is an asset, in some cases it is a liability and sometimes ownership just does not matter. In the next section we investigate which factors have an impact on the relative performance of foreign banks. Foreignness and home and host country characteristics
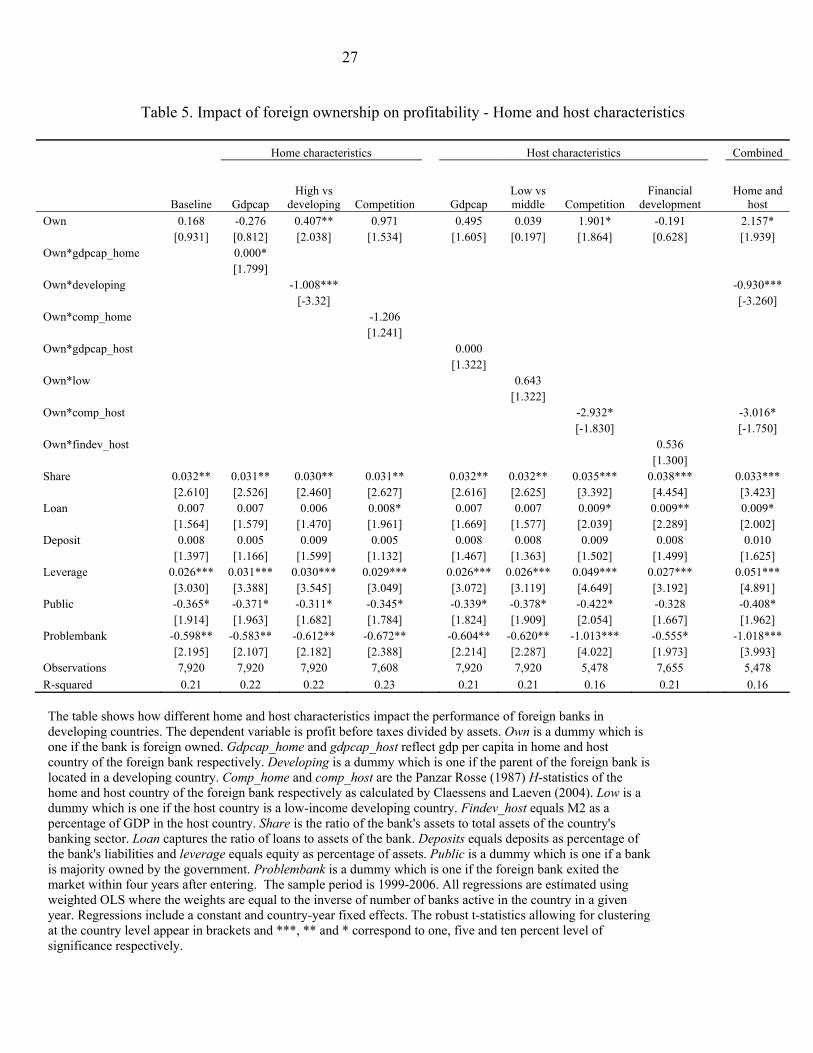
We pool all countries together and test whether the impact of foreign ownership is dependent on certain factors, starting with home and host country characteristics. The results are provided in Table 5. The first column of the table shows that, if we do not differentiate between different types of foreign banks, we find no impact of foreign ownership on profitability. However, as soon as we allow for heterogeneity with respect to home and host country we see that foreign ownership does matter. When looking at home country characteristics we find strong evidence that the level of development of the country in which the parent company is located influences the performance of foreign banks since we find a significant and positive effect when interacting ownership with GDP per capita of the home country. The significance of the income effect becomes even stronger when we split home countries in high-income versus developing countries. We find that foreign banks outperform domestic banks when the parent is located in a high-income country. However, when the parent is located in a developing country a foreign bank performs significantly worse than a domestic bank. This suggests that technical and regulatory advances of foreign banks from high income countries make it easier for these banks to make profitable investments in developing countries. One could argue that these results are driven by the fact that foreign banks from high-income countries tend to be larger than foreign banks from developing countries and that it is scale, not home country development that matters for the difference in profitability. However, when we control for the scale of foreign banks, our results do not change (see Table 7). Competition in the foreign bank’s home country does not affect the performance of the bank. However, competition in the host country does have an impact. We find that when competition in the host country is limited foreign banks are more likely to outperform domestic banks. This is not surprising. When competition is limited it will be easier for a

15
bank to generate excess returns and thus make a larger profit. Other host country characteristics (the level of overall and financial sector development) do not matter much for the relative performance of a foreign bank.16 When we combine both significant factors (developing country foreign bank and competition in the host country) in one regression (last column) we find that both results keep their significance, suggesting that both factors matter. Looking at the economic relevance of our findings we see that they are important. A foreign bank from a high income country investing in the host country with lowest competition (Turkey) earns on average a profit before tax of 0.72 higher than a domestic bank.17 This is equal to 44 percent of the mean profitability. Similarly, this same bank in a country with strongest competition (Costa Rica) earns on average a profit before tax of 0.70 less than a domestic bank. A foreign bank from a developing country, on the other hand, earns on average 0.18 less compared to a domestic bank in the host country with lowest competition and 1.60 less in the host country with highest competition. In terms of control variables, we see that they are in almost all cases very consistent across the regressions. Large banks tend to be more profitable than smaller banks. Banks that have a larger loan ratio and banks with limited leverage (high share of equity in assets) also tend to be on average more profitable. Domestic banks that are majority government owned are less profitable compared to private banks. Finally, banks that exited the market within the first four years after entering are on average less profitable. None of these results are very surprising. Foreignness and Distance
When testing for the impact of distance on the performance of foreign banks it is important to control for the home and host country characteristics that have an important impact on foreign bank performance. Especially it is important to control for the level of development when using region in which home and host country are located as proxy for geographical and cultural distance. After all, as all host countries are developing countries only a very small group of foreign banks from high-income countries (in effect only the non-OECD high-income countries) will be located in the same region. So without correcting for level of development of the home country, the dummy samereg will not only capture the impact of being geographically close but also the impact of being from a developing country. As is clear from the results in Table 5, competition in the host country is also an important factor affecting a foreign bank’s profitability. We do, however, not include this
16 Fluctuations in the ratio of M2 to GDP could be due to episodes of banking crises, which, if they also affect the performance of foreign banks, could bias our results. When adding a variable interacting ownership with a crisis dummy (using episodes of banking crises as identified by Laeven and Valencia, 2008), however, the impact of financial development (M2/GDP) on the performance of foreign banks remains unchanged
17 The minimal level of competition in our sample of host countries is 0.46. This value times 3.106 and subtracted from 2.157 equals 0.72.
16
variable as a control. As we do not have the H-statistic for all the countries in our sample we will lose a lot of information (913 foreign bank-year observations) when we include this variable. We did however test whether our main results are sensitive to excluding this variable and this turns out not to be the case. The results in Table 6 show that, after controlling for the level of income of the home country of the foreign bank, geographical and cultural (language) distance does matter for the performance of the foreign bank. Banks that are geographically and culturally close, either proxied by the home and host country being located in the same region or having the same language, have on average a higher profitability than foreign banks that are geographically and culturally distant. We check whether these results differ between high-income and developing country foreign banks but this is not the case (results not shown). Both types of foreign banks benefit significantly from being geographically and culturally close. Our results thus confirm the theoretical predictions.
In the case of institutions, however, we do not find a significant impact of being
familiar. One explanation for this finding could be that the KKM governance indicators are too general to capture the institutional familiarity dimensions that matter for banking. Therefore we estimated the same model using a number of World Bank Doing Business indicators (results not shown).18 Also in this case we did not find evidence that institutional distance mattered. This suggests that, while geographical and cultural distance does seem to matter, institutional distance can be overcome by foreign banks. Foreignness and bank characteristics
We next test whether the impact of bank characteristics on performance varies between foreign and domestic banks (Table 7). We run these regressions controlling for the development of the home country and geographical and cultural distance variables (with the variables significant in all specifications, except samereg which is never significant), but all regression results hold when excluding these variables.
We first test whether size effects vary. We find that large foreign banks outperform
small foreign banks as well as large and small domestic banks as the dummy for large foreign banks is statistically significant positive, while those for large domestic bank and small foreign bank are not statistically significant (missing category is small domestic bank). This confirms the prior that foreign banks can have some scale advantages. Similarly, we find that foreign banks with monopoly power in the host country outperform foreign banks that do not have monopoly power and outperform domestic banks with and without monopoly power.
We next investigate whether funding and asset structures matter for performance. In terms of funding structures, we find that foreign banks with many deposits outperform domestic banks and foreign banks with limited deposits. This suggests that only those foreign
18 Particularly, we look at the cost of registering property, legal rights index, credit information index, investor protection index and cost of enforcing contracts.

17
banks that have a large (and stable) local deposit base can effectively compete and be profitable.
In terms of asset structure, the degree to which the bank engages in lending, we find
no statistically significant differences in profitability between the various groups of banks. This may reflect offsetting effects. Foreign banks may, for example, be better in risk management and thus have higher profitability as they are able to make riskier, but also higher return loans. At the same time, foreign banks may incur higher transaction costs in making loans as they are less familiar with the local institutional environment.
Next we investigate whether the time a foreign bank has been active in the host
country has an impact on its performance. We find that foreign banks that are more than 8 years in the country have the best performance. Compared to the other groups, profitability of these banks is 0.4 percentage points higher, a large difference since the overall average profitability is 1.6 percentage points. Although this result might be driven by some survivor bias, it confirms the findings of Claessens and Van Horen (2009) and suggests that over time foreign banks adapt to the local environment and can operate more efficiently.
Summarizing, our results indicate that the relative performance of a foreign bank is affected by a number of factors. First, foreign banks from high income countries tend to be more profitable compared to domestic banks, while foreign banks from developing countries are less profitable. Furthermore, foreign banks entering a country where competition in the banking sector is limited are more profitable than foreign banks entering a country with a lot of competition. In addition, a foreign bank that is geographical and cultural close is more profitable than one that is distant. Finally, the bank’s size and time it has been present in the country, as well as its funding structures, are important determinants for the relative performance of foreign banks. Our results indicate that it is important to control for this heterogeneity among foreign banks when examining their relative performance.
V. CONCLUSIONS
Although the performance of banks when entering a foreign country has received ample attention in the literature, results found so far were far from univocal. In some cases foreign banks performed better compared to domestic banks while in other cases the reverse was found. This study reconciles these differences by showing that a number of factors importantly contribute to the relative performance of a foreign bank. Using data from a large number of developing countries over the 1999-2006 period, this study found strong evidence that the level of development in the home country, the competitiveness of the financial sector in the host country, the geographical and cultural distance between home and host country and certain bank characteristics are important determinants for the profitability of a foreign bank.
Our results suggest that when studying the behavior of foreign banks they should not
be looked upon as a homogeneous group. They indicate that banks from certain countries and with certain characteristics will be better equipped to operate in foreign countries. Characteristics like size, age and funding structures can influence foreign banks’

18
profitability. Furthermore, being from a home country that is closer or highly developed and/or entering a country with limited competition has some advantages.
These findings have implications for the shape of the world’s financial sector going
forward. The advantages of large foreign banks may mean a further consolidation of international banking systems. At the same time, the origin of banks crossing borders may change over time. With a number of emerging markets becoming more and more similar to high-income countries and realizing that being geographical and cultural close is a major asset in cross-border banking, it might well be that in the future banking groups from these countries will start to play an increasingly important role, especially in other developing countries.

19
Table 1. Review of Foreign Banking Performance Studies
Author(s) Year of
publication Countries in sample Years in sample Measure of performance Results
Barajas, Steiner, Salazar
2000 Colombia 1991-1998 Administrative Costs, Loan Quality Foreign banks outperform domestic banks
Berger, Clarke, Cull, Klapper, Udell
2005 Argentina 1993-1999 Profit Efficiency, Cost Efficiency, ROE, Cost to Asset Ratio, NPL
Domestic banks outperform foreign banks with respect to ROE and profit efficiency. No difference with respect to other performance measures
Berger, DeYoung, Genay, Udell
2000 France, Germany, Spain, United Kingdom, United States
1993-1998 (US), 1992-1997 (others)
Cost Efficiency, Profit Efficiency Domestic banks outperform or perform equally as foreigners 1
Berger, Hasan, Zhou
2009 China 1994-2003 Cost Efficiency, Profit Efficiency Foreign banks outperform domestic banks
Bonaccorsi di Patti and Hardy
2005 Pakistan 1981-1997 Cost Efficiency, Profit Efficiency Foreign banks outperform domestic banks
Bonin, Hasan, Wachtel
2005
11 transition countries: Czech Republic, Hungary, Poland, Slovak Republic, Bulgaria, Croatia, Romania, Slovenia, Estonia, Latvia, Lithuania
1996-2000 Cost Efficiency, Profit Efficiency, ROA
Foreign banks outperform domestic banks according to both efficiency measures, for ROA no difference
Chang, Hasan, Hunter
1998 USA 1984-1989 Cost Efficiency Domestic banks outperform foreign banks
Chantapong 2005 Thailand 1995-2000 Profit before Tax, ROA Foreign banks outperform domestic banks
20
Claessens, Demirguc-Kunt, Huizinga
2001 80 developing and developed countries
1988-1995 Profit before Tax over Assets2
Domestic banks outperform foreign banks in developed countries, opposite is true in developing economies
Correa 2008 179 developing and developed countries
1994-2004 ROA, ROE, Cost to Income Ratio
No difference for ROA & ROE, but domestic banks outperform foreign according to Cost to Income Ratio
Crystal, Dages, Goldberg
2001 Argentina, Chile, Colombia3 1995-2000 Moody's Bank Financial Ratings, Capital Adequacy, Asset Quality, Earnings, Liquidity
No difference
Detragiache and Gupta
2006 Malaysia 1996-2000 Profit over Assts, Overhead Costs
Foreign banks outperform domestic banks in profitability, but have higher overhead costs4
DeYoung and Nolle
1996 USA 1985-1990 Profit Efficiency Domestic banks outperform foreign banks
Goldberg, Dages, Kinney
2000 Argentina and Mexico 1994-1999 Loan Growth, Loan Sensitivity to GDP
Foreign banks outperform domestic banks
Grigorian and Manole
2006
17 transition countries: Armenia, Belarus, Bulgaria, Croatia, Czech Republic, Estonia, Hungary, Kazakhstan, Latvia, Lithuania, Moldova, Poland, Romania, Russia, Slovak Republic, Slovenia, Ukraine
1995-1998 Efficiency (revenue and service based)
Foreign banks outperform domestic banks

21
Hasan and Marton
2003 Hungary 1993-1997 Profit Inefficiency, Cost Inefficiency
Foreign banks outperform domestic banks
Havrylchyk 2006 Poland 1997-2001 Cost Efficiency, Allocative Efficiency, (Pure) Technical Efficiency, Scale Efficiency
Foreign banks outperform domestic banks in efficiency, but the difference is largely due to greenfields
Havrylchyk and Jurzyk
2005
10 transition countries: Bulgaria, Czech Republic, Estonia, Hungary, Latvia, Lithuania, Poland, Romania, Slovakia, Slovenia
1995-2003 ROA Foreign banks
eenfield) outperform estic banks
Jemric and Vujcic
2002 Croatia 1995-2000 Technical Efficiency, Intermediation Efficiency
Foreign banks outperform domestic banks
Kraft, Hofler and Payne
2006 Croatia 1994-2000 Cost Efficiency Foreign banks outperform domestic banks
Mahajan, Rangan, Zardkoohi
1996 USA 1987-1990 Corporate Efficiency, Operational Efficiency
Multinational banks, except at the smallest size level, outperform domestic banks
Majnoni, Shankar, Varhegyi
2003 Hungary 1994-2000 Cost Efficiency, Profit Efficiency Foreign banks outperform domestic banks
Matthews and Ismail
2006 WP Malaysia 1994-2000 Technical Efficiency, Productivity Foreign banks outperform domestic banks

22
Mian 2003 100 emerging economies 1992-1999 Profit before Tax over Assets5 No difference
Micco, Panizza, Yanez
2007 179 developing and developed countries
1995-2002 ROA6
Foreign banks outperform domestic banks in developing countries, but perform the same in industrialized countries
Mihaljek 2006
Czech Republic, Hungary, Turkey, Israel, Korea, India, Argentina, Colombia, Mexico, Venezuela
2004 Profit before Tax over Assets, Operating Costs
Foreign banks outperform domestic banks in profit, but have higher operating costs
Miller and Parkhe
2002
Australia, Belgium, Canada, Chile, Denmark, France, Germany, Italy, Netherlands, Portugal, Spain, Switzerland, United Kingdom, Argentina, Finland, India, Ireland, Japan, Sweden, United States7
1989-1996 Profit Efficiency Domestic banks outperform foreign banks
Miller and Richards
2002
Belgium, Denmark, France, Germany, Italy, Netherlands, Portugal, Spain, United Kingdom
1989-1996 Profit Efficiency Domestic banks outperform foreign banks
Nikiel and Opiela
2002 Poland 1997-2000 Cost Efficiency, Profit Efficiency
Foreign banks outperform domestic banks in cost efficiency; opposite is true for profit efficiency
Peek, Rosengren, Kasirye
1999 USA 1984-1997 ROA Domestic banks outperform foreign banks
Sturm and Williams
2004 Australia 1988-2001 Input Efficiency Foreign banks outperform domestic banks
23
1 One expection: US domestic banks are slightly less cost efficient than foreign banks, but results vary when dissagregated by home country of foreign bank. 2 Authors also examine differences in interest rate margins, taxes paid, overhead expenses and loan loss provisioning. 3 For analysis based on Moody's Bank Financial Ratings Brazil, Mexico, Peru, Venezuela also included. 4 Authors distinguish between Asia-oriented and non-Asia-oriented foreign banks. The profitability of the former is not different from that of domestic banks. 5 Authors also explore differences in assets, capital, income structure, sensitivity to macro shocks and risk ratings. 6 Also examine interest margins, overhead costs, employment. 7 Home countries of foreign banks: Argentina, Finland, India, Ireland, Japan, Sweden, United States
Vander Vennet 1996
Belgium, Denmark, France, Germany, Italy, Luxembourg, Nehterlands, Poland, Spain, United Kingdom
1988-1992 ROE, ROA, Cost Efficiency, Operational Efficiency
Foreign banks outperform domestic banks with respect to ROA and ROE; no difference in other measures
Vander Vennet 2002
Austria, Belgium, Denmark, Finland, France, Germany, Italy, Luxemburg, Netherlands, Norway, Portugal, Spain, Sweden, Switzerland, United Kingdom
1990-2001 ROA, Cost Efficiency, Profit Efficiency
No difference, except increase in profit efficiency of target banks
Weill 2003 Czech Republic, Poland 1997 Cost Efficiency Foreign banks outperform domestic banks
Yildirim and Philippatos
2007 12 transition countries 1993-2000 Cost Efficiency, Profit Efficiency
Foreign banks outperform domestic banks in cost efficiency; opposite is true for profit efficiency
24
Table 2. Country Coverage and Characteristics of Banking Sector
1999 2006 Country Number
of banks
Total assets (thousand
US$)
Ratio foreign banks to
total banks
Ratio foreign assets to
total assets
Number of
banks
Total assets Ratio foreign banks to
total banks
Ratio foreign assets to
total assets
Angola 6 355,579 0.50 0.00 11 7,227,363 0.55 0.51 Argentina 94 118,577,888 0.40 0.58 66 79,935,400 0.35 0.29 Armenia 10 131,979 0.40 0.35 10 937,972 0.60 0.52 Azerbaijan 22 379,626 0.18 0.00 20 3,641,726 0.15 0.04 Belarus 18 7,129,884 0.22 0.11 17 11,963,159 0.47 0.13 Bolivia 13 4,847,764 0.46 0.50 12 3,783,372 0.58 0.32 Bosnia & Herzegovina 26 847,633 0.23 0.28 27 8,753,051 0.56 0.93 Brazil 169 324,041,376 0.33 0.15 136 807,217,280 0.36 0.24 Bulgaria 25 1,539,386 0.44 0.60 25 21,330,820 0.68 0.77 Cameroon 8 1,338,541 0.38 0.66 9 3,573,703 0.56 0.73 Chile 28 64,370,800 0.54 0.20 26 114,616,544 0.42 0.31 China 48 425,009,088 0.15 0.00 68 4,183,970,560 0.10 0.00 Colombia 38 15,160,134 0.29 0.15 21 46,897,108 0.19 0.10 Costa Rica 25 859,202 0.36 0.10 16 11,344,553 0.50 0.14 Croatia 53 10,238,545 0.25 0.68 34 56,219,612 0.32 0.92 Czech Republic 31 45,115,196 0.45 0.58 21 147,019,488 0.52 0.78 Ecuador 36 1,305,500 0.19 0.01 22 11,153,300 0.23 0.04 Egypt 32 79,240,344 0.16 0.06 29 101,890,088 0.45 0.22 El Salvador 14 6,146,466 0.36 0.03 12 2,668,516 0.75 0.79 Ghana 14 924,117 0.50 0.59 15 3,434,458 0.60 0.64 Guatamala 34 3,925,982 0.21 0.09 25 8,715,088 0.24 0.04 Honduras 23 2,567,477 0.22 0.01 18 5,675,361 0.39 0.04 Hungary 31 23,782,900 0.81 0.93 25 107,399,400 0.84 0.95 India 70 109,916,192 0.09 0.06 65 822,792,704 0.11 0.06 Indonesia 96 95,940,776 0.27 0.04 67 130,600,080 0.42 0.12 Kazakhstan 22 1,533,655 0.36 0.07 22 66,570,956 0.41 0.06 Kenya 43 4,089,385 0.26 0.43 35 9,096,599 0.29 0.46 Latvia 21 1,266,426 0.29 0.69 21 28,936,032 0.43 0.60 Macedonia 14 914,747 0.21 0.02 16 3,535,409 0.44 0.57 Malaysia 42 126,841,000 0.33 0.14 34 291,326,688 0.41 0.15 Mexico 44 127,769,040 0.41 0.14 33 239,183,760 0.45 0.81 Moldova 14 73,795 0.36 0.48 14 1,611,698 0.43 0.24 Morocco 13 12,499,912 0.38 0.00 11 75,407,432 0.45 0.18 Pakistan 21 10,868,394 0.14 0.00 24 58,739,136 0.25 0.24 Paraguay 21 2,889,536 0.67 0.69 13 3,131,878 0.69 0.69 Philippines 38 5,793,662 0.18 0.00 30 85,399,536 0.17 0.01 Poland 49 14,335,412 0.63 0.55 42 162,652,944 0.71 0.85 Romania 28 13,492,174 0.46 0.37 25 55,020,840 0.84 0.92 Russia 226 16,412,585 0.12 0.19 203 297,644,544 0.18 0.24 Senegal 10 1,159,247 0.60 0.69 11 3,240,688 0.64 0.60 Serbia & Montenegro 33 10,955,451 0.09 0.02 41 16,620,306 0.63 0.75 South Africa 35 12,539,352 0.20 0.05 22 273,761,856 0.23 0.00 Tanzania 13 35,974 0.62 0.00 17 4,772,843 0.65 0.68 Thailand 16 114,330,784 0.19 0.06 16 215,523,648 0.25 0.04 Trinidad & Tobago 9 8,047,892 0.33 0.15 9 18,960,600 0.44 0.08 Tunisia 15 1,107,908 0.33 0.13 16 23,485,424 0.50 0.26 Turkey 59 74,375,096 0.15 0.03 35 378,389,632 0.37 0.12 Uganda 16 495,403 0.63 0.78 15 2,403,275 0.67 0.80 Ukraine 42 2,187,487 0.14 0.11 48 47,106,432 0.35 0.51 Uzbekistan 10 598,439 0.30 0.17 13 4,711,554 0.31 0.01
Venezuela 48 15,299,864 0.25 0.27 40 67,342,032 0.30 0.32
The table reports the countries included in our sample. It provides information about the size of the banking sector and the relative importance of foreign banks in terms of numbers and assets in 1999 and 2006. A foreign bank is defined to have at least 50 percent foreign ownership.

25
Table 3. Summary Statistics
Variable Mean Median Minimum Maximum SD
Bank-level
Profitability 1.65 1.54 -24.59 14.37 3.32 Ownership 0.30 0.00 0.00 1.00 0.46 Share 4.40 1.22 0.00 100.00 8.53 Loan 48.00 49.27 0.00 98.49 19.57 Leverage 16.33 11.53 0.01 100.00 14.83 Deposit 86.30 92.45 0.00 100.00 16.86 Public 0.09 0.00 0.00 1.00 0.29 Problembank 0.05 0.00 0.00 1.00 0.22
Home characteristics Gdpcap_home 26,441 29,134 690 49,451 10,196 Competition_home 0.63 0.66 0.41 0.86 0.14
Host characteristics Gdpcap_host 7,759 7,899 639 22,004 4,362 Competition_host 0.70 0.73 0.46 0.92 0.10 Financial development_host 45.22 41.74 2.23 162.19 25.62
Distance Same region 0.18 0.00 0.00 1.00 0.38 Common language 0.19 0.00 0.00 1.00 0.39
Institutional familiar 0.44 0.00 0.00 1.00 0.50
The table provides the summary statistics of the variable employed in the empirical specifications. The summary statistics for the bank level variables are based on the full sample (7,923 observations). The summary statistics of the home and host characteristics and the distance variables are based on only the foreign banks in the sample (2,540 observations for all variables accept competition_home(2281) and competition_host(1685)). A definition of the variables is provided in Appendix Table 1

26
Table 4. Impact of Foreign Ownership on Profitability - Individual Country Regressions
Significant Insignificant Foreign better than domestic
Cameroon Kazakhstan Trinidad &
Tobago Angola
Czech Republic Latvia
China Malaysia Belarus Ecuador Morocco
Ghana Poland Turkey Bosnia-Herzegovina
Egypt Romania
Honduras Serbia & Montenegro
Venezuela Guatamala Russia
India Costa Rica Kenya Tunisia
Indonesia Thailand
Domestic better than foreign
Argentina Mexico Azerbaijan Hungary
South Africa
Armenia Moldova Bolivia Macedonia Tanzania
Brazil Philippines Bulgaria Pakistan Uganda
Colombia Chile Paraguay Ukraine
Croatia El Salvador Senegal Uzbekistan
The table provides a summary of the impact of foreign ownership on profitability for each country in the sample based on regression model (1). For countries located in the upper left quadrant the ownership dummy is positive and significant. For countries in the upper right quadrant it is positive but insignificant. For countries in the lower quadrant the ownership dummy is negative; significant for the countries in the lower left quadrant and insignificant for countries in the lower right quadrant.
27
Table 5. Impact of foreign ownership on profitability - Home and host characteristics
Home characteristics Host characteristics Combined
Baseline Gdpcap High vs
developing Competition Gdpcap Low vs middle Competition
Financial development
Home and host
Own 0.168 -0.276 0.407** 0.971 0.495 0.039 1.901* -0.191 2.157* [0.931] [0.812] [2.038] [1.534] [1.605] [0.197] [1.864] [0.628] [1.939]
Own*gdpcap_home 0.000* [1.799]
Own*developing -1.008*** -0.930*** [-3.32] [-3.260]
Own*comp_home -1.206 [1.241]
Own*gdpcap_host 0.000 [1.322]
Own*low 0.643 [1.322]
Own*comp_host -2.932* -3.016* [-1.830] [-1.750]
Own*findev_host 0.536 [1.300]
Share 0.032** 0.031** 0.030** 0.031** 0.032** 0.032** 0.035*** 0.038*** 0.033*** [2.610] [2.526] [2.460] [2.627] [2.616] [2.625] [3.392] [4.454] [3.423]
Loan 0.007 0.007 0.006 0.008* 0.007 0.007 0.009* 0.009** 0.009* [1.564] [1.579] [1.470] [1.961] [1.669] [1.577] [2.039] [2.289] [2.002]
Deposit 0.008 0.005 0.009 0.005 0.008 0.008 0.009 0.008 0.010 [1.397] [1.166] [1.599] [1.132] [1.467] [1.363] [1.502] [1.499] [1.625]
Leverage 0.026*** 0.031*** 0.030*** 0.029*** 0.026*** 0.026*** 0.049*** 0.027*** 0.051*** [3.030] [3.388] [3.545] [3.049] [3.072] [3.119] [4.649] [3.192] [4.891]
Public -0.365* -0.371* -0.311* -0.345* -0.339* -0.378* -0.422* -0.328 -0.408* [1.914] [1.963] [1.682] [1.784] [1.824] [1.909] [2.054] [1.667] [1.962]
Problembank -0.598** -0.583** -0.612** -0.672** -0.604** -0.620** -1.013*** -0.555* -1.018*** [2.195] [2.107] [2.182] [2.388] [2.214] [2.287] [4.022] [1.973] [3.993]
Observations 7,920 7,920 7,920 7,608 7,920 7,920 5,478 7,655 5,478
R-squared 0.21 0.22 0.22 0.23 0.21 0.21 0.16 0.21 0.16 The table shows how different home and host characteristics impact the performance of foreign banks in developing countries. The dependent variable is profit before taxes divided by assets. Own is a dummy which is one if the bank is foreign owned. Gdpcap_home and gdpcap_host reflect gdp per capita in home and host country of the foreign bank respectively. Developing is a dummy which is one if the parent of the foreign bank is located in a developing country. Comp_home and comp_host are the Panzar Rosse (1987) H-statistics of the home and host country of the foreign bank respectively as calculated by Claessens and Laeven (2004). Low is a dummy which is one if the host country is a low-income developing country. Findev_host equals M2 as a percentage of GDP in the host country. Share is the ratio of the bank's assets to total assets of the country's banking sector. Loan captures the ratio of loans to assets of the bank. Deposits equals deposits as percentage of the bank's liabilities and leverage equals equity as percentage of assets. Public is a dummy which is one if a bank is majority owned by the government. Problembank is a dummy which is one if the foreign bank exited the market within four years after entering. The sample period is 1999-2006. All regressions are estimated using weighted OLS where the weights are equal to the inverse of number of banks active in the country in a given year. Regressions include a constant and country-year fixed effects. The robust t-statistics allowing for clustering at the country level appear in brackets and ***, ** and * correspond to one, five and ten percent level of significance respectively.

28
The table shows how different measures of distance impact the performance of foreign banks in developing countries. The dependent variable is profit before taxes divided by assets. Own is a dummy which is one if the bank is foreign owned. Samereg is a dummy which is one if home and host country are located in the same region. Comlang is dummy which is one if home and host country share the same language. Instfam is a dummy which is one if home and host country are institutionally similar. Developing is a dummy which is one of the parent if the foreign bank is located in a developing country. Share is the ratio of the bank's assets to total assets of the country's banking sector. Loan captures the ratio of loans to assets of the bank. Deposits equals deposits as percentage of the bank's liabilities and leverage equals equity as percentage of assets. Public is a dummy which is one if a bank is majority owned by the government. Problembank is a dummy which is one if the foreign bank exited the market within four years after entering. The sample period is 1999-2006. All regressions are estimated using weighted OLS where the weights are equal to the inverse of number of banks active in the country in a given year. Regressions include a constant and country-year fixed effects. The robust t-statistics allowing for clustering at the country level appear in brackets and ***, ** and * correspond to one, five and ten percent level of significance respectively.
Table 6. Impact of foreign ownership on profitability – Distance
Same region Common language Institutional familiar
Own 0.392* 0.239 0.441* [1.945] [1.176] [1.857]
Own*samereg 1.769* [1.781]
Own*comlang 0.812*** [3.062]
Own*instfam -0.090 [0.339]
Own*developing -2.582** -1.253*** -0.897*** [2.535] [4.119] [2.703]
Share 0.029** 0.027** 0.029** [2.420] [2.316] [2.429]
Loan 0.006 0.006 0.007 [1.469] [1.342] [1.508]
Deposit 0.008 0.005 0.006 [1.497] [1.133] [1.210]
Leverage 0.029*** 0.032*** 0.031*** [3.453] [3.707] [3.599]
Public -0.302 -0.321* -0.326* [1.641] [1.860] [1.791]
Problembank -0.620** -0.561** -0.593** [2.212] [2.018] [2.117]
Observations 7,920 7,900 7,900
R-squared 0.22 0.23 0.23

29
Size power structure Asset structure AgeLarge domestic bank 0.286
[1.535]Small foreign bank -0.132
[0.434]Large foreign bank 0.812***
[3.337]Domestic bank with monop. power 0.204
[1.202]Foreign bank no monop. power -0.208
[0.634]Foreign bank with monop. power 0.777***
[3.019]Domestic bank many deposits 0.178
[1.005]Foreign bank limited deposits 0.223
[0.796]Foreign bank many deposits 0.410*
[1.793]Domestic bank many loans 0.002
[0.012]Foreign bank limited loans 0.262
[0.940]Foreign bank many loans 0.211
[0.930]Old domestic bank -0.295
[0.759]New foreign bank -0.063
[0.298]Old foreign bank 0.386*
[1.826]Own*samereg 0.599 1.005 0.940 0.951 1.022
[0.820] [1.503] [1.451] [1.474] [1.603]Own*comlang -1.391** 0.512** 0.763*** 0.767*** 0.725***
[2.040] [2.039] [2.890] [2.860] [2.829]Own*developing 0.591** -1.905*** -2.087*** -2.088*** -2.132***
[2.097] [2.943] [3.372] [3.398] [3.543]Share 0.018 0.021* 0.027** 0.027** 0.026**
[1.466] [1.931] [2.310] [2.328] [2.332]Loan 0.006 0.006 0.006 0.006 0.007
[1.423] [1.272] [1.348] [1.150] [1.496]Deposit 0.006 0.005 0.002 0.005 0.005
[1.297] [1.164] [0.315] [1.112] [1.023]Leverage 0.036*** 0.038*** 0.031*** 0.031*** 0.032***
[4.029] [4.303] [3.663] [3.685] [3.644]Public -0.266 -0.317* -0.320* -0.312* -0.334*
[1.554] [1.891] [1.868] [1.791] [1.886]Problembank -0.533* -0.559** -0.564** -0.561* -0.580**
[1.885] [2.046] [2.037] [1.995] [2.105]Observations 7900 7,900 7,900 7,900 7,900R-squared 0.234 0.24 0.23 0.23 0.23
Table 7. Impact of foreign ownership on profitability - Bank characteristics
The table shows how different bank characteristics impact the performance of foreign banks in developing countries. The dependent variable is profit before taxes divided by assets. Own is a dummy which is one if the bank is foreign owned. Samereg is a dummy which is one if home and host country are located in the same region. Comlang is dummy which is one if home and host country share the same language. Developing is a dummy which is one of the parent if the foreign bank is located in a developing country. Share is the ratio of the bank's assets to total assets of the country's banking sector. Loan captures the ratio of loans to assets of the bank. Deposits equals deposits as percentage of the bank's liabilities and leverage equals equity as percentage of assets. Public is a dummy which is one if a bank is majority owned by the government. Problembank is a dummy which is one if the foreign bank exited the market within four years after entering. The sample period is 1999-2006. All regressions are estimated using weighted OLS where the weights are equal to the inverse of number of banks active in the country in a given year. Regressions include a constant and country-year fixed effects. The robust t-statistics allowing for clustering at the country level appear in brackets and ***, ** and * correspond to one, five and ten percent level of significance respectively.
30
Appendix Table 1. Variable Definitions and Sources Variable Definition Source Banklevel Profitabality Profit before tax divided by total assets Bankscope
Own Dummy which is one if 50 percent or more of the shares of the bank are owned by foreigners, zero otherwise.
Claessens, Van Horen, Gurgarlan and Mercado (2008)
Share Size of the bank. Assets of the bank divided by total assets
in the banking system of the country. Bankscope
Loan Total loans divided by total assets of the bank. Bankscope
Leverage Total equity divided by total assets of the bank. Bankscope
Deposit Total deposits and short-term funding divided by total
liabilities of the bank. Bankscope
Public Dummy which is one if the bank is for 50 percent or more
owned by the government, zero otherwise. Micco, Panizza and Yanez (2007)
Problembank Dummy which is one if the bank exited the market within
4 years after entry, zero otherwise. Claessens, Van Horen, Gurganlar and Mercado (2008)
Home and host characteristics
Gdpcap GDP per capita in current international $ in host or
home country. World Development Indicators
Comp Panzar Rosse (1987) H-statistic as calculated by
Claessens and Laeven (2004). Claessens and Laeven (2004)
Findev M2 divided by GDP in the host country International Financial Statistics Distance
Samereg Dummy which is one if home and host country share
the same region, zero otherwise. World Bank
Comlang Dummy which is one if home and host country share same language, zero otherwise.
CIA World Factbook (2005)
Instfam Dummy capturing whether home and host country are institutional distant or not. First the absolute difference between the quality of institutions of source and host countries, based on the simple average of the absolute difference of each of the six governance indicators, is calculated. When the difference is below the median difference the dummy has a value 1 if it is above it has a value zero.
Kaufmann, Kraay and Mastruzzi (2008).
Businessfam Same as instfam but difference in quality of five doing business indicators (cost of registering property, legal rights index, credit information, investor protection index, cost of enforcing contracts.
Doing Business indicators

31
REFERENCES Aghion, Philippe and Peter Howitt, 1998, Endogenous Growth Theory, MIT Press: Cambridge
and London. Barajas, Adolfo, Roberto Steiner, and Natalia Salazar, 2000, “The Impact of Liberalization and
Foreign Investment in Colombia’s Financial Sector,” Journal of Development Economics, vol. 63(1), pp. 157-96.
Berger, Allen N., 2007, “International Comparisons of Banking Efficiency,” Financial Markets,
Institutions and Instruments, Vol. 16, pp. 119-44. Berger, Allen N., George R. G. Clarke, Robert Cull, Leora Klapper, and Gregory F. Udell, 2005,
“Corporate Governance and Bank Performance: A Joint Analysis of the Static, Selection, and Dynamic Effects of Domestic, Foreign, and State Ownership,” Journal of Banking and Finance, Vol. 29, pp. 2179–221.
Berger, Allen N. and Robert DeYoung, 2001, “The Effects of Geographic Expansion on Bank
Efficiency,” Journal of Financial Services Research, Vol. 19, pp. 163-84. Berger, Allen N. and Robert DeYoung, 2006, “Technological Progress and the Geographic
Expansion of the Banking Industry,” Journal of Money, Credit and Banking, Vol. 38, pp. 1483-513.
Berger, Allen N., Robert DeYoung, Hesna Genay, and Gregory F. Udell, 2000, “Globalization of
Financial Institutions: Evidence from Cross-Border Banking Performance,” Brookings-Wharton Papers on Financial Services, Vol. 3, pp. 23-158.
Berger, Allen N., Hasan Iftekhar and Mingming Zhou, 2009, “Bank Ownership and Efficiency in
China: What Will Happen in the World’s Largest Nation?” Journal of Banking and Finance, Vol. 33, pp. 113-30.
Berger, Allen N., and David B. Humphrey 1997. “Efficiency of Financial Institutions:
International Survey and Review,” European Journal of Operational Research 98 (April 1997): pp. 175-212.
Berger, Allen N., Leora F. Klapper, and Gregory F. Udell, 2001, “The Ability of Banks to Lend
to Informationally Opaque Small Businesses,” Journal of Banking and Finance, Vol. 25, pp. 2127-167.
Berger, Allen N. and Loretta J. Mester, 1997, "Inside the black box: What explains differences
with efficiency of financial institutions?," Journal of Banking and Finance 21 (1997), pp. 895–947.
Bonaccorsi di Patti, Emilia and Daniel C. Hardy, 2005, “Bank Reform and Bank Efficiency in
Pakistan,” Journal of Banking and Finance, 29, pp. 2381-406.

32
Bonin, John P., Hasan Iftekhar and Paul Wachtel, 2005, “Bank Performance, Efficiency and Ownership in Transition Countries,” Journal of Banking and Finance, Vol. 29, pp. 31-53.
Boot, Arnoud W.A. and Anjan V. Thakor, 1997, “Financial System Architecture,” Review of
Financial Studies, Vol. 10, pp. 693-733. Boyd, John H. and Edward C. Prescott, 1986, “Financial Intermediary-Coalitions,” Journal of
Economic Theory, Vol. 38, pp. 211-32. Buch, Claudia M., 2003, “Information or Regulation: What Drives the International Activities of
Commercial Banks?” Journal of Money, Credit, and Banking, Vol. 35, pp. 851-69. Buch, Claudia M. and Gayle DeLong, 2004, “Cross-border Bank Mergers: What Lures the Rare
Animal?” Journal of Banking and Finance, Vol. 28, pp. 2077-102. Chang, Edward C., Iftekhar Hasan, and William C. Hunter, 1998, “Efficiency of Multinational
Banks: An Empirical Investigation,” Applied Financial Economics, Vol. 8, pp. 689-96. Chantapong, Saovanee, 2005, “Comparative Study of Domestic and Foreign Bank Performance
in Thailand: The Regression Analysis,” Economic Change and Restructuring, V), pp. 63-83.
Claessens, Stijn, Aslı Demirgüç-Kunt, and Harry Huizinga, 2001, “How Does Foreign Entry
Affect the Domestic Banking Market?” Journal of Banking and Finance, Vol. 25, pp. 891–911.
Claessens, Stijn and Luc Laeven, 2004, “What Drives Bank Competition? Some International
Evidence,” Journal of Money, Credit and Banking, Vol. 36, pp. 563-83. Claessens, Stijn and Neeltje van Horen, 2009, “Learning by Doing in Foreign Banking,” Mimeo,
DNB and IMF Claessens, Stijn and Neeltje van Horen, 2008, “Location Decisions of Foreign Banks and
Institutional Competitive Advantage,” DNB Working Paper No. 172. Claessens, Stijn, Neeltje Van Horen, Tugba Gurcanlar, and Joaquin Mercado, 2008, “Foreign
Bank Presence in Developing Countries. 1995-2006: Data and Trends,” mimeo, The World Bank, Washington, D.C.
Clarke, George, Robert Cull, Maria Soledad Martinez Peria, and Susana M. Sánchez, 2003,
“Foreign Bank Entry: Experience, Implications for Developing Countries, and Agenda for Further Research,” World Bank Research Observer, Vol. 18, pp. 25-40.
Correa, Ricardo, 2008, “Cross-border Bank Acquisitions: Is there a Performance Effect?”
International Finance Discussion Papers No. 922, Board of Governors of the Federal Reserve System.

33
Coval, Joshua D. and Tobias J. Moskowitz, 2001, “The Geography of Investment: Informed Trading and Asset Prices,” Journal of Political Economy, Vol. 109, pp. 811-41.
Crystal, Jennifer S., B. Gerard Dages, and Linda S. Goldberg, 2001, “Does Foreign Ownership
Contribute to Sounder Banks? The Latin American Experience,” in Robert E. Litan, Paul Masson and Michael Pomerleano (eds.): Open Doors: Foreign Participation in Emerging Financial Systems, Brookings Press, pp. 217-66.
Dages, B. Gerard, Linda Goldberg, and Daniel Kinney, 2000, “Foreign and Domestic Bank
Participation in Emerging Markets: Lessons from Mexico and Argentina,” Federal Reserve Bank of New York Economic Policy Review, Vol. 6(3), pp. 17-36.
DeGryse, Hans and Steven Ongena, 2005, “Distance, Lending Relationships, and Competition,”
Journal of Finance, Vol. 60, pp. 231-65. Detragiache, Enrica and Poonam Gupta, 2006, “Foreign Banks in Emerging Market Crises:
Evidence from Malaysia,” Journal of Financial Stability, Vol. 2(3), pp. 217-42. DeYoung, Robert and Daniel E. Nolle, 1996, “Foreign-Owned Banks in the United States:
Earning Market Share or Buying It?” Journal of Money, Credit, and Banking, Vol. 28, pp. 622–36.
Diamond, Douglas W., 1984, “Financial Intermediation and Delegated Monitoring,” Review of
Economic Studies, Vol. 51, pp. 393-414. Galindo, Arturo, Alejandro Micco and César Manuel Serra, 2003. “Better the Devil that You
Know: Evidence on Entry Costs Faced by Foreign Banks,” RES Working Papers 4313, Inter-American Development Bank, Research Department, Washington, D.C.
Grigorian, David A. and Vlad Manole, 2006, “Determinants of Commercial Bank Performance
in Transition: An Application of Data Envelopment Analysis,” Comparative Economic Studies, Vol. 48, pp. 497-522.
Grosse, Robert and Lawrence G. Goldberg, 1991, “Foreign Bank Activity in the United States:
An Analysis by Country of Origin,” Journal of Banking and Finance, Vol. 22, pp. 1093-112.
Hasan, Iftekhar and Katherin Marton, 2003, “Development and Efficiency of the Banking Sector
in a Transitional Economy: Hungarian Experience,” Journal of Banking and Finance, Vol. 27(12), pp. 2249-71.
Hauswald, Robert and Robert Marquez, 2006, “Competition and Strategic Information
Acquisition in Credit Markets,” Review of Financial Studies, Vol. 19(3), pp. 967-1000.

34
Havrylchyk, Olena and Emilia Jurzyk, 2005, “Profitability of Foreign and Domestic Banks in Central and Eastern Europe: does the Mode of Entry Matter?,” CEPPI Working Paper No. 2005-21.
Havrylchyk, Olena, 2006, “Efficiency of the Polish Banking Industry: Foreign versus Domestic
Banks,” Journal of Banking & Finance, Vol. 30, pp. 1975–996 Jemric, Igor and Boris Vujcic, 2002, “Efficiency of Banks in Croatia: A DEA Approach,”
Comparative Economic Studies, 2002, Vol. 44(2-3), pp. 169-93. Kaufmann, Daniel, Aart Kraay, and Massimo Mastruzzi, 2008, “Governance Matters VII:
Aggregate and Individual Governance Indicators, 1996-2007,” World Bank Policy Research Working Paper No. 4654.
Kraft, Evan, Richard Hofler and James Payne, 2006, “Privatization, Foreign Bank Entry and
Bank Efficiency in Croatia: a Fourier-flexible Function Stochastic Cost Frontier Analysis,” Applied Economics, Vol. 38, pp. 2075–088.
Laeven, Luc and Ross Levine, 2008, “Complex Ownership Structures and Corporate
Valuations,” Review of Financial Studies, Vol. 21(2), pp. 579–604. Laeven, Luc and Fabian Valencia, 2008, “Systemic Banking Crises: A New Database,” IMF
Working Paper No. 08/224. Mahajan, Arvind, Nanda Rangan, and Asghar Zardkoohi, 1996, “Cost Structures in
Multinational and Domestic Banking,” Journal of Banking and Finance, Vol. 20, pp. 238-306.
Majnoni, Giovanni, Rashmi Shankar, and Eva Varhegyi, 2003, “The Dynamics of Foreign Bank
Ownership – Evidence from Hungary,” World Bank Policy Research Working Paper No. 3114.
Matthews, Kent and Mahadzir Ismail, 2006, “Efficiency and Productivity Growth of Domestic
and Foreign Commercial Banks in Malaysia,” Cardiff Economics Working Papers No. E2006/2.
Mian, Atif, 2003, “Foreign, Private Domestic and Government Banks: New Evidence from
Emerging Markets,” mimeo, University of Chicago. Mian, Atif, 2006, “Distance Constraints: The Limits of Foreign Lending in Poor Countries,”
Journal of Finance, Vol. 61, pp. 1465–505. Micco, Alejandro, Ugo Panizza, and Monica Yanez, 2007, “Bank Ownership and Performance:
Does Politics Matter?” Journal of Banking and Finance, Vol. 31, pp. 219-41.

35
Mihaljek, Dubravko, 2006, “Privatisation, Consolidation, and the Increased Role of Foreign Banks,” in “The Banking System in Emerging Economies: How Much Progress Has Been Made?” BIS Papers, no. 28, pp. 41-66.
Miller, Stewart R. and Arvind Parkhe, 2002, “Is There a Liability of Foreignness in Global
Banking? An Empirical Test of U.S. Banks’ X-Efficiency,” Strategic Management Journal, Vol. 23, pp. 55-75.
Miller, Stewart R. and Malika Richards, 2002, “Liability of Foreignness and Membership in a
Regional Economic Group: Analysis of the European Union,” Journal of International Management, Vol. 8, pp. 323–37.
Nikiel, Ewa M. and Timothy P. Opiela, 2002, “Customer Type and Bank Efficiency in Poland
Implication for Emerging Market Banking,” Contemporary Economic Policy, Vol. 20, pp. 255-71.
Panzar, John C. and James N. Rosse, 1987, “Testing for Monopoly’ Equilibrium,” Journal of
Industrial Economics, Vol. 35, pp. 443-56. Peek, Joe, Eric S. Rosengren and Faith Kasirye, 1999, “The Poor Performance of Foreign Bank
Subsidiaries: Were the Problems Acquired or Created?” Journal of Banking and Finance, Vol. 23, pp. 579-604.
Stein, Jeremy, 2002, “Information Production and Capital Allocation: Decentralized versus
Hierarchical Firms,” Journal of Finance, Vol. 57, pp. 1891-921. Sturm, Jan-Egbert and Barry Williams, 2004, “Foreign Bank Entry, Deregulation and Bank
Efficiency: Lessons from the Australian Experience,” Journal of Banking and Finance, Vol. 28, pp. 1775–799.
Vander Vennet, Rudi, 1996, “The Effect of Mergers and Acquisitions on the Efficiency and
Profitability of EC Credit Institutions,” Journal of Banking and Finance, Vol. 20, pp. 1531–558.
Vander Vennet, Rudi, 2002, “Cross-border Mergers in European Banking and Bank Efficiency,”
Foreign Direct Investment in the Real and Financial Sector of Industrial Countries, pp. 295-315, Heidelberg and New York: Springer.
Weill, Laurent, 2003, “Banking Efficiency in Transition Economies: the Role of Foreign
Ownership,” Economics of Transition, Vol. 11(3), pp. 569-92. Yildirim, H. Semih and George C. Philippatos, 2007, “Efficiency of Banks: Recent Evidence
from the Transition Economies of Europe, 1993-2000,” European Journal of Finance, Vol. 31, pp.123-43.


![Contact Situation and Foreigner Talk –--Japanese language · Contact Situation and Foreigner Talk –--Japanese language [Abstract] This study explores the nature of foreigner talk](https://static.documents.pub/doc/80x56/5bdb828f09d3f263278c0075/contact-situation-and-foreigner-talk-japanese-language-contact-situation.jpg)


