BEIS PUBLIC ATTITUDES TRACKER September 2019 (Wave 31) Questions on Renewable energy, Shale Gas, Radioactive Waste, Small Modular Reactors, Decommissioning, Clean Growth, Insulation, Energy Performance Certificates, Energy Standards for Rental Properties and Workers’ Rights Published November 2019
Transcript
BEIS PUBLIC ATTITUDES TRACKER
September 2019 (Wave 31)
Questions on Renewable energy, Shale Gas, Radioactive Waste, Small Modular Reactors, Decommissioning, Clean Growth, Insulation, Energy Performance Certificates, Energy Standards for Rental Properties and Workers’ Rights
This publication is licensed under the terms of the Open Government Licence v3.0 except where otherwise stated. To view this licence, visit nationalarchives.gov.uk/doc/open-government-licence/version/3 or write to the Information Policy Team, The National Archives, Kew, London TW9 4DU, or email: [email protected].
Where we have identified any third-party copyright information you will need to obtain permission from the copyright holders concerned.
Any enquiries regarding this publication should be sent to us at: [email protected]
Fieldwork dates and sample sizes ___________________________________________ 32
4
Glossary
• Base: The number of people answering a survey question.
• Cognitive testing: An in-depth interviewing method to determine the reliability and validity of survey questions.
• Clean Growth: Growing national income while cutting greenhouse gas emissions.
• Decommissioning: The process of removing or withdrawing oil fields from service when it has reached the end of its life. This includes removal of the physical infrastructure that has been used to extract the oil and gas.
• Energy infrastructure: A term used to capture a range of different energy sources that are covered by the survey and the interconnections between them. This includes a range of renewable sources (on-shore and off-shore wind, solar, wave and tidal, and biomass), nuclear, shale gas, and carbon capture and storage as well as the pipeline and other interconnectors between them.
• Energy Performance Certificates: A certificate for a property that provides an energy rating from A (most efficient) to G (least efficient) and is valid for 10 years.
• Fieldwork: The period where face-to-face interviews are conducted.
• Geological disposal facilities: Deep underground facilities for the permanent disposal of highly radioactive waste.
• Omnibus survey: A method of quantitative survey research where data on a wide variety of subjects is collected during the same interview.
• Quotas: A target number of interviews for a certain characteristic during survey fieldwork (e.g. age).
• Random location quota sampling: A form of quota sampling that combines elements of random sampling and quota sampling. Once a random sample is drawn, interviewers are tasked with interviewing a range of sub-groups across different timing patterns based on a pre-agreed number of respondents.
• Radioactive waste: Items that have no further use and are a source of harmful radiation.
• Representativeness: Similarity of the sample profile to benchmark population statistics, such as the Office for National Statistics mid-year population estimates.
• Sample size: The number of people included in the sample (a subset of the population).
• Shale gas and fracking: Shale gas is natural gas found in shale, a non-porous rock which does not allow the gas to escape. Hydraulic fracturing or “fracking” is a process of pumping water at high pressure into shale to create narrow fractures which allow the gas to be released and captured. The gas can then be used for electricity and heating.
• Social grade: Social grade is a classification system based on occupation. It contains the following categories:
5
o A: Higher managerial, administrative and professional
o B: Intermediate managerial, administrative and professional
o C1: Supervisory, clerical and junior managerial, administrative and professional
o C2: Skilled manual workers
o D: Semi-skilled and unskilled manual workers
o E: State pensioners, casual and lowest grade workers, unemployed with state benefits only
• Statistical significance: A statistical test to determine whether relationships observed between two survey variables are likely to exist in the population from which the sample is drawn. We only report on findings that are statistically significant at the 95% level.
• Survey outputs: The key deliverables from the survey. This includes:
o A key finding report, presenting summary headline findings from September 2019.
o Summary tables (Excel), showing trends across all waves of the tracker.
o An Excel dataset containing questionnaire variables, demographic variables and derived variables for further analysis. An SPSS version of the dataset is available upon request.
o Excel label data (CSV), containing labels for all variables.
o Excel numeric data (CSV), containing numeric values for all variables.
o Cross tabulation tables (PDF and Excel) for the current wave, including demographic and key question sub-group comparisons for all questions.
• Weighting: An adjustment made to the data to ensure that survey results are representative of the target population (in this case, all UK adults).
• Workers’ rights: The legal employment rights that employees have when working in a workplace.
6
Executive summary
The key findings for the September 2019 wave of the tracker are presented below.
Renewable energy
• Support for renewable energy increased slightly from 82% in June 2019 to 84% in September 2019. Support has fluctuated between 74% and 85% since this question was first asked in March 2012.
• Opposition to renewable energy reached a low of 2% in September 2019.
• Most of the public continued to support each of the renewable energy sources included in the tracker in September 2019: solar (85%); on-shore wind (78%); off-shore wind (81%); wave and tidal (80%); and biomass (70%), which reached its highest point since the tracker began.
Shale Gas
• In September 2019, awareness of fracking remained stable at 78%. Levels of awareness of fracking have fluctuated between 70% and 80% since December 2013.
• The proportion of people opposed to fracking reached a high of 44% in September 2019, this has gradually increased from 21% over the course of the tracker. Support for fracking reached a low of 11%, from its base level of 27% in December 2013. The proportion that neither support nor oppose fracking decreased from 47% in June 2019 to 43% in September 2019.
• The most common reason for opposing fracking was the loss and destruction of natural environment (57%), followed by the risk of earthquakes (48%) which is at its highest point across the tracker.
Radioactive Waste
• In September 2019, one in ten people (10%) said they knew a lot or a fair amount about how the UK manages radioactive waste. This was the lowest level of awareness since the question was first asked in July 2013 (19%).
• Awareness of the UK’s plans to dispose of radioactive waste in Geological Disposal Facilities (GDF) also fell to its lowest level in September 2019 with 18% saying they knew a lot or a little about these plans.
Small Modular Reactors
• In September 2019, 18% of people had heard of small modular reactors. This was a slight increase from 16% when this question was first asked in September 2018.
Decommissioning
• Less than half (45%) of respondents said they had some awareness of decommissioning offshore oil and gas infrastructure, with 28% saying they knew a lot, a fair amount or a little. These results are similar to September 2018.
7
Clean Growth
• In September 2019, eight in ten people (79%) had not heard of the concept of “clean growth”, similar to June 2019 (78%).
Insulation
• Double glazing and loft or top-up insulation are the most commonly installed insulation measures (74% and 62%, respectively). The proportion of respondents saying they had underfloor insulation increased from 9% in June 2012 to 17% in September 2019.
Energy Performance Certificates
• Six in ten people (58%) were aware of Energy Performance Certificates (EPC) in September 2019. Levels of awareness have shown little change since the question was first asked in September 2015.
• In September 2019, 6% of people said they knew their exact EPC rating, the same level observed in September 2018.
• The proportion of people who said they had seen the section on the EPC which recommended how they could improve the energy of their home remained at the same level as September 2018 (17%).
• Of those who spotted the energy efficiency recommendations on their EPC, 12% said they had made changes to their home directly because of the guidance included in their Energy Performance Certificate (EPC). This equates to 2% of all people.
• Around half (48%) of those who made changes due to the guidance in their EPC said the EPC gave them all the information they needed to go ahead with changes.
Energy Standards for Rental Properties
• A quarter (25%) of people said they were aware of minimum energy standards for rental properties, a similar level to that observed in September 2018 (26%).
Workers’ Rights
• In September 2019, seven in ten people employed or had been employed in the last two years (71%) said they knew either a lot or a fair amount about their employment rights at work, the same level as that observed in September 2018.
• Just under two in ten (17%) of those that were employed or had been employed in the last two years had experienced at least one problem at work in the last two years, a similar level to that observed in September 2018 (19%).
• The most common problems experienced were taking time off to look after a dependent child or relative in an emergency (4%) and taking rest breaks at work (4%).
8
Introduction
The Public Attitudes Tracker (PAT) survey covers public attitudes towards Department for Business, Energy and Industrial Strategy (BEIS) policies such as energy, climate change and workers’ rights. The survey began in March 2012 and runs four times a year. Some questions on issues where we think attitudes might shift quickly or be affected by seasonal changes are repeated quarterly; other questions are asked annually. The tracker is regularly reviewed to ensure that the dataset continues to offer valuable insight.
This report presents summary headline findings from September 2019 (Wave 31).
Data for wave 31 were collected between 11 September and 22 September using face-to-face in-home interviews with a representative sample of 4,201 adults (aged 16 and over) in the UK. Interviews were carried out using the Kantar UK Omnibus, which uses a random location quota sampling method.
This report makes references to other outputs that are published alongside this report. These are described below:
• Table: This refers to the PDF crosstabulations for the current wave. This includes demographic and key question sub-group comparisons for all questions.
• Excel Summary tables: This refers to the Excel Summary tables showing trends across all waves of the tracker.
All the questions included at wave 31 had been asked in at least one previous wave. Full details of the methodology are provided in the technical note.1
The wave 31 questionnaire covered the following topics:
• Renewable energy
• Shale Gas
• Radioactive Waste
• Small Modular Reactors
• Decommissioning
• Clean Growth
• Insulation
• Energy Performance Certificates
• Energy Standards for Rental Properties
• Workers’ Rights
1 Available at: https://www.gov.uk/government/publications/beis-public-attitudes-tracker-technical-note
9
Headline findings
Energy infrastructure
Renewables
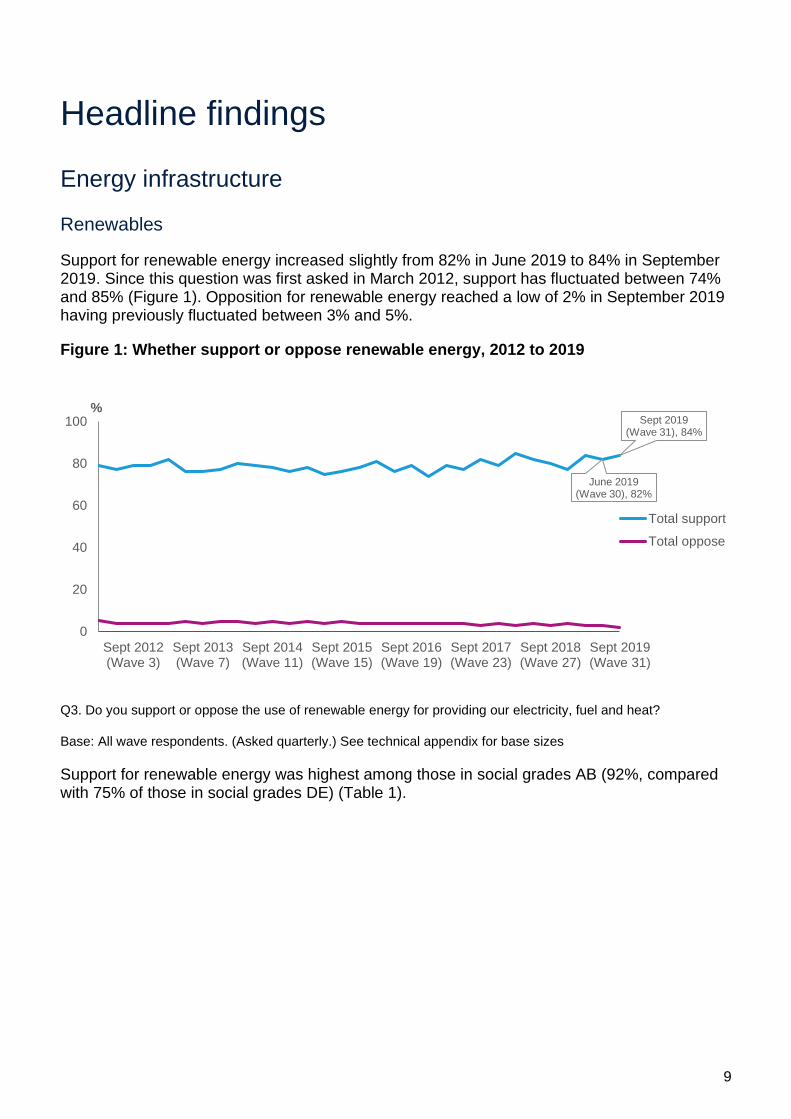
Support for renewable energy increased slightly from 82% in June 2019 to 84% in September 2019. Since this question was first asked in March 2012, support has fluctuated between 74% and 85% (Figure 1). Opposition for renewable energy reached a low of 2% in September 2019 having previously fluctuated between 3% and 5%.
Figure 1: Whether support or oppose renewable energy, 2012 to 2019
Q3. Do you support or oppose the use of renewable energy for providing our electricity, fuel and heat?
Base: All wave respondents. (Asked quarterly.) See technical appendix for base sizes
Support for renewable energy was highest among those in social grades AB (92%, compared with 75% of those in social grades DE) (Table 1).
June 2019(Wave 30), 82%
Sept 2019(Wave 31), 84%
0
20
40
60
80
100
Sept 2012(Wave 3)
Sept 2013(Wave 7)
Sept 2014(Wave 11)
Sept 2015(Wave 15)
Sept 2016(Wave 19)
Sept 2017(Wave 23)
Sept 2018(Wave 27)
Sept 2019(Wave 31)
%
Total support
Total oppose
10
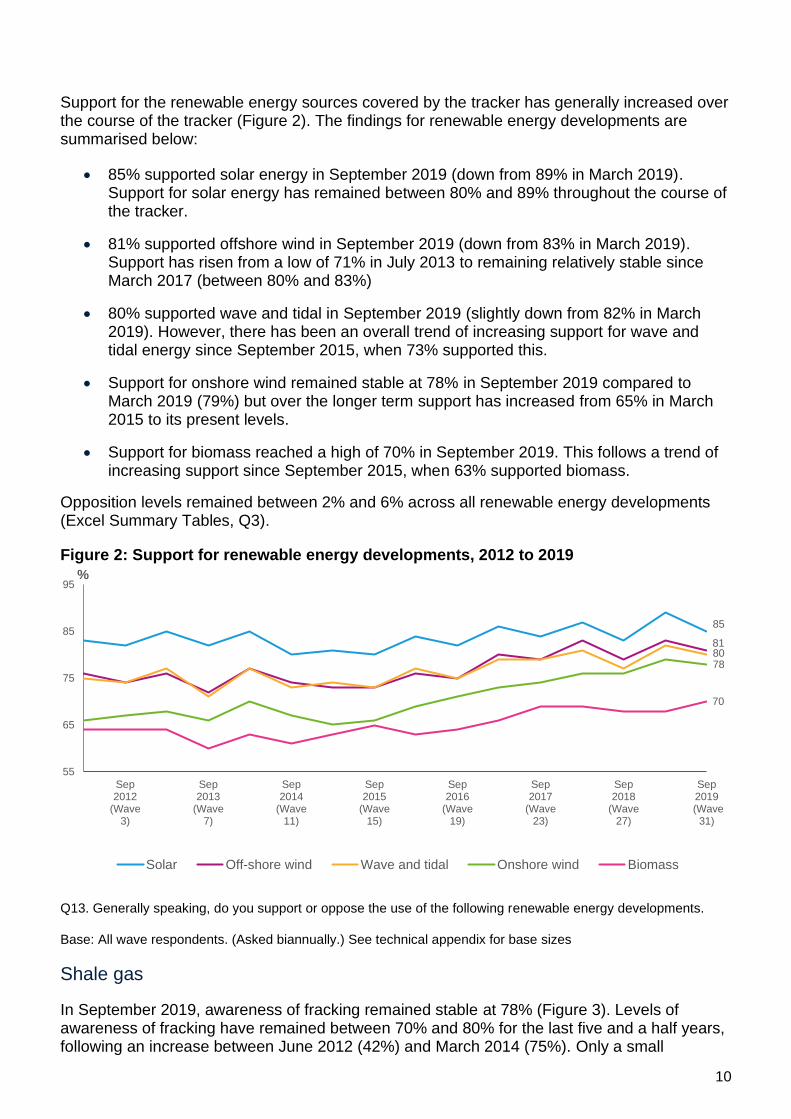
Support for the renewable energy sources covered by the tracker has generally increased over the course of the tracker (Figure 2). The findings for renewable energy developments are summarised below:
• 85% supported solar energy in September 2019 (down from 89% in March 2019). Support for solar energy has remained between 80% and 89% throughout the course of the tracker.
• 81% supported offshore wind in September 2019 (down from 83% in March 2019). Support has risen from a low of 71% in July 2013 to remaining relatively stable since March 2017 (between 80% and 83%)
• 80% supported wave and tidal in September 2019 (slightly down from 82% in March 2019). However, there has been an overall trend of increasing support for wave and tidal energy since September 2015, when 73% supported this.
• Support for onshore wind remained stable at 78% in September 2019 compared to March 2019 (79%) but over the longer term support has increased from 65% in March 2015 to its present levels.
• Support for biomass reached a high of 70% in September 2019. This follows a trend of increasing support since September 2015, when 63% supported biomass.
Opposition levels remained between 2% and 6% across all renewable energy developments (Excel Summary Tables, Q3).
Figure 2: Support for renewable energy developments, 2012 to 2019
Q13. Generally speaking, do you support or oppose the use of the following renewable energy developments.
Base: All wave respondents. (Asked biannually.) See technical appendix for base sizes
Shale gas
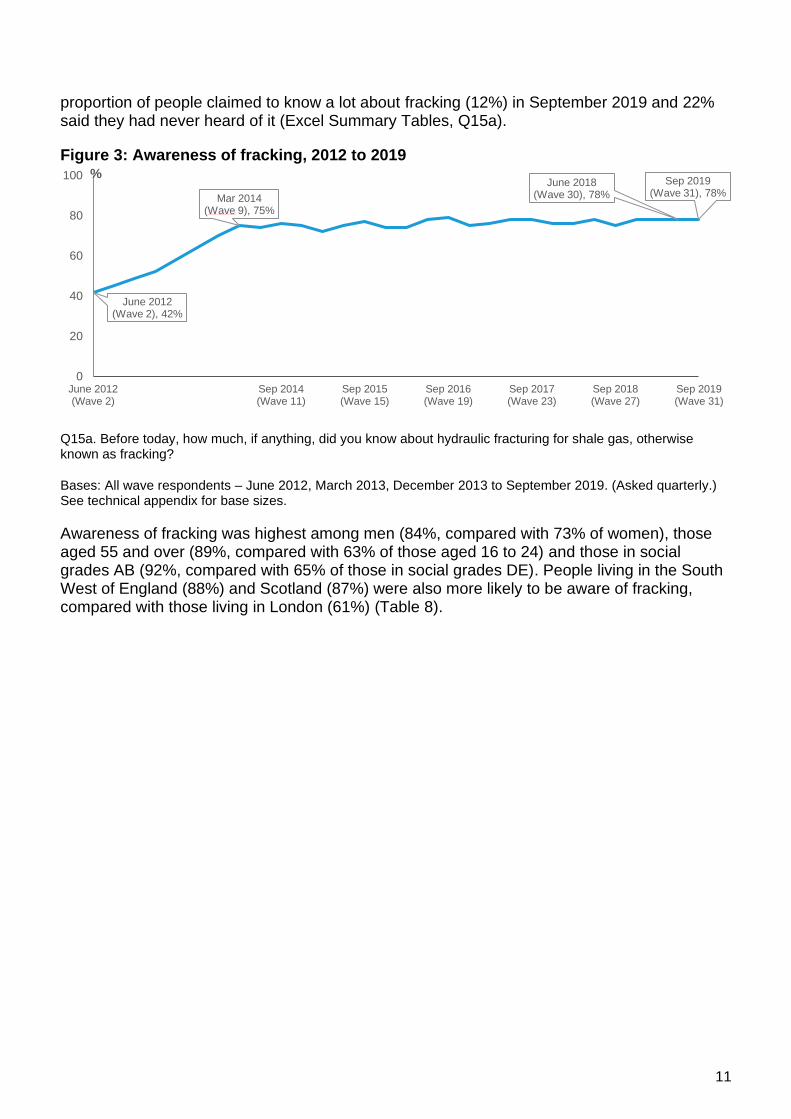
In September 2019, awareness of fracking remained stable at 78% (Figure 3). Levels of awareness of fracking have remained between 70% and 80% for the last five and a half years, following an increase between June 2012 (42%) and March 2014 (75%). Only a small
85
818078
70
55
65
75
85
95
Sep2012
(Wave3)
Sep2013
(Wave7)
Sep2014
(Wave11)
Sep2015
(Wave15)
Sep2016
(Wave19)
Sep2017
(Wave23)
Sep2018
(Wave27)
Sep2019
(Wave31)
%
Solar Off-shore wind Wave and tidal Onshore wind Biomass
11
proportion of people claimed to know a lot about fracking (12%) in September 2019 and 22% said they had never heard of it (Excel Summary Tables, Q15a).
Figure 3: Awareness of fracking, 2012 to 2019
Q15a. Before today, how much, if anything, did you know about hydraulic fracturing for shale gas, otherwise known as fracking?
Bases: All wave respondents – June 2012, March 2013, December 2013 to September 2019. (Asked quarterly.) See technical appendix for base sizes.
Awareness of fracking was highest among men (84%, compared with 73% of women), those aged 55 and over (89%, compared with 63% of those aged 16 to 24) and those in social grades AB (92%, compared with 65% of those in social grades DE). People living in the South West of England (88%) and Scotland (87%) were also more likely to be aware of fracking, compared with those living in London (61%) (Table 8).
June 2012(Wave 2), 42%
Mar 2014(Wave 9), 75%
June 2018(Wave 30), 78%
Sep 2019(Wave 31), 78%
0
20
40
60
80
100
June 2012(Wave 2)
Sep 2014(Wave 11)
Sep 2015(Wave 15)
Sep 2016(Wave 19)
Sep 2017(Wave 23)
Sep 2018(Wave 27)
Sep 2019(Wave 31)
%
12
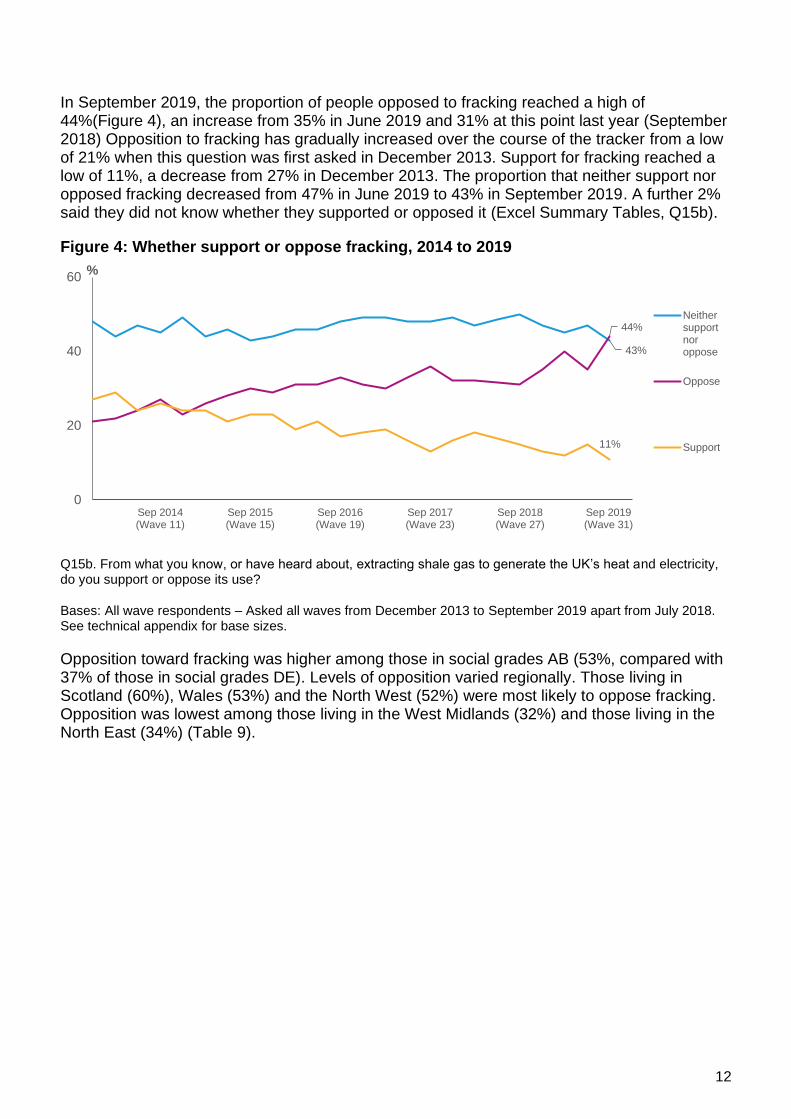
In September 2019, the proportion of people opposed to fracking reached a high of 44%(Figure 4), an increase from 35% in June 2019 and 31% at this point last year (September 2018) Opposition to fracking has gradually increased over the course of the tracker from a low of 21% when this question was first asked in December 2013. Support for fracking reached a low of 11%, a decrease from 27% in December 2013. The proportion that neither support nor opposed fracking decreased from 47% in June 2019 to 43% in September 2019. A further 2% said they did not know whether they supported or opposed it (Excel Summary Tables, Q15b).
Figure 4: Whether support or oppose fracking, 2014 to 2019
Q15b. From what you know, or have heard about, extracting shale gas to generate the UK’s heat and electricity, do you support or oppose its use?
Bases: All wave respondents – Asked all waves from December 2013 to September 2019 apart from July 2018. See technical appendix for base sizes.
Opposition toward fracking was higher among those in social grades AB (53%, compared with 37% of those in social grades DE). Levels of opposition varied regionally. Those living in Scotland (60%), Wales (53%) and the North West (52%) were most likely to oppose fracking. Opposition was lowest among those living in the West Midlands (32%) and those living in the North East (34%) (Table 9).
43%
44%
11%
0
20
40
60
Sep 2014(Wave 11)
Sep 2015(Wave 15)
Sep 2016(Wave 19)
Sep 2017(Wave 23)
Sep 2018(Wave 27)
Sep 2019(Wave 31)
%
Neithersupportnoroppose
Oppose
Support
13
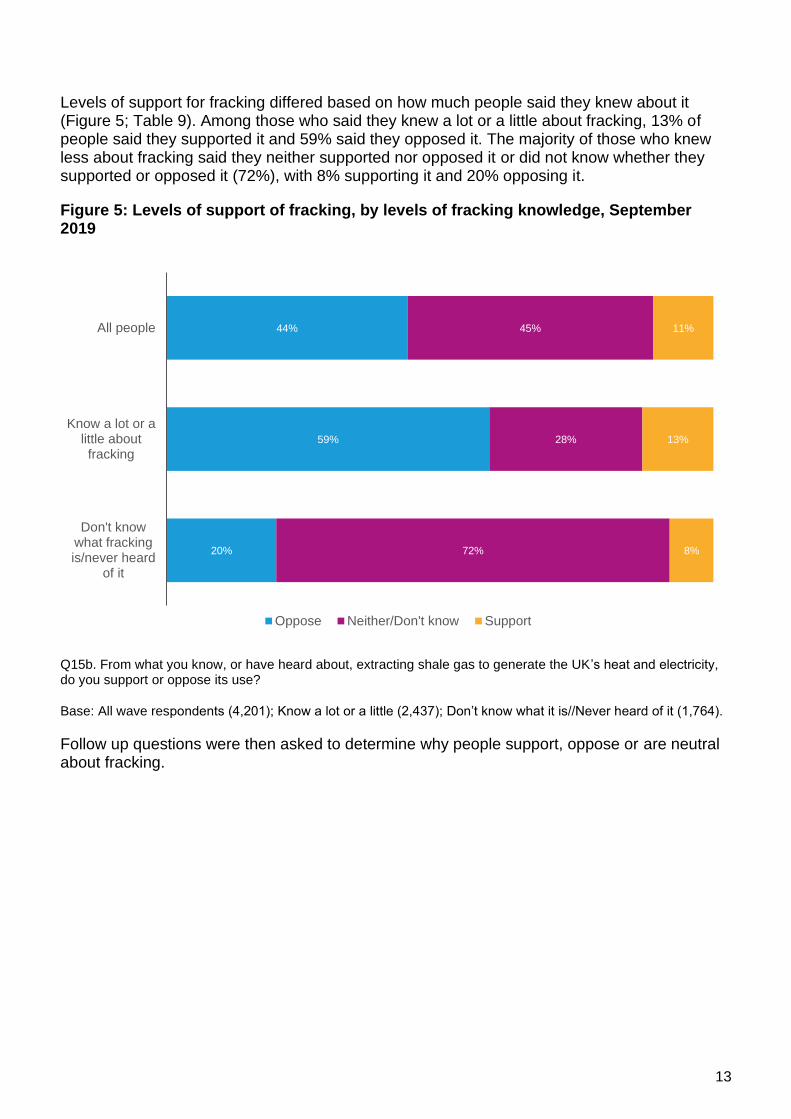
Levels of support for fracking differed based on how much people said they knew about it (Figure 5; Table 9). Among those who said they knew a lot or a little about fracking, 13% of people said they supported it and 59% said they opposed it. The majority of those who knew less about fracking said they neither supported nor opposed it or did not know whether they supported or opposed it (72%), with 8% supporting it and 20% opposing it.
Figure 5: Levels of support of fracking, by levels of fracking knowledge, September 2019
Q15b. From what you know, or have heard about, extracting shale gas to generate the UK’s heat and electricity, do you support or oppose its use?
Base: All wave respondents (4,201); Know a lot or a little (2,437); Don’t know what it is//Never heard of it (1,764).
Follow up questions were then asked to determine why people support, oppose or are neutral about fracking.
20%
59%
44%
72%
28%
45%
8%
13%
11%
Don't knowwhat frackingis/never heard
of it
Know a lot or alittle aboutfracking
All people
Oppose Neither/Don't know Support
14
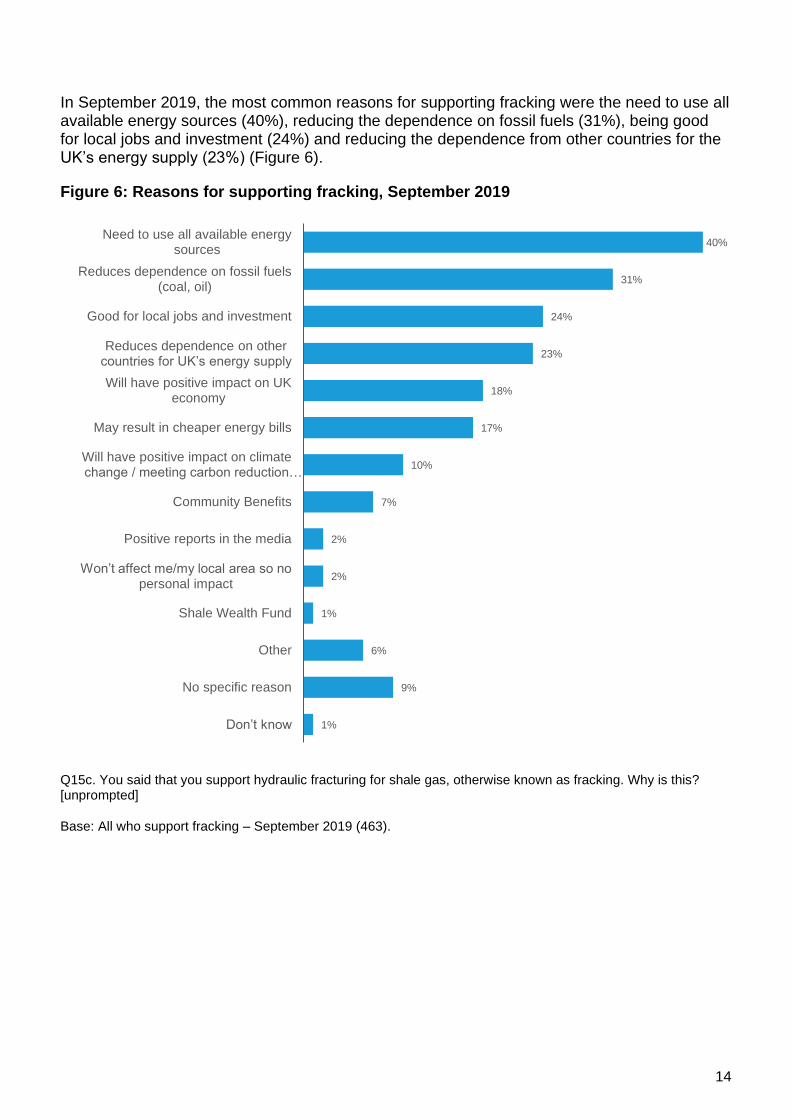
In September 2019, the most common reasons for supporting fracking were the need to use all available energy sources (40%), reducing the dependence on fossil fuels (31%), being good for local jobs and investment (24%) and reducing the dependence from other countries for the UK’s energy supply (23%) (Figure 6).
Figure 6: Reasons for supporting fracking, September 2019
Q15c. You said that you support hydraulic fracturing for shale gas, otherwise known as fracking. Why is this? [unprompted]
Base: All who support fracking – September 2019 (463).
1%
9%
6%
1%
2%
2%
7%
10%
17%
18%
23%
24%
31%
40%
Don’t know
No specific reason
Other
Shale Wealth Fund
Won’t affect me/my local area so no personal impact
Positive reports in the media
Community Benefits
Will have positive impact on climatechange / meeting carbon reduction…
May result in cheaper energy bills
Will have positive impact on UKeconomy
Reduces dependence on other countries for UK’s energy supply
Good for local jobs and investment
Reduces dependence on fossil fuels(coal, oil)
Need to use all available energysources
15
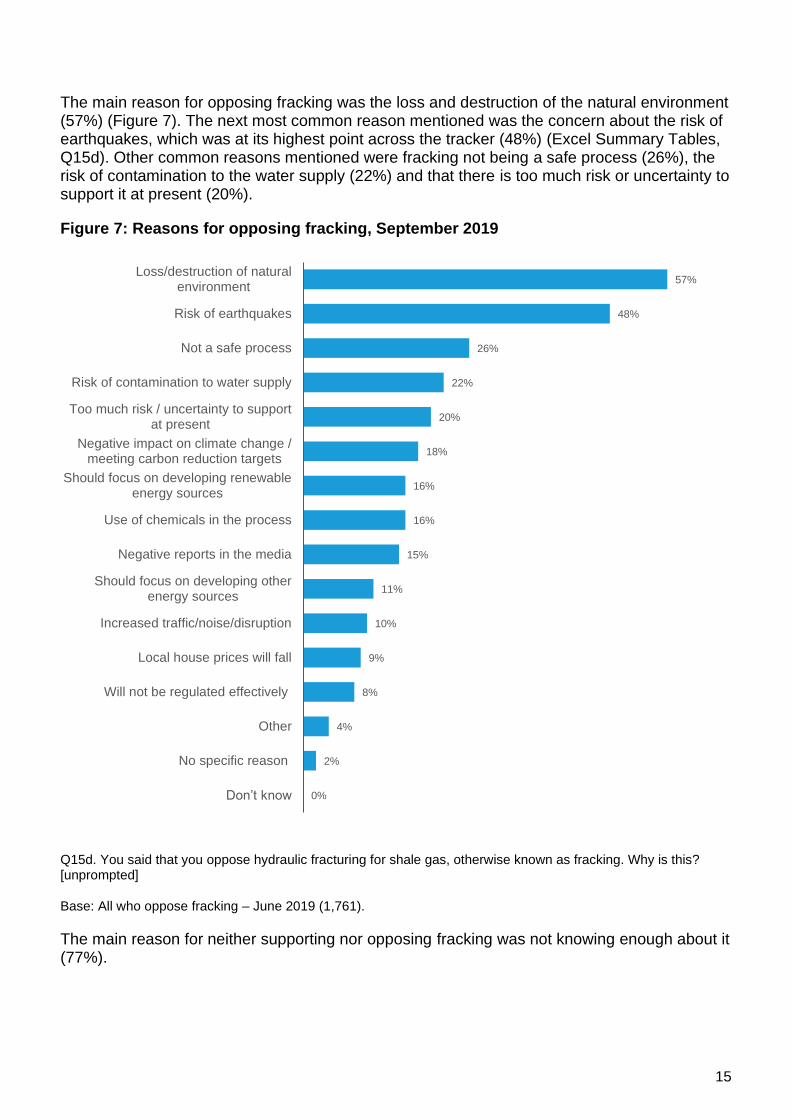
The main reason for opposing fracking was the loss and destruction of the natural environment (57%) (Figure 7). The next most common reason mentioned was the concern about the risk of earthquakes, which was at its highest point across the tracker (48%) (Excel Summary Tables, Q15d). Other common reasons mentioned were fracking not being a safe process (26%), the risk of contamination to the water supply (22%) and that there is too much risk or uncertainty to support it at present (20%).
Figure 7: Reasons for opposing fracking, September 2019
Q15d. You said that you oppose hydraulic fracturing for shale gas, otherwise known as fracking. Why is this? [unprompted]
Base: All who oppose fracking – June 2019 (1,761).
The main reason for neither supporting nor opposing fracking was not knowing enough about it (77%).
0%
2%
4%
8%
9%
10%
11%
15%
16%
16%
18%
20%
22%
26%
48%
57%
Don’t know
No specific reason
Other
Will not be regulated effectively
Local house prices will fall
Increased traffic/noise/disruption
Should focus on developing otherenergy sources
Negative reports in the media
Use of chemicals in the process
Should focus on developing renewableenergy sources
Negative impact on climate change /meeting carbon reduction targets
Too much risk / uncertainty to supportat present
Risk of contamination to water supply
Not a safe process
Risk of earthquakes
Loss/destruction of naturalenvironment
16
Radioactive waste
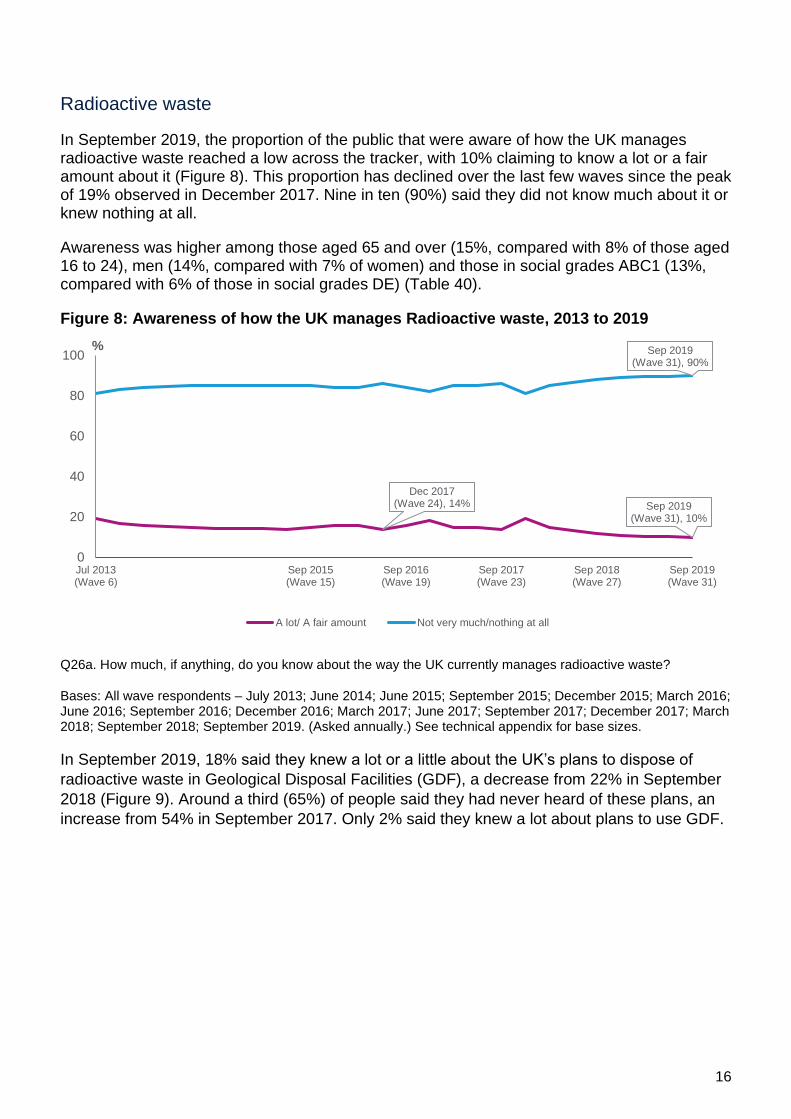
In September 2019, the proportion of the public that were aware of how the UK manages radioactive waste reached a low across the tracker, with 10% claiming to know a lot or a fair amount about it (Figure 8). This proportion has declined over the last few waves since the peak of 19% observed in December 2017. Nine in ten (90%) said they did not know much about it or knew nothing at all.
Awareness was higher among those aged 65 and over (15%, compared with 8% of those aged 16 to 24), men (14%, compared with 7% of women) and those in social grades ABC1 (13%, compared with 6% of those in social grades DE) (Table 40).
Figure 8: Awareness of how the UK manages Radioactive waste, 2013 to 2019
Q26a. How much, if anything, do you know about the way the UK currently manages radioactive waste?
Bases: All wave respondents – July 2013; June 2014; June 2015; September 2015; December 2015; March 2016; June 2016; September 2016; December 2016; March 2017; June 2017; September 2017; December 2017; March 2018; September 2018; September 2019. (Asked annually.) See technical appendix for base sizes.
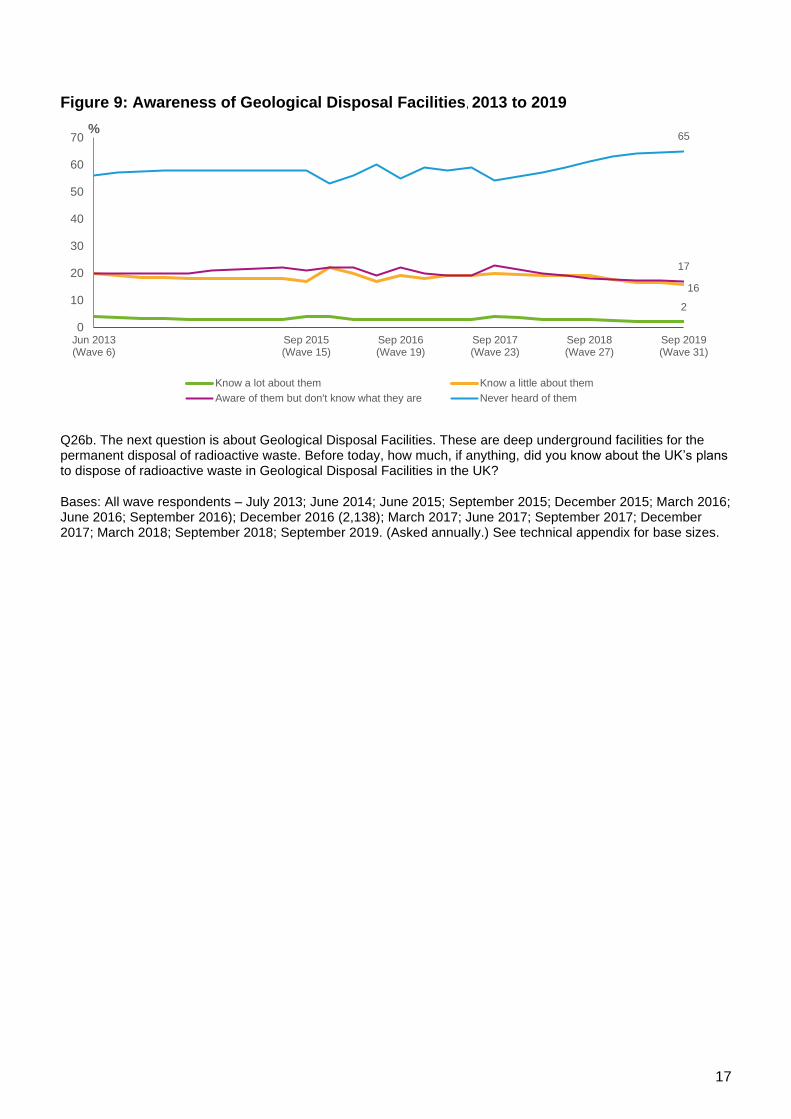
In September 2019, 18% said they knew a lot or a little about the UK’s plans to dispose of
radioactive waste in Geological Disposal Facilities (GDF), a decrease from 22% in September
2018 (Figure 9). Around a third (65%) of people said they had never heard of these plans, an
increase from 54% in September 2017. Only 2% said they knew a lot about plans to use GDF.
Dec 2017(Wave 24), 14% Sep 2019
(Wave 31), 10%
Sep 2019(Wave 31), 90%
0
20
40
60
80
100
Jul 2013(Wave 6)
Sep 2015(Wave 15)
Sep 2016(Wave 19)
Sep 2017(Wave 23)
Sep 2018(Wave 27)
Sep 2019(Wave 31)
%
A lot/ A fair amount Not very much/nothing at all
17
Figure 9: Awareness of Geological Disposal Facilities, 2013 to 2019
Q26b. The next question is about Geological Disposal Facilities. These are deep underground facilities for the permanent disposal of radioactive waste. Before today, how much, if anything, did you know about the UK’s plans to dispose of radioactive waste in Geological Disposal Facilities in the UK?
Bases: All wave respondents – July 2013; June 2014; June 2015; September 2015; December 2015; March 2016; June 2016; September 2016); December 2016 (2,138); March 2017; June 2017; September 2017; December 2017; March 2018; September 2018; September 2019. (Asked annually.) See technical appendix for base sizes.
2
16
17
65
0
10
20
30
40
50
60
70
Jun 2013(Wave 6)
Sep 2015(Wave 15)
Sep 2016(Wave 19)
Sep 2017(Wave 23)
Sep 2018(Wave 27)
Sep 2019(Wave 31)
%
Know a lot about them Know a little about them
Aware of them but don't know what they are Never heard of them
18
Small modular reactors
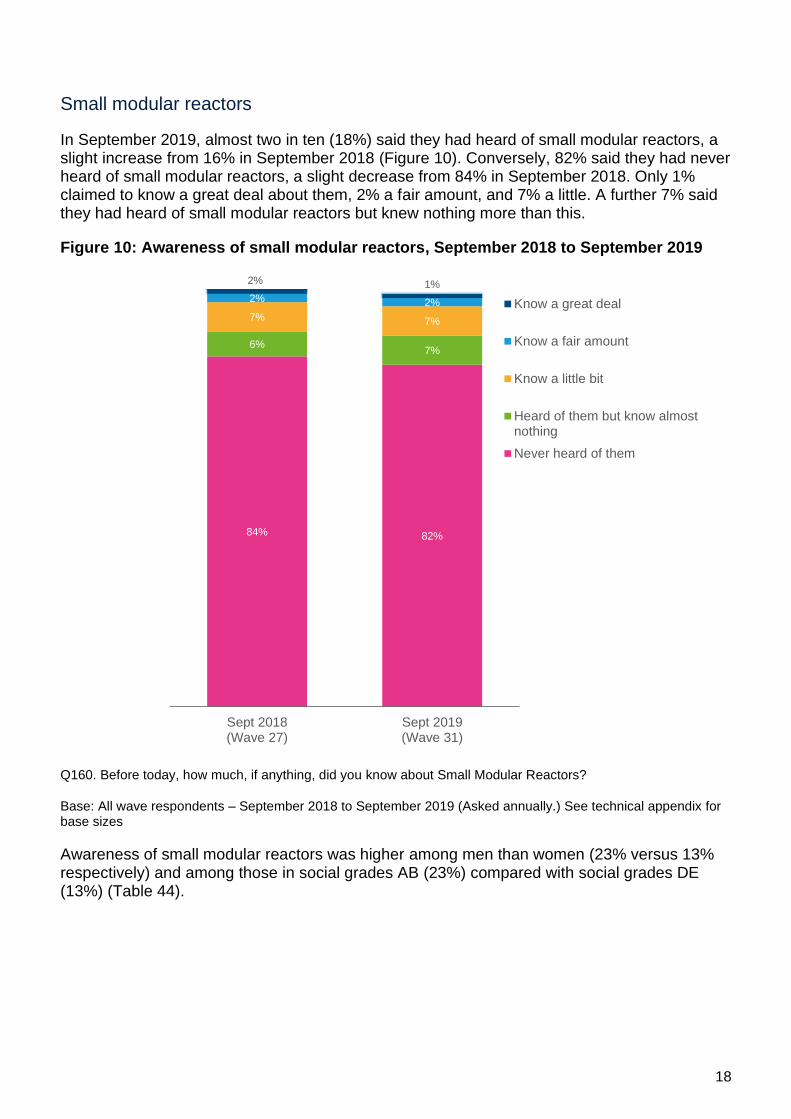
In September 2019, almost two in ten (18%) said they had heard of small modular reactors, a slight increase from 16% in September 2018 (Figure 10). Conversely, 82% said they had never heard of small modular reactors, a slight decrease from 84% in September 2018. Only 1% claimed to know a great deal about them, 2% a fair amount, and 7% a little. A further 7% said they had heard of small modular reactors but knew nothing more than this.
Figure 10: Awareness of small modular reactors, September 2018 to September 2019
Q160. Before today, how much, if anything, did you know about Small Modular Reactors?
Base: All wave respondents – September 2018 to September 2019 (Asked annually.) See technical appendix for base sizes
Awareness of small modular reactors was higher among men than women (23% versus 13% respectively) and among those in social grades AB (23%) compared with social grades DE (13%) (Table 44).
84% 82%
6%7%
7% 7%
2% 2%
2% 1%
Sept 2018(Wave 27)
Sept 2019(Wave 31)
Know a great deal
Know a fair amount
Know a little bit
Heard of them but know almostnothing
Never heard of them
19
Decommissioning oil and gas
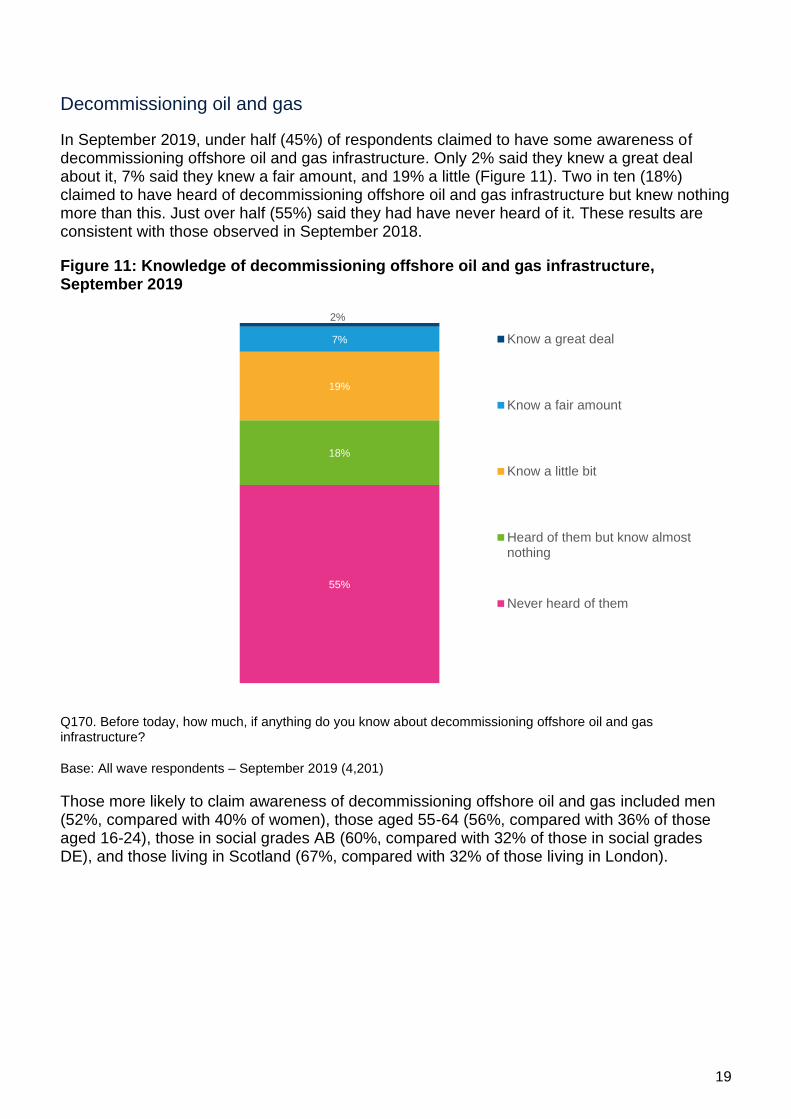
In September 2019, under half (45%) of respondents claimed to have some awareness of decommissioning offshore oil and gas infrastructure. Only 2% said they knew a great deal about it, 7% said they knew a fair amount, and 19% a little (Figure 11). Two in ten (18%) claimed to have heard of decommissioning offshore oil and gas infrastructure but knew nothing more than this. Just over half (55%) said they had have never heard of it. These results are consistent with those observed in September 2018.
Figure 11: Knowledge of decommissioning offshore oil and gas infrastructure, September 2019
Q170. Before today, how much, if anything do you know about decommissioning offshore oil and gas infrastructure?
Base: All wave respondents – September 2019 (4,201)
Those more likely to claim awareness of decommissioning offshore oil and gas included men (52%, compared with 40% of women), those aged 55-64 (56%, compared with 36% of those aged 16-24), those in social grades AB (60%, compared with 32% of those in social grades DE), and those living in Scotland (67%, compared with 32% of those living in London).
55%
18%
19%
7%
2%
Know a great deal
Know a fair amount
Know a little bit
Heard of them but know almostnothing
Never heard of them
20
Clean growth
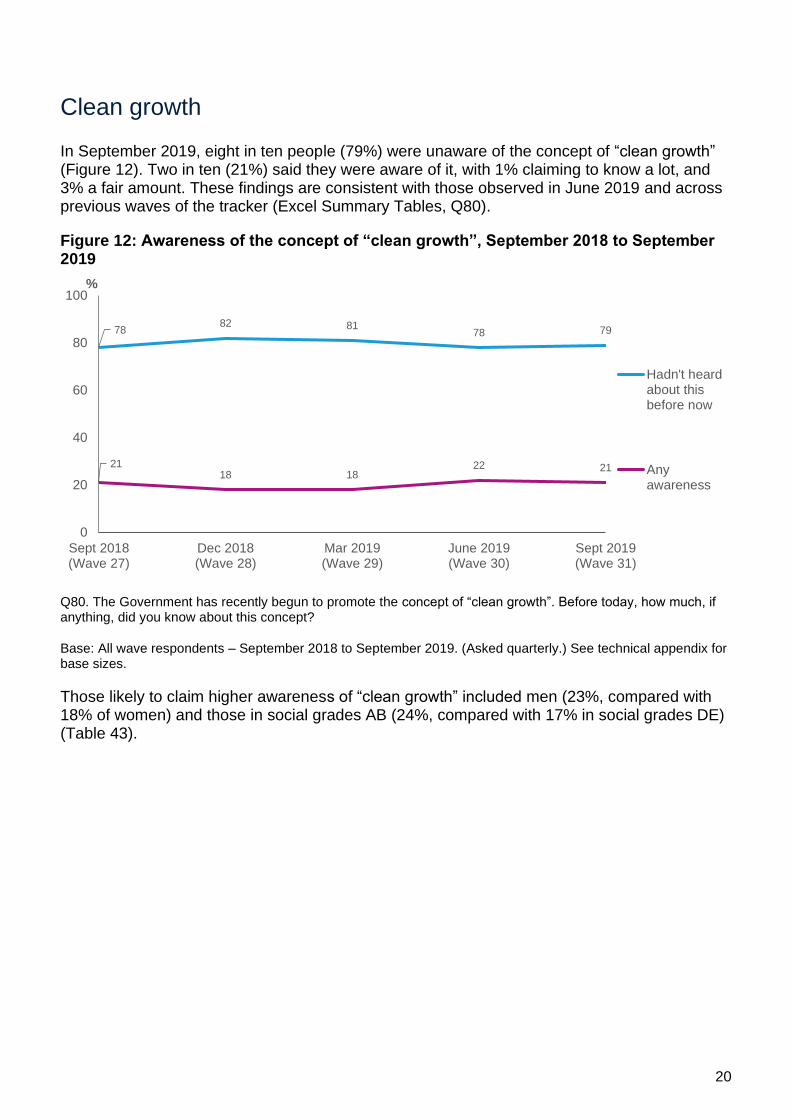
In September 2019, eight in ten people (79%) were unaware of the concept of “clean growth” (Figure 12). Two in ten (21%) said they were aware of it, with 1% claiming to know a lot, and 3% a fair amount. These findings are consistent with those observed in June 2019 and across previous waves of the tracker (Excel Summary Tables, Q80).
Figure 12: Awareness of the concept of “clean growth”, September 2018 to September 2019
Q80. The Government has recently begun to promote the concept of “clean growth”. Before today, how much, if anything, did you know about this concept?
Base: All wave respondents – September 2018 to September 2019. (Asked quarterly.) See technical appendix for base sizes.
Those likely to claim higher awareness of “clean growth” included men (23%, compared with 18% of women) and those in social grades AB (24%, compared with 17% in social grades DE) (Table 43).
7882 81
78 79
2118 18
22 21
0
20
40
60
80
100
Sept 2018(Wave 27)
Dec 2018(Wave 28)
Mar 2019(Wave 29)
June 2019(Wave 30)
Sept 2019(Wave 31)
%
Hadn't heardabout thisbefore now
Anyawareness
21
Home energy efficiency and insulation
Insulation
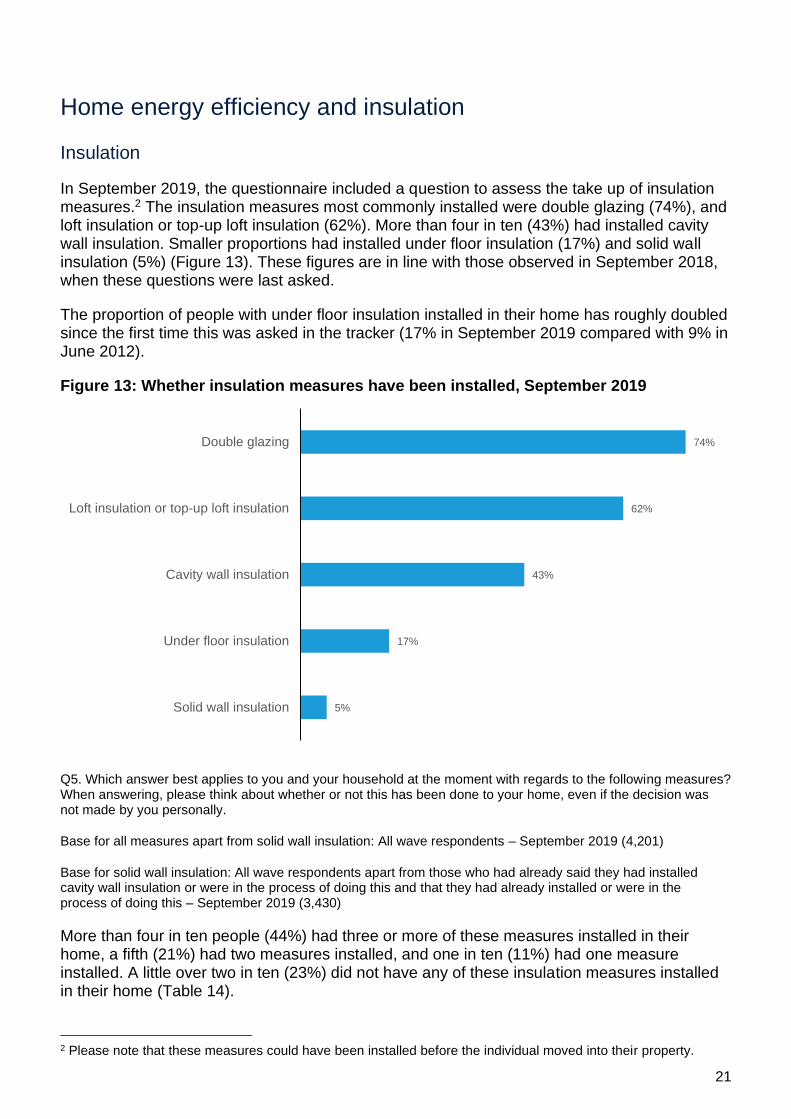
In September 2019, the questionnaire included a question to assess the take up of insulation measures.2 The insulation measures most commonly installed were double glazing (74%), and loft insulation or top-up loft insulation (62%). More than four in ten (43%) had installed cavity wall insulation. Smaller proportions had installed under floor insulation (17%) and solid wall insulation (5%) (Figure 13). These figures are in line with those observed in September 2018, when these questions were last asked.
The proportion of people with under floor insulation installed in their home has roughly doubled since the first time this was asked in the tracker (17% in September 2019 compared with 9% in June 2012).
Figure 13: Whether insulation measures have been installed, September 2019
Q5. Which answer best applies to you and your household at the moment with regards to the following measures? When answering, please think about whether or not this has been done to your home, even if the decision was not made by you personally.
Base for all measures apart from solid wall insulation: All wave respondents – September 2019 (4,201)
Base for solid wall insulation: All wave respondents apart from those who had already said they had installed cavity wall insulation or were in the process of doing this and that they had already installed or were in the process of doing this – September 2019 (3,430)
More than four in ten people (44%) had three or more of these measures installed in their home, a fifth (21%) had two measures installed, and one in ten (11%) had one measure installed. A little over two in ten (23%) did not have any of these insulation measures installed in their home (Table 14).
2 Please note that these measures could have been installed before the individual moved into their property.
5%
17%
43%
62%
74%
Solid wall insulation
Under floor insulation
Cavity wall insulation
Loft insulation or top-up loft insulation
Double glazing
22
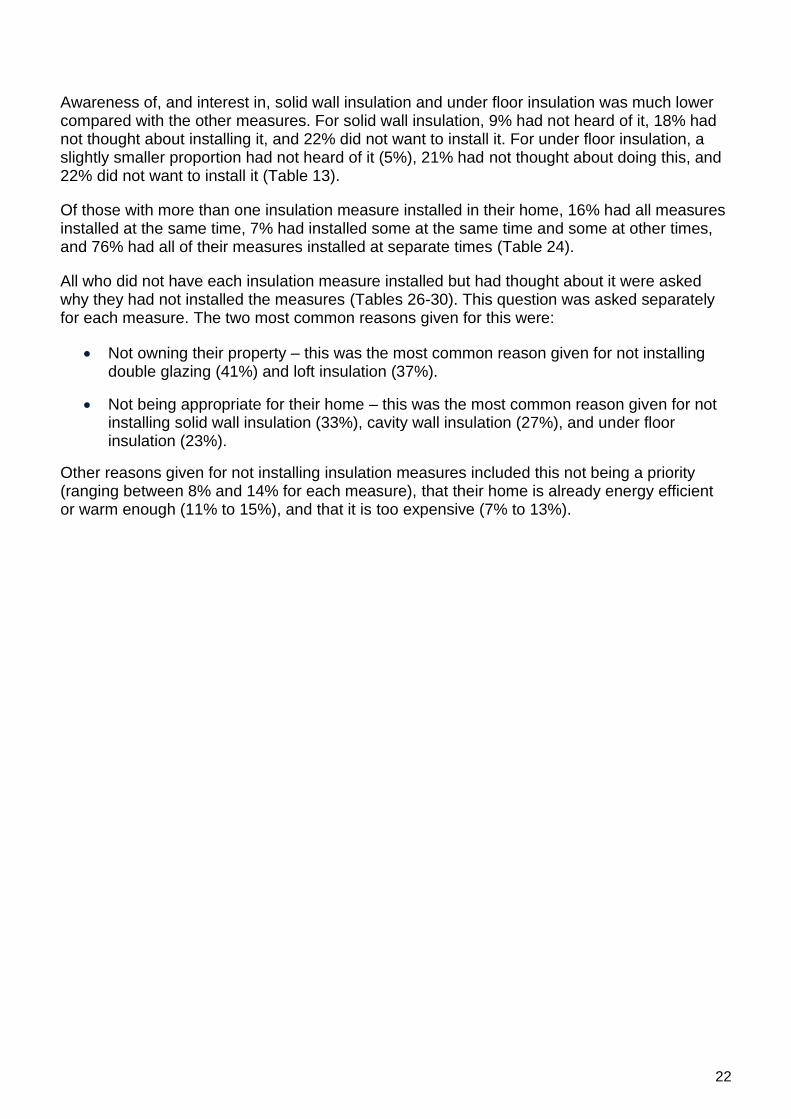
Awareness of, and interest in, solid wall insulation and under floor insulation was much lower compared with the other measures. For solid wall insulation, 9% had not heard of it, 18% had not thought about installing it, and 22% did not want to install it. For under floor insulation, a slightly smaller proportion had not heard of it (5%), 21% had not thought about doing this, and 22% did not want to install it (Table 13).
Of those with more than one insulation measure installed in their home, 16% had all measures installed at the same time, 7% had installed some at the same time and some at other times, and 76% had all of their measures installed at separate times (Table 24).
All who did not have each insulation measure installed but had thought about it were asked why they had not installed the measures (Tables 26-30). This question was asked separately for each measure. The two most common reasons given for this were:
• Not owning their property – this was the most common reason given for not installing double glazing (41%) and loft insulation (37%).
• Not being appropriate for their home – this was the most common reason given for not installing solid wall insulation (33%), cavity wall insulation (27%), and under floor insulation (23%).
Other reasons given for not installing insulation measures included this not being a priority (ranging between 8% and 14% for each measure), that their home is already energy efficient or warm enough (11% to 15%), and that it is too expensive (7% to 13%).
23
Energy performance certificates (EPCs)
In September 2019, the questionnaire included questions to assess awareness of EPCs and their ratings, and recollection and usefulness of recommendations in EPCs. This question was first asked in September 2015.
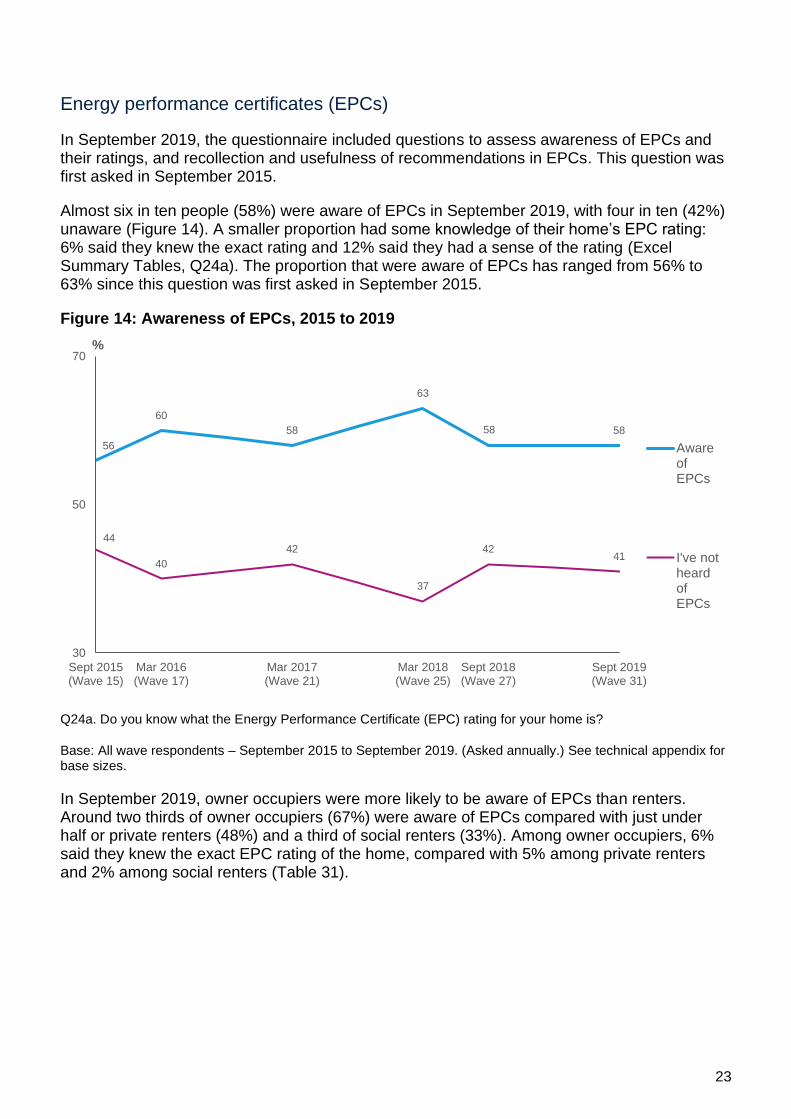
Almost six in ten people (58%) were aware of EPCs in September 2019, with four in ten (42%) unaware (Figure 14). A smaller proportion had some knowledge of their home’s EPC rating: 6% said they knew the exact rating and 12% said they had a sense of the rating (Excel Summary Tables, Q24a). The proportion that were aware of EPCs has ranged from 56% to 63% since this question was first asked in September 2015.
Figure 14: Awareness of EPCs, 2015 to 2019
Q24a. Do you know what the Energy Performance Certificate (EPC) rating for your home is?
Base: All wave respondents – September 2015 to September 2019. (Asked annually.) See technical appendix for base sizes.
In September 2019, owner occupiers were more likely to be aware of EPCs than renters. Around two thirds of owner occupiers (67%) were aware of EPCs compared with just under half or private renters (48%) and a third of social renters (33%). Among owner occupiers, 6% said they knew the exact EPC rating of the home, compared with 5% among private renters and 2% among social renters (Table 31).
56
60
58
63
58 58
44
40
42
37
4241
30
50
70
Sept 2015(Wave 15)
Mar 2016(Wave 17)
Mar 2017(Wave 21)
Mar 2018(Wave 25)
Sept 2018(Wave 27)
Sept 2019(Wave 31)
%
AwareofEPCs
I've notheardofEPCs
24
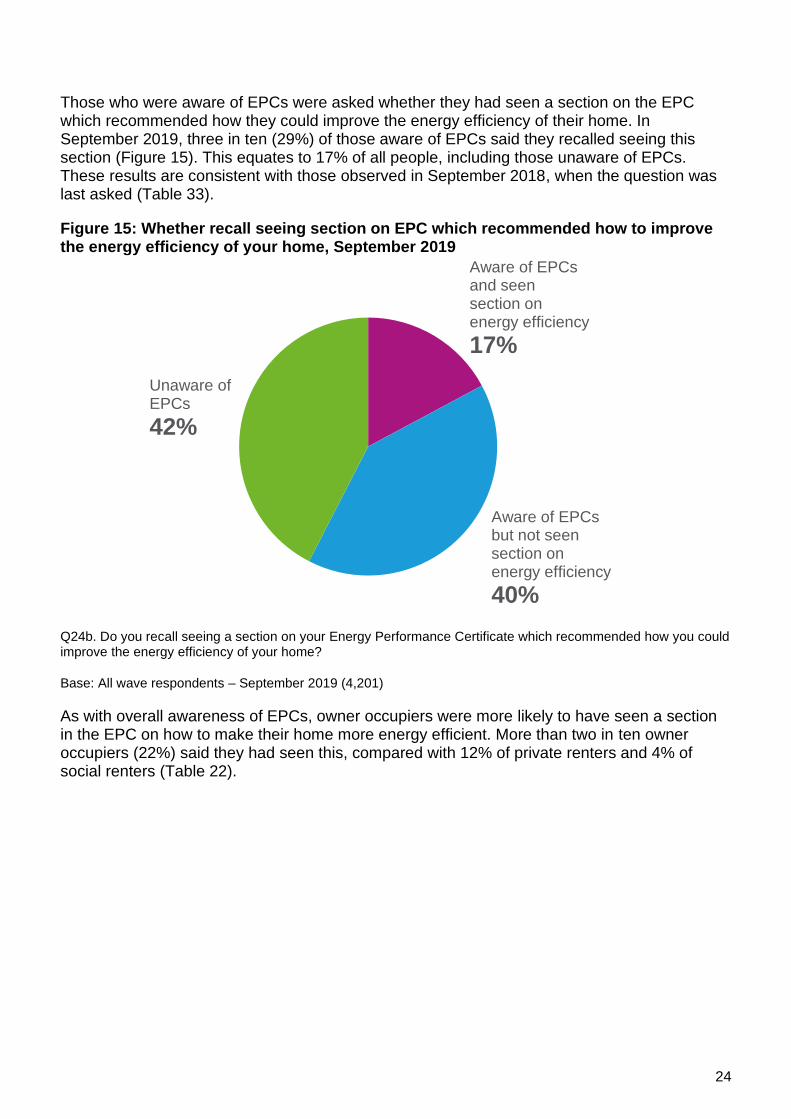
Those who were aware of EPCs were asked whether they had seen a section on the EPC which recommended how they could improve the energy efficiency of their home. In September 2019, three in ten (29%) of those aware of EPCs said they recalled seeing this section (Figure 15). This equates to 17% of all people, including those unaware of EPCs. These results are consistent with those observed in September 2018, when the question was last asked (Table 33).
Figure 15: Whether recall seeing section on EPC which recommended how to improve the energy efficiency of your home, September 2019
Q24b. Do you recall seeing a section on your Energy Performance Certificate which recommended how you could improve the energy efficiency of your home?
Base: All wave respondents – September 2019 (4,201)
As with overall awareness of EPCs, owner occupiers were more likely to have seen a section in the EPC on how to make their home more energy efficient. More than two in ten owner occupiers (22%) said they had seen this, compared with 12% of private renters and 4% of social renters (Table 22).
Aware of EPCs and seen section on energy efficiency
17%
Aware of EPCs but not seen section on energy efficiency
40%
Unaware of EPCs
42%
25
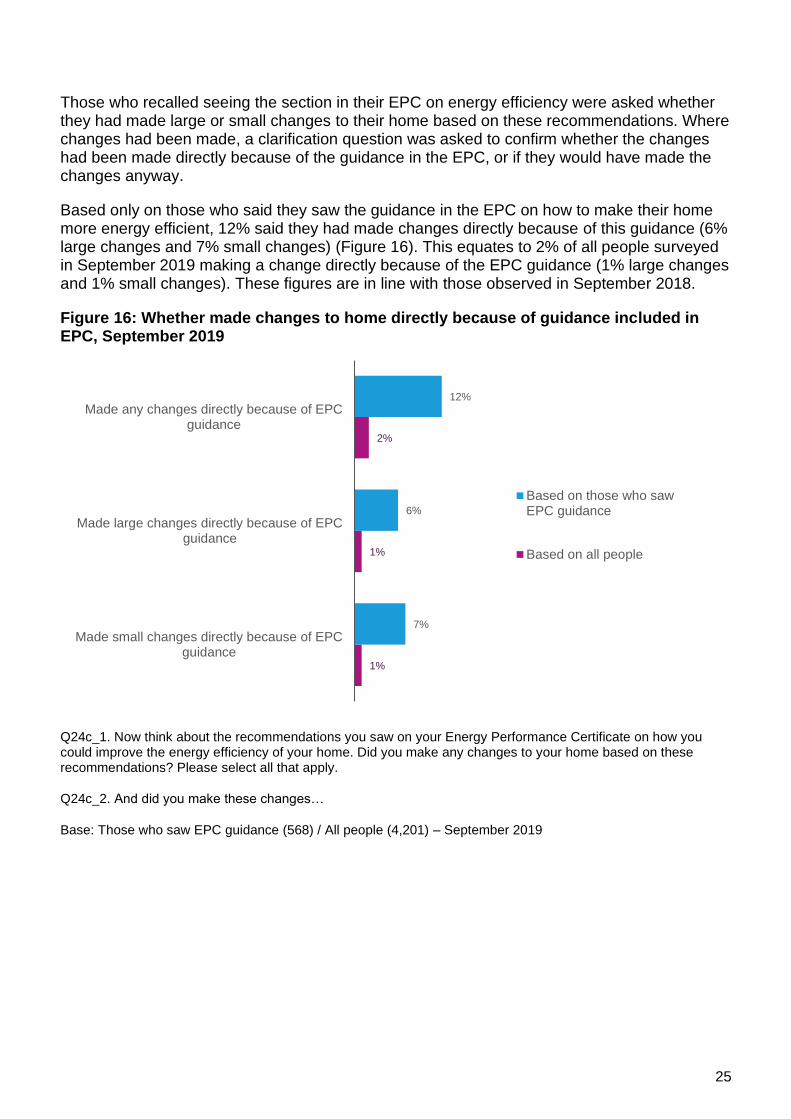
Those who recalled seeing the section in their EPC on energy efficiency were asked whether they had made large or small changes to their home based on these recommendations. Where changes had been made, a clarification question was asked to confirm whether the changes had been made directly because of the guidance in the EPC, or if they would have made the changes anyway.
Based only on those who said they saw the guidance in the EPC on how to make their home more energy efficient, 12% said they had made changes directly because of this guidance (6% large changes and 7% small changes) (Figure 16). This equates to 2% of all people surveyed in September 2019 making a change directly because of the EPC guidance (1% large changes and 1% small changes). These figures are in line with those observed in September 2018.
Figure 16: Whether made changes to home directly because of guidance included in EPC, September 2019
Q24c_1. Now think about the recommendations you saw on your Energy Performance Certificate on how you could improve the energy efficiency of your home. Did you make any changes to your home based on these recommendations? Please select all that apply.
Q24c_2. And did you make these changes…
Base: Those who saw EPC guidance (568) / All people (4,201) – September 2019
1%
1%
2%
7%
6%
12%
Made small changes directly because of EPCguidance
Made large changes directly because of EPCguidance
Made any changes directly because of EPCguidance
Based on those who sawEPC guidance
Based on all people
26
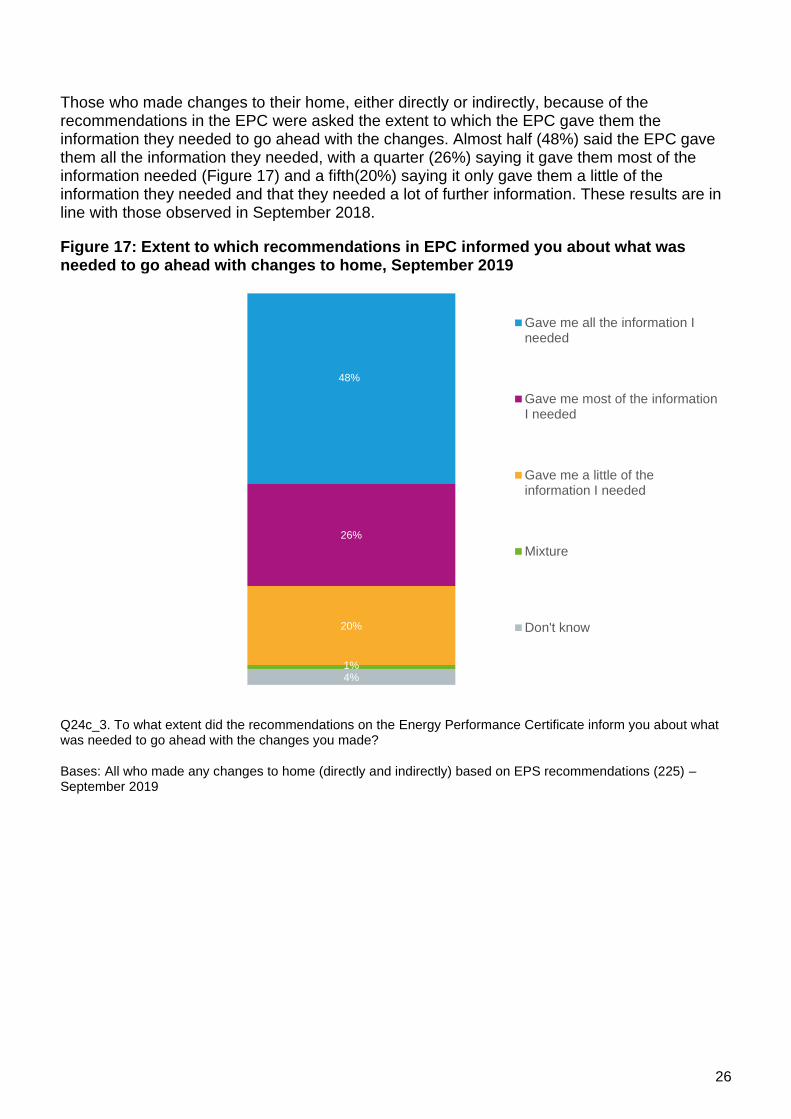
Those who made changes to their home, either directly or indirectly, because of the recommendations in the EPC were asked the extent to which the EPC gave them the information they needed to go ahead with the changes. Almost half (48%) said the EPC gave them all the information they needed, with a quarter (26%) saying it gave them most of the information needed (Figure 17) and a fifth(20%) saying it only gave them a little of the information they needed and that they needed a lot of further information. These results are in line with those observed in September 2018.
Figure 17: Extent to which recommendations in EPC informed you about what was needed to go ahead with changes to home, September 2019
Q24c_3. To what extent did the recommendations on the Energy Performance Certificate inform you about what was needed to go ahead with the changes you made?
Bases: All who made any changes to home (directly and indirectly) based on EPS recommendations (225) – September 2019
4%1%
20%
26%
48%
Gave me all the information Ineeded
Gave me most of the informationI needed
Gave me a little of theinformation I needed
Mixture
Don't know
27
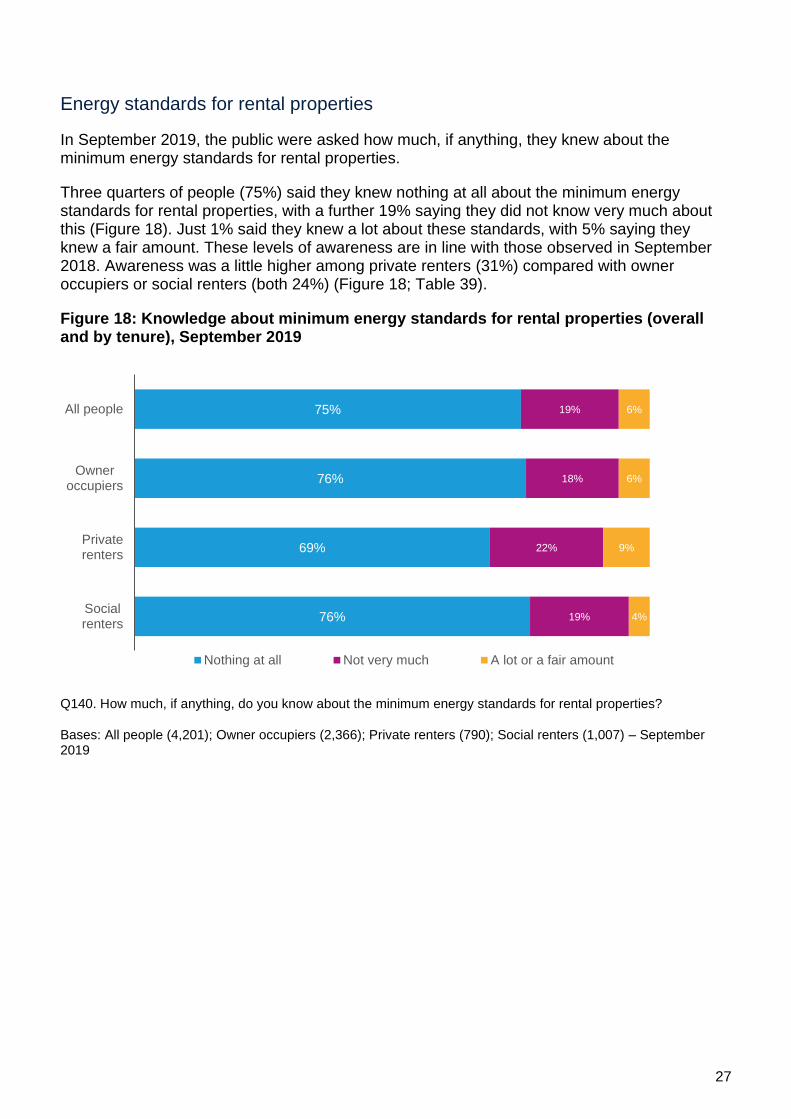
Energy standards for rental properties
In September 2019, the public were asked how much, if anything, they knew about the minimum energy standards for rental properties.
Three quarters of people (75%) said they knew nothing at all about the minimum energy standards for rental properties, with a further 19% saying they did not know very much about this (Figure 18). Just 1% said they knew a lot about these standards, with 5% saying they knew a fair amount. These levels of awareness are in line with those observed in September 2018. Awareness was a little higher among private renters (31%) compared with owner occupiers or social renters (both 24%) (Figure 18; Table 39).
Figure 18: Knowledge about minimum energy standards for rental properties (overall and by tenure), September 2019
Q140. How much, if anything, do you know about the minimum energy standards for rental properties?
Bases: All people (4,201); Owner occupiers (2,366); Private renters (790); Social renters (1,007) – September 2019
76%
69%
76%
75%
19%
22%
18%
19%
4%
9%
6%
6%
Socialrenters
Privaterenters
Owneroccupiers
All people
Nothing at all Not very much A lot or a fair amount
28
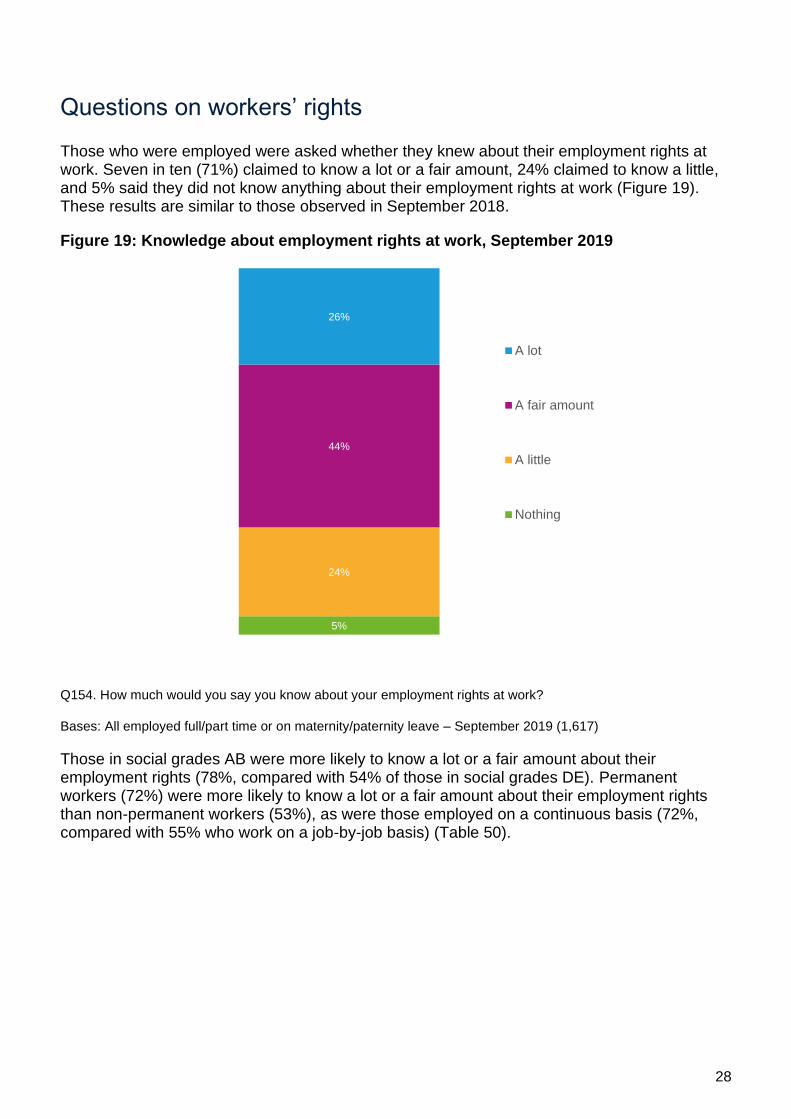
Questions on workers’ rights
Those who were employed were asked whether they knew about their employment rights at work. Seven in ten (71%) claimed to know a lot or a fair amount, 24% claimed to know a little, and 5% said they did not know anything about their employment rights at work (Figure 19). These results are similar to those observed in September 2018.
Figure 19: Knowledge about employment rights at work, September 2019
Q154. How much would you say you know about your employment rights at work?
Bases: All employed full/part time or on maternity/paternity leave – September 2019 (1,617)
Those in social grades AB were more likely to know a lot or a fair amount about their employment rights (78%, compared with 54% of those in social grades DE). Permanent workers (72%) were more likely to know a lot or a fair amount about their employment rights than non-permanent workers (53%), as were those employed on a continuous basis (72%, compared with 55% who work on a job-by-job basis) (Table 50).
5%
24%
44%
26%
A lot
A fair amount
A little
Nothing
29
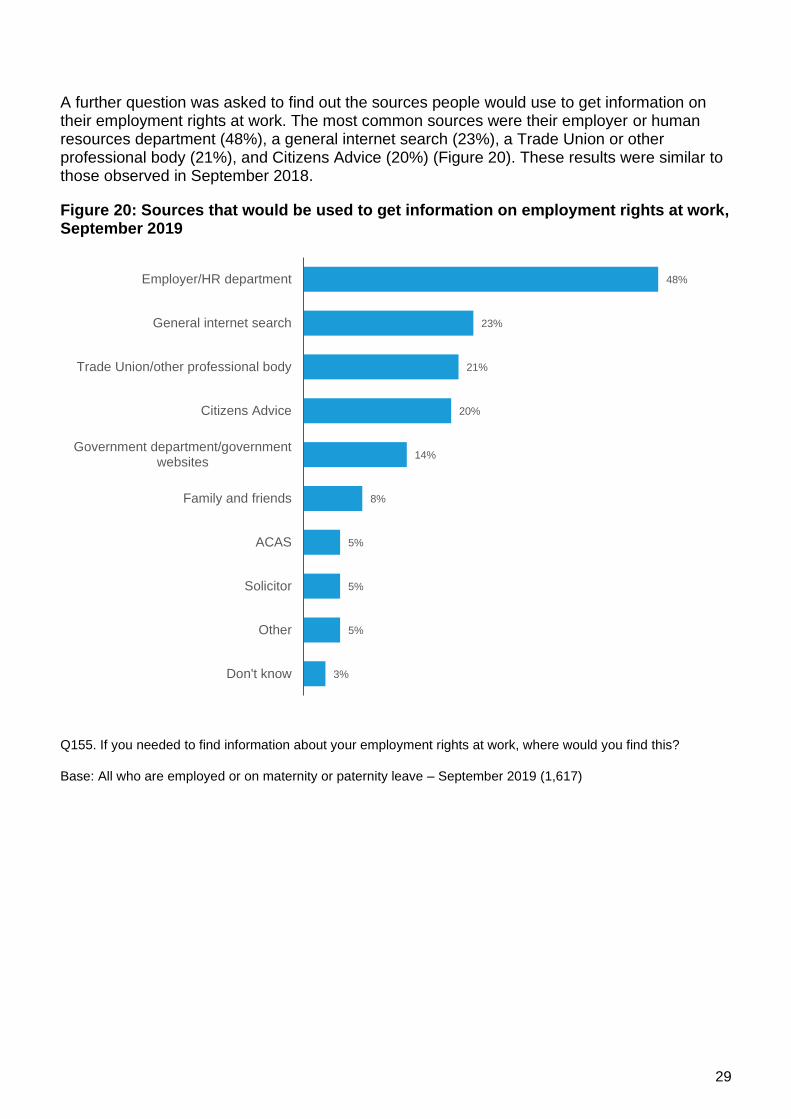
A further question was asked to find out the sources people would use to get information on their employment rights at work. The most common sources were their employer or human resources department (48%), a general internet search (23%), a Trade Union or other professional body (21%), and Citizens Advice (20%) (Figure 20). These results were similar to those observed in September 2018.
Figure 20: Sources that would be used to get information on employment rights at work, September 2019
Q155. If you needed to find information about your employment rights at work, where would you find this?
Base: All who are employed or on maternity or paternity leave – September 2019 (1,617)
3%
5%
5%
5%
8%
14%
20%
21%
23%
48%
Don't know
Other
Solicitor
ACAS
Family and friends
Government department/governmentwebsites
Citizens Advice
Trade Union/other professional body
General internet search
Employer/HR department
30
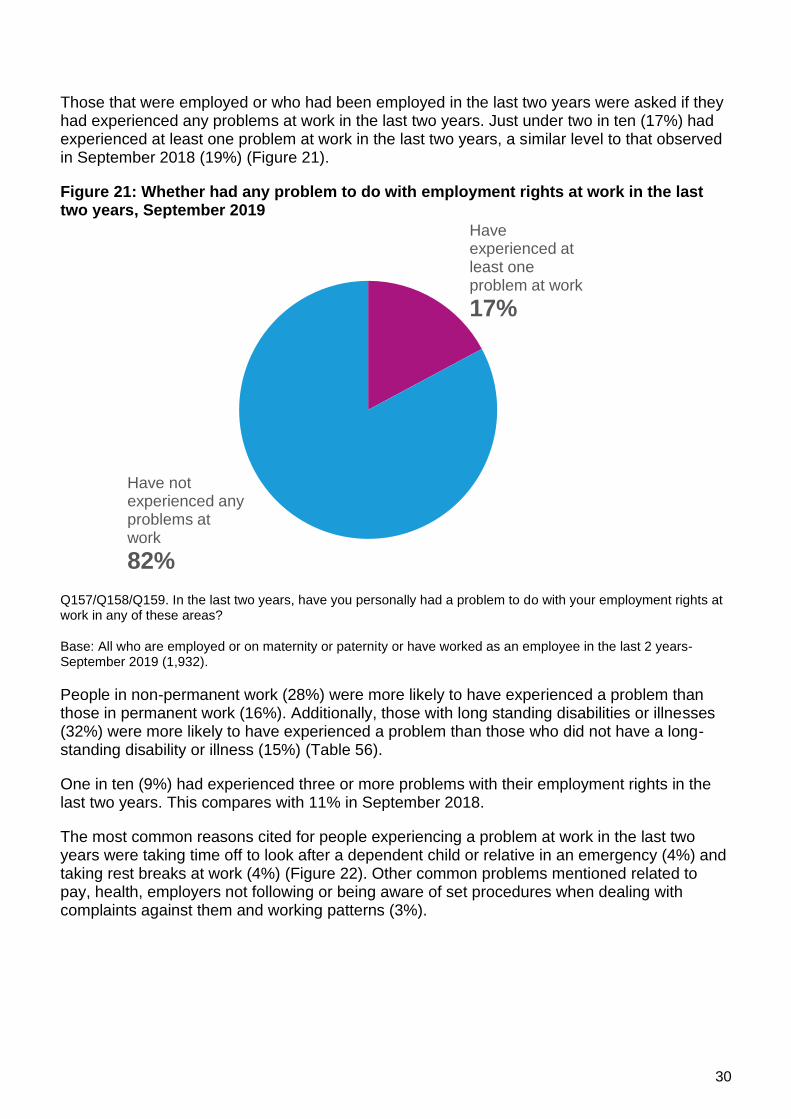
Those that were employed or who had been employed in the last two years were asked if they had experienced any problems at work in the last two years. Just under two in ten (17%) had experienced at least one problem at work in the last two years, a similar level to that observed in September 2018 (19%) (Figure 21).
Figure 21: Whether had any problem to do with employment rights at work in the last two years, September 2019
Q157/Q158/Q159. In the last two years, have you personally had a problem to do with your employment rights at work in any of these areas?
Base: All who are employed or on maternity or paternity or have worked as an employee in the last 2 years- September 2019 (1,932).
People in non-permanent work (28%) were more likely to have experienced a problem than those in permanent work (16%). Additionally, those with long standing disabilities or illnesses (32%) were more likely to have experienced a problem than those who did not have a long-standing disability or illness (15%) (Table 56).
One in ten (9%) had experienced three or more problems with their employment rights in the last two years. This compares with 11% in September 2018.
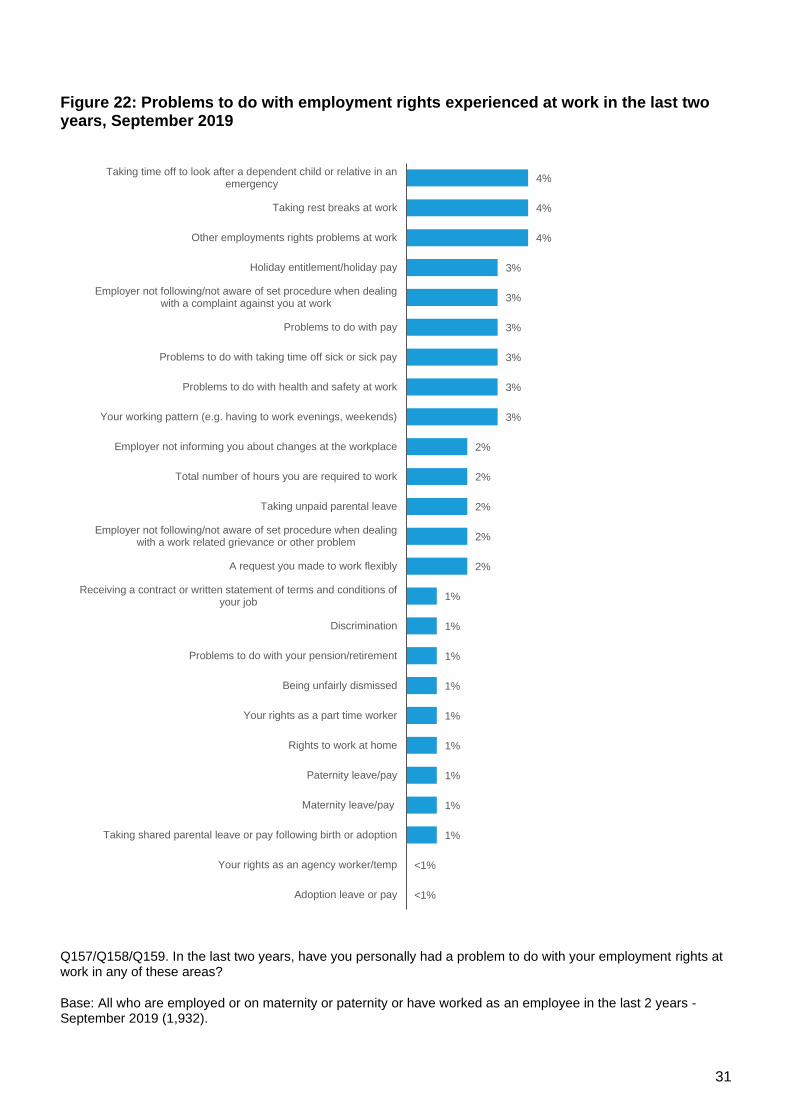
The most common reasons cited for people experiencing a problem at work in the last two years were taking time off to look after a dependent child or relative in an emergency (4%) and taking rest breaks at work (4%) (Figure 22). Other common problems mentioned related to pay, health, employers not following or being aware of set procedures when dealing with complaints against them and working patterns (3%).
Have experienced at least one problem at work
17%
Have not experienced any problems at work
82%
31
Figure 22: Problems to do with employment rights experienced at work in the last two years, September 2019
Q157/Q158/Q159. In the last two years, have you personally had a problem to do with your employment rights at work in any of these areas?
Base: All who are employed or on maternity or paternity or have worked as an employee in the last 2 years - September 2019 (1,932).
<1%
<1%
1%
1%
1%
1%
1%
1%
1%
1%
1%
2%
2%
2%
2%
2%
3%
3%
3%
3%
3%
3%
4%
4%
4%
Adoption leave or pay
Your rights as an agency worker/temp
Taking shared parental leave or pay following birth or adoption
Maternity leave/pay
Paternity leave/pay
Rights to work at home
Your rights as a part time worker
Being unfairly dismissed
Problems to do with your pension/retirement
Discrimination
Receiving a contract or written statement of terms and conditions ofyour job
A request you made to work flexibly
Employer not following/not aware of set procedure when dealingwith a work related grievance or other problem
Taking unpaid parental leave
Total number of hours you are required to work
Employer not informing you about changes at the workplace
Your working pattern (e.g. having to work evenings, weekends)
Problems to do with health and safety at work
Problems to do with taking time off sick or sick pay
Problems to do with pay
Employer not following/not aware of set procedure when dealingwith a complaint against you at work
Holiday entitlement/holiday pay
Other employments rights problems at work
Taking rest breaks at work
Taking time off to look after a dependent child or relative in anemergency
32
Technical appendix
Technical notes
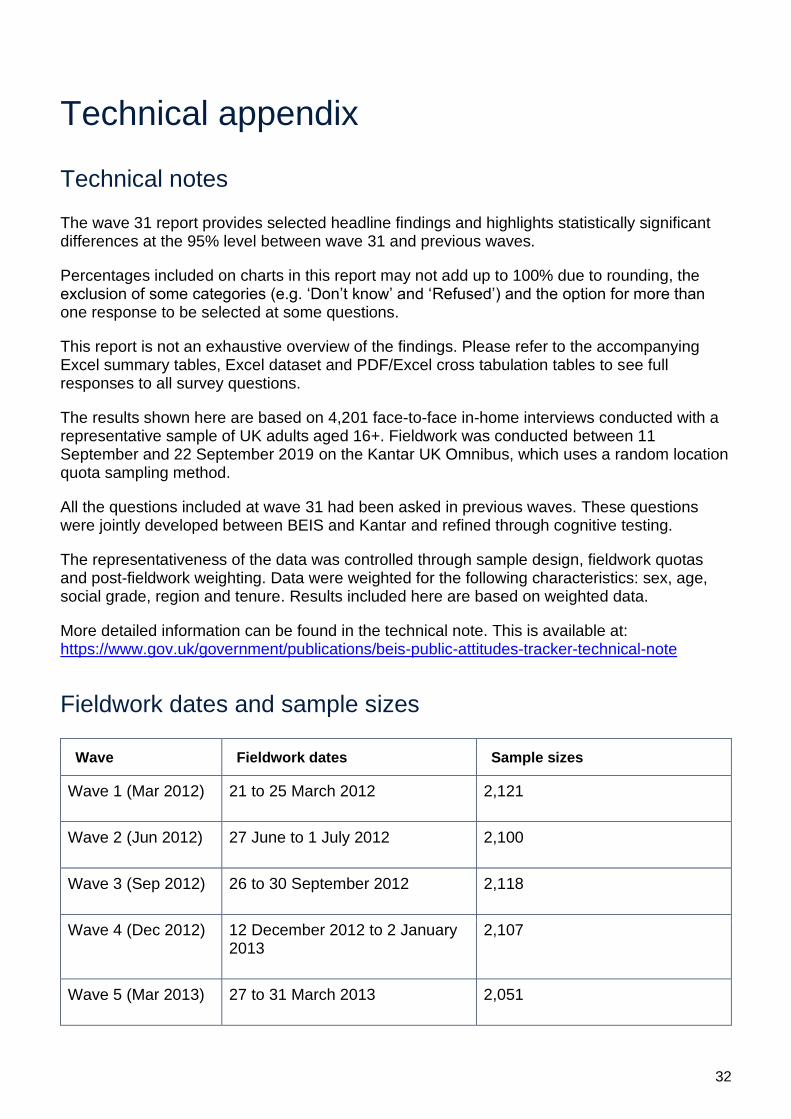
The wave 31 report provides selected headline findings and highlights statistically significant differences at the 95% level between wave 31 and previous waves.
Percentages included on charts in this report may not add up to 100% due to rounding, the exclusion of some categories (e.g. ‘Don’t know’ and ‘Refused’) and the option for more than one response to be selected at some questions.
This report is not an exhaustive overview of the findings. Please refer to the accompanying Excel summary tables, Excel dataset and PDF/Excel cross tabulation tables to see full responses to all survey questions.
The results shown here are based on 4,201 face-to-face in-home interviews conducted with a representative sample of UK adults aged 16+. Fieldwork was conducted between 11 September and 22 September 2019 on the Kantar UK Omnibus, which uses a random location quota sampling method.
All the questions included at wave 31 had been asked in previous waves. These questions were jointly developed between BEIS and Kantar and refined through cognitive testing.
The representativeness of the data was controlled through sample design, fieldwork quotas and post-fieldwork weighting. Data were weighted for the following characteristics: sex, age, social grade, region and tenure. Results included here are based on weighted data.
More detailed information can be found in the technical note. This is available at: https://www.gov.uk/government/publications/beis-public-attitudes-tracker-technical-note
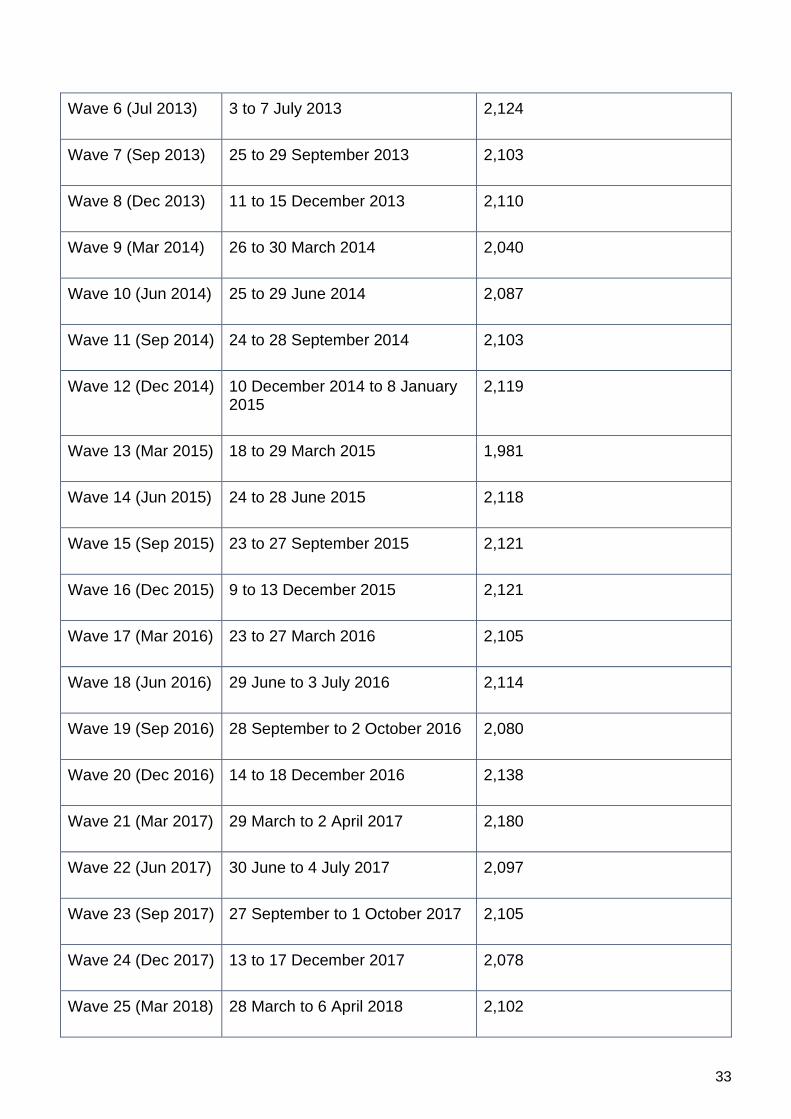
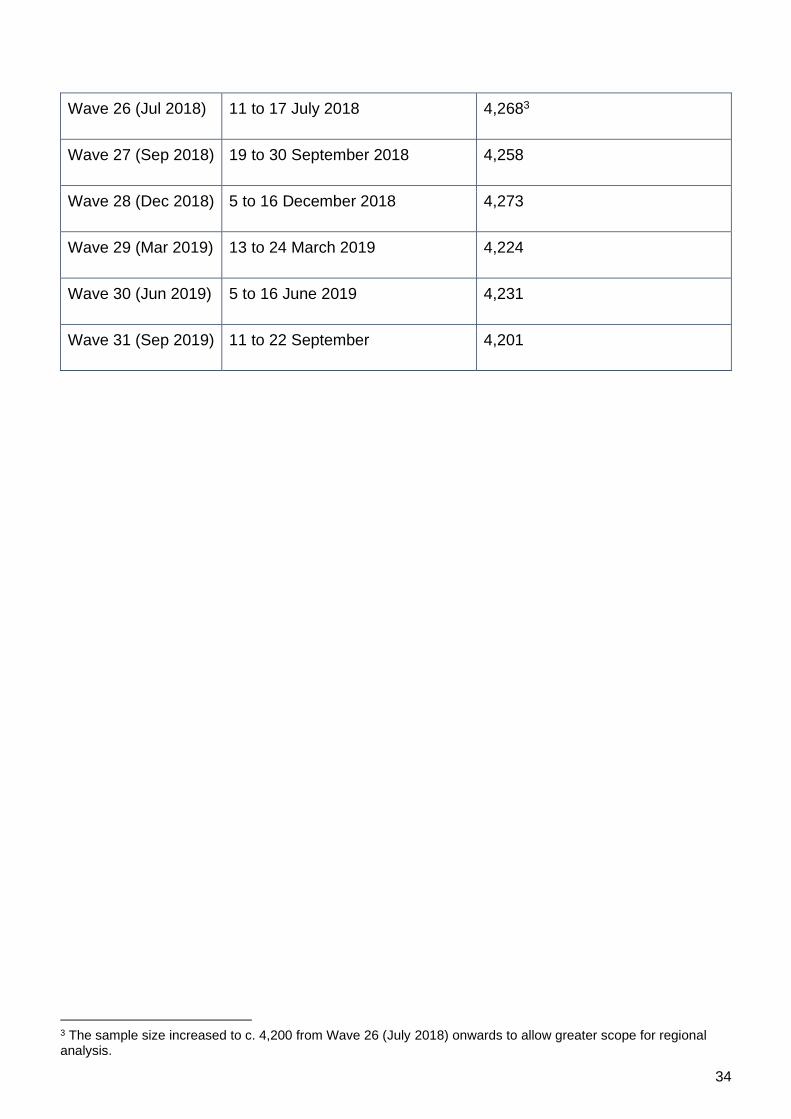
Fieldwork dates and sample sizes
Wave Fieldwork dates Sample sizes
Wave 1 (Mar 2012) 21 to 25 March 2012 2,121
Wave 2 (Jun 2012) 27 June to 1 July 2012 2,100
Wave 3 (Sep 2012) 26 to 30 September 2012 2,118
Wave 4 (Dec 2012) 12 December 2012 to 2 January 2013
This publication is licensed under the terms of the Open Government Licence v3.0 except where otherwise stated. To view this licence, visit nationalarchives.gov.uk/doc/open-government-licence/version/3 or write to the Information Policy Team, The National Archives, Kew, London TW9 4DU, or email: [email protected] we have identified any third party copyright information you will need to obtain permission from the copyright holders concerned.
This publication available from www.gov.uk/beis
Contact us if you have any enquiries about this publication, including requests for alternative formats, at:
Department for Business, Energy and Industrial Strategy 1 Victoria Street London SW1H 0ET Tel: 020 7215 5000