Responsible statistician: Rory Attwell Email: [email protected]Media enquiries: 020 7215 1000; [email protected] Public enquiries: 020 7215 5000 BEIS Public Attitudes Tracker (March 2021, Wave 37, UK) 13 May 2021 Official Statistics As well as the quarterly questions on renewable energy, fracking, climate change and Net Zero, the March 2021 wave of the tracker covered some topics asked on an annual basis including further questions on climate change, energy use and smart meters. In March 2021: 40% of the public were either very worried (11%) or fairly worried (29%) about paying for energy bills, a slight increase from March 2020 (37%) In regard to climate change in the UK, nine in ten people (89%) had noticed at least one current impact, while 8% had not noticed any impacts. Excepting the 1% who don’t believe in climate change, 83% thought people in other countries were being affected by climate change, 70% thought people in the UK as a whole were affected and half (49%) thought their local area was affected (Figure 1). Figure 1: How much climate change is currently affecting your local area, people in the UK as a whole, and people in other countries (among all people except those who believe there is no such thing as climate change), March 2021* Please refer to Figure 6 for base size and question details. What you need to know about these statistics: Face-to-face fieldwork was suspended halfway through the March 2020 wave of the tracker (wave 33) and the remaining data collection for wave 33 was carried out using the Kantar online omnibus panel. This online panel was also used between June 2020 and March 2021 (waves 34 to 37). This report only presents results collected via the online omnibus. These results should not be compared with face-to-face results from previous waves due to selection and measurement effects. See the Technical Notes for details.
Transcript
Responsible statistician: Rory Attwell Email: [email protected] Media enquiries: 020 7215 1000; [email protected] Public enquiries: 020 7215 5000
BEIS Public Attitudes Tracker (March 2021, Wave 37, UK)
13 May 2021 Official Statistics
As well as the quarterly questions on renewable energy, fracking, climate change and Net Zero, the March 2021 wave of the tracker covered some topics asked on an annual basis including further questions on climate change, energy use and smart meters. In March 2021:
40% of the public were either very worried (11%) or fairly worried (29%) about paying for energy bills, a slight increase from March 2020 (37%)
In regard to climate change in the UK, nine in ten people (89%) had noticed at least one current impact, while 8% had not noticed any impacts.
Excepting the 1% who don’t believe in climate change, 83% thought people in other countries were being affected by climate change, 70% thought people in the UK as a whole were affected and half (49%) thought their local area was affected (Figure 1).
Figure 1: How much climate change is currently affecting your local area, people in the UK as a whole, and people in other countries (among all people except those who believe there is no such thing as climate change), March 2021*
Please refer to Figure 6 for base size and question details.
What you need to know about these statistics: Face-to-face fieldwork was suspended halfway through the March 2020 wave of the tracker (wave 33) and the remaining data collection for wave 33 was carried out using the Kantar online omnibus panel. This online panel was also used between June 2020 and March 2021 (waves 34 to 37). This report only presents results collected via the online omnibus. These results should not be compared with face-to-face results from previous waves due to selection and measurement effects. See the Technical Notes for details.
BEIS Public Attitudes Tracker (March 2021, Wave 37, UK)
Uses of these statistics 67
User engagement 67
Pre-release access to statistics 67
Contact 67
3
BEIS Public Attitudes Tracker (March 2021, Wave 37, UK)
Executive summary
The key findings for the March 2021 wave of the tracker are presented below.
Net Zero
In March 2021, 62% of the public were aware of the concept of ‘Net Zero’. This is a decrease from December 2020 (76%), but remains higher than when awareness of ‘Net Zero’ was first tracked in March 2020 (52%).
Climate change
Eight in ten people (80%) in March 2021 were either very concerned (33%) or fairly concerned (47%) about climate change. The overall level of concern about climate change has remained relatively stable since June 2020.
Half of the public (51%) said they think that climate change is either entirely (13%) or mainly (38%) caused by human activity, consistent with the levels observed in March 2020.
Among all people apart from the 1% who did not believe in climate change:
•
•
•
Over six in ten (63%) thought that climate change is already having an effect in the UK.
Half (49%) thought that climate change is currently affecting people in their local area, 70% thought it was affecting people in the UK and 83% thought it was affecting people in other countries.
The impacts people most expected to occur over the next 15 to 20 years are rising sea levels or more flooding (63%), rising temperatures or hotter summers (60%) and more extreme events such as storms (60%).
• More people thought the government should have the most responsibility for tackling the effects of climate change in the UK (34%), compared with the general public (26%) and businesses (19%).
Energy security
In March 2021, people were asked how concerned they were about various issues happening in the next 10-20 years in relation to energy security. The issue of greatest concern was steep rises in energy prices (82%, up from 75% in March 2020).
Renewables
The proportion of the public who supported renewable energy in March 2021 was 79%; levels of support have remained stable since March 2020.
Most of the public continued to support each of the renewable energy sources included in the tracker in March 2021: solar (84%); off-shore wind (76%); wave and tidal (75%); on-shore wind (70%); and biomass (67%).
4
BEIS Public Attitudes Tracker (March 2021, Wave 37, UK)
Nuclear energy
In March 2021, almost four in ten people (38%) either strongly supported (12%) or supported (27%) the use of nuclear energy in the UK, whilst just under two in ten opposed it (17%, with 5% strongly opposing and 12% opposing).
Shale gas
In March 2021, 85% of people had at least some awareness of fracking, a slight decrease from December 2020 (88%).
Over a third of people (36%) opposed fracking and almost a quarter (23%) supported it. These levels of opposition and support have remained stable since June 2020.
Carbon capture and storage
Over six in ten people (65%) had at least some awareness of carbon capture and storage in March 2021. This comprised of 5% who knew a lot about it, 25% who knew a little about it, and 34% who were aware of it but don’t really know what it is.
Most people who were aware of carbon capture and storage supported it (65%). These figures are consistent with those observed in March 2020.
Energy saving and wasting
In March 2021, 78% of people gave either a lot (21%) or a fair amount (57%) of thought to energy saving at home. Two in ten (21%) gave little to no thought to this. These figures are consistent with those observed in March 2020.
Smart meters
Over nine in ten people (96%) were aware of smart meters in March 2021. Levels of awareness are consistent with March 2020, although smart meter ownership has increased from 43% to 47%.
Energy bills
In March 2021, four in ten (40%) were either very worried (11%) or fairly worried (29%) about paying for energy bills, a slight increase from March 2020 (37%).
Energy suppliers and switching
Seven in ten people (71%) in March 2021 had switched energy supplier either in the last year (26%) or over a year ago (45%). Just under a quarter (23%) said they had never switched supplier.
Corporate trust and transparency
When asked about large financial and legal businesses just under half of people trusted them a great deal or to some extent to treat their employees fairly (48%) and to be open and honest in their dealings with customers (48%) and less than a third (31%) trusted them to be open and honest about how much tax they pay.
Office for Product Safety and Standards
In March 2021, 16% of people had heard of the Office for Product Safety and Standards (OPSS), a slight increase from 14% in March 2020.
5
BEIS Public Attitudes Tracker (March 2021, Wave 37, UK)
Introduction
The Public Attitudes Tracker (PAT) survey covers public attitudes towards Department for Business, Energy and Industrial Strategy (BEIS) policies such as energy, climate change, consumer rights, artificial intelligence and workers’ rights. The survey began in March 2012 and runs four times a year. Questions on issues where attitudes are expected to shift more quickly or to be affected by seasonal changes are repeated quarterly; other questions are asked annually. The tracker is regularly reviewed to ensure that the data continue to offer valuable insight.
Until March 2020 (wave 33) the survey was conducted using in-home interviews conducted via the Kantar UK face-to-face Omnibus. However, fieldwork in March 2020 stopped early due to the outbreak of Coronavirus (COVID-19) in the UK, and the associated lockdown measures. The findings from wave 33, based on a truncated face-to-face sample, were published in May 2020.1 A parallel version of wave 33 was also conducted by web on the Kantar online omnibus. The purpose of this was to test and compare alternative methodologies with a view to deciding on the best approach for future waves, while lockdown restrictions remain in place.
At the point of publication, face-to-face survey fieldwork largely remains paused in the UK. Therefore, data for all further waves including wave 37 were also collected using the Kantar online omnibus. Fieldwork for wave 37 ran from 3 March to 11 March with a representative sample of 4,029 adults (16 and over) in the UK.
This report provides selected headline findings and highlights statistically significant differences at the 95% level for questions which were asked on the five waves where the Kantar online omnibus was used:
Wave 37 (March 2021)
Wave 36 (December 2020)
Wave 35 (September 2020)
Wave 34 (June 2020)
Wave 33 (March 2020)2
Statistically significant differences at the 95% level are also made between subgroups for wave 37.
It should be noted that any change in methodology can lead to both selection effects (that is differences due to the different sampling methods employed) and measurement effects (that is differences due to the different interview modes). Although attempts have been made to reduce the selection effects between the online and face-to-face approaches (see Technical Notes), the CAWI3 results from wave 33 to wave 37 should not be directly compared with face-to-face results from previous waves. For this reason, we have not made any direct
6
1 The March 2020 (wave 33) report can be found here: https://assets.publishing.service.gov.uk/government/uploads/system/uploads/attachment_data/file/884028/BEIS_PAT_W33_-_Key_findings_Final_.pdf2 It is worth nothing that the sample size for Wave 33 CAWI was 2,544. This was lower than the c.4,000 sample size for all other online waves. 3 Computer-assisted web interviewing
BEIS Public Attitudes Tracker (March 2021, Wave 37, UK)
comparisons with longer-term tracking measures collected via the original face-to-face surveys.
It should also be noted that fieldwork for waves 33 to 37 took place during the COVID-19 outbreak. It is unclear what effect the COVID-19 outbreak, associated lockdown measures and associated media coverage may have had on public behaviours, attitudes and perceptions towards the topics in this report across the UK.
The factors described above should be taken into consideration when interpreting these results.
Further information on the methodology used and the steps taken to minimise the risk of sample bias and adapt the questionnaire for CAWI can be found in the Technical Notes.
Alongside this report we have also provided PDF crosstabulations for the current wave.4 This includes demographic and key question subgroup comparisons for all questions. These are also available in Excel.
The wave 37 questionnaire covered the following topics:
Net Zero
Climate change
Renewables
Nuclear energy
Shale gas
Carbon capture and storage
Energy saving and wasting
Smart meters
Energy bills
Energy suppliers and switching
Corporate trust and transparency
Office for Product Safety and Standards
7
4 This data is available for wave 33, upon request.
BEIS Public Attitudes Tracker (March 2021, Wave 37, UK)
Headline findings
In this report all findings are based on wave 37 and findings are compared with previous online waves (waves 33 to 36) for questions which were asked in at least two waves. Topics covered in all five waves include:
Net Zero
Renewables
Shale gas
Climate change
Comparisons with earlier waves conducted using face-to-face methods should be avoided as the results are not fully compatible (see Introduction and Technical Notes).
8
BEIS Public Attitudes Tracker (March 2021, Wave 37, UK)
Net Zero
In June 2019, the government announced a target which will require the UK to bring all greenhouse gas emissions to net zero by 2050. A question was introduced to the tracker in March 2020 to understand the public’s awareness of the concept of “Net Zero”.
In March 2021, 62% of the public were aware of the concept of “Net Zero”, a notable decrease from December 2020 (76%) (Figure 2; Table 63). Awareness had previously increased every wave up to a peak in December 2020.The level of awareness in March 2021 (62%) was similar to the level observed in June 2020 (63%), and remains higher than it was when this measure was first included in the online tracker in March 2020 (52%).
Despite a majority of the public being aware of “Net Zero” in March 2021, their level of knowledge remained relatively low. Only 3% knew a lot about it, and 11% knew a fair amount. A quarter (25%) knew a little about “Net Zero” and 23% knew hardly anything about it. Almost a third of people (32%) had not heard of “Net Zero” before the interview.
Figure 2: Awareness of the concept of “Net Zero” (based on all people), March 2020 to March 2021*
Q220. The Government promotes the concept of ‘Net Zero’. Before today, how much, if anything, did you know about this concept?
Base: All wave respondents – March 2021 (4,029); December 2020 (4,022); September 2020 (4,033); June 2020 (4,011); March 2020 (2,544). (Asked Quarterly).
9
BEIS Public Attitudes Tracker (March 2021, Wave 37, UK)
*All questions are based on the surveys carried out on Kantar’s online omnibus in March 2021, December 2020, September 2020, June 2020 and March 2020 where applicable. Results are not comparable with earlier face to face waves, so no such comparisons are made in this report (see Technical Notes).
Awareness of ‘Net Zero’ was higher among men (70%, compared with 54% of women) and those in social grades AB (74%, compared with 51% of those in social grades DE) (Table 63).
10
BEIS Public Attitudes Tracker (March 2021, Wave 37, UK)
Climate change
The public were asked a series of questions on climate change in March 2021 which can be compared with findings based on the same questions in March 2020, also conducted via CAWI.
Results are presented under the headings below:
Concern about climate change (this question is asked every quarter)
Causes of climate change
Impact of climate change
Changing behaviour
Tackling climate change
Trust in information sources
Attitudes in relation to climate change
11
BEIS Public Attitudes Tracker (March 2021, Wave 37, UK)
Concern about climate change
In March 2021, 80% of the public said they were either very concerned (33%) or fairly concerned (47%) about climate change, a slight fall from the peak of 82% observed in September 2020. This is mainly driven by a fall in the proportion who state that they are very concerned (from 38% in September 2020 to 33% in March 2021) (Figure 3; Table 52).
In March 2021, 18% of the public said they were either not very concerned (15%) or not at all concerned (4%) about climate change, a small increase from December 2020 when 16% were unconcerned about climate change (Figure 3).
Figure 3: Concern about climate change (based on all people), March 2020 to March 2021*
Q21. How concerned, if at all, are you about current climate change, sometimes referred to as 'global warming’?
Base: All wave respondents – March 2021 (4,029); December 2020 (4,022); September (4,033); June 2020 (4,011); March 2020 (2,544). (Asked Quarterly).
*All questions are based on the surveys carried out on Kantar’s online omnibus in March 2021, December 2020, September 2020, June 2020 and March 2020 where applicable. Results are not comparable with earlier face to face waves, so no such comparisons are made in this report (see Technical Notes).
Those in higher social grades were more likely to say they were concerned about climate change (83% of those in social grades AB, compared with 75% of those in social grades DE). Levels of concern were also higher among women (84%, compared with 76% of men) (Table 52).
12
BEIS Public Attitudes Tracker (March 2021, Wave 37, UK)
Causes of climate change
In March 2021, half (51%) of the public said they thought that climate change is either entirely (13%) or mainly (38%) caused by human activity. The proportion that thought that climate change is caused entirely or mainly by human activity has remained stable since March 2020 (Figure 4; Table 53).
In March 2021, the proportion of the public that thought climate change is entirely (4%) or mainly (6%) caused by natural processes remained low at 10%, although this represents a small increase since March 2020 (from 8% to 10%). One in three (33%, unchanged since March 2020) thought that climate change is caused partly by natural processes and partly caused by human activity.
Figure 4: Whether people think climate change is caused by human activity, natural processes or both (based on all people), March 2020 and March 2021*
Q22. Thinking about the causes of climate change, which, if any, of the following best describes your opinion?
Bases: All wave respondents – March 2021 (4,029); March 2020 (2,544). (Asked Annually).
*All questions are based on the surveys carried out on Kantar’s online omnibus in March 2021, December 2020, September 2020, June 2020 and March 2020 where applicable. Results are not comparable with earlier face to face waves, so no such comparisons are made in this report (see Technical Notes).
Those in social grades ABC1 were more likely to say that climate change was caused by human activity (53%, compared with 48% of those in social grades C2DE) (Table 53).
13
BEIS Public Attitudes Tracker (March 2021, Wave 37, UK)
Impact of climate change
In March 2021, all apart from the 1% who did not believe in climate change were asked about their perceptions of its impact in the UK (Figure 5; Table 64). Just under two thirds (63%) considered that climate change is already having an impact in the UK, 14% thought that it is not yet having an impact in the UK but will do in their lifetime, and a further 15% said that it will not have an impact in their lifetime but will do for future generations in the UK. Two percent said that climate change is not happening or will never impact in the UK, and 6% said they did not know about the impact of climate change in the UK. These results remain unchanged from March 2020.
Figure 5: Views on impact of climate change in the UK (among all people except those who believe there is no such thing as climate change), March 2020 and March 2021*
Q180. Which of these describes your views about the impact of climate change in the UK?
Base: All wave respondents not saying there isn’t such a thing as climate change – March 2021 (3,977); March 2020 (2,507). (Asked Annually).
*All questions are based on the surveys carried out on Kantar’s online omnibus in March 2021, December 2020, September 2020, June 2020 and March 2020 where applicable. Results are not comparable with earlier face to face waves, so no such comparisons are made in this report (see Technical Notes).
As with overall concern about climate change, those in higher social grades were more likely to think that climate change is already having an impact in the UK (68% in social grades AB, compared with 59% in social grades DE). (Table 64).
14
BEIS Public Attitudes Tracker (March 2021, Wave 37, UK)
All apart from the 1% who did not believe in climate change were then asked how much they thought climate change is currently affecting:
Their local area
People in the UK as a whole
People in other countries
While people in other countries were seen as being more heavily affected by climate change (83% overall: 41% a great deal and 42% to some extent), half (49%) thought their local area was affected and 70% thought people in the UK as a whole were affected. There have been no notable changes on these measures between March 2020 and March 2021.
A small minority thought that climate change was having no effect on their local area (9%), on people in the UK as a whole (3%) or on people in other countries (2%) (Figure 6; Table 65).
Figure 6: How much climate change is currently affecting your local area, people in the UK as a whole, and people in other countries (among all people except those who believe there is no such thing as climate change), March 2021*
Q181. And how much, if at all, do you think climate change is currently affecting …Your local area / …People in the UK as a whole / …People in other countries
Base: All wave respondents not saying there isn’t such a thing as climate change – March 2021 (3,977). (Asked Annually).
*All questions are based on the surveys carried out on Kantar’s online omnibus in March 2021, December 2020, September 2020, June 2020 and March 2020 where applicable. Results are not comparable with earlier face to face waves, so no such comparisons are made in this report (see Technical Notes).
15
BEIS Public Attitudes Tracker (March 2021, Wave 37, UK)
Two further questions were asked of all apart from the 1% who did not believe in climate change to determine:
Thinking about the UK, have they noticed any impacts of climate change over the past few years
Which of these impacts did they think are likely to occur in the UK in the next 15 to 20 years as a result of climate change
In March 2021, the most common impacts of climate change people said they had noticed in the last few years were rising temperatures, heat or hotter summers (52%), rising sea levels or more flooding (50%) and more extreme events such as storms (49%). Other climate change related changes noticed by at least of third of people included increased coastal erosion (39%) and increased pollution (38%), while just over one in four mentioned changes in plants or wildlife, or plant or animal extinction (28%), increased wildfires (28%) and more health problems, such as asthma (26%).
Between March 2020 and March 2021, there have been declines in the proportions of people who have noticed many of these impacts in the last few years. Most notably, there have been falls in the proportion who have noticed increased flooding/rising sea levels (from 59% to 50%); more extreme events such as storms (from 55% to 49%); reduced water availability/droughts (from 23% to 18%); changes in plants or wildlife, or animal or plant extinction (from 34% to 28%); and increased health problems, such as asthma (from 32% to 26%).
On the other hand, a higher proportion of people in March 2021 said that they have noticed increased coastal erosion (from 35% in March 2020 to 39% in March 2021).
Nine in ten people (89%) had noticed at least one current impact of climate change in the UK, while 8% had not noticed any impacts. These results are similar to March 2020 (Figure 7; Table 69).
The most common expected impacts over the next 15 to 20 years were broadly consistent with perceived current impacts, although in all cases higher proportions thought these would be a problem in the future compared to now: 63% mentioned rising sea levels or more flooding, 60% rising temperatures, heat or hotter summers, and 60% more extreme events such as storms. Other common impacts expected were increased coastal erosion (55%), increased pollution (48%), and changes in plants or wildlife, or plant or animal extinction (45%). These findings remain unchanged compared with March 2020 (Figure 7).
16
BEIS Public Attitudes Tracker (March 2021, Wave 37, UK)
Figure 7: Impacts of climate change on UK noticed in past few years and thought likely to occur in the UK in the next 15-20 years (among all people except those who believe there is no such thing as climate change), March 2021*
Q182. Thinking just about the UK, have you noticed any impacts of climate change over the past few years? If so, which ones? / Q183. Which of these do you think are likely to occur in the UK in the next 15 to 20 years as a result of climate change?
Base: All wave respondents not saying there isn’t such a thing as climate change – March 2021 (3,977). (Asked Annually).
*All questions are based on the surveys carried out on Kantar’s online omnibus in March 2021, December 2020, September 2020, June 2020 and March 2020 where applicable. Results are not comparable with earlier face to face waves, so no such comparisons are made in this report (see Technical Notes).
17
BEIS Public Attitudes Tracker (March 2021, Wave 37, UK)
Changing behaviour
The public was asked whether they did any of the following actions:
Choosing to walk, cycle or use public transport more instead of using a car
Avoiding/eating less meat
Avoiding/eating less dairy produce
Avoiding/minimising throwing away food
Driving an electric or hybrid car
Thinking about the energy efficiency of appliances when making a purchase
Minimising the amount of energy used at home
Avoiding/minimising air travel.
People were first asked whether they did any of these things, without any reference to climate change. They were then asked whether they did these actions as a result of wanting to help limit the effects of climate change or for other reasons.
18
BEIS Public Attitudes Tracker (March 2021, Wave 37, UK)
From the list presented, the most common actions that people took were avoiding or minimising throwing away food (68%), minimising the amount of energy they use at home (66%) and choosing to walk, cycle or use public transport more instead of using a car (49%) (Figure 8; Table 71). The three most common behaviours are consistent with those observed in March 2020, although the proportion doing the top two has decreased between March 2020 and March 2021 (avoiding food waste: from 72% to 68%; minimising home energy use: from 70% to 66%). The proportion avoiding or minimising air travel has also fallen over this period (from 33% to 30%), which is perhaps unsurprising in the light of travel restrictions associated with Covid-19.
Although smaller proportions mentioned avoiding or eating less dairy produce, and driving an electric or hybrid car, there have been small increases between March 2020 and March 2021 in the proportion who mention these behaviours (from 14% to 16%, and from 8% to 11%, respectively).
Over nine in ten (92%) of people had done at least one of these behaviours, 62% had done at least three, and 23% had done at least five (Table 71). These findings are consistent with those observed in March 2020.
19
BEIS Public Attitudes Tracker (March 2021, Wave 37, UK)
Figure 8: Behaviours in everyday life (based on all people), March 2020 and March 2021*
Q184. Thinking now about your everyday life, do you do any of these things?
Base: All wave respondents– March 2021 (4,029); March 2020 (2,544). (Asked Annually).
*All questions are based on the surveys carried out on Kantar’s online omnibus in March 2021, December 2020, September 2020, June 2020 and March 2020 where applicable. Results are not comparable with earlier face to face waves, so no such comparisons are made in this report (see Technical Notes).
Those in higher social grades were more likely to have done at least three of these behaviours compared to those in lower social grades (68% in social grades AB, compared with 55% in social grades C2 and 61% in social grades DE). Women (68%) were also more likely than men (56%) to have done at least of three of these.
Those who were very concerned about climate change were also considerably more likely to have done at least three of these (79%, compared with 62% of those fairly concerned, 39% of those not very concerned and 26% of those not at all concerned about climate change) (Table 71).
20
BEIS Public Attitudes Tracker (March 2021, Wave 37, UK)
People citing each behaviour were then asked a follow-up question to determine whether they did this mainly because they wanted to limit the effects of climate change or for other reasons (e.g. lifestyle choice, cost, convenience, health or ethical reasons) (Figure 9; Table 72).
The proportion of people who drove an electric or hybrid car was small (11%), but 29% of this group said they did so mainly because they wanted to help limit the effects of climate change compared with 26% who did this mainly for other reasons and 36% who said it was for a mixture of these reasons.
Other actions where at least one in five cited climate change as a driving factor for the behaviour included thinking about energy efficiency of products and appliances when making a purchase, and avoiding or minimising air travel. Overall, 46% of people considered energy efficiency when making purchases and 23% of this group said this was done mainly to limit the effects of climate change; and of the 30% of people who consciously avoided or minimised air travel, 21% of this group said climate change was the main reason behind this. (Figure 9)
Figure 9: Whether people have made lifestyle changes mainly due to climate change or for other reasons (among those saying they have done each type of behaviour), March 2021*
Q185. You mentioned that you currently do [ITEM MENTIONED AT Q184]. What would you say is the main reason for this?
Base: All wave respondents who have chosen at least one of the options at Q184 (March 2021) – Avoid/minimise throwing away food (2,633); Minimise the amount of energy you use at home (2,562); Choose to walk, cycle or use public transport more instead of using a car (1,886); Think about the energy efficiency of products and appliances when making a purchase (1,821); Avoid/minimise air travel (1,216); Avoid/eat less meat (1,143); Avoid/eat less dairy products (638); Drive an electric or hybrid car (465). (Asked Annually).
*All questions are based on the surveys carried out on Kantar’s online omnibus in March 2021, December 2020, September 2020, June 2020 and March 2020 where applicable. Results are not comparable with earlier face to face waves, so no such comparisons are made in this report (see Technical Notes).
21
BEIS Public Attitudes Tracker (March 2021, Wave 37, UK)
The proportion of people driving an electric or hybrid car who said this was because they wanted to help limit the effects of climate change increased between March 2020 and March 2021 from 22% to 29%, while the proportion avoiding or minimising air travel who cited climate change as the main reason for this fell from 25% to 21% over this same period. Figure 10 displays the same findings, but this time re-based on all people surveyed. Therefore, the figures represent the proportion of all people who have made a lifestyle change which was taken mainly to help limit the effects of climate change. When based on all people, the most common actions taken mainly to reduce climate change were: minimising the amount of energy used at home (12%); thinking about the energy efficiency of products and appliances when making a purchase (10%); avoiding/minimising throwing away food (7%); and choosing to walk, cycle or use public transport more instead of using a car (6%). These results are similar to those seen in March 2020
Overall, 26% of people have made at least one behaviour change that they say has been done mainly as a result of tackling climate change. (Figure 10; Table 73).
22
BEIS Public Attitudes Tracker (March 2021, Wave 37, UK)
Figure 10: Things people said they do mainly due to climate change (based on all people), March 2020 and March 2021*
Q185. You mentioned that you currently do [ITEM MENTIONED AT Q184]. What would you say is the main reason for this?
Base: All wave respondents– March 2021 (4,029); March 2020 (2,544). (Asked Annually).
*All questions are based on the surveys carried out on Kantar’s online omnibus in March 2021, December 2020, September 2020, June 2020 and March 2020 where applicable. Results are not comparable with earlier face to face waves, so no such comparisons are made in this report (see Technical Notes).
Those in higher social grades were more likely to have made at least one change to their lifestyle where reducing climate change was the main reason (31% in social grades AB, compared with between 22% and 26% in all lower social grades).
Those who were very concerned about climate change were also considerably more likely to have taken at least one action which was mainly done to help reduce climate change (45%, compared with 22% of those fairly concerned, 6% of those not very concerned and 9% of those who were not at all concerned about climate change) (Table 73).
23
BEIS Public Attitudes Tracker (March 2021, Wave 37, UK)
Tackling climate change
In March 2021, all apart from the 1% who did not believe in climate change were asked which three behaviours they expected to have the largest impact on tackling climate change in the UK, if everyone in the UK did this. They were asked to select from the same eight options as presented in the ’Changing behaviour’ section (see above).
In March 2021, the behaviour expected to have the largest impact on tackling climate change was if everyone were to minimise energy use at home, with 50% of people selecting this as one of their three choices (Figure 11; Table 82). This was followed by everyone choosing to walk, cycle or use public transport more instead of using a car (49%) and everyone driving an electric or hybrid car (35%).
The changes expected to have the least impact if everyone did them were dietary and food-related: avoiding or eating less dairy produce (6%); avoiding or eating less meat (15%); and avoiding or minimising throwing away food (20%). Only 4% of people said they did not think any of these things would have an impact on climate change (Figure 11).
Between March 2020 and March 2021, there has been an increase in the proportion of people choosing the following three actions when asked to think about which will have the largest impact on tackling climate change, assuming everyone were to do this:
Driving an electric or hybrid car (from 30% to 35%) Thinking about the energy efficiency of products and appliances purchased (from 24%
to 29%) Minimising the amount of energy used at home (from 46% to 50%)
On the other hand, people were less likely to select avoiding food waste as one of the most effective behaviours to tackle climate change (23% in March 2020, compared with 20% in March 2021) and avoiding or minimising air travel (35% in March 2020, compared with 29% in March 2021).
24
BEIS Public Attitudes Tracker (March 2021, Wave 37, UK)
Figure 11: Changes that would have the biggest impact on tackling climate change (among all people except those who believe there is no such thing as climate change), March 2020 and March 2021*
Q186. If everybody in the UK did the following, which three of these do you think would have the biggest impact on tackling climate change in the UK?
Base: All wave respondents not saying there isn’t such a thing as climate change – March 2021 (3,977); March 2020 (2,507). (Asked Annually).
*All questions are based on the surveys carried out on Kantar’s online omnibus in March 2021, December 2020, September 2020, June 2020 and March 2020 where applicable. Results are not comparable with earlier face to face waves, so no such comparisons are made in this report (see Technical Notes).
25
BEIS Public Attitudes Tracker (March 2021, Wave 37, UK)
In March 2021, all apart from the 1% who did not believe in climate change were asked who should have most responsibility for tackling the effects of climate change:
Government, by introducing more policies to reduce the level of carbon emission
The general public, by making changes to their lifestyle
Businesses, by doing more to reduce their impact on the environment.
More people thought that the government should have the most responsibility (34%), compared with the general public (26%) and businesses (19%). Over one in five (21%) said they could not choose or did not know (Figure 12; Table 83). These findings remain consistent with those observed in March 2020.
Figure 12: Who should have most responsibility for tackling the effects of climate change (among all people except those who believe there is no such thing as climate change), March 2020 and March 2021*
Q187. Looking at this screen, which one of these do you think should have the most responsibility for tackling the effects of climate change in the UK? Base: All wave respondents not saying there isn’t such a thing as climate change – March 2021 (3,977); March 2020 (2,507). (Asked Annually).
*All questions are based on the surveys carried out on Kantar’s online omnibus in March 2021, December 2020, September 2020, June 2020 and March 2020 where applicable. Results are not comparable with earlier face to face waves, so no such comparisons are made in this report (see Technical Notes).
26
21%
19%
26%
34%
W33 CAWI(Mar 2020)
21%
19%
26%
34%
W37 CAWI(Mar 2021)
Don't know/Difficult to choose
Businesses, by doing more toreduce their impact on theenvironment
The general public, by makingchanges to their lifestyle
Government, by introducingmore policies to reduce thelevel of carbon emissions
BEIS Public Attitudes Tracker (March 2021, Wave 37, UK)
Trust in information sources
All people interviewed in March 2021 were asked how much they trusted eight different sources to provide accurate information about climate change.
People were most likely to trust scientists working at universities (with 81% trusting them a great deal or to some extent); scientific organisations such as the Royal Society and Met Office (80%); TV and radio documentaries (68%, up from 65% in March 2020); and charities or environmental/campaign groups (66%, up from 63% in March 2020).
Levels of trust were lowest for social media sites such as Facebook and Twitter (22%, up slightly from 20% in March 2020), newspaper or newspaper websites (45%) and the UK Government (59%) (Figure 13; Table 84).
Figure 13: Trust in sources to provide accurate information about climate change (based on all people), March 2021*
Q188. How much do you trust [INSERT ITEM] to provide accurate information about climate change?
Base: All wave respondents – March 2021 (4,029). (Asked Annually).
*All questions are based on the surveys carried out on Kantar’s online omnibus in March 2021, December 2020, September 2020, June 2020 and March 2020 where applicable. Results are not comparable with earlier face to face waves, so no such comparisons are made in this report (see Technical Notes).
27
BEIS Public Attitudes Tracker (March 2021, Wave 37, UK)
Attitudes in relation to climate change
All people interviewed in March 2021 were asked about the extent to which they agreed or disagreed with five attitudinal statements in relation to climate change:
It's not worth doing things to help reduce climate change if others don't do the same
There is so much conflicting information about climate change it is difficult to know what to believe
If everyone does their bit, we can reduce the effects of climate change
I have the ability to make changes in my life that could help reduce climate change
The media exaggerates the impacts of climate change
Figure 14: Agreement with statements regarding climate change (based on all people), March 2021*
Q189. How much do you agree or disagree with the following statements?
Base: All wave respondents – March 2021 (4,029). (Asked Annually).
*All questions are based on the surveys carried out on Kantar’s online omnibus in March 2021, December 2020, September 2020, June 2020 and March 2020 where applicable. Results are not comparable with earlier face to face waves, so no such comparisons are made in this report (see Technical Notes).
In March 2021, the public were most likely to agree (80%) that “If everyone does their bit, we can reduce the effects of climate change”, with 40% strongly agreeing with this statement (Figure 14; Table 93). The majority of people (71%) also agreed that “I have the ability to make changes in my life that could help reduce climate change”, with 26% strongly agreeing. A slim majority (54%) disagreed that “It’s not worth doing things to help climate change if others don’t do the same”.
28
BEIS Public Attitudes Tracker (March 2021, Wave 37, UK)
In relation to media and information about climate change, about half (52%) agreed that “There is so much conflicting information about climate change it is difficult to know what to believe”, including 15% who strongly agreed. Less than one in three of the public (30%) agreed that “The media exaggerates the impacts of climate change”. These two statements attracted the highest proportions saying they neither agreed nor disagreed (25% and 27%, respectively), suggesting a higher degree of uncertainty when it comes to attitudes about the media and information sources in relation to climate change.
There were no notable changes in these attitudes between March 2020 and March 2021.
In general, women, older people and those who were more concerned about climate change were most likely to hold supportive attitudes towards taking action to reduce climate change (Tables 94 to 98).
For example, women were more likely to agree that “If everyone does their bit, we can reduce the effects of climate change” (84%, compared with 77% of men), and that “I have the ability to make changes in my life that could help reduce climate change” (75%, compared with 66% of men). Those who were concerned about climate change were also more likely than those who were not concerned to agree with each of these statements (88% and 78%, compared with 53% and 43%, respectively). Older people aged 55 and over were more likely to agree that “If everyone does their bit, we can reduce the effects of climate change” (85%, compared with 69% of those aged 16 to 24) and to disagree that “It’s not worth doing things to help climate change if others don’t do the same” (61%, compared with 42% of those aged 16 to 24).
People from higher social grade groups were more likely to agree that “I have the ability to make changes in my life that could help reduce climate change” (75% in social grade AB compared with 65% in social grade DE).
29
BEIS Public Attitudes Tracker (March 2021, Wave 37, UK)
Energy security
In March 2021, people were asked how concerned they were about various issues happening in the next 10-20 years in relation to energy security:
Steep rises in energy prices in the future
The UK not investing fast enough in alternative sources of energy
The UK becoming too dependent on energy from other countries
UK supplies of fossil fuels not being sufficient to meet the UK's demand for them
The UK not developing technology to use existing sources of fossil fuels sufficiently
Power cuts becoming more frequent in the future
In March 2021, the issues of greatest concern to the public were steep rises in energy prices in the future (82%, up from 75% in March 2020), the UK becoming too dependent on energy from other countries (72%) and the UK not investing fast enough in alternative sources of energy (72%) (Figure 15; Table 54).
The public were slightly less concerned about UK supplies of fossil fuels not being sufficient to meet the UK’s demand for them (61%), the UK not developing technology to use existing sources of fossil fuels sufficiently (60%), and power cuts becoming more frequent in the future (54%). These results are similar to those observed in March 2020.
30
BEIS Public Attitudes Tracker (March 2021, Wave 37, UK)
Figure 15: Concern regarding statements related to the UK’s future energy security
(based on all people), March 2021*
Q23. Thinking about the next 10-20 years, how concerned, if at all, are you about...
Base: All wave respondents – March 2021 (4,029). (Asked Annually).
*All questions are based on the surveys carried out on Kantar’s online omnibus in March 2021, December 2020, September 2020, June 2020 and March 2020 where applicable. Results are not comparable with earlier face to face waves, so no such comparisons are made in this report (see Technical Notes).
Those who were very or fairly concerned about the UK becoming too dependent on energy from other countries were asked to identify specific sources of energy that concerned them in relation to this. Of those who were concerned about dependency on energy from other countries, the public were most likely to be concerned about gas (42%), followed by oil (40%, down from 45% in March 2020) and electricity (24%, up from 21% in March 2020) (Table 61). Three in ten of this group (31%) said they had no specific energy source in mind, an increase from March 2020 (27%).
31
BEIS Public Attitudes Tracker (March 2021, Wave 37, UK)
Energy infrastructure
Renewables
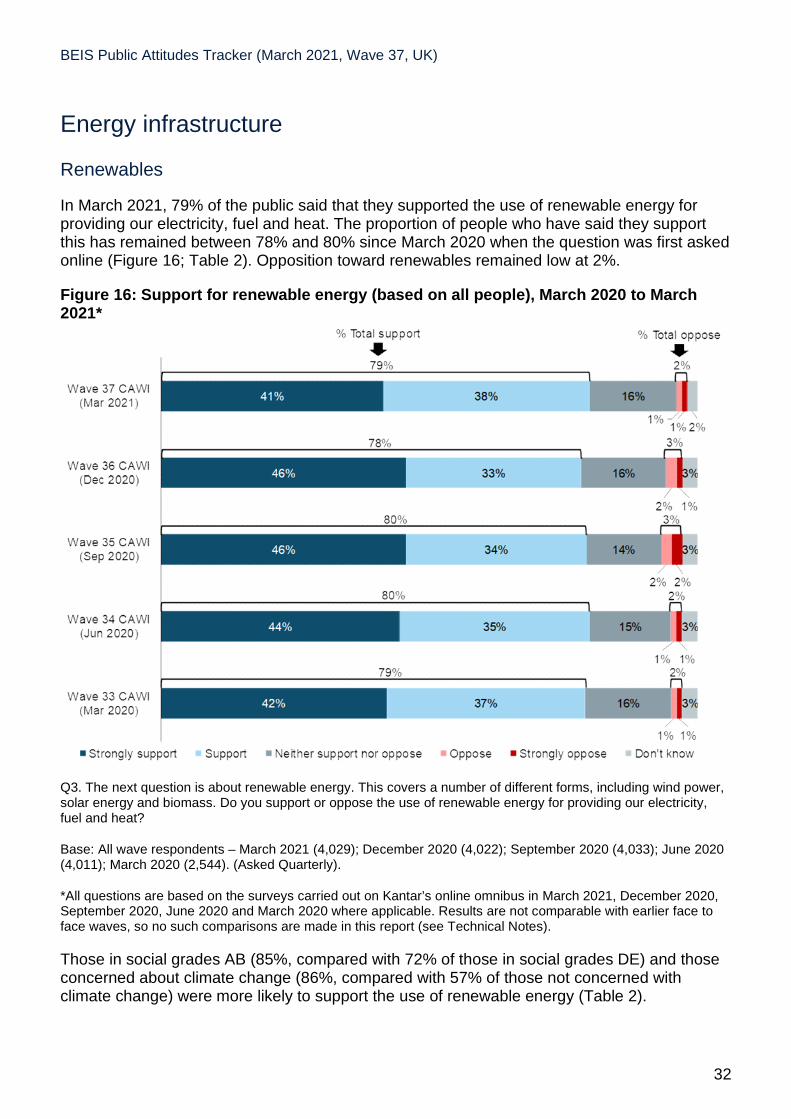
In March 2021, 79% of the public said that they supported the use of renewable energy for providing our electricity, fuel and heat. The proportion of people who have said they support this has remained between 78% and 80% since March 2020 when the question was first asked online (Figure 16; Table 2). Opposition toward renewables remained low at 2%.
Figure 16: Support for renewable energy (based on all people), March 2020 to March 2021*
Q3. The next question is about renewable energy. This covers a number of different forms, including wind power, solar energy and biomass. Do you support or oppose the use of renewable energy for providing our electricity, fuel and heat?
Base: All wave respondents – March 2021 (4,029); December 2020 (4,022); September 2020 (4,033); June 2020 (4,011); March 2020 (2,544). (Asked Quarterly).
*All questions are based on the surveys carried out on Kantar’s online omnibus in March 2021, December 2020, September 2020, June 2020 and March 2020 where applicable. Results are not comparable with earlier face to face waves, so no such comparisons are made in this report (see Technical Notes).
Those in social grades AB (85%, compared with 72% of those in social grades DE) and those concerned about climate change (86%, compared with 57% of those not concerned with climate change) were more likely to support the use of renewable energy (Table 2).
32
BEIS Public Attitudes Tracker (March 2021, Wave 37, UK)
Levels of support remained high for each of the five renewable energy developments (Figure 17; Table 15). The findings for renewable energy developments compared to when this question was last asked in September 2020 are summarised below:
Support for solar energy remained stable in March 2021 at 84%
Support for offshore wind remained stable in March 2021 at 76%.
Three-quarters (75%) of the public said they supported wave and tidal energy, a decrease from the level observed in September 2020 (79%).
Seven in ten (70%) people supported the development of on-shore wind energy, a slight decrease from the level observed in September 2020 (67%)
Support for biomass remained stable in March 2021 at 67%.
Despite decreases in support for wave and tidal energy and on-shore energy since September 2020, the proportion of people who supported each of the five renewable energy developments has remained stable since the question was first asked online in March 2020.
Figure 17: Whether support or oppose renewable energy developments (based on all people), March 2021*
Q13. Generally speaking, do you support or oppose the use of the following renewable energy developments?
Base: All wave respondents – March 2021 (4,029). (Asked Biannually).
*All questions are based on the surveys carried out on Kantar’s online omnibus in March 2021, December 2020, September 2020, June 2020 and March 2020 where applicable. Results are not comparable with earlier face to face waves, so no such comparisons are made in this report (see Technical Notes).
33
BEIS Public Attitudes Tracker (March 2021, Wave 37, UK)
Opposition levels remained very low, between 2% and 6% for all renewable energy developments.
People were also asked whether they agreed or disagreed with the following three statements regarding renewable energy:
Renewable energy industries and developments provide economic benefits to the UK
I would be happy to have a large-scale renewable energy development in my area
Renewable energy developments should provide direct benefit to the communities in which they are located
In March 2021, the proportion of the public that agreed with each of the given statements about renewable energy developments remained stable compared to March 2020. Three-quarters (75%) of the public agreed that renewable energy developments should provide direct benefit to the communities in which they are located, and 73% agreed that renewable energy industries and developments provide economic benefits to the UK (Table 11). Six in ten (59%) agreed they would be happy to have a large-scale renewable energy development in their area.
34
BEIS Public Attitudes Tracker (March 2021, Wave 37, UK)
Nuclear energy
In March 2021, 38% of the public supported using nuclear energy for generating electricity in the UK, a similar level to that seen in March 2020. This comprised 12% who strongly supported it and 27% who supported it. Under two in ten (17%) opposed the use of nuclear energy, a slight decrease from the level observed in March 2020 (19%). The proportion that neither supported nor opposed the use of nuclear energy remained stable at 34% (Figure 18; Table 27).
Figure 18: Whether support or oppose nuclear energy (based on all people), March 2020 and March 2021*
Q14a. From what you know, or have heard about using nuclear energy for generating electricity in the UK, do you support or oppose its use?
Base: All wave respondents – March 2021 (4,029); March 2020 (2,544). (Asked Annually).
*All questions are based on the surveys carried out on Kantar’s online omnibus in March 2021, December 2020, September 2020, June 2020 and March 2020 where applicable. Results are not comparable with earlier face to face waves, so no such comparisons are made in this report (see Technical Notes).
Support for nuclear energy was higher among men (49%, compared with 28% of women), those aged 65 and over (48%, compared with between 30% and 40% for those in all other age groups) and those in social grades AB (46%, compared with 31% of those in social grades DE) (Table 27).
35
BEIS Public Attitudes Tracker (March 2021, Wave 37, UK)
In March 2021, people were asked whether they agreed or disagreed with the following statements in relation to nuclear energy:
Nuclear energy provides a reliable source of energy in the UK
Nuclear energy offers affordable energy for the UK
Nuclear energy will help combat climate change in the UK
Nuclear energy provides a safe source of energy in the UK
The public were most likely to agree (strongly or slightly) that nuclear energy provides a reliable source of energy in the UK (51%) and that nuclear energy offers affordable energy for the UK (44%). Levels of agreement with these statements were similar to those observed in March 2020. Just under four in ten agreed that nuclear energy will help combat climate change in the UK (38%, an increase from 34% in March 2020) and that nuclear energy provides a safe source of energy in the UK (38%) (Figure 19; Table 21).
For each of the four statements, the proportion of respondents who neither agreed nor disagreed, or who said they didn’t know whether they agreed or disagreed, with each statement was between 38% and 44%, indicating a substantial degree of uncertainty in relation to attitudes about nuclear energy (Figure 19).
Figure 19: Agreement statements regarding nuclear energy (based on all people), March 2021*
Q14. The next questions are about nuclear energy. How much do you agree or disagree with the following statements?
Base: All wave respondents – March 2021 (4,029) (Asked Annually).
*All questions are based on the surveys carried out on Kantar’s online omnibus in March 2021, December 2020, September 2020, June 2020 and March 2020 where applicable. Results are not comparable with earlier face to face waves, so no such comparisons are made in this report (see Technical Notes).
36
BEIS Public Attitudes Tracker (March 2021, Wave 37, UK)
Overall, a quarter (25%) of people agreed with all four of these statements. Those most likely to agree with all four statements included men (32%, compared with 19% of women), those aged 65 and over (34%, compared with between 19% and 26% for all other age groups) and those in social grades AB (32%, compared with 20% of those in social grades C2 and 21% of those in social grades DE) (Table 26).
37
BEIS Public Attitudes Tracker (March 2021, Wave 37, UK)
Shale gas
In March 2021, 85% of the public had at least some awareness of hydraulic fracturing for shale gas, otherwise known as fracking, a decrease from 88% in December 2020 (Figure 20; Table 31). One in ten (9%) said they knew a lot about it, with just under half (48%) saying they knew a little. A further 15% had never heard of fracking. Awareness levels had previously remained stable at around 89% since the question was first asked online March 2020.
Figure 20: Awareness of fracking (based on all people), March 2020 to March 2021*
Q15a. Before today, how much, if anything did you know about hydraulic fracturing for shale gas, otherwise known as 'fracking’?
Base: All wave respondents – March 2021 (4,029); December 2020 (4,022); September (4,033); June 2020 (4,011); March 2020 (2,544). (Asked Quarterly).
*All questions are based on the surveys carried out on Kantar’s online omnibus in March 2021, December 2020, September 2020, June 2020 and March 2020 where applicable. Results are not comparable with earlier face to face waves, so no such comparisons are made in this report (see Technical Notes).
Men (89%, compared with 81% of women) and those aged 65 and over (96%, compared to 78% of those aged 16 to 24) were more likely to report at least some awareness of fracking in March 2021 (Table 31). These subgroup differences are consistent with previous online waves.
38
BEIS Public Attitudes Tracker (March 2021, Wave 37, UK)
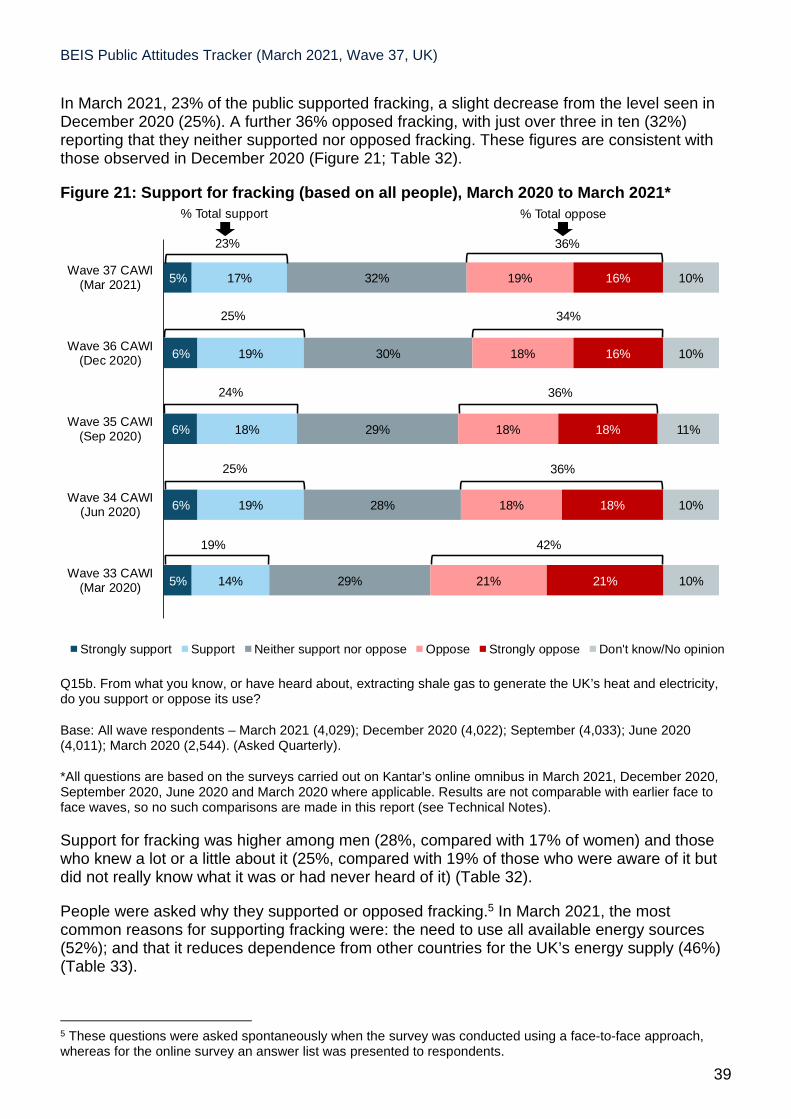
In March 2021, 23% of the public supported fracking, a slight decrease from the level seen in December 2020 (25%). A further 36% opposed fracking, with just over three in ten (32%) reporting that they neither supported nor opposed fracking. These figures are consistent with those observed in December 2020 (Figure 21; Table 32).
Figure 21: Support for fracking (based on all people), March 2020 to March 2021*
Q15b. From what you know, or have heard about, extracting shale gas to generate the UK’s heat and electricity, do you support or oppose its use?
Base: All wave respondents – March 2021 (4,029); December 2020 (4,022); September (4,033); June 2020 (4,011); March 2020 (2,544). (Asked Quarterly).
*All questions are based on the surveys carried out on Kantar’s online omnibus in March 2021, December 2020, September 2020, June 2020 and March 2020 where applicable. Results are not comparable with earlier face to face waves, so no such comparisons are made in this report (see Technical Notes).
Support for fracking was higher among men (28%, compared with 17% of women) and those who knew a lot or a little about it (25%, compared with 19% of those who were aware of it but did not really know what it was or had never heard of it) (Table 32).
People were asked why they supported or opposed fracking.5 In March 2021, the most common reasons for supporting fracking were: the need to use all available energy sources (52%); and that it reduces dependence from other countries for the UK’s energy supply (46%) (Table 33).
39
5 These questions were asked spontaneously when the survey was conducted using a face-to-face approach, whereas for the online survey an answer list was presented to respondents.
Wave 37 CAWI(Mar 2021)
Wave 36 CAWI(Dec 2020)
Wave 35 CAWI(Sep 2020)
Wave 34 CAWI(Jun 2020)
Wave 33 CAWI(Mar 2020)
5% 17%
6% 19%
19% 16%32%
6% 18%
6% 19%
18% 16%30%
29%
5% 14%
18% 18%
28%
29%
18% 18%
10%
10%
11%
21%
10%
21% 10%
Strongly support Support Neither support nor oppose Oppose Strongly oppose
% Total support
19%
Don't know/No opinion
24%
25%
25%
% Total oppose
23%
34%
36%
36%
42%
36%
BEIS Public Attitudes Tracker (March 2021, Wave 37, UK)
The main reasons for opposing fracking were: the loss and destruction of the natural environment (64%); and concern about the risk of earthquakes (52%) (Table 34). The main reason for neither supporting nor opposing fracking was not knowing enough about it (45%) (Table 35).
40
BEIS Public Attitudes Tracker (March 2021, Wave 37, UK)
Carbon capture and storage
In March 2021, 65% of the public said they were aware of carbon capture and storage, an increase from 60% in March 2020. This comprised 5% who knew a lot about it, 25% who knew a fair amount and 34% who were aware of it but didn’t really know what it was. Over three in ten (35%) had never heard of it (Figure 22; Table 28).
Figure 22: Awareness of carbon capture and storage (based on all people), March 2020
and March 2021*
Q15. How much, if anything, do you know about carbon capture and storage?
Base: All wave respondents – March 2021 (4,029); March 2020 (2,544). (Asked Annually).
*All questions are based on the surveys carried out on Kantar’s online omnibus in March 2021, December 2020, September 2020, June 2020 and March 2020 where applicable. Results are not comparable with earlier face to face waves, so no such comparisons are made in this report (see Technical Notes).
Men (76%, compared with 55% of women) and those in social grades AB (75%, compared with 53% of those in social grades DE) were more likely to be aware of carbon capture and storage (Table 28).
41
40%
34%
23%
3%
W33 CAWI(Mar 2020)
35%
34%
25%
5%
W37 CAWI(Mar 2021)
Never heard of it
Aware of it but don'treally know what it is
Know a little about it
Know a lot about it
60% 65%% Any awareness
BEIS Public Attitudes Tracker (March 2021, Wave 37, UK)
Those who knew at least a little about carbon capture and storage were asked whether they supported or opposed it. Over six in ten (65%) supported carbon capture and storage, with a further 7% opposed. A quarter (25%) neither supported nor opposed carbon capture and storage. These figures are consistent with those observed in March 2020 (Figure 23; Table 29).
Figure 23: Whether support or oppose carbon capture and storage (among those who
know a lot or a little about carbon capture and storage), March 2020 and March 2021*
Q15ai. From what you know, or have heard about using carbon capture and storage in the UK, do you support or oppose its use?
Base: All wave respondents who know a lot/a little about carbon capture and storage – March 2021 (1,304); March 2020 (721). (Asked Annually).
*All questions are based on the surveys carried out on Kantar’s online omnibus in March 2021, December 2020, September 2020, June 2020 and March 2020 where applicable. Results are not comparable with earlier face to face waves, so no such comparisons are made in this report (see Technical Notes).
Levels of support were higher among men (69%, compared with 58% of women) (Table 29).
42
BEIS Public Attitudes Tracker (March 2021, Wave 37, UK)
Energy saving and wasting
In March 2021, 78% of people gave either a lot (21%) or a fair amount (57%) of thought to energy saving at home in March 2021 (Figure 24; Table 1). Two in ten (21%) gave little to no thought to energy saving at home. These figures are consistent with those observed in March 2020.
Figure 24: Thought given to energy saving in the home (based on all people), March 2020 and March 2021*
Q2. How much thought, if any, would you say you give to saving energy in your home?
Base: All wave respondents – March 2021 (4,029); March 2020 (2,544). (Asked Annually).
*All questions are based on the surveys carried out on Kantar’s online omnibus in March 2021, December 2020, September 2020, June 2020 and March 2020 where applicable. Results are not comparable with earlier face to face waves, so no such comparisons are made in this report (see Technical Notes).
People who were concerned about climate change (82%, compared with 61% of those not concerned) and owner occupiers (81%, compared with 73% of private renters and 70% of social renters) were more likely to say they think about energy saving at home (Table 1).
People were asked whether they engaged in the following energy wasting and saving behaviours:6
Wash clothes at 30 degrees or lower (energy saving)
Try to keep rooms that you are not using at a cooler temperature than those you are using (energy saving).
43
6 People were not told which behaviours were considered energy saving or energy wasting.
BEIS Public Attitudes Tracker (March 2021, Wave 37, UK)
Leave the lights on when you are not in the room (energy wasting)
Boil the kettle with more water than you are going to use (energy wasting)
Leave the heating on when you go out for a few hours (energy wasting)
Focusing first on energy saving behaviours, in March 2021, 85% of people said that they at least occasionally wash clothes at 30 degrees or lower, while eight in ten (79%) said they at least occasionally try to keep rooms that they are not using at a cooler temperature than those they are using (Figure 25; Table 3). These figures are consistent with those observed in March 2020.
Figure 25: Whether engage in energy saving behaviours (based on all people), March 2021*
Q4. How often, if at all, do you personally do any of the following?
Base: All wave respondents – March 2021 (4,029). (Asked Annually).
*All questions are based on the surveys carried out on Kantar’s online omnibus in March 2021, December 2020, September 2020, June 2020 and March 2020 where applicable. Results are not comparable with earlier face to face waves, so no such comparisons are made in this report (see Technical Notes).
44
BEIS Public Attitudes Tracker (March 2021, Wave 37, UK)
Focusing on energy wasting behaviours, in March 2021, nearly three quarters of people (73%) said they at least occasionally boiled the kettle with more water than they were going to use, a similar figure to the one observed in March 2020. Over half said they at least occasionally leave the heating on when they go out for a few hours (55%, up from 47% in March 2020) and leave the lights on when they’re not in the room (56%, up from 52% in March 2020) (Figure 26; Table 3).
Figure 26: Whether engage in energy wasting behaviours (based on all people), March 2021*
Q4. How often, if at all, do you personally do any of the following?
Base: All wave respondents – March 2021 (4,029). (Asked Annually).
*All questions are based on the surveys carried out on Kantar’s online omnibus in March 2021, December 2020, September 2020, June 2020 and March 2020 where applicable. Results are not comparable with earlier face to face waves, so no such comparisons are made in this report (see Technical Notes).
Three in ten people (31%) said they engaged in all three energy wasting behaviours at least occasionally, an increase from 26% in March 2020. Those with children in the household (37%, compared with 29% of those without children in the household), those in social grades AB (36%, compared with 25% in social grades DE) and younger people (38% of those aged 16 to 34, compared with between 27% and 29% of those aged 35 and over) were most likely to engage in all three energy wasting behaviours at least occasionally (Table 9).
45
BEIS Public Attitudes Tracker (March 2021, Wave 37, UK)
Smart meters
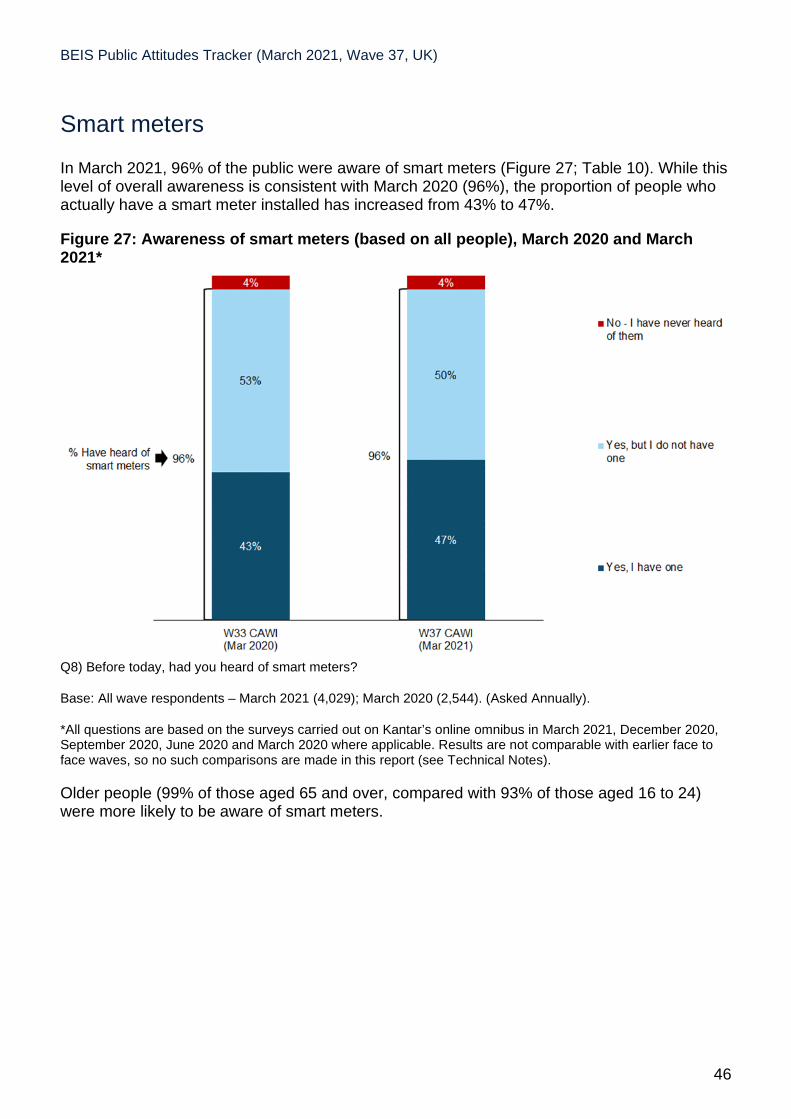
In March 2021, 96% of the public were aware of smart meters (Figure 27; Table 10). While this level of overall awareness is consistent with March 2020 (96%), the proportion of people who actually have a smart meter installed has increased from 43% to 47%.
Figure 27: Awareness of smart meters (based on all people), March 2020 and March 2021*
Q8) Before today, had you heard of smart meters?
Base: All wave respondents – March 2021 (4,029); March 2020 (2,544). (Asked Annually).
*All questions are based on the surveys carried out on Kantar’s online omnibus in March 2021, December 2020, September 2020, June 2020 and March 2020 where applicable. Results are not comparable with earlier face to face waves, so no such comparisons are made in this report (see Technical Notes).
Older people (99% of those aged 65 and over, compared with 93% of those aged 16 to 24) were more likely to be aware of smart meters.
46
BEIS Public Attitudes Tracker (March 2021, Wave 37, UK)
Energy bills and suppliers
Energy bills
In March 2021, 40% of the public were either very worried (11%) or fairly worried (29%) about paying for energy bills, a slight increase from March 2020 (37%) (Figure 28; Table 36).
Figure 28: Worries about energy bills (based on all people), March 2020 to March 2021*
Q16. Over the last three months, how worried, if at all, have you been about paying for the following…
Base: All wave respondents – March 2021 (4,029); March 2020 (2,544). (Asked Annually).
*All questions are based on the surveys carried out on Kantar’s online omnibus in March 2021, December 2020, September 2020, June 2020 and March 2020 where applicable. Results are not comparable with earlier face to face waves, so no such comparisons are made in this report (see Technical Notes).
Those aged 25 to 34 (58%, compared with between 21% and 48% for all other age groups), those in social grades C2DE (46%, compared with 34% of those in social grades AB) and private and social renters (51% and 50% respectively, compared with 36% of owner occupiers) were more likely to be worried about energy bills (Table 37).
To provide a measure of the relative level of worry about energy bills compared with other expenses, people were also asked how worried they were about food and other household shopping costs, and transport costs (including petrol/diesel and public transport costs). A measure of worry about energy compared to other costs was derived by calculating the proportion who gave a higher worry rating for energy bills than they did for the other two bills. One in ten (11%) people were more worried about energy bills than both food and other household shopping bills and transport costs; this figure has increased from 8% in March 2020 (Table 41).
47
BEIS Public Attitudes Tracker (March 2021, Wave 37, UK)
Those who were more worried about paying for their energy bills than other items were asked their reasons for being most worried about energy bills. In March 2021, 56% of people said this was because energy bills were more expensive than other items, while 53% felt that they cannot easily ‘go without’ energy like they can for some of the other items (Table 42).
48
BEIS Public Attitudes Tracker (March 2021, Wave 37, UK)
Energy suppliers and switching
In March 2021, respondents were asked whether they trusted energy suppliers to do the following:
Give customers a fair deal
Provide you with a bill which accurately reflects the energy you have used
Provide a breakdown of the components of your bill
Inform you about the best tariff for you
Improve your home to make it more energy efficient, if you paid them to do this – for example through installing different technologies to reduce heat loss, or generate electricity
Provide impartial and accurate advice on energy efficiency measures
People were most likely to trust (a lot or a fair amount) suppliers to provide them with a bill which accurately reflects the energy they have used (72%) and to provide a breakdown of the components of their bill (70%) (Figure 29; Table 44).
Figure 29: Trust statements on energy suppliers (based on all people) March 2021*
Q18. How much, if at all, do you trust your energy supplier to do the following?
Base: All wave respondents – March 2021 (4,029). (Asked Annually).
*All questions are based on the surveys carried out on Kantar’s online omnibus in March 2021, December 2020, September 2020, June 2020 and March 2020 where applicable. Results are not comparable with earlier face to face waves, so no such comparisons are made in this report (see Technical Notes).
49
BEIS Public Attitudes Tracker (March 2021, Wave 37, UK)
People were least likely to trust energy suppliers to improve their home to make it more energy efficient, if paid to do so (43%). Levels of trust in energy suppliers in March 2021 were similar to those observed in March 2020 (Figure 30; Table 44).
Figure 30: Trust statements on energy suppliers (based on all people) March 2021*
Q18. How much, if at all, do you trust your energy supplier to do the following?
Base: All wave respondents – March 2021 (4,029). (Asked Annually).
*All questions are based on the surveys carried out on Kantar’s online omnibus in March 2021, December 2020, September 2020, June 2020 and March 2020 where applicable. Results are not comparable with earlier face to face waves, so no such comparisons are made in this report (see Technical Notes).
In March 2021, 24% of the public trusted (a lot or a fair amount) energy suppliers across all six measures (Table 51).
50
BEIS Public Attitudes Tracker (March 2021, Wave 37, UK)
The public were asked about their history of switching gas or electricity supplier. In March 2021, a quarter (26%) of the public said they have switched supplier in the last year, with a further 45% saying they have switched supplier but more than a year ago (Figure 31; Table 43). These findings are consistent with those seen in March 2020. Just under a quarter (23%) said they have never switched supplier, a slight decrease from 26% in March 2020.
Figure 31: Whether respondent has switched supplier (based on all people), March 2020
and March 2021*
Q17a. Thinking about your gas and electricity supplier, have you switched your supplier for either or both of these?
Base: All wave respondents – March 2021 (4,029); March 2020 (2,544). (Asked Annually).
*All questions are based on the surveys carried out on Kantar’s online omnibus in March 2021, December 2020, September 2020, June 2020 and March 2020 where applicable. Results are not comparable with earlier face to face waves, so no such comparisons are made in this report (see Technical Notes).
Those more likely to have switched at any stage included those aged 65 and over (82%, compared with 46% of those aged 16 to 24) and homeowners (78%, compared with 57% of private renters and 59% of social renters).
51
BEIS Public Attitudes Tracker (March 2021, Wave 37, UK)
Corporate trust and transparency
BEIS is also responsible for the policy area of corporate trust and transparency. To measure attitudes towards this, the public were asked how much they trust large financial and legal businesses to:
Treat all their employees fairly
Be open and honest in their dealings with customers
Act in a socially responsible way
Tell the truth
Be open and honest about how much tax they pay
The public were most likely to trust (a great deal or to some extent) these businesses to treat their employees fairly (48%, up from 45% in March 2020), to be open and honest in their dealings with customers (48%, up from 42% in March 2020) and to act in a socially responsible way (46%, up from 42% in March 2020). They were least likely to trust these businesses to be open and honest about how much tax they pay (34%), though the proportion of people who would trust businesses to do this has increased since March 2020 (31%) (Figure 32; Table 99).
Figure 32: Trust statements on large businesses (based on all people), March 2021*
Q190. Please now think about large financial and legal businesses, such as larger accountancy, law and banking firms. How much do you trust these types of businesses in the UK to …tell the truth / …be open and honest in their dealings with customers / …act in a socially responsible way / …be open and honest about how much tax they pay / …treat all their employees fairly
Base: All wave respondents – March 2021 (4,029)
52
BEIS Public Attitudes Tracker (March 2021, Wave 37, UK)
*All questions are based on the surveys carried out on Kantar’s online omnibus in March 2021, December 2020, September 2020, June 2020 and March 2020 where applicable. Results are not comparable with earlier face to face waves, so no such comparisons are made in this report (see Technical Notes).
Two in ten (21%) people trusted businesses on all five of these measures (Table 105), with 26% of people saying they did not trust businesses on any of these five measures (Table 106).
53
BEIS Public Attitudes Tracker (March 2021, Wave 37, UK)
Office for Product Safety and Standards
The Office for Product Safety and Standards (OPSS) was created in January 2018 to deliver
54
consumer protection and to support business confidence, productivity and growth. In March 2021, people were asked questions to understand public awareness and trust in the Office for Product Safety and Standard (OPSS). They were first presented with a list of consumer organisations and public authorities and asked which, if any, they had heard of. In March 2021, 16% of the public had heard of the Office for Product Safety and Standards (OPSS), a slight increase from 14% in March 2020 (Figure 33; Table 107).
People were more likely to be aware of all other consumer organisations and the most familiar to the public were: Citizens Advice/CAB (76%, down from 79% in March 2020); Trading Standards (72%); Which? (70%, down from 74% in March 2020); Ofcom (70%, down from 73% in March 2020); and the Ombudsman (67%).
BEIS Public Attitudes Tracker (March 2021, Wave 37, UK)
Figure 33: Awareness of consumer organisations and public authorities that protect consumers or provide information or help if things go wrong (based on all people), March 2020 and March 2021*
Q200) The screen shows a list of consumer organisations and public authorities that protect consumers or provide information or help if things go wrong. Which organisations have you heard of?
Base: All wave respondents – March 2021 (4,029); March 2020 (2,544). (Asked Annually).
*All questions are based on the surveys carried out on Kantar’s online omnibus in March 2021, December 2020, September 2020, June 2020 and March 2020 where applicable. Results are not comparable with earlier face to face waves, so no such comparisons are made in this report (see Technical Notes).
Owner occupiers (17%, compared with 13% of private renters and 14% of social renters) were most likely to have heard of OPSS (Table 107).
Those who said they had heard of OPSS were asked:
In what ways they had seen or read about the OPSS
Whether they trust the OPSS to protect consumers from unsafe products
55
BEIS Public Attitudes Tracker (March 2021, Wave 37, UK)
Of those who had heard of the OPSS, people were most likely to have seen or read something about the OPSS in a newspaper or on TV (39%). Others said they had read guidance published by them (19%, up from 14% in March 2020), had seen an advert about them (14%), visited their website (12%, up from 6% in March 2020), or been in contact with them by phone or email (7%) (Table 108). One in five people (21%) who had heard of OPSS could not recall having seen or read anything about them.
In March 2021, just under eight in ten (77%) of those who had heard of the OPSS said they either trusted it a great deal (25%) or to some extent (52%), a fall from 84% in March 2020. Overall, 7% of this subgroup said they did not have much trust in the OPSS and 2% said they had no trust at all (Table 110).
56
BEIS Public Attitudes Tracker (March 2021, Wave 37, UK)
Technical information
Technical notes
This report provides selected headline findings and highlights statistically significant differences at the 95% level for the five waves where the Kantar online omnibus was used:
Wave 37 (March 2021)
Wave 36 (December 2020)
Wave 35 (September 2020)
Wave 34 (June 2020)
Wave 33 (March 2020)
Statistically significant differences at the 95% level are also made between subgroups for wave 37.
Percentages included on charts in this report may not add up to 100% due to rounding, the exclusion of some categories (e.g. ‘Don’t know’ and ‘Refused’) and the option for more than one response to be selected at some questions. Similarly, percentages based on aggregating categories (for example ‘strongly support’ and ‘support’) may not always reflect the sum of the individual answer categories.
This report is not an exhaustive overview of the findings. Please refer to the accompanying Excel dataset and PDF/Excel cross tabulation tables for waves 34 to 37, along with the wave 33 (web) Excel dataset to see full responses to all survey questions.
Until March 2020 (wave 33) the survey was conducted using in-home interviews conducted via the Kantar UK face-to-face Omnibus. However, fieldwork in March 2020 stopped early due to the outbreak of Coronavirus (COVID-19) in the UK, and the associated lockdown measures. The findings from wave 33, based on a truncated face-to-face sample, were published in May 2020.7 A parallel version of wave 33 was also conducted by web on the Kantar online omnibus. The purpose of this was to test and compare alternative methodologies with a view to deciding on the best approach for future waves, while lockdown restrictions remain in place.
At the point of publication, face-to-face survey fieldwork largely remains paused in the UK. Therefore, data for wave 37 were also collected using the Kantar online omnibus. Web-based fieldwork for wave 37 ran from 3 March to 11 March with a representative sample of 4,029 adults (16 and over) in the UK.
The Kantar online omnibus primarily uses the Kantar online access panel as the sample source. The Kantar panel is part of an association of quality-conscious panel providers that work together to fulfil sample requirements that cannot be met by a single provider within the required timescales. For this survey the Kantar panel was supplemented with Lucid, which has been vetted by Kantar as reputable and offering high-quality sample. The representativeness
57
7 The March 2020 (wave 33) report can be found here: https://assets.publishing.service.gov.uk/government/uploads/system/uploads/attachment_data/file/884028/BEIS_PAT_W33_-_Key_findings_Final_.pdf
BEIS Public Attitudes Tracker (March 2021, Wave 37, UK)
of the data was controlled through sample design, fieldwork quotas and post-fieldwork weighting. Quotas were set by age and gender and the sample was pre-stratified by region. Data were weighted for the following characteristics: sex, age, social grade, region, tenure, property type, main way the property is heated and whether there is someone with a long-standing illness or disability in the household. Results included here are based on data which have been weighted to reflect the UK population aged 16+.
Using online access panels to source sample brings a number of benefits. These include allowing for data collection while social distancing measures are in place, speed, cost-efficiency, and in helping to minimise social desirability bias (as there is no interviewer present). However, it is important to flag that there are some potential downsides to this approach as well:
There is a risk that online panellists are not representative of the general population:
People volunteer to join online access panels and this approach may therefore be particularly prone to self-selection bias
Online panel surveys exclude the off-line population
Panellists can become “experienced” participants to repeated surveys
With this type of sample, the accuracy of estimates is conditional on the assumption that the combined effects of sampling, fieldwork protocols, quota application, and weighting have successfully eradicated biasing selection effects on the data. However, this assumption is untestable without substantial – and impractical – expenditure on collecting benchmark data using a random probability sampling approach.
The steps we have taken to minimise the risk of bias are as follows:
The Kantar panel uses a diverse set of recruitment sources and a variety of recruitment methods. This includes opt-in email, co-registration, e-newsletter campaigns, and traditional banner placements.
The sample was stratified by region before it was drawn. This helped to ensure that the final sample reflected, as far as possible, the regional profile of the general population.
From wave 35 onwards, panel members who had taken part in previous online waves were exempt from taking part in subsequent waves of the survey. This was to prevent panel conditioning which presents a risk to survey measurement as respondents may answer differently as a result of having participated in prior waves8. It should be noted that this did not occur between waves 33 and 34, and this should be considered when viewing the results.
Quotas were set to compensate for known biases in online panels. Younger people and men are generally under-represented on online panels, so we set an interlocking quota by age and gender.
58
8 For example, a respondent may have said that they have no awareness of shale gas at wave 34, but may feel they have an idea of what shale gas is at wave 35 solely because they answered a question on it at that wave 34. Alternatively, a respondent who has no awareness of shale gas at wave 34 may do some research into shale gas after completing the survey to find out more about it, and so would genuinely know more about it at the next wave.
BEIS Public Attitudes Tracker (March 2021, Wave 37, UK)
Weighting was applied to ensure that the demographic profile of our sample matched the profile of the UK population aged 16+.
The weighting matrix for the face-to-face surveys includes age by gender, region, social grade, and housing tenure. With this standard weighting applied there remained some large differences between the profile of the online sample and the profile recently achieved using face-to-face data collection. For this reason, it was decided to add the following variables to the weighting matrix – property type, main way the property is heated and whether there is someone with a long-standing illness or disability in the household. The online sample was weighted to match the profile achieved in recent waves of the face-to-face survey.
The variables included in the weighting matrix (and the source of the benchmark statistics) were as follows:
Age by Gender - ONS Mid-Year Population Estimates 2019
Region (former Government Office Region) - ONS Mid-Year Population Estimates 2019
Social Grade – Kantar TGI (Jan 19 - Dec 19)
Housing tenure – ONS Annual Population Survey (Jan 19 - Dec 19)
Property type (waves 30 to 33 of the face-to-face PAT survey)
Main way property is heated (waves 30 to 33 of the face-to-face PAT survey)
Long-standing illness or disability in the household (waves 30 to 33 of the face-to-face PAT survey)
It should be noted that the weighting only corrects for observed bias (for the set of variables included in the weighting matrix) and there is a risk of unobserved bias. Furthermore, the raking algorithm used for the weighting only ensures that the sample margins match the population margins. There is no guarantee that the weights will correct for bias in the relationship between the variables.
Comparisons with previous waves using face-to-face data collection.
The online and face-to-face results are not directly comparable for two reasons: selection effects (that is differences in the types of individuals that responded due to the different sampling methods employed) and measurement effects (that is differences in responses given by the same individuals due to the different interview modes).
Our weighting design attempts to reduce the selection effects between the online and face-to-face approaches (by weighting the online sample to match the face-to-face sample). However, it is likely that unobservable differences remain between the two samples.
When it comes to measurement effects, differences in results could be caused by a number of factors (see below). Measurement effects cannot be ameliorated by weighting, although it is sometimes possible to estimate their direction and scale and (at least partially) account for them in analysis.
Some examples of measurement effects:
Face-to-face and telephone interviewers can provide motivation or clarification when required; this cannot truly be replicated online.
59
BEIS Public Attitudes Tracker (March 2021, Wave 37, UK)
People who would not disclose sensitive personal information or socially undesirable opinions/behaviours to an interviewer may be more willing to provide this information online.
Where a response scale is used (e.g. running from “strongly agree” to “strongly disagree”), interview respondents are generally more likely to select a ‘strong’ response – at either end of the scale – than they would if they were completing the survey online.
For logistical reasons, the questionnaire has to be adapted slightly for each mode and this can affect measurement:
• Long questions or response lists are not suitable for smartphone presentation and need to be edited in some cases.
• Unprompted questions (‘do not show screen’) have to be converted into prompted versions for online presentation which will limit compatibility.
• Presentation of “don’t know” answer codes: In CAPI and CATI these are usually collected as spontaneous codes, i.e. the interviewer will only select these if the respondent mentions it. However, on CAWI these codes have to be available more obviously for respondents (though they can be ‘hidden’ in the initial presentation).
While an attempt was made to ensure comparability between presentation of questions on face-to-face and CAWI, inevitably some of the differences outlined above remained.
It should also be noted that fieldwork for waves 33 to 37 took place during the COVID-19 outbreak. It is unclear what effect the COVID-19 outbreak, associated lockdown measures and associated media coverage may have had on public behaviours, attitudes and perceptions towards the topics in this report across the UK.
60
BEIS Public Attitudes Tracker (March 2021, Wave 37, UK)
Fieldwork dates and sample sizes
61
Wave Fieldwork dates Sample sizes
Wave 1 (Mar 2012) 21 to 25 March 2012 2,121
Wave 2 (Jun 2012) 27 June to 1 July 2012 2,100
Wave 3 (Sep 2012) 26 to 30 September 2012 2,118
Wave 4 (Dec 2012) 12 December 2012 to 2 January 2013
2,107
Wave 5 (Mar 2013) 27 to 31 March 2013 2,051
Wave 6 (Jul 2013) 3 to 7 July 2013 2,124
Wave 7 (Sep 2013) 25 to 29 September 2013 2,103
Wave 8 (Dec 2013) 11 to 15 December 2013 2,110
Wave 9 (Mar 2014) 26 to 30 March 2014 2,040
Wave 10 (Jun 2014) 25 to 29 June 2014 2,087
Wave 11 (Sep 2014) 24 to 28 September 2014 2,103
Wave 12 (Dec 2014) 10 December 2014 to 8 January 2015
2,119
Wave 13 (Mar 2015) 18 to 29 March 2015 1,981
Wave 14 (Jun 2015) 24 to 28 June 2015 2,118
Wave 15 (Sep 2015) 23 to 27 September 2015 2,121
Wave 16 (Dec 2015) 9 to 13 December 2015 2,121
Wave 17 (Mar 2016) 23 to 27 March 2016 2,105
Wave 18 (Jun 2016) 29 June to 3 July 2016 2,114
BEIS Public Attitudes Tracker (March 2021, Wave 37, UK)
Wave 19 (Sep 2016) 28 September to 2 October 2016 2,080
62
Wave 20 (Dec 2016) 14 to 18 December 2016 2,138
Wave 21 (Mar 2017) 29 March to 2 April 2017 2,180
Wave 22 (Jun 2017) 30 June to 4 July 2017 2,097
Wave 23 (Sep 2017) 27 September to 1 October 2017 2,105
Wave 24 (Dec 2017) 13 to 17 December 2017 2,078
Wave 25 (Mar 2018) 28 March to 6 April 2018 2,102
Wave 26 (Jul 2018) 11 to 17 July 2018 4,2689
Wave 27 (Sep 2018) 19 to 30 September 2018 4,258
Wave 28 (Dec 2018) 5 to 16 December 2018 4,273
Wave 29 (Mar 2019) 13 to 24 March 2019 4,224
Wave 30 (Jun 2019) 5 to 16 June 2019 4,231
Wave 31 (Sep 2019) 11 to 22 September 2019 4,201
Wave 32 (Dec 2019) 4 to 22 December 2019 4,212
Wave 33 (Mar 2020) 11 to 17 March 2020 1,851
Wave 33 CAWI (Mar 2020) 3 April to 7 April 2020 2,544
Wave 34 CAWI (Jun 2020) 4 June to 9 June 2020 4,011
Wave 35 CAWI (Sep 2020) 2 to 8 September 2020 4,033
Wave 36 CAWI (Dec 2020) 3 to 8 December 2020 4,022
Wave 37 CAWI (Mar 2021) 3 to 11 March 2021 4,029
9 The sample size increased to c. 4,200 from Wave 26 (July 2018) onwards to allow greater scope for regional analysis.
BEIS Public Attitudes Tracker (March 2021, Wave 37, UK)
Definitions
Base The number of people answering a survey question.
63
Carbon capture and storage
The process of capturing and storing carbon dioxide (CO2) emissions produced from the use of fossil fuels before it is released into the atmosphere.
CAWI Computer-assisted web interviewing.
Climate change Long-term shift in the planet’s weather patterns and rising average global temperatures.
Cognitive testing An in-depth interviewing method to determine the reliability and validity of survey questions.
Condensing boilers Water heating appliances that are run on either gas or oil, to improve energy efficiency.
Corporate trust and transparency
Public trust in UK corporations to tell the truth, to be open and honest in their dealings with customers, to act in a socially responsible way, to be open and honest about how much tax they pay, and to treat their employees fairly.
Energy
infrastructureA term used to capture a range of different energy sources that are covered by the survey and the interconnections between them. This includes a range of renewable sources (on-shore and off-shore wind, solar, wave and tidal, and biomass), nuclear, shale gas, and carbon capture and storage as well as the pipeline and other interconnectors between them.
Energy security The UK’s ability to secure sufficient, affordable, and consistent energy supplies.
Fieldwork The period where face-to-face interviews are conducted.
Net Zero Net zero means that the UK’s total greenhouse gas (GHG) emissions would be equal to or less than the emissions the UK removed from the environment. This can be achieved by a combination of emission reduction and emission removal.
The new Net Zero target was announced by the government in June 2019, which requires the UK to bring all greenhouse gas emissions to net zero by 2050.
Nuclear energy The energy released during nuclear fission or fusion, mainly to generate electricity.
Omnibus survey A method of quantitative survey research where data on a wide variety of subjects submitted by a range of funders is collected during the same interview.
OPSS The Office for Product Safety and Standards. The OPSS identifies consumer risks and reinforces the UK’s safety standards to protect consumers when products need to be repaired or replaced.
Quotas A target number of interviews for a certain characteristic during survey fieldwork (e.g. age).
BEIS Public Attitudes Tracker (March 2021, Wave 37, UK)
Random location quota sampling
A form of quota sampling that combines elements of random sampling and quota sampling. Once a random sample is drawn, interviewers are tasked with interviewing a range of subgroups across different timing patterns based on a pre-agreed number of respondents.
64
Representativeness Similarity of the sample profile to benchmark population statistics, such as the Office for National Statistics mid-year population estimates.
Sample size The number of people included in the sample (a subset of the population).
Shale gas and fracking
Shale gas is natural gas found in shale, a non-porous rock which does not allow the gas to escape. Hydraulic fracturing or “fracking” is a process of pumping water at high pressure into shale to create narrow fractures which allow the gas to be released and captured. The gas can then be used for electricity and heating.
Social grade Social grade is a classification system based on occupation. It contains the following categories:
A: Higher managerial, administrative and professional
B: Intermediate managerial, administrative and professional
C1: Supervisory, clerical and junior managerial, administrative and professional
C2: Skilled manual workers
D: Semi-skilled and unskilled manual workers
E: State pensioners, casual and lowest grade workers, unemployed with state benefits only
Statistical significance
A statistical test to determine whether relationships observed between two survey variables are likely to exist in the population from which the sample is drawn. We only report on findings that are statistically significant at the 95% level.
Survey outputs The key deliverables from the survey. This includes:
A key finding report, presenting summary headline findings from March 2021.
Summary tables (Excel), showing trends across all waves of the tracker.
An Excel dataset containing questionnaire variables, demographic variables and derived variables for further analysis. An SPSS version of the dataset is available upon request.
Excel label data (CSV), containing labels for all variables.
Excel numeric data (CSV), containing numeric values for all variables.
BEIS Public Attitudes Tracker (March 2021, Wave 37, UK)
Cross tabulation tables (PDF and Excel) for the current wave, including demographic and key question subgroup comparisons for all questions.
65
Weighting An adjustment made to the data to ensure that survey results are representative of the target population (in this case, all UK adults).
BEIS Public Attitudes Tracker (March 2021, Wave 37, UK)
Further information
Future updates to these statistics
Results from the Public Attitudes Tracker are published quarterly. The next wave is scheduled to be published in August, but this will be subject to change as it will be the first wave under a new contract for the survey. Please note that not all Tracker questions are included in each wave.
Revisions policy
The BEIS statistical revisions policy sets out the revisions policy for these statistics, which has
66
been developed in accordance with the UK Statistics Authority Code of Practice for Statistics.
Related Statistics
There are various other surveys which seek the general public’s opinion on topics related to those covered by the BEIS Public Attitudes Tracker. These include:
Public Attitudes to Science
A collection of studies looking at the UK public’s attitudes to science, scientists and science policy.
Public attitudes towards transport
The department for transport publishes a wide range of reports on the public’s attitude to various modes of transport.
Biannual Public Attitudes Tracker - Food Standards Agency
This survey monitors changes in consumer attitudes to food-related issues in England, Wales and Northern Ireland.
The English Housing Survey
The English Housing Survey is a continuous national survey commissioned by the Ministry of Housing, Communities and Local Government (MHCLG). It collects information about people’s housing circumstances and the condition and energy efficiency of housing in England. There are some waves of the PAT which cover similar topics such as the number of households with condensing boilers.
BEIS also publishes a wealth of energy statistics which provide context for the attitude data collected by the PAT. These are available on the Statistics at BEIS website.
BEIS Public Attitudes Tracker (March 2021, Wave 37, UK)
Uses of these statistics
These statistics are used by BEIS to guide BEIS policy, by many academics in their related studies, by ministers and by the general public. Some examples on the uses of previous waves of the PAT include
Monitoring attitudes towards fracking by policy makers, the media and local groups to understand how this is changing over time and the reasons why people support or oppose it.
Understanding public awareness of key BEIS policies such as the concept of net zero.
Monitoring public attitudes to climate change and government policies associated with this and understanding how concern varies between demographic groups.
Understanding public acceptability of different renewable energy sources which contribute to the government’s aim to reduce the dependence on fossil fuels.
User engagement
Users are encouraged to provide comments and feedback on how these statistics are used and how well they meet user needs. Comments on any issues relating to this statistical release are welcomed and should be sent to: [email protected].
67
The BEIS statement on statistical public engagement and data standards sets out the department’s commitments on public engagement and data standards as outlined by the Code of Practice for Statistics.
Pre-release access to statistics
Some ministers and officials receive access to these statistics up to 24 hours before release. Details of the arrangements for doing this and a list of the ministers and officials that receive pre-release access to these statistics can be found in the BEIS statement of compliance with the Pre-Release Access to Official Statistics Order 2008.
This publication is licensed under the terms of the Open Government Licence v3.0 except where otherwise stated. To view this licence, visit nationalarchives.gov.uk/doc/open-government-licence/version/3 or write to the Information Policy Team, The National Archives, Kew, London TW9 4DU, or email: [email protected].
Where we have identified any third-party copyright information you will need to obtain permission from the copyright holders concerned.
This publication is available from: https://www.gov.uk/government/collections/public-attitudes-tracking-survey
If you need a version of this document in a more accessible format, please email [email protected]. Please tell us what format you need. It will help us if you say what assistive technology you use.