46

1
BELLSOUTH TELECOMMUNICATIONS, INC. 1
DIRECT TESTIMONY OF ALPHONSO J. VARNER 2
BEFORE THE ALABAMA PUBLIC SERVICE COMMISSION 3
FILED JANUARY 20, 2004 4
DOCKET NO. 29054 PHASE II 5
6
Q. PLEASE STATE YOUR NAME, YOUR POSITION WITH BELLSOUTH 7
TELECOMMUNICATIONS, INC. (“BELLSOUTH”) AND YOUR BUSINESS 8
ADDRESS. 9
10
A. My name is Alphonso J. Varner. I am employed by BellSouth as Assistant 11
Vice President in Interconnection Services. My business address is 675 12
West Peachtree Street, Atlanta, Georgia 30375. 13
14
Q. PLEASE SUMMARIZE YOUR BACKGROUND AND EXPERIENCE. 15
16
A. I graduated from Florida State University in 1972 with a Bachelor of 17
Engineering Science degree in systems design engineering. I 18
immediately joined Southern Bell in the division of revenues organization 19
with the responsibility for preparation of all Florida investment separations 20
studies for division of revenues and for reviewing interstate settlements. 21
22
Subsequently, I accepted an assignment in the rates and tariffs 23
organization with responsibilities for administering selected rates and 24
tariffs including preparation of tariff filings. In January 1994, I was 25

2
appointed Senior Director of Pricing for the nine-state region. I was 1
named Senior Director for Regulatory Policy and Planning in August 1994. 2
In April 1997, I was named Senior Director of Regulatory for the nine-state 3
BellSouth region. I accepted my current position in March 2001. 4
5
Q WHAT IS THE PURPOSE OF YOUR TESTIMONY? 6
7
A. The purpose of my testimony is to: 8
• Demonstrate to the Alabama Public Service Commission (“the 9
Commission”) that, based on performance data for the last twelve 10
months (November 2002 through October 2003), BellSouth’s Loop 11
Provisioning performance, including Hot Cuts, does not pose a barrier 12
to market entry for Competitive Local Exchange Carriers (“CLECs”) 13
seeking to serve customer locations with voice-grade loops; 14
• Propose changes to the existing performance measurements plan to 15
produce even more performance data to increase performance 16
monitoring of BellSouth’s batch hot cut process and the coordinated 17
and non-coordinated hot cuts performed by BellSouth. 18
• Propose changes to the Self Effectuating Enforcement Mechanism 19
(SEEM) related to hot cuts. 20
21
Q. HOW IS YOUR TESTIMONY ORGANIZED? 22
23
A. My testimony is organized into three major sections. Section I primarily 24
contains overall loop performance data for a comprehensive set of 25

3
Ordering, Provisioning, and Maintenance & Repair measures. In that 1
section, I also briefly address cross-connect and collocation performance. 2
In Section II, I concentrate on loop performance specifically related to hot 3
cuts, including batch hot cuts, to demonstrate BellSouth’s ability to 4
perform these conversions in an effective and timely manner. Finally, in 5
Section III, I will discuss BellSouth’s proposed changes and additions to 6
performance measures and SEEM, if it receives unbundled switching 7
relief. 8
9
I. BELLSOUTH’S CURRENT LOOP PROVISIONING PERFORMANCE 10
11
A. BellSouth’s Performance Measures 12
Q. WHAT EMPIRICAL EVIDENCE DOES BELLSOUTH PRESENT TO 13
SHOW THAT BELLSOUTH’S LOOP PROVISIONING PERFORMANCE 14
IS NOT AN OPERATIONAL BARRIER TO CLECS ENTERING THE 15
MARKET WITHOUT UNBUNDLED CIRCUIT SWITCHING? 16
17
A. My testimony presents performance data generated by measurements 18
approved by this Commission to demonstrate that loop provisioning is not 19
an operational barrier to UNE-Loop (UNE-L) market entry. Data are 20
provided for the period November 2002 through October 2003. A detailed 21
discussion of the Alabama performance results is contained in Exhibit 22
AJV-1. 23
24
25

4
In addition, because there may be instances where the volumes reported 1
in Alabama are low for the sub-metrics provided in this filing, I have also 2
provided the performance results filed on December 23, 2003 with the 3
Georgia Public Service Commission in a similar proceeding (Docket No. 4
17730-U) attached as Exhibit AJV-4. This will provide the Commission 5
with supplementary information in cases where the volumes in Georgia 6
may be more meaningful than the Alabama volumes. 7
8
Q. DO THE CLECS HAVE EMPIRICAL EVIDENCE TO DEMONSTRATE 9
BELLSOUTH’S ABILITY TO PROVIDE UNBUNDLED LOOPS? 10
11
A. Yes. The CLECs have access to most of the CLEC aggregate data that I 12
present here, and can collect data on their own transactions with 13
BellSouth. While I obviously have not seen the CLECs’ testimony in this 14
proceeding, past proceedings indicate that the CLECs do not produce 15
data of their own or utilize the CLEC aggregate data produced by 16
BellSouth to comment on BellSouth’s performance. Instead, they typically 17
rely on unsupported anecdotal evidence or baseless guesses about the 18
future to allege poor performance by BellSouth. If that pattern continues 19
in this proceeding, the Commission should disregard the CLECs’ 20
testimony and focus solely on the objective evidence of performance that I 21
present here. 22
23
24
25

5
Q. WHAT PROCESSES DO YOU INCLUDE IN LOOP PROVISIONING 1
DATA? 2
3
A. In order to demonstrate that BellSouth provides CLECs with access to 4
unbundled loops in a manner such that CLECs are not impaired, the loop 5
provisioning data provided in this filing include the processes involved in 6
providing CLECs unbundled loops from beginning to end. Therefore, 7
BellSouth provides data herein not only for measurements associated with 8
the installation of voice grade loops as defined in the “Provisioning” 9
category of the SQM, but for measurements in the Ordering and 10
Maintenance & Repair categories as well. These measurement 11
performance results show that BellSouth responds to CLEC loop orders 12
accurately and timely and performs maintenance and repair activities in a 13
nondiscriminatory manner. Also, because UNE loops are terminated in 14
collocation spaces, data for collocation performance are included. 15
16
Q. PLEASE DESCRIBE THE SOURCE OF THE DATA USED IN YOUR 17
TESTIMONY. 18
19
A. The data provided in this filing are produced by the Performance 20
Measurement Analysis Platform (PMAP), which is the same system 21
utilizing the same SQM that produces these data for this Commission, the 22
Commission staff, the Federal Communications Commission (“FCC”) and 23
the CLECs each month. The performance results are produced by the 24
same process that yielded the data relied upon by this Commission and 25

6
the FCC to conclude that BellSouth met its section 271 obligations. PMAP 1
has undergone an extremely thorough third party audit conducted by 2
Bearing Point over multiple years. The metrics audit was concluded in 3
Florida on July 30, 2002 and in Georgia on June 6, 2003 with no 4
significant adverse findings in either state. 5
6
Q. WHAT VALUE DOES THE DATA PROVIDED HAVE IN 7
DEMONSTRATING THAT UNBUNDLED LOOP PROVISIONING, 8
INCLUDING HOT CUTS, WILL NOT BE AN OPERATIONAL BARRIER 9
FOR CLECS IF SWITCHING IS NO LONGER A UNE? 10
11
A. As discussed in the testimony of BellSouth witness Mr. Ken Ainsworth, the 12
loop provisioning processes used by BellSouth in the past will continue to 13
be used in the future. From BellSouth’s proven performance track record, 14
the Commission can and should infer that BellSouth’s performance will 15
continue at a high level in the future. After all, it has been over a year 16
since BellSouth entered the interLATA market in Alabama, and 17
BellSouth’s performance has remained consistently high. Moreover, new 18
measures have been added and existing measures revised to enable this 19
Commission to evaluate even more data on BellSouth’s loop provisioning 20
processes. 21
22
23
24
25
7
1
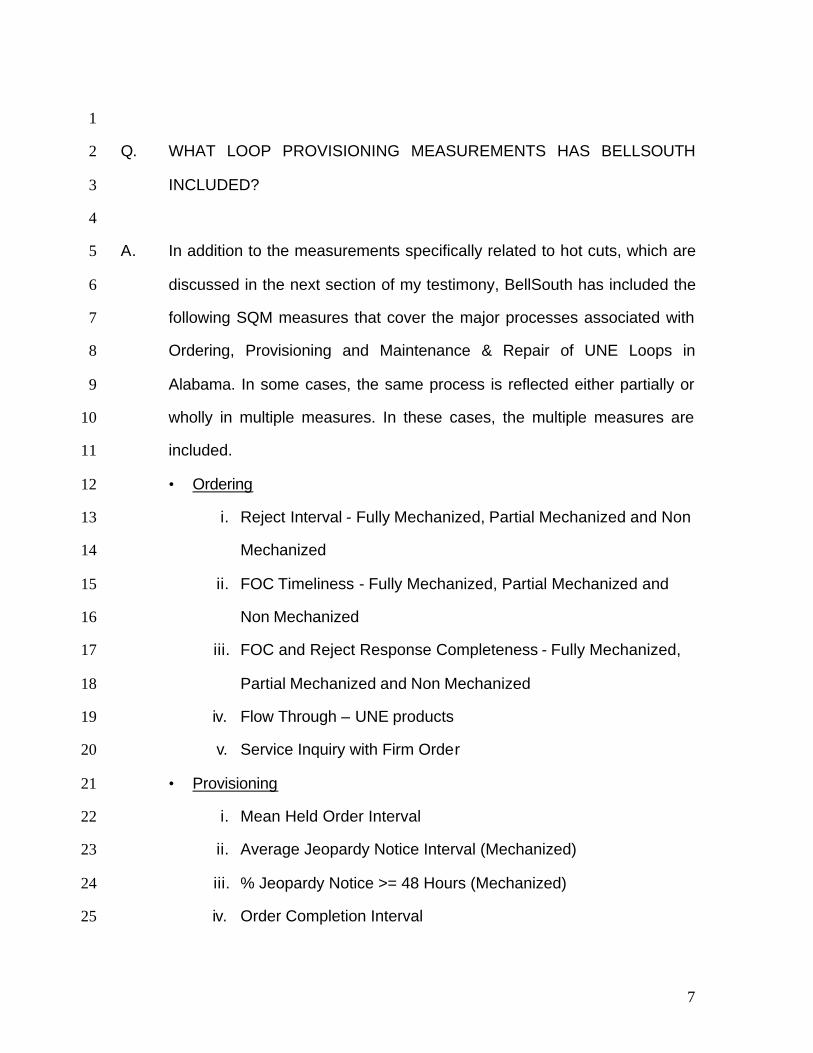
Q. WHAT LOOP PROVISIONING MEASUREMENTS HAS BELLSOUTH 2
INCLUDED? 3
4
A. In addition to the measurements specifically related to hot cuts, which are 5
discussed in the next section of my testimony, BellSouth has included the 6
following SQM measures that cover the major processes associated with 7
Ordering, Provisioning and Maintenance & Repair of UNE Loops in 8
Alabama. In some cases, the same process is reflected either partially or 9
wholly in multiple measures. In these cases, the multiple measures are 10
included. 11
• Ordering 12
i. Reject Interval - Fully Mechanized, Partial Mechanized and Non 13
Mechanized 14
ii. FOC Timeliness - Fully Mechanized, Partial Mechanized and 15
Non Mechanized 16
iii. FOC and Reject Response Completeness - Fully Mechanized, 17
Partial Mechanized and Non Mechanized 18
iv. Flow Through – UNE products 19
v. Service Inquiry with Firm Order 20
• Provisioning 21
i. Mean Held Order Interval 22
ii. Average Jeopardy Notice Interval (Mechanized) 23
iii. % Jeopardy Notice >= 48 Hours (Mechanized) 24
iv. Order Completion Interval 25

8
v. Missed Installation Appointments 1
vi. Provisioning Troubles within 30 Days 2
vii. Average Completion Notice Interval (Mechanized) 3
viii. Cooperative Test Attempts for DSL 4
ix. Service Order Accuracy (Design & Non-Design) 5
x. Trunk Blocking 6
• Maintenance & Repair 7
i. Missed Repair Appointments 8
ii. Customer Trouble Report Rate 9
iii. Maintenance Average Duration 10
iv. Repeat Troubles within 30 Days 11
• Collocation 12
i. Collocation Average Response Time 13
ii. Collocation Average Arrangement Time 14
iii. Collocation Percent of Due Dates Missed 15
16
Q. WHICH PRODUCTS ARE INCLUDED WITHIN THE UNE LOOP 17
PERFORMANCE DATA? 18
19
A. BellSouth has included performance data for virtually all of the UNE loops 20
that CLECs have ordered and would be expected to continue ordering to 21
provide qualifying service to mass-market customers, which include: 22
• xDSL – this includes ADSL, HDSL and Unbundled Copper Loop 23
(UCL), except UCL-Non Design (ND) 24
• Unbundled Cooper Loop – Non-Design (UCL-ND) 25

9
• UNE ISDN Loops – this includes Basic Rate Interface (BRI), Primary 1
Rate Interface (PRI) and UDC 2
• UNE 2W Analog Loops Design with and without LNP 3
• UNE 2W Analog Loops Non Design with and without LNP 4
• Enhanced Extended Links (EELs) 5
• Local Interconnection Trunks 6
Of course, the Commission has data on any other loop products in which it 7
may be interested. 8
9
Q. WHY DID BELLSOUTH INCLUDE A YEAR OF DATA WITH THIS 10
FILING? 11
12
A. BellSouth wanted to demonstrate clearly and unequivocally that its 13
performance has met, and will continue to meet, its obligations under the 14
Telecommunication Act of 1996 (“the Act”). As the Commission will see, 15
BellSouth’s performance today is substantially the same (and in many 16
cases better) than when this Commission and the FCC approved 17
BellSouth’s application to provide interLATA long distance service. 18
Consequently, there is no doubt that BellSouth provides today, as it 19
provided at the time of its 271 application, non-discriminatory, timely and 20
efficient access to UNE loops. To reach a different conclusion today 21
would directly conflict with the Commission’s conclusions in endorsing 22
BellSouth’s application for interLATA authority in Alabama. 23
24
25

10
1
Q. ARE THERE ANY NEW PRODUCTS THAT CLECS WILL BE ABLE TO 2
ORDER FOR WHICH DATA ARE NOT CURRENTLY AVAILABLE? 3
4
A. Yes. Although BellSouth currently allows CLECs to provision their own 5
“co-carrier cross-connects” that allow two or more CLECs to interconnect 6
their collocation spaces in a BellSouth central office, BellSouth plans to 7
offer a new product to help facilitate this interconnection if the CLECs want 8
BellSouth to perform this work, called “Co-Carrier Cross- Connect.” This 9
product is discussed in Ms. Kathy Blake’s testimony and will be a federal 10
tariff offering, which will provide for the installation of jumper patch cords 11
between the two tie pairs connecting the Physical Collocation 12
arrangements of two CLECs in BellSouth’s Central Offices. The Co-13
Carrier Cross-Connect service provides a one-to-one dedicated 14
transmission path between two CLECs’ collocation arrangements located 15
in the same Central Office at two-wire, four-wire, DS1, DS3, and fiber optic 16
levels. Since this is a tariff offering instead of a UNE, data for this product 17
are not captured. 18
19
The cross-connect process is a simple procedure that is already very 20
much a part of current loop provisioning activities. Loop provisioning 21
requires installation of cross connects between BellSouth equipment and 22
CLEC collocation space, and performance of this activity is already 23
reflected in the measurement data. There is nothing peculiar to cross-24
connects that involve CLEC-to-CLEC requests compared to BellSouth to 25

11
CLEC connections that would impact the process adversely. 1
Consequently, with the understanding that this type of activity is already 2
reflected in the loop provisioning data provided in this filing, the 3
Commission has everything that it needs to evaluate the ability of CLECs 4
to effectively serve their targeted customers in the absence of unbundled 5
switching. 6
7
B. BellSouth’s Performance Results 8
Q. WHAT WAS BELLSOUTH’S ORDERING TIMELINESS AND 9
COMPLETENESS PERFORMANCE FOR UNE LOOPS FOR THE PAST 10
12 MONTHS IN ALABAMA? 11
12
A. Ordering timeliness and completeness performance is reflected in the 13
Reject Interval, FOC Timeliness, and FOC and Reject Completeness 14
measures. The Reject Interval measure shows the extent to which a 15
Local Service Request (“LSR”) that contained an error by the CLEC was 16
returned by BellSouth in a timely manner to the CLEC for correction. FOC 17
Timeliness results show whether BellSouth converted an LSR submitted 18
by a CLEC into the service order necessary to perform the requested 19
action within the timeframes established by this Commission. FOC and 20
Reject Response Completeness performance indicates the extent to 21
which a CLEC received a response to each valid LSR that it submitted. 22
23
24
25
12
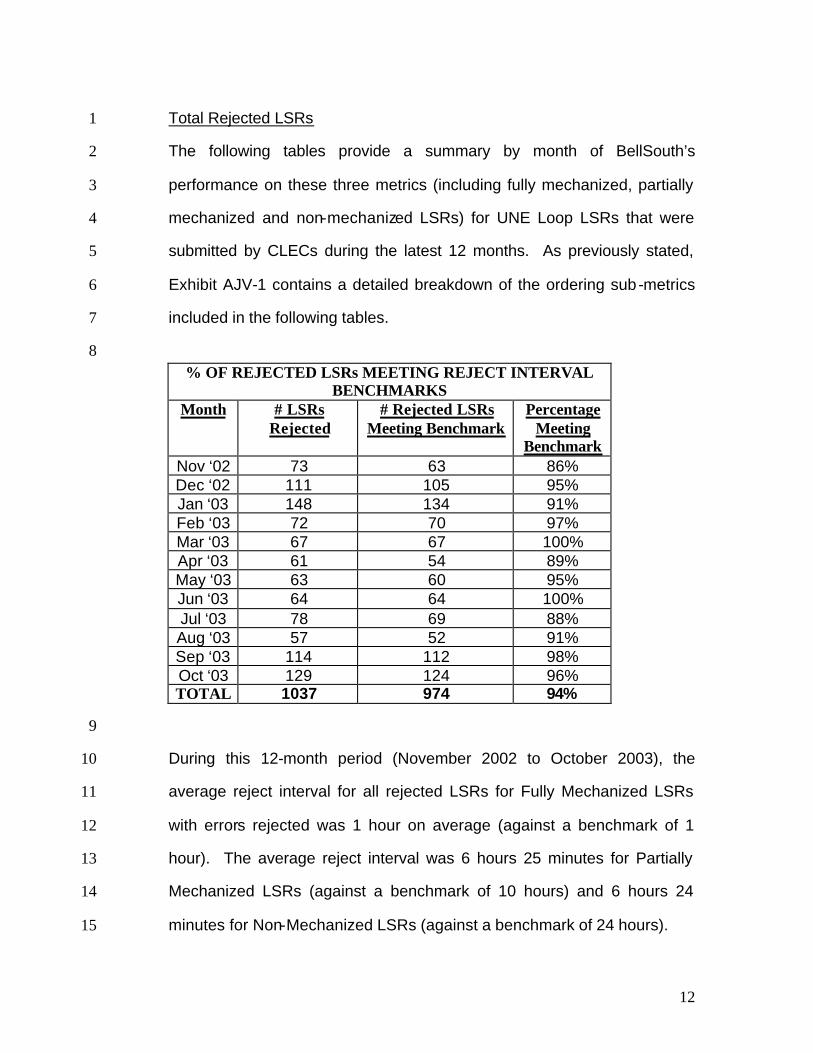
Total Rejected LSRs 1
The following tables provide a summary by month of BellSouth’s 2
performance on these three metrics (including fully mechanized, partially 3
mechanized and non-mechanized LSRs) for UNE Loop LSRs that were 4
submitted by CLECs during the latest 12 months. As previously stated, 5
Exhibit AJV-1 contains a detailed breakdown of the ordering sub-metrics 6
included in the following tables. 7
8 % OF REJECTED LSRs MEETING REJECT INTERVAL
BENCHMARKS Month # LSRs
Rejected
# Rejected LSRs Meeting Benchmark
Percentage Meeting
Benchmark Nov ‘02 73 63 86% Dec ‘02 111 105 95% Jan ‘03 148 134 91% Feb ‘03 72 70 97% Mar ‘03 67 67 100% Apr ‘03 61 54 89% May ‘03 63 60 95% Jun ‘03 64 64 100% Jul ‘03 78 69 88% Aug ‘03 57 52 91% Sep ‘03 114 112 98% Oct ‘03 129 124 96% TOTAL 1037 974 94%
9
During this 12-month period (November 2002 to October 2003), the 10
average reject interval for all rejected LSRs for Fully Mechanized LSRs 11
with errors rejected was 1 hour on average (against a benchmark of 1 12
hour). The average reject interval was 6 hours 25 minutes for Partially 13
Mechanized LSRs (against a benchmark of 10 hours) and 6 hours 24 14
minutes for Non-Mechanized LSRs (against a benchmark of 24 hours). 15

13
Fully Mechanized 1
For those Fully Mechanized Rejected LSRs for which BellSouth did not 2
meet the one-hour benchmark, BellSouth conducted a detailed root cause 3
analysis of the process. The root cause analysis identified three issues 4
that account for a significant portion of the LSRs that are rejected back to 5
the CLEC and missed the 1-hour benchmark, all of which have been 6
addressed. These three issues and their corresponding status are as 7
follows: 8
ISSUE STATUS 1. Errors are being detected with Listing LSRs. When a CLEC sends in an LSR for a Listing on a new account and completes the LSR properly, a FOC will be returned. However, if that account is found to be already active, then the order cannot be provisioned. The LSR is manually rejected and returned to the CLEC. If the LSR was submitted as a record only change to the directory listing, this would not be an issue. A Feature was implemented that will autoclarify the error prior to issuance of an FOC for this condition.
1. Feature implemented with Release 12.0 on 3/30/03.
2. Errors are being detected for LSRs that are Planned for Manual Fallout, but are being counted as Fully Mechanized. Such LSRs are designed to be worked by a service representative. If a CLEC calls regarding an LSR and the service representative retrieves the record outside of their normal process for retrieving orders, the LSR is not properly counted as Partially Mechanized because the proper service representative information is not populated and PMAP counts the LSR as Fully Mechanized. The LSR does not reflect that it was handled by the service representative and therefore is counted as fully mechanized.
2. Feature implemented with Release 13.0 on 6/22//03 to properly count this LSR as partially mechanized.
3. Errors are being detected for LSRs with errors that require manual intervention, but are being counted as Fully Mechanized. LSRs are submitted, but then encounter an error that cannot be handled by the system. The LSR is manually rejected and returned to the CLEC.
3. Feature implemented with Release 13.0 on 6/22//03 to properly count this LSR as partially mechanized.
9
The previous chart reported BellSouth’s performance in the timely 10
returning of Rejects based on Total Rejects (i.e., Fully Mechanized, 11
Partially Mechanized and Non-Mechanized). If we only look at Fully 12

14
Mechanized Rejected LSRs, with the implementation of Release 13.0 1
effective with May 2003 data, BellSouth has met the 1-hour benchmark for 2
96% of the fully mechanized rejected LSRs for May through October 2003. 3
4
Partially Mechanized Rejected LSRs 5
The Alabama SQM requires that BellSouth meet a benchmark for partially 6
mechanized reject notices of 85% returned within 10 hours or less. 7
BellSouth made an average of 88% over this period within 10 hours. 8
9
To address the remaining LSRs that were not returned within the 10-hour 10
benchmark, BellSouth conducted a detailed raw data analysis that has 11
revealed three areas associated with the mechanized portion of the 12
partially mechanized LSRs: 13
• BellSouth experienced delays in processing LSRs submitted via the 14
EDI system. During September and October 2003, this problem was 15
corrected. The EDI CPUs and hard drives were replaced as well as 16
additional CPU capacity installed. Also, additional pathways between 17
the EDI translator and down stream Legacy systems were added. 18
Finally, the electronic processing of certain administrative and archival 19
activities was removed from the EDI translator to reduce overall 20
processing time of the LSRs. 21
• Some LSRs experience delays in resolving incorrect connecting facility 22
assignments (CFA) by the CLECs. BellSouth has determined that 23
when an incorrect CFA is provided, it is being assigned an error status 24
for further correction. Additional analysis is being performed to 25

15
determine if the resolution is being delayed by a system problem or if 1
the service representatives are not handling the corrections in a timely 2
manner. 3
• LSRs are dropping out for manual handling because of an error 4
discovered after a FOC was returned to the CLEC. There are 5
instances where an error is discovered as the Service Order begins to 6
process through the provisioning systems. Due to the way the ordering 7
and provisioning systems interact, it is not feasible for the order 8
processing systems to query the provisioning system to detect these 9
errors, prior to sending the FOC. Thus, when the error is detected as 10
the Service Order begins to process, the reject is returned to the 11
CLEC, but the time interval is measured from when the LSR was first 12
received, resulting in an unusually long reject interval. It may be 13
appropriate to exclude these types of rejects from the reject interval 14
measurement and this exclusion can be addressed in the next periodic 15
review of measurements. There are only small quantities of cases 16
where the types of conditions that cause BellSouth to miss the 17
standard occur, averaging about 65 per month. These volumes make 18
it extremely difficult to duplicate the event that caused the problem, so 19
that the problem can be corrected. Importantly, the small volume of 20
misses indicates that performance is not having a significant adverse 21
impact on CLECs. 22
23
24
25
16
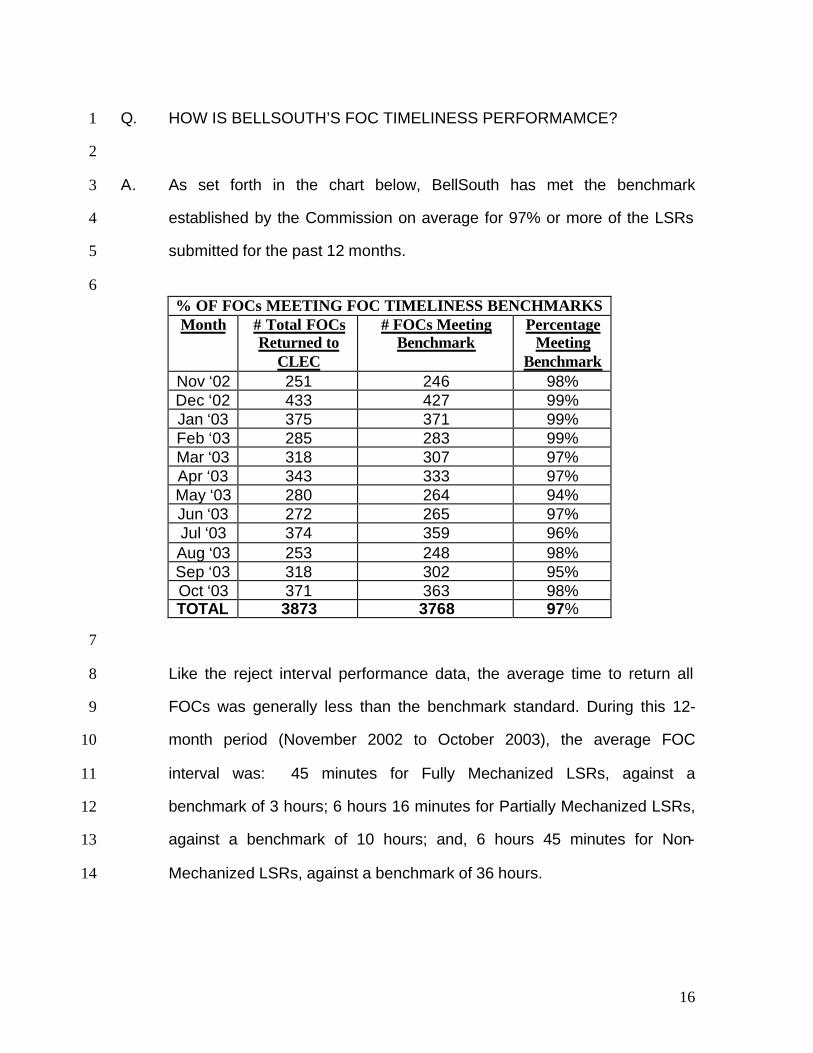
Q. HOW IS BELLSOUTH’S FOC TIMELINESS PERFORMAMCE? 1
2
A. As set forth in the chart below, BellSouth has met the benchmark 3
established by the Commission on average for 97% or more of the LSRs 4
submitted for the past 12 months. 5
6 % OF FOCs MEETING FOC TIMELINESS BENCHMARKS Month # Total FOCs
Returned to CLEC
# FOCs Meeting Benchmark
Percentage Meeting
Benchmark Nov ‘02 251 246 98% Dec ‘02 433 427 99% Jan ‘03 375 371 99% Feb ‘03 285 283 99% Mar ‘03 318 307 97% Apr ‘03 343 333 97% May ‘03 280 264 94% Jun ‘03 272 265 97% Jul ‘03 374 359 96% Aug ‘03 253 248 98% Sep ‘03 318 302 95% Oct ‘03 371 363 98% TOTAL 3873 3768 97%
7
Like the reject interval performance data, the average time to return all 8
FOCs was generally less than the benchmark standard. During this 12-9
month period (November 2002 to October 2003), the average FOC 10
interval was: 45 minutes for Fully Mechanized LSRs, against a 11
benchmark of 3 hours; 6 hours 16 minutes for Partially Mechanized LSRs, 12
against a benchmark of 10 hours; and, 6 hours 45 minutes for Non-13
Mechanized LSRs, against a benchmark of 36 hours. 14

17
1
The area where BellSouth is missing the standard is in Partially 2
Mechanized FOCs. To address the remaining LSRs that were not 3
returned within the 10-hour benchmark, BellSouth conducted a detailed 4
raw data analysis that has revealed three areas associated with the 5
mechanized portion of the partially mechanized LSRs: 6
• A number of FOCs were entered into the system within the benchmark 7
but were not counted correctly due to repeated attempts to respond to 8
the CLEC. BellSouth met its requirement of initially returning the FOC 9
within the 10-hour benchmark. Because of a system error, however, 10
the performance was stated incorrectly. The issue does not affect 11
BellSouth’s performance for returning the FOC to the CLEC; it is just 12
understating BellSouth’s performance. 13
• BellSouth experienced delays in processing LSRs submitted via the 14
EDI system. This is the same issue discussed above concerning 15
rejects. 16
• Some CLECs are requesting that certain auto clarified (rejected) LSRs 17
be corrected and processed without the CLEC resubmitting a new 18
version of the existing LSR. In specific cases, some LSRs are being 19
corrected and put into the ordering systems without receiving a new 20
LSR from the CLEC. This causes the FOC to exceed the 10-hour 21
benchmark. This is due to the fact that the beginning timestamp is not 22
changed from the time the LSR was initially submitted by the CLEC, 23
and as a result the entire time is included in the interval. This interval 24
will almost always exceed the 10-hour FOC benchmark. In an effort to 25

18
provide good customer service, BellSouth is meeting the request of the 1
CLECs, but this causes the FOC benchmark to be exceeded. 2
3
Q. HOW IS BELLSOUTH’S PERFORMANCE ON FOC AND REJECT 4
RESPONSE COMPLETENESS? 5
6
A. BellSouth has returned FOCs and/or rejects for 84% or better (an average 7
of 96%) of the UNE Loop LSRs that were submitted by CLECs during the 8
latest 12 months as depicted in the following chart. 9
10 % OF FOC & REJECT RESPONSES RETURNED TO
CLECs (95% BENCHMARK) Month # Total LSRs
Submitted # Responses
Returned Percentage of
Total Returned Nov ‘02 302 298 99% Dec ‘02 530 524 99% Jan ‘03 515 496 96% Feb ‘03 348 333 96% Mar ‘03 370 358 97% Apr ‘03 394 380 96% May ‘03 330 320 97% Jun ‘03 394 331 84% Jul ‘03 452 437 97% Aug ‘03 306 299 98% Sep ‘03 426 416 98% Oct ‘03 500 483 97% TOTAL 4867 4675 96%
11
12
13
14
15

19
Q. WHAT PERCENTAGE OF THE UNE LOOP LSRS SUBMITTED BY THE 1
CLECS IN THE LAST 12 MONTHS IN ALABAMA FLOWED THROUGH 2
BELLSOUTH’S OPERATION SUPPORT SYSTEMS? 3
4
A. BellSouth does not measure the Flow Through measurement at the state 5
level. Beginning in March 2003, BellSouth in Georgia separated the UNE 6
category into UNE-P and UNE Other disaggregations for Flow-Through. 7
(UNE Other is defined as the total UNE LSRs minus the UNE-P LSRs.) 8
BellSouth met 85.92% (85,951 of 100,038) of the submitted UNE Other 9
LSRs during the period from March 2003 through October 2003 for the 10
region. See Exhibit AJV-1 for the details concerning this measure 11
12
Q. WHAT DOES THE SERVICE INQUIRY WITH FIRM ORDER MEASURE 13
ADDRESS AND HOW DID BELLSOUTH PERFORM? 14
15
A. This measure addresses a small group of services (i.e., xDSL and 16
Unbundled Interoffice Transport) that require BellSouth to check 17
equipment availability before the CLEC can submit an LSR. BellSouth 18
returned 67 of the 71 service inquiries (94%) within the 5-day interval 19
specified by the Commission during the period of November 2002 through 20
October 2003. See Exhibit AJV-1 for the details concerning this measure. 21
22
23
24

20
Q. WHAT WAS BELLSOUTH’S PERFORMANCE FOR UNE LOOPS ON 1
THE MEASURES IN THE PROVISIONING CATEGORY OF THE SQM? 2
3
A. Excellent. The various provisioning measures address certain aspects of 4
provisioning an individual order. For this reason, summary results based 5
on the number of orders processed cannot be presented for provisioning 6
measures like they are for the ordering measures. A cursory review of the 7
data, however, by simply comparing the number of submetrics met, 8
indicates the high level of performance as shown below. 9
10 % OF PROVISIONING SUB-METRICS MEETING PARITY Month Total #
Submetrics with CLEC Activity
# Submetrics Meeting
Benchmarks
Percentage Meeting
Benchmarks Nov ‘02 45 45 100% Dec ‘02 47 47 100% Jan ‘03 49 46 94% Feb ‘03 43 41 95% Mar ‘03 43 41 95% Apr ‘03 50 43 86% May ‘03 52 50 96% Jun ‘03 59 56 95% Jul ‘03 63 60 95% Aug ‘03 50 46 92% Sep ‘03 44 36 82% Oct ‘03 52 44 85% TOTAL 597 555 93%
11
BellSouth met the performance criteria for an average of 93% of all the 12
UNE Loop provisioning sub-metrics over the last 12 months in Alabama. 13
As shown above, BellSouth met 555 of the 597 sub-metrics with CLEC 14
activity during the period. 15
16

21
The following table provides a detailed breakdown, by provisioning 1
measure, of the measurements included in the overall summary above. 2
3 12-MONTH TOTAL FOR PROVISIONING MEASURES MEETING
PARITY Measure Total #
Submetrics with CLEC
Activity
Total # Submetrics
Meeting Parity
% Meeting Parity
Mean Held Order Interval 146 143 98% Average Jeopardy Notice Interval 21 20 95% % Jeopardy Notice >= 48 Hours 21 19 90% Coordinated Customer Conversions 8 7 88% Order Completion Interval 67 62 93% Hot Cut Timeliness 6 6 100% % Provisioning Troubles within 7 Days of Hot Cut 9 8 89% % Missed Installation Appointments 69 65 94% % Provisioning Troubles within 30 Days of Completions 66 60 91% Average Completion Notice Interval 64 62 97% % Cooperative Test 12 12 100% SOA 96 79 82% % Trunk Blocking 12 12 100%
4
Q. BRIEFLY DESCRIBE THE NATURE OF THE ISSUES THAT CAUSED 5
MOST OF THE MISSES REFLECTED IN THE ABOVE CHARTS. 6
7
A. Each of these provisioning results is discussed in more detail in Exhibit 8
AJV-1. The analyses in that exhibit show that the misses for the most part 9

22
are not indicative of problems in BellSouth’s performance. A brief 1
summary of the principal causes of the performance misses follows. 2
3
Order Completion Interval 4
Four (4) of the 5 missed sub-metrics were due to small quantities of orders 5
within the sub-metrics. The last item was a failure to exclude 3 orders that 6
were missed for subscriber reasons. 7
8
% Missed Installation Appointments 9
For the 4 sub-metrics missed in this area, BellSouth typically only missed 10
a small number of appointments. For example, for the 4 sub-metrics 11
missed, 3 missed only 1 appointment each and the other missed 4 12
appointments. 13
14
% Provisioning Troubles<=30 Days 15
All nine of the missed sub-metrics occurred in cases where the volume 16
was too low to indicate a problem with performance. 17
18
Service Order Accuracy 19
The percent of sub-metrics met is very misleading as an indicator of 20
performance. Over 98% of the sample of orders reviewed met the 21
accuracy test. While BellSouth did not meet all of the sub-metrics, it did 22
meet or exceed the benchmark when the total number of LSRs sampled is 23
calculated. For the design sub-metrics, BellSouth met 3,406 of the 3,473 24
sampled for over 98% accuracy. The non-design sub-metrics exceeded 25

23
the 95% benchmark as well with 9,085 of the 9,265 LSRs sampled 1
meeting the accuracy requirement for over 98% also. 2
3
As you can see from these summaries, none of the misses are indicative 4
of systemic problems and, in some cases, indicate no problem at all with 5
performance. When this fact is considered along with the already high 6
level of performance indicated by the raw measurement data, BellSouth’s 7
performance is exceptional. 8
9
Q. WHAT HAS BEEN BELLSOUTH’S PERFORMANCE FOR THE THREE 10
LNP DISCONNECT TIMELINESS MEASURES FOR THE PAST SIX 11
MONTHS IN ALABAMA? 12
13
A. The following table provides the average results for the three LNP 14
measures: P-13B, the percentage of time BellSouth applies the trigger 15
order before the due date; P-13C, the percentage of time the LNP service 16
is out of service less than 60 minutes; and P-13D, the percentage of time 17
BellSouth disconnects the LNP service within 4 hours for non-trigger 18
orders for the months of May through October 2003 in Alabama. While 19
these three LNP measures are not currently included in the Alabama 20
SQM, I have included the results for these measures based on Alabama 21
data. 22
23
24

24
The data show the number of lines meeting the requirement divided by the 1
total lines due and the corresponding percentage calculated. 2
3 Month % Trigger Orders
Applied Before Due Date (P13B)
% Orders OoS < 60 Minutes (P13C)
% Non Trigger Orders Applies < 4 Hours (P13D)
May - October 2003
(6369/6753) 94% (9876/9896) 99% (1016/1059) 96%
4
See Exhibit AJV-1 for the specific details for these sub-metrics. 5
6
Q. HOW WAS BELLSOUTH’S UNE LOOP MAINTENANCE & REPAIR 7
PERFORMANCE? 8
9
A. Excellent. BellSouth met 95% of the UNE Loop sub-metrics associated 10
with the Maintenance & Repair measures included with this filing, and the 11
overwhelming majority of the misses do not indicate performance 12
problems. As shown in the following table, BellSouth met 455 of the 480 13
sub-metrics with CLEC activity during the period from November 2002 14
through October 2003. (See Exhibit AJV-1 for a detailed breakdown of the 15
maintenance & repair sub-metrics for the UNE loops included in this 16
table.) 17
18 % OF M&R SUB-METRICS MEETING PARITY
Month Total # Submetrics with CLEC
Activity
# Submetrics Meeting Parity
Percentage of Submetrics
Meeting Parity
Nov ‘02 40 39 98% Dec ‘02 40 39 98% Jan ‘03 40 37 93% Feb ‘03 40 38 95%

25
% OF M&R SUB-METRICS MEETING PARITY Month Total #
Submetrics with CLEC
Activity
# Submetrics Meeting Parity
Percentage of Submetrics
Meeting Parity
Mar ‘03 40 38 95% Apr ‘03 40 37 93% May ‘03 40 37 93% Jun ‘03 40 38 95% Jul ‘03 40 38 95% Aug ‘03 40 38 95% Sep ‘03 40 37 93% Oct ‘03 40 39 98% TOTAL 480 455 95%
1
The following table provides a detailed breakdown by maintenance & 2
repair measure of the measurements included in the overall summary 3
above. 4
5 12-MONTH TOTAL FOR MAINTENANCE & REPAIR
MEASURES MEETING PARITY Measure Total #
Submetrics with CLEC
Activity
Total # Submetrics
Meeting Parity
% Meeting Parity
% Missed Repair Appointments 120 119 99% % Customer Trouble Report Rate 120 102 85% Maintenance Average Duration 120 116 97% % Repeat Troubles within 30 Days 120 118 98%
6
7
8
9
10
26
Q. BRIEFLY DESCRIBE THE PRINCIPAL ISSUES THAT CONTRIBUTED 1
TO THE MISSED SUBMETRICS IN THE ABOVE CHART. 2
3
A. Like the provisioning measurements, these measurement results are also 4
analyzed in Exhibit AJV-1. Following is a brief summary of the principal 5
causes of these performance metric misses. 6
7
% Missed Repair Appointments and % Repeat Troubles 8
In all cases, the misses occurred where there was a very low volume of 9
activity. Such low volumes do not indicate a problem with performance. 10
11
%Customer Trouble Report Rate 12
In all cases where a miss was recorded, high quality service was provided. 13
In all cases, the level of trouble report free service was at least 96%. 14
When service levels are this high, the statistical test used to evaluate 15
performance is overly sensitive to service differences and records a miss 16
even though service levels are high. 17
18
Maintenance Average Duration 19
The four missed sub-metrics were due to small volumes of troubles for the 20
CLECs. There was 1 missed sub-metric in the UNE ISDN Loop and 3 in 21
the Local Interconnection Trunk categories. There were 9 troubles 22
reported for the ISDN miss and a total of 8 troubles for the trunk 23
categories. 24
25

27
C. Cross-Connect Performance 1
Q. THE FCC SPECIFICALLY MENTIONED CLEC-TO-CLEC CROSS-2
CONNECT PROVISIONING PERFORMANCE AS AN AREA FOR 3
REVIEW. SINCE BELLSOUTH CURRENTLY DOES NOT PROVIDE A 4
CO-CARRIER CROSS-CONNECT PRODUCT, HOW CAN THE 5
COMMISSION BE CONFIDENT THAT BELLSOUTH’S PERFORMANCE 6
IN THIS AREA WILL NOT CAUSE CLECS TO BE IMPAIRED IF UNE-P 7
IS NOT AVAILABLE? 8
9
A. The Commission may infer from BellSouth’s current performance in 10
providing cross-connects for existing applications such as UNE Loops 11
what its performance would likely be for co-carrier cross-connects. 12
Notably, the loop provisioning data previously discussed includes 13
performance in provisioning all cross connects necessary to make the 14
UNE loop available. The cross connects required to provide a UNE loop 15
are not ordered separately from the loop itself, but instead are a part of the 16
UNE loop product. Consequently, the performance data for such cross-17
connects is not separated from the data for the other parts that make up 18
the UNE loop products. In the case where a CLEC orders a new loop from 19
BellSouth, the cross-connect activity associated with completing the order 20
is a part of the reported results as provided in this filing. If a CLEC order 21
requires this loop to be provided via a hot cut, the cross-connect activity is 22
included in the performance results for hot cuts, as reported today and as 23
proposed in this filing. 24
25

28
As previously stated in this testimony, the cross-connect process is a very 1
basic procedure that BellSouth performs frequently on an ongoing basis. 2
There is no appreciably greater difficulty involved in providing a co-carrier 3
cross-connect as compared to a cross-connect between BellSouth and a 4
CLEC. A cross-connect is a cross-connect. Therefore, based on current 5
performance, as provided in this filing, the Commission should be 6
confident that it has everything necessary to assess whether CLECs 7
would be impaired in the absence of unbundled switching. 8
9
D. Collocation Performance 10
Q. HOW WELL HAS BELLSOUTH PERFORMED IN PROVIDING 11
COLLOCATION SPACES? 12
13
A. The following table shows that BellSouth met 95% of all collocation 14
measures during the 12-month period. (See Exhibit AJV-1 for further 15
details concerning the data included in this table.) 16
17 % OF COLLOCATION SUB-METRICS MEETING
BENCHMARK Month Total #
Submetrics with CLEC Activity
# Submetrics Meeting Parity
Percentage Meeting Parity
Nov ‘02 5 2 40% Dec ‘02 5 5 100% Jan ‘03 4 4 100% Feb ‘03 4 4 100% Mar ‘03 7 7 100% Apr ‘03 5 5 100% May ‘03 3 3 100% Jun ‘03 6 6 100% Jul ‘03 6 6 100% Aug ‘03 1 1 100%

29
% OF COLLOCATION SUB-METRICS MEETING BENCHMARK
Month Total # Submetrics with CLEC Activity
# Submetrics Meeting Parity
Percentage Meeting Parity
Sep ‘03 6 6 100% Oct ‘03 4 4 100% TOTAL 56 53 95%
From the foregoing results, it is clear that CLECs do not face operational 1
barriers based on BellSouth’s performance in providing timely collocation. 2
BellSouth’s provision of collocation is discussed further in the testimony of 3
BellSouth witness Wayne Gray. 4
5
II. BELLSOUTH’S CURRENT HOT CUT PERFORMANCE DATA 6
7
Q. PLEASE IDENTIFY THE PERFORMANCE MEASUREMENTS THAT 8
BELLSOUTH CURRENTLY REPORTS RELATIVE TO HOT CUT 9
ORDERS. 10
11
A. BellSouth currently captures its performance results relative to Hot Cuts 12
and Coordinated Customer Conversions (CCC) via four measures listed in 13
the Alabama SQM: 14
• P-7: Coordinated Customer Conversion Interval 15
• P-7A: Coordinated Customer Conversions – Hot Cut Timeliness % 16
within Interval and Average Interval 17
• P-7B: Coordinated Customer Conversions – Average Recovery Time 18
• P-7C: Hot Cut Conversions - % Provisioning Troubles Received within 19
7 days of Completed Service Order 20

30
Q. WHAT TYPES OF HOT CUTS ARE INCLUDED IN THE PERFORMANCE 1
DATA? 2
3
A. Currently, BellSouth’s performance results for measures P-7, P-7A and P-4
7B only include data for coordinated hot cuts as reflected by the title of the 5
measurements. As originally designed, these Commission-approved hot 6
cut measurements only capture coordinated conversions, which account 7
for the vast majority of conversions requested by CLECs. Further, the 8
data necessary to calculate these measures are only available on 9
coordinated hot cuts. The P-7C measurement should include coordinated 10
and non-coordinated hot cuts; however, only data for coordinated hot cuts 11
was being included. The measure will be corrected to include non-12
coordinated cuts beginning in January 2004, as reflected in the 13
Preliminary January 2004 Notification Report filed on November 3, 2003 in 14
Georgia and December 29, 2003 in Alabama (Docket 25835). Analysis 15
included in that preliminary report indicated that correcting this error would 16
have a 0.005% positive impact on results (based on May 2003 data). 17
18
Q. YOU INDICATED THAT COORDINATED CONVERSIONS ACCOUNT 19
FOR THE VAST MAJORITY OF CONVERSIONS THAT CLECS 20
REQUEST. PLEASE ILLUSTRATE THE COMPARATIVE VOLUMES OF 21
COORDINATED VERSUS NON-COORDINATED CONVERSIONS. 22
23
A. Over the 12-month period from November 2002 to October 2003, 100% of 24
the hot cuts in Alabama were coordinated. Moreover, for the one 25
31
measure, P-7C, that should include non-coordinated hot cuts, not only is 1
the volume small throughout BellSouth’s region, but based on the 2
measurement impact assessment included in the January 2004 Notice 3
(filed December 1, 2003) for May 2003 data, there were only 17 non-4
coordinated conversions for the region that were not reported, none of 5
which had troubles. 6
7
Q. WHAT OPERATIONS ACTIVITIES ARE COVERED BY THESE 8
MEASUREMENTS? 9
10
A. These measurements capture four discrete operational aspects of the hot 11
cut process. The hot cut process is discussed at length in the testimony of 12
BellSouth witness Ken Ainsworth, including the activities briefly described 13
here. The first measure P-7, Coordinated Customer Conversions Interval, 14
is used to report the time interval from the point at which BellSouth 15
disconnects an unbundled loop from the BellSouth switch until the loop is 16
cross connected to the CLEC collocation space. The interval within which 17
BellSouth is expected to complete the cutover of a given loop is 15 18
minutes and, in order to meet the requirements of this metric, BellSouth 19
must complete the cutover of 95% of the unbundled loops within this 15 20
minute standard. The 15-minute standard does not include the time to 21
notify the CLEC. BellSouth has an objective, however, to notify the CLEC 22
within 5 minutes of completion of coordinated hot cuts. BellSouth 23
consistently meets this objective because the Customer Wholesale 24
Interconnect Network Services (CWINS) center monitors each coordinated 25
32
hot cut and knows when it is completed so that the CLEC can be notified. 1
BellSouth’s performance related to this notification interval is addressed in 2
the testimony of BellSouth witness Mr. Ken Ainsworth. 3
4
While measure P-7 captures the time required to complete the cutover, 5
measure P-7A, Coordinated Customer Conversions – Hot Cut Timeliness 6
% Within Interval and Average Interval, provides an indication of whether 7
or not BellSouth began the cutover in a timely matter. Specifically, if 8
BellSouth begins the cutover more than 15 minutes before the scheduled 9
start time or more than 15 minutes after the scheduled start time, the 10
metric is considered missed. 11
12
Measure P-7B, Coordinated Customer Conversions – Average Recovery 13
Time, addresses those situations where a service outage due to the 14
cutover is isolated to BellSouth’s side of network, prior to completion of the 15
service order. The time that it takes BellSouth to resolve the service 16
outage after notification by the CLEC is reported via this measure. The 17
Commission determined that this measure should be diagnostic. 18
19
Finally, measure P-7C, Hot Cut Conversions - % Provisioning Troubles 20
Received within 7 Days of a Completed Service Order, is designed to 21
assess the quality of the work performed for coordinated cutovers by 22
capturing the number of troubles that occur within 7 days of the cutover. 23
This measure is calculated as the percentage of circuits associated with 24
coordinated conversions that incur troubles within 7 days of the service 25

33
order completion. The standard established by the Commission requires 1
that CLECs should experience troubles on only 5% or less of the circuits 2
involved in the cutover. 3
4
In summary, BellSouth’s current set of measurements is comprehensive 5
with respect to customer conversions/hot cuts, in that the data reflects 6
performance on the important aspects of the process for the overwhelming 7
majority of hot cuts. Particularly, BellSouth measures and reports: (1) 8
whether the cutover started on time (P-7A: Coordinated Customer 9
Conversions – Hot Cut Timeliness % Within Interval and Average 10
Interval); (2) how long it takes to complete the cutover (P-7: Coordinated 11
Customer Conversions Interval); (3) if service outage problems are 12
encountered after the cutover, but before service order completion, the 13
time it takes to resolve the problem (P-7B: Coordinated Customer 14
Conversions – Average Recovery Time); and (4) after the service order is 15
completed, any problems identified within a short time after the cutover 16
associated with circuits involved in the cutover are tracked (P-7C: Hot Cut 17
Conversions - % Provisioning Troubles Received within 7 Days of a 18
Completed Service Order ). 19
20
Q. WOULD YOU DESCRIBE BELLSOUTH’S OVERALL PERFORMANCE 21
FOR HOT CUTS FOR THE PAST 12 MONTHS IN ALABAMA? 22
23
A. BellSouth’s hot cut performance is exemplary. Exhibit AJV-1 contains 24
detailed information regarding hot cut performance. Reviewing the three 25

34
SQM Hot Cutover measures that capture the timeliness and accuracy of 1
the conversion (Coordinated Customer Conversions, Hot Cut Timeliness 2
and Provisioning Troubles within 7 days of Cutover), BellSouth met the 3
standard for 21 of the 23 sub-metrics with CLEC activity from November 4
2002 through October 2003. BellSouth met the standard for 91% of all 5
sub-metrics with CLEC activity for hot cuts for the past 12 months in 6
Alabama. The following table lists the number of sub-metrics with CLEC 7
activity that met the ordered benchmark, the total number of sub-metrics 8
with CLEC activity, and the corresponding percentage of sub-metrics 9
meeting the ordered benchmark for the past 12 months. 10
11
% OF HOT CUT SUB-METRICS MEETING BENCHMARK Month Total #
Submetrics with CLEC
Activity
# Submetrics Meeting
Benchmark
Percentage of Submetrics
Meeting Benchmark
Nov ‘02 1 1 100% Dec ‘02 2 2 100% Jan ‘03 3 2 67% Feb ‘03 3 2 67% Mar ‘03 1 1 100% Apr ‘03 2 2 100% May ‘03 3 3 100% Jun ‘03 3 3 100% Jul ‘03 3 3 100% Aug ‘03 2 2 100% Sep ‘03 0 0 Oct ‘03 0 0 TOTAL 23 21 91%
12
13
14

35
Q. HOW DID BELLSOUTH PERFORM IN MEETING THE 15-MINUTE 1
BENCHMARK FOR CUSTOMER COORDINATED CONVERSIONS 2
OVER THE PAST 12 MONTHS IN ALABAMA? 3
4
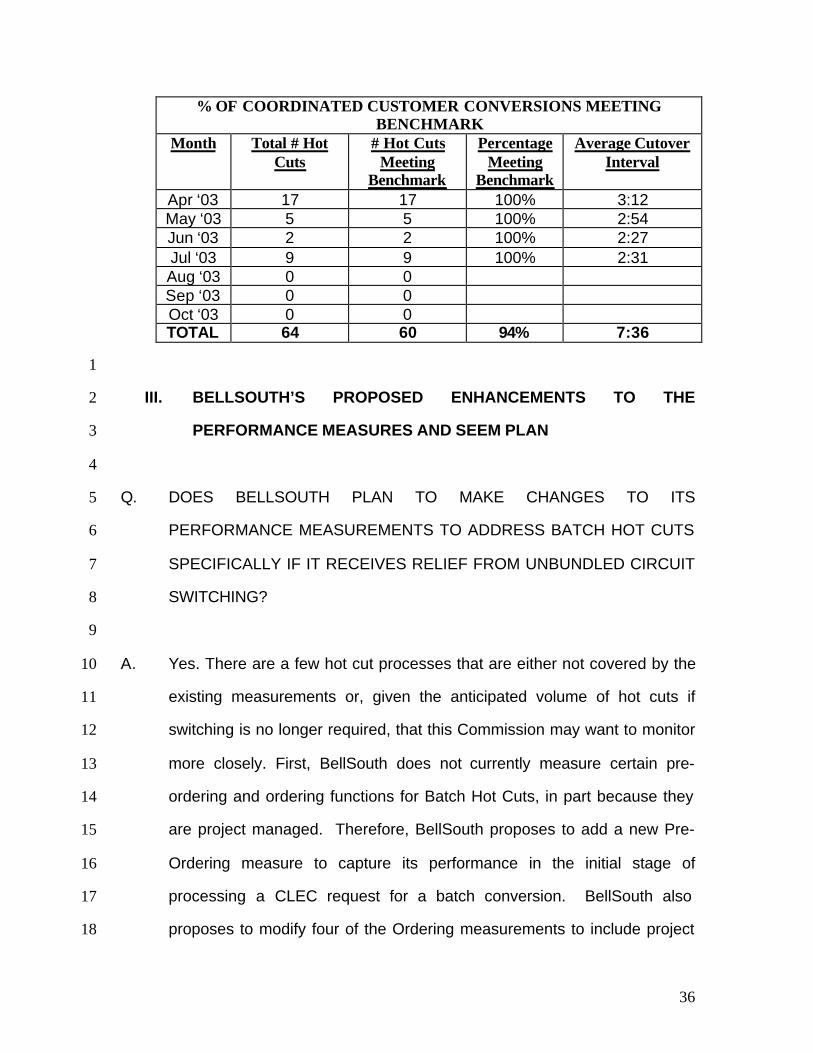
A. The following table provides a month-by-month breakdown of the 5
coordinated customer conversions for Alabama from November 2002 6
through October 2003. BellSouth met the performance standard for over 7
94% of all coordinated conversions during this period and averaged 7 8
minutes and 36 seconds per cutover for the over 60 coordinated 9
conversions. (See Exhibit AJV-1 for detailed explanation of this data) As 10
already noted, the Coordinated Customer Conversion Interval does not 11
include the time to notify the CLEC. As will be discussed later in this 12
testimony, because the CLECs have requested that the interval include 13
the time to notify, BellSouth proposes to modify measure P-7, Coordinated 14
Customer Conversion Interval, to include the time to notify the CLEC that 15
the conversion has been completed. This modification to the 16
measurement should only impact the performance results slightly, if at all, 17
because the CWINS center notifies the CLEC within 5 minutes of the 18
cutover. 19
20 % OF COORDINATED CUSTOMER CONVERSIONS MEETING
BENCHMARK Month Total # Hot
Cuts
# Hot Cuts Meeting
Benchmark
Percentage Meeting
Benchmark
Average Cutover Interval
Nov ‘02 4 4 100% 3:00 Dec ‘02 7 7 100% 1:00 Jan ‘03 19 15 79% 21:22 Feb ‘03 1 1 100% 3:00 Mar ‘03 0 0
36
% OF COORDINATED CUSTOMER CONVERSIONS MEETING BENCHMARK
Month Total # Hot Cuts
# Hot Cuts Meeting
Benchmark
Percentage Meeting
Benchmark
Average Cutover Interval
Apr ‘03 17 17 100% 3:12 May ‘03 5 5 100% 2:54 Jun ‘03 2 2 100% 2:27 Jul ‘03 9 9 100% 2:31 Aug ‘03 0 0 Sep ‘03 0 0 Oct ‘03 0 0 TOTAL 64 60 94% 7:36
1
III. BELLSOUTH’S PROPOSED ENHANCEMENTS TO THE 2
PERFORMANCE MEASURES AND SEEM PLAN 3
4
Q. DOES BELLSOUTH PLAN TO MAKE CHANGES TO ITS 5
PERFORMANCE MEASUREMENTS TO ADDRESS BATCH HOT CUTS 6
SPECIFICALLY IF IT RECEIVES RELIEF FROM UNBUNDLED CIRCUIT 7
SWITCHING? 8
9
A. Yes. There are a few hot cut processes that are either not covered by the 10
existing measurements or, given the anticipated volume of hot cuts if 11
switching is no longer required, that this Commission may want to monitor 12
more closely. First, BellSouth does not currently measure certain pre-13
ordering and ordering functions for Batch Hot Cuts, in part because they 14
are project managed. Therefore, BellSouth proposes to add a new Pre-15
Ordering measure to capture its performance in the initial stage of 16
processing a CLEC request for a batch conversion. BellSouth also 17
proposes to modify four of the Ordering measurements to include project 18

37
managed batch hot cuts that were previously excluded. BellSouth’s Exhibit 1
AJV-2 contains the proposed changes to the current Alabama 2
performance measurements to incorporate batch hot cuts. Additions to 3
the existing performance measures are shown in the Exhibit AJV-2 as red 4
underlined text and deletions are as blue strike-through. For the new 5
measures that BellSouth proposes to add to the Alabama SQM, the entire 6
SQM page is reflected as red underlined text in the exhibit. 7
8
As previously discussed, the existing hot cut timeliness measures P-7 and 9
P-7A only record data for coordinated hot cuts. In fact, the data necessary 10
to produce these measurements are only available for coordinated hot 11
cuts. It is not clear whether CLECs will elect to use coordinated or non- 12
coordinated hot cuts to convert customers from UNE-P to UNE-L if 13
switching is no longer a UNE. Therefore, BellSouth proposes to add one 14
new provisioning measure to capture BellSouth’s performance on non-15
coordinated cutovers. Finally, there is one change in the existing 16
coordinated customer conversion interval measure to include the time to 17
notify the CLEC that the cutover has been completed. 18
19
Q. PLEASE DESCRIBE A BATCH HOT CUT FROM THE PERSPECTIVE 20
OF WHAT BELLSOUTH PROPOSES TO MEASURE. 21
22
A. Mr. Ainsworth describes batch hot cuts in detail, so I will only briefly focus 23
on those aspects of the batch hot cut process that would be measured. 24
Also, it should be noted that throughout this testimony the terms “batch” 25
38
hot cut and “bulk” hot cut will be used interchangeably. A batch hot cut is 1
like any other hot cut except for the preordering and ordering processes. 2
For batch hot cuts, the process is designed to facilitate ordering large 3
volumes of loop hot cuts simultaneously. The batch hot cut process begins 4
with submission of a Bulk Migration Notification Form by the CLEC 5
wherein due dates for many different accounts can be requested at one 6
time. Submission of this form initiates the preordering process and a 7
unique project number is assigned ending in the characters “BULK”. 8
9
For batch hot cuts, a project manager is assigned at the time of the 10
CLEC’s initial request, and follows the project until completion. BellSouth 11
forwards the information provided by the CLEC to each of the groups 12
required to analyze the data and establish due dates, which are returned 13
to the CLEC. BellSouth then provides this information to the CLEC. 14
15
After the CLEC receives the preordering information from BellSouth, the 16
CLEC begins placing orders. The CLEC can consolidate UNE-P hot cuts 17
for up to 99 accounts, with each account containing up to 25 lines on a 18
single batch LSR. BellSouth’s systems convert each batch LSR into 19
single LSRs for processing and service order issuance. Each individual 20
LSR spawned by the batch LSR contains the unique project number 21
assigned during the preordering process. The individual LSRs resulting 22
from the batch LSR are treated similarly to any other hot cut LSR for 23
operational purposes. 24
25

39
Q. TO WHAT EXTENT ARE BATCH HOT CUT RESULTS INCLUDED IN 1
THE EXISTING PERFORMANCE MEASURES AND THE SEEM PLAN? 2
3
A. While batch hot cuts are not currently included in ordering measurement 4
results, they are reflected in other measurements where applicable. 5
Specifically, coordinated batch hot cuts would be included in the four hot 6
cuts measures that were discussed previously (i.e ., P-7, P-7A, P-7B and 7
P-7C). For designed loops, CLECs are required to request order 8
coordination on batch hot cuts. In cases where the loops ordered are not 9
designed, CLECs can order batch hot cuts with or without order 10
coordination. Therefore, the measures P-7, P-7A and P-7B, would 11
currently include batch hot cuts except in those case where CLECs 12
choose not to request order coordination for non-design loops. Both 13
coordinated and non-coordinated batch hot cuts also show up in 14
measures such as: P-3, Percent Missed Installation Appointments; P-8, 15
Percent Provisioning Troubles wi thin 30 Days of Service Order 16
Completion; M&R-1, Missed Repair Appointments; M&R-2: Customer 17
Trouble Report Rate; and M&R-3, Maintenance Average Duration. 18
19
Further, for situations where the hot cut is associated with a number port 20
(this permits the telephone number to be ported so that the end user can 21
keep the same telephone number with the new carrier), LNP measures 22
also apply. Specifically, hot cuts are already included in LNP 23
measurements such as: P-13B, LNP - Percent Out of Service < 60 24
Minutes; P-13C, Percentage of Time BellSouth Applies the 10-Digit 25

40
Trigger Prior to the LNP Order Due Date; P-13D, LNP- Average 1
Disconnect Timeliness Interval (Non-Trigger). These LNP measures are 2
not currently part of the Alabama SQM; however, I have provided the 3
performance results for these measures based on Alabama data. 4
5
Q. PLEASE DISCUSS THE NEW PRE-ORDERING MEASUREMENT THAT 6
BELLSOUTH PLANS TO ADD TO ITS SQM, IF IT RECEIVES 7
UNBUNDLED SWITCHING RELIEF. 8
9
A. BellSouth proposes to add a Pre-Ordering measure, PO-3, UNE Bulk 10
Migration – Response Time, if it receives unbundled switching relief. This 11
proposed measurement is designed to capture the time that it takes for 12
BellSouth to provide the requesting CLEC with a response to its UNE Bulk 13
Migration Notification Form, which begins prior to the creation of an LSR. 14
The submittal of this form by the CLEC triggers the assignment of a 15
project manager to this request who handles providing a timely response 16
back to the CLEC. The interval being measured begins upon receipt of 17
the UNE Bulk Migration Notification Form by BellSouth and ends when a 18
response is transmitted back to the CLEC. To meet the performance 19
standard, BellSouth must provide a response to the CLEC within 7 20
business days for bulk migration requests of less than 99 individual LSRs 21
and within 10 business days for 100 to 199 individual LSRs. Because the 22
intervals for 200 or more LSRs are negotiated, no benchmark applies. 23
The details of this measure are included in Exhibit AJV-2. Because 24
processing of the Bulk Migration Notification Form is the only Ordering or 25

41
Pre-Ordering process that is not covered by existing measurements, no 1
additional measurements of ordering or pre-ordering are proposed. 2
3
Q. WHAT REVISIONS TO ORDERING MEASURES ARE BEING 4
PROPOSED BY BELLSOUTH? 5
6
A. As previously discussed, batch hot cuts are currently excluded from 7
measures of the Ordering processes because they are project managed. 8
Project managed orders are those orders which require more detailed and 9
specific information from the CLEC in order to manage the cycle from 10
service request to service completion. Specifically, these orders are of a 11
level of complexity that requires the assignment of a project manager to 12
oversee the order from beginning to end. The Ordering measures carry 13
an exclusion for orders that are project managed because project 14
managed orders are not considered in the normal flow of order types that 15
can be responded to by BellSouth according to standard and well-16
established time frames. Typically, the timeframes for responding to such 17
orders are non-standard, so they do no lend themselves to evaluation via 18
an objective standard. Consequently, ordering data produced for the 19
typical project managed order does not provide any insight on the quality 20
of BellSouth’s performance. 21
22
Hot cuts can be included in the ordering measures, however, even though 23
they are project managed because project management of Batch 24
migrations does not affect the timeframes for processing the underlying 25

42
LSRs after they are generated. Thus, the variability and uniqueness 1
normally associated with project managed LSRs generally do not apply to 2
Batch migrations once the individual LSRs are generated. These LSRs 3
also have a unique project identifier that facilitates inclusion in the ordering 4
measures by permitting them to be separately identified from other 5
projects. BellSouth proposes to modify the exclusion for projects in the 6
ordering measures to include batch migration LSRs. This Ordering 7
measurement change is reflected in the Alabama SQM for the following 8
measures, attached as Exhibit AJV-2: 9
• O-7: Percent Rejected Service Requests 10
• O-8: Reject Interval 11
• O-9: Firm Order Confirmation Timeliness 12
• O-11: Firm Order Confirmation and Reject Response 13
Completeness 14
An additional change is required to account for the unique type of LSR 15
that a CLEC can submit in this case. Instead of submitting separate LSRs 16
for each account that the CLEC wants to transfer, up to 99 accounts can 17
be submitted on a single “Global” LSR. BellSouth’s systems convert this 18
Global LSR into multiple separate LSRs needed to create service orders 19
to provision the services. This process is unique to batch migrations. For 20
these batch migration LSRs, the start time will be receipt of the Global 21
LSR, so the same incoming timestamp will apply to each LSR spawned by 22
the Global LSR. The Global LSR, however, should not be included in the 23
count of LSRs because the individual LSRs resulting from the Global LSR 24
are the items that receive the reject or FOC responses that are tracked in 25

43
reported results. The ordering measurements O-8 and O-9 should be 1
modified to reflect this fact. 2
3
Q. DOES BELLSOUTH PROPOSE ANY NEW MEASUREMENTS FOR THE 4
PROVISIONING PROCESS? 5
6
A. Yes. To display whether BellSouth meets its provisioning obligations for 7
noncoordinated hot cuts, a new provisioning measure, P-7E, Non-8
Coordinated Customer Conversions - % Completed and Notified on Due 9
Date, is proposed. 10
11
Specifically, this new measure would provide results indicating whether 12
BellSouth completes a non-coordinated customer conversion on the due 13
date and provides notification of completion to the CLEC on the same 14
date. This is the obligation that BellSouth makes to CLECs on non-15
coordinated hot cuts. This measure is also proposed to be included in both 16
Tier 1and Tier 2 of SEEM. 17
18
Q. WHAT DOES BELLSOUTH PROPOSE TO CHANGE FOR EXISTING 19
PROVISIONING MEASURES? 20
21
A. The relevant Provisioning measures currently include projects and, 22
consequently, also include batch hot cuts. Thus, there is no need to 23
change the existing provisioning measures to capture batch hot cuts. 24
BellSouth is, however, proposing the modification of measure P-7, 25

44
Coordinated Customer Conversions Interval, to include the time to notify 1
the CLEC that BellSouth has completed the conversion (see Exhibit AJV-2
2). This is an issue raised by the CLECs that BellSouth’s hot cut interval 3
does not include the time to notify the CLEC that the transfer is complete. 4
5
The current established standard for the conversion interval is 15 minutes 6
per line. The objective time to notify the CLEC that the cutover has been 7
completed is 5 minutes. Therefore, in adjusting this measure to include 8
the time to notify the CLEC, the proposed standard conversions interval is 9
changed from 15 minutes per line to 20 minutes per line. The proposed 10
changes to this measure are included in Exhibit AJV-2. 11
12
Q. YOU HAVE PROPOSED CHANGES TO CERTAIN MEASURES OR THE 13
ADDITION OF MEASURES IN THE PRE-ORDERING, ORDERING AND 14
PROVISIONING CATEGORIES, BUT NO CHANGES TO MAINTENANCE 15
AND REPAIR. WHY IS THIS? 16
17
A. While there are certain activities particular to batch hot cuts in some of the 18
Pre-Ordering, Ordering and Provisioning processes, there is nothing in the 19
Maintenance & Repair process that would distinguish a line associated 20
with a batch hot cut from any other line. Once the lines associated with 21
the batch hot cut have been converted, the process necessary to report a 22
line trouble and the process necessary to resolve a line trouble are exactly 23
the same as for any other lines. 24
25

45
Q. HOW WILL BELLSOUTH’S PROPOSED CHANGES TO THE 1
PERFORMANCE MEASUREMENTS IMPACT SEEM? 2
3
A. Any existing measurements that BellSouth has proposed to change that 4
are currently in SEEM will remain in SEEM. Any new data that will be 5
reflected in those measurements will be added to one of the existing 6
SEEM disaggregations. The new measurement, P-7E, that BellSouth 7
proposes to add to the Alabama SQM is also proposed as a new 8
measurement in the SEEM plan in both Tier 1 and Tier 2. Exhibit AJV-3 9
includes the proposed changes to the SEEM plan and are reflected as red 10
underlined text. 11
12
Q. DOES THIS CONCLUDE YOUR TESTIMONY? 13
14
A. Yes. 15


