26
Benchmarking Best Practices and Establishing Key Performance Indicators CAUBO 2004 June 12, 2004
| Date post: | 27-Dec-2015 |
| Category: |
Documents |
| Upload: | mabel-grant |
| View: | 216 times |
| Download: | 0 times |
Benchmarking Best Practicesand Establishing
Key Performance Indicators
CAUBO 2004June 12, 2004
BenchmarkingThe U of C Experience
• Definitions
• Key Elements of Benchmarking
• Key Performance Indicators and Measuring the Results
• Outcomes
• Observations and Issues
Benchmarking
• Benchmarking is the search for best practices.• Benchmarking allows your organization to see what
others are doing, what is working for them, and what to avoid.
• The American Productivity & Quality Center defines benchmarking as:
"'the process of identifying, understanding, and adapting outstanding practices and processes from organizations anywhere in the world to help your organization improve its performance."
Best Practice
A best practice is a proven and documented strategy or tactic that delivers measurable improvements in economies, efficiency and/or effectiveness.
They must:
– Drive a measurable change in performance– Be Proven in practice– Apply to a broad spectrum of organizations– Exploit proven technologies– Ensure effective control and risk management
Best Practices allow companies to outperform their competitors and peers in specific operational areas…and deliver more value at less cost. PeopleSoft HEUG 2004PeopleSoft HEUG 2004
Key Performance Indicators (KPI’s)
Definition:
Activities, transactions and attributes of a supply department that are selected from accepted benchmarking practice measurements and from unique internal operations that represent the performance of the supply operation and which are used to compare and measure performance toward achieving the department’s vision and best practice.
Types: QuantitativeQualitativeValues Based
Richard Ogilvie 2004
These are:• economies and efficiencies indicators that
are easily quantifiable and lend themselves to statistical measurement and reporting.
These may include statistics such as:• Number of purchase orders processed, dollar
values of purchase orders etc.Richard Ogilvie 2004
Quantitative Indicators
These are: • effectiveness indicators• not as easily identifiable as their quantitative
counterparts.• Identifiable attributes of your operation that
can impact the success of your operation.These can include:• customer satisfaction levels, professional
certification, defined skill sets, training, documented procedures, etc.
Richard Ogilvie 2004
Qualitative Indicators
These relate:• to areas that define the core activities, values and belief system of an
organization and can represent a broad range of subject matter anywhere from business priorities and innovation through to social responsibilities and ethics.
These can include:• values of an organization that distinguish it or make it stand out from
other organizations• codes of conduct, quality of work life statements, statements of moral
responsibility and positions on social and environmental issues as well as organizational emphasis on such things as the value and access to education, corporate contribution to the community, strategic business direction etc.
These are:• seen most often as guiding principles underlying strategic supply
relationshipsRichard Ogilvie 2004
Values Based Indicators
Key Elements of Benchmarking
• Knowing what you want to be (vision) – environmental scan and search for best practices – external benchmarking and translate to fit your university
• Knowing what you want to do to get there (goals) - environmental scan and search for best practices – external benchmarking and translate to fit your university
• Knowing where you have been and where you are now (past and current state assessment) – internal scan and identify key performance indicators that can be tracked historically (how do you know where you want to be and how you want to get there, if you don’t know where you have been and what you were doing and where you are today and how you got here)
• Measuring your performance historical to current and between organizations - internal and external – to let you know how you are doing and making adjustments where necessary
• Continuous Improvement – exercising Self-discipline – in analyzing, interpreting, sharing data and information and implementing improvements
Richard Ogilvie 2004
Knowing what you want to be (vision) – best practices and external benchmarking (external environmental
scan)
• Some things to remember about university supply management and visioning your role:– You function in a diverse and complex organization atmosphere!–
select your supply management tools carefully to reflect the diversity and decentralization necessary (do not put all of your eggs in one basket)
– Whatever services you supply it is in support of the core mission of the university! (different institutions provide different “supply services” within their “purchasing” operations) – do not consider these services in isolation of other services in the supply chain; add value …. don’t download work
– There is a myriad of information available to you on “strategically positioning” purchasing and supply management within organizations! (NIGP, ISM, CAPS etc.) research it
– Adding value while reducing cost to your university is not just best practice! - it is the essence of supply chain management
Knowing what you want to be (vision) - Translating the environmental scan and best practice into vision at the U of C
Commencing in 1997:• Have utilized a facilitated strategic planning process:
– Involves key Materials Management staff (50% of the total staff); and,– Occurs annually to review, adjust and update mission, goals and objectives
– this year will be our 7th.
• Complete an annual environmental scan:– Identify best practice externally and question as well as adjust our strategic
purchasing alignment annually (benchmark);– Participate in external benchmarking exercises (e.g. U of A, CAUBO, CAPS
etc) and,– Conduct SWOT Analysis (internally).– Examples of areas we look at include supply management tools and
technology
• Have developed a Strategic/ Vision Statement:– Adopted a Supply Chain Management Strategy which sees the U of C’s
Materials Management department as the “synthesis” of its customer and materiel requirements, its supply processes, its staff, the University’s values and its supplier relationships - it exists to maximize the supply value to the organization
Knowing what you want to do to get there (goals) – Translating vision into measurable goals at the U of C
Ultimately our U of C Materials Management Goals are to:• Reduce the amount of time spent on purchasing transaction processing both
centrally and de-centrally (best practice) ;• Increase the amount of time spent on introducing value-added supply services
(best practice) ; and,• Increase the time spent on understanding and acting on the performance of
supply services (best practice) .
We have planned to get there by:• Searching for continuous improvement in our operations (best practice) ;• Emphasizing the importance of our staff and their professional development
(best practice) ;• Applying technology wherever we can leverage efficiency (best practice) ;• Applying the appropriate supply management tools to fit the need (best
practice) ; and,• Demonstrating respect and professionalism in our business approach and
ethics (best practice) .
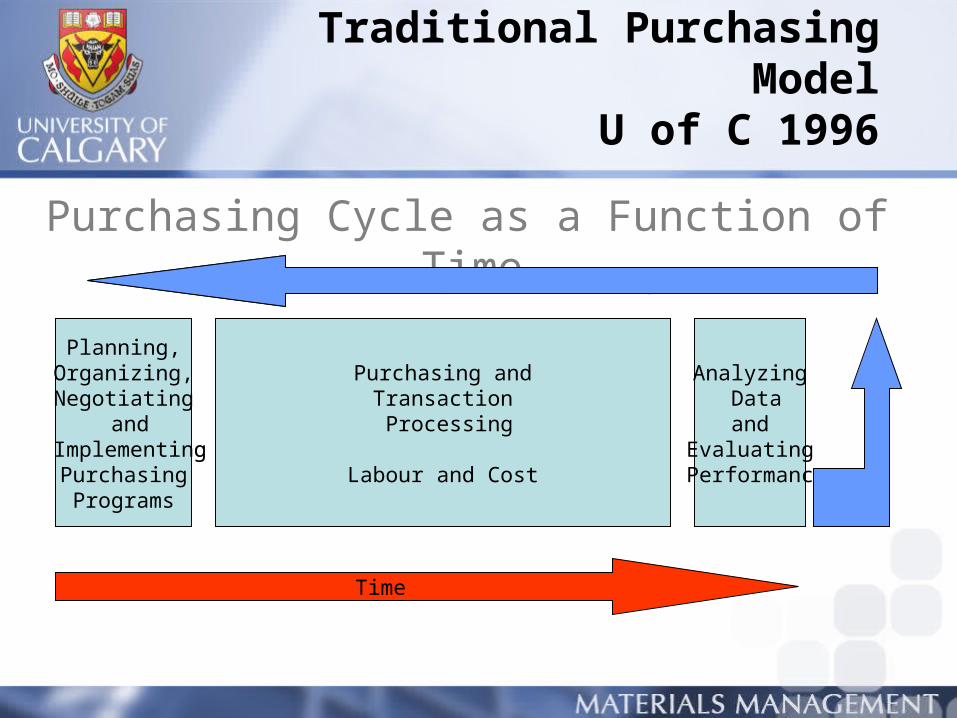
Traditional Purchasing ModelU of C 1996
Purchasing Cycle as a Function of Time
Planning, Organizing, Negotiating
and Implementing
Supply Programs
Plan Development and Quality Control
Purchasing andTransaction Processing
Labour and Cost
Analyzing Dataand
Evaluating Performance
Time
Planning, Organizing, Negotiating
and Implementing
PurchasingPrograms
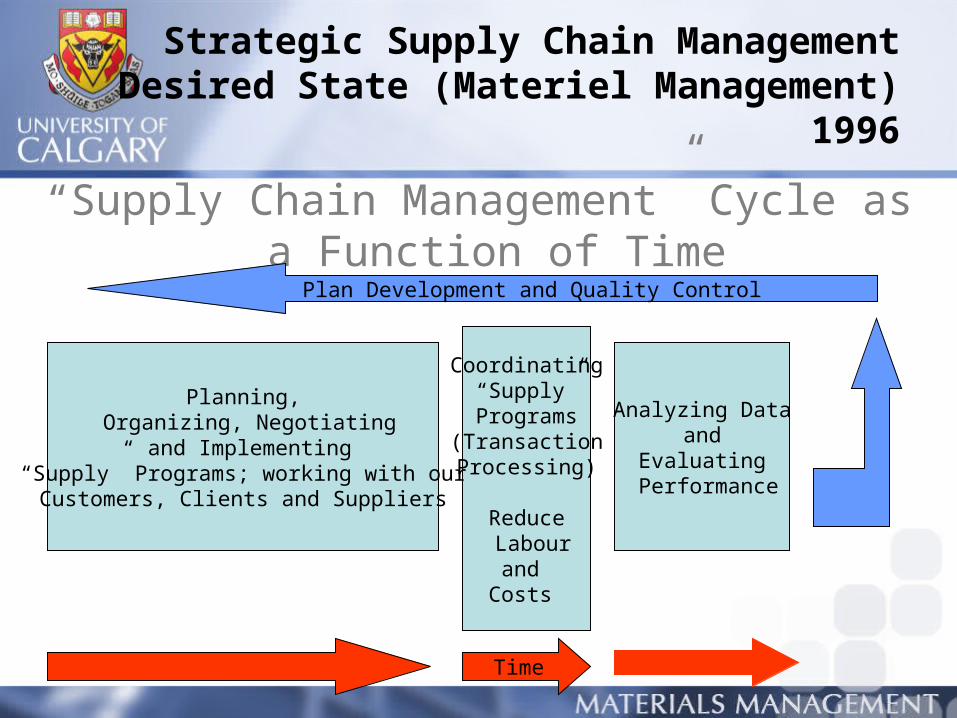
Strategic Supply Chain ManagementDesired State (Materiel Management)
1996
“Supply Chain Management” Cycle as a Function of Time
Coordinating“Supply”
Programs (Transaction Processing)
Reduce Labour
and Costs
Time
Planning, Organizing, Negotiating
and Implementing“Supply” Programs; working with our
Customers, Clients and Suppliers
Analyzing Dataand
Evaluating Performance
Plan Development and Quality Control
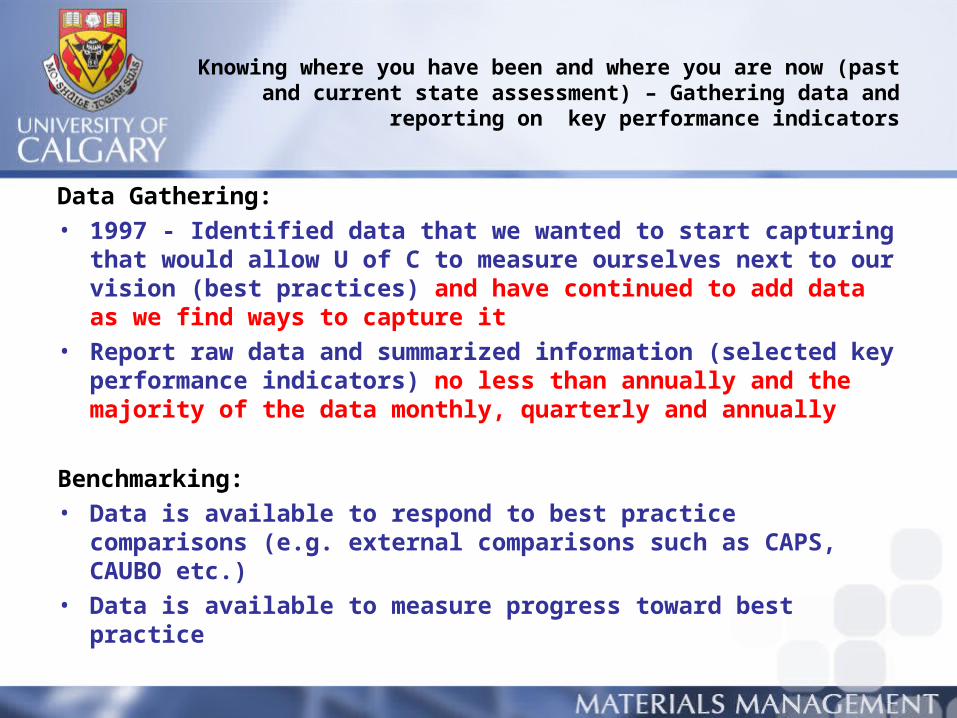
Knowing where you have been and where you are now (past and current state assessment) – Gathering data and reporting on key
performance indicators
Data Gathering:• 1997 - Identified data that we wanted to start capturing that
would allow U of C to measure ourselves next to our vision (best practices) and have continued to add data as we find ways to capture it
• Report raw data and summarized information (selected key performance indicators) no less than annually and the majority of the data monthly, quarterly and annually
Benchmarking:• Data is available to respond to best practice comparisons (e.g.
external comparisons such as CAPS, CAUBO etc.)• Data is available to measure progress toward best practice
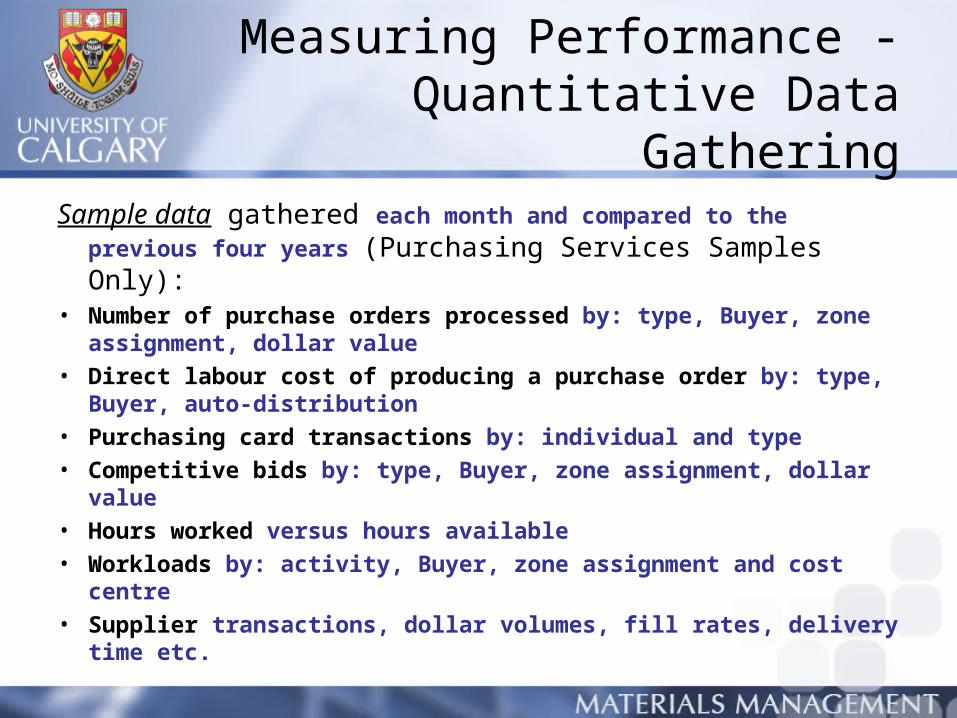
Measuring Performance - Quantitative Data Gathering
Sample data gathered each month and compared to the previous
four years (Purchasing Services Samples Only):• Number of purchase orders processed by: type, Buyer, zone
assignment, dollar value
• Direct labour cost of producing a purchase order by: type, Buyer, auto-distribution
• Purchasing card transactions by: individual and type
• Competitive bids by: type, Buyer, zone assignment, dollar value
• Hours worked versus hours available
• Workloads by: activity, Buyer, zone assignment and cost centre
• Supplier transactions, dollar volumes, fill rates, delivery time etc.
Quantitative Performance Indicators for Measuring Economies andEfficiencies Best Practice
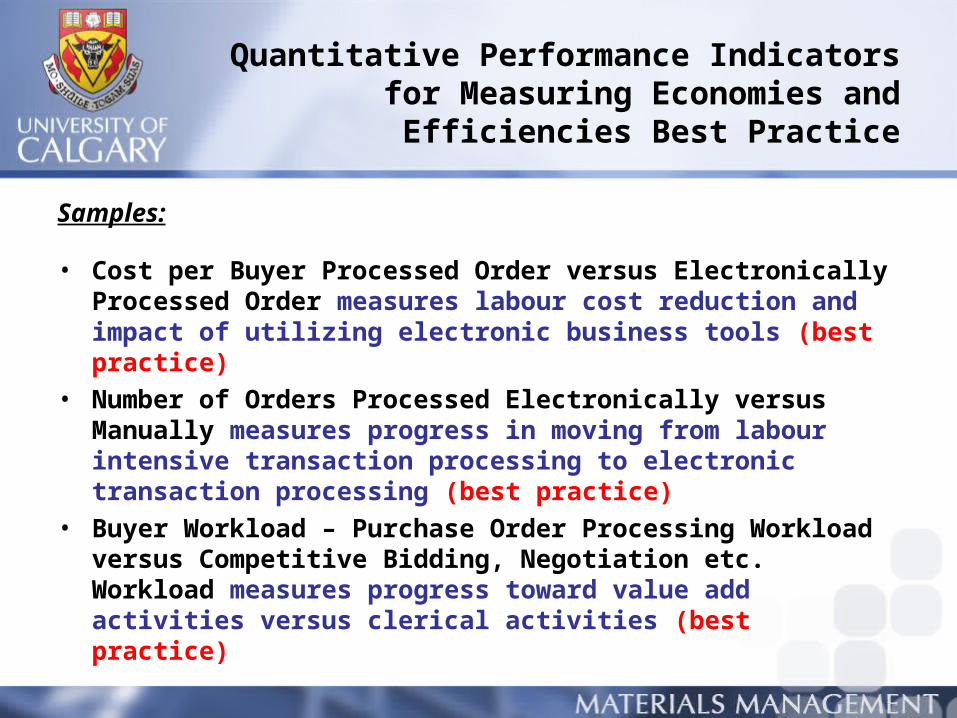
Samples:
• Cost per Buyer Processed Order versus Electronically Processed Order measures labour cost reduction and impact of utilizing electronic business tools (best practice)
• Number of Orders Processed Electronically versus Manually measures progress in moving from labour intensive transaction processing to electronic transaction processing (best practice)
• Buyer Workload – Purchase Order Processing Workload versus Competitive Bidding, Negotiation etc. Workload measures progress toward value add activities versus clerical activities (best practice)
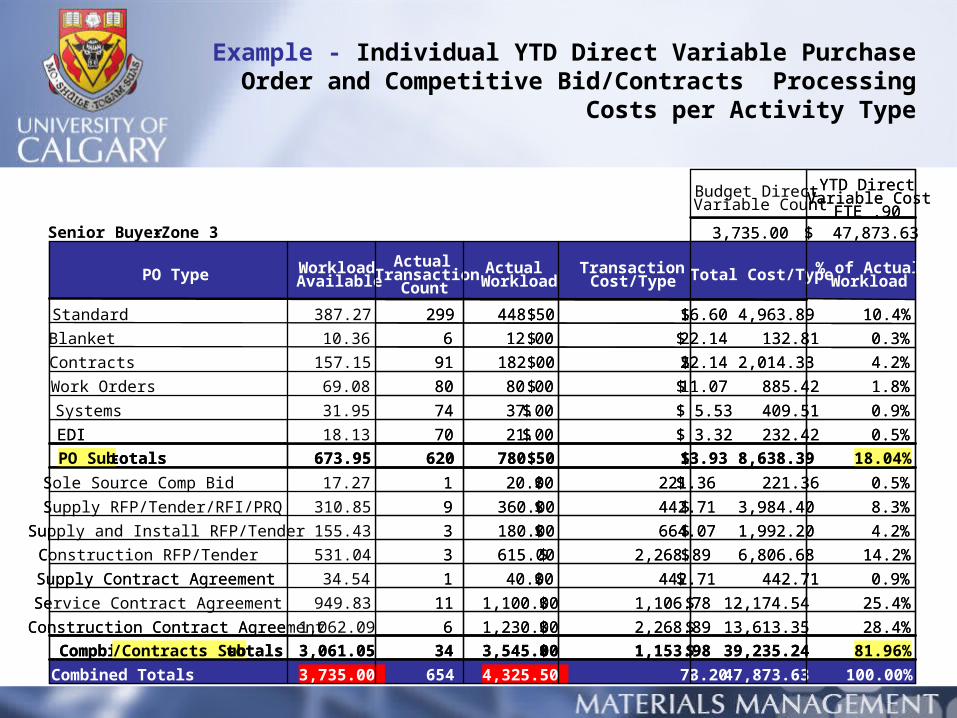
Example - Individual YTD Direct Variable Purchase Order and Competitive Bid/Contracts Processing
Costs per Activity Type
100.00%$ 47,873.63 $ 73.20 4,325.50 654 3,735.00 Combined Totals
81.96%$ 39,235.24 $ 1,153.98 3,545.00 34 3,061.05 Compbid/Contracts Sub-totals
28.4%$ 13,613.35 $ 2,268.89 1,230.00 6 1,062.09 Construction Contract Agreement
25.4%$ 12,174.54 $ 1,106.78 1,100.00 11 949.83 Service Contract Agreement
0.9%$ 442.71 $ 442.71 40.00 1 34.54 Supply Contract Agreement
14.2%$ 6,806.68 $ 2,268.89 615.00 3 531.04 Construction RFP/Tender
4.2%$ 1,992.20 $ 664.07 180.00 3 155.43 Supply and Install RFP/Tender
8.3%$ 3,984.40 $ 442.71 360.00 9 310.85 Supply RFP/Tender/RFI/PRQ
0.5%$ 221.36 $ 221.36 20.00 1 17.27 Sole Source Comp Bid
18.04%$ 8,638.39 $ 13.93 780.50 620 673.95 PO Sub-totals
0.5%$ 232.42 $ 3.32 21.00 70 18.13 EDI
0.9%$ 409.51 $ 5.53 37.00 74 31.95 Systems
1.8%$ 885.42 $ 11.07 80.00 80 69.08 Work Orders
4.2%$ 2,014.33 $ 22.14 182.00 91 157.15 Contracts
0.3%$ 132.81 $ 22.14 12.00 6 10.36 Blanket
10.4%$ 4,963.89 $ 16.60 448.50 299 387.27 Standard
% of Actual WorkloadTotal Cost/TypeTransaction
Cost/TypeActual
WorkloadActual
Transaction Count
Workload AvailablePO Type
$ 47,873.63 3,735.00Senior Buyer - Zone 3
YTD Direct Variable Cost
FTE .90Budget Direct Variable Count
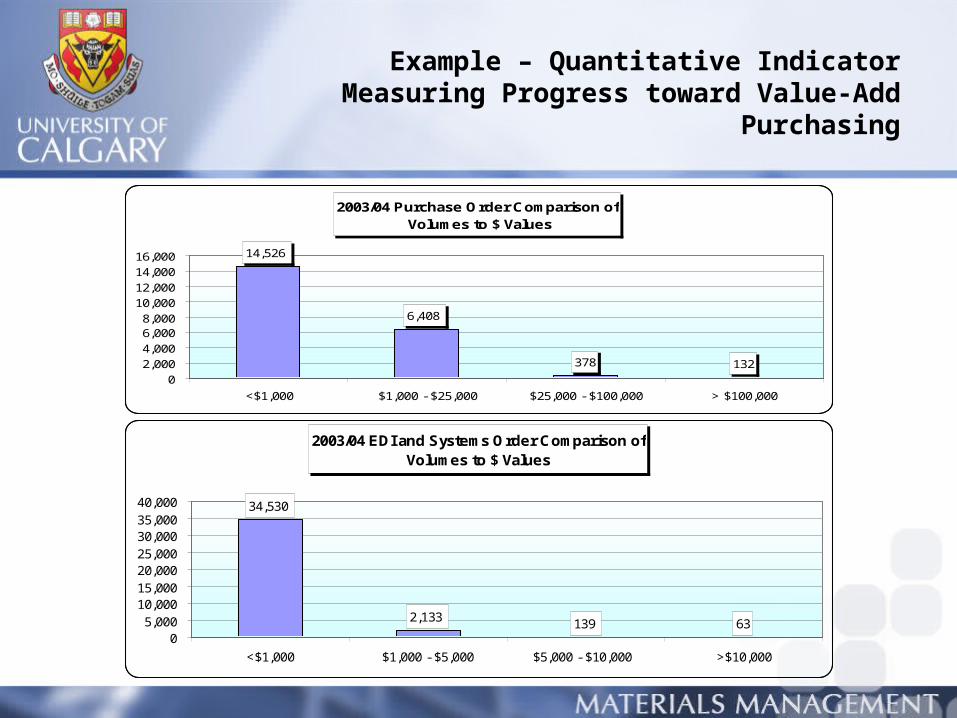
Example – Quantitative IndicatorMeasuring Progress toward Value-Add Purchasing
2003/04 Purchase Order Comparison of Volumes to $ Values
14,526
6,408
378 1320
2,0004,0006,0008,000
10,00012,00014,00016,000
<$1,000 $1,000 - $25,000 $25,000 - $100,000 > $100,000
2003/04 EDI and Systems Order Comparison of Volumes to $ Values
2,133 139 63
34,530
05,000
10,00015,00020,00025,00030,00035,00040,000
<$1,000 $1,000 - $5,000 $5,000 - $10,000 >$10,000
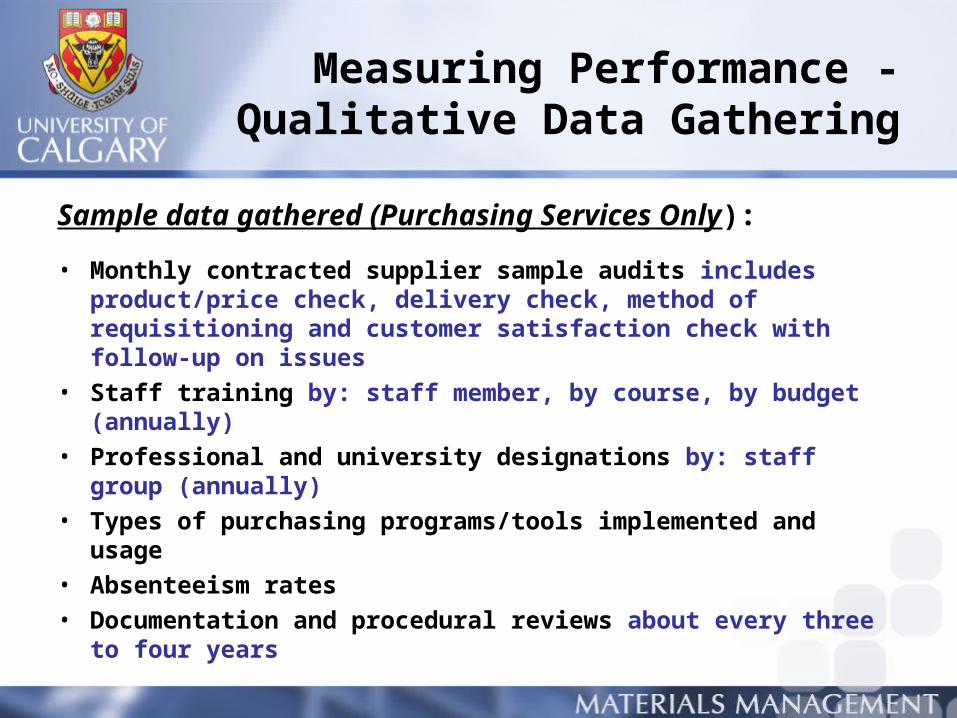
Measuring Performance - Qualitative Data Gathering
Sample data gathered (Purchasing Services Only):
• Monthly contracted supplier sample audits includes product/price check, delivery check, method of requisitioning and customer satisfaction check with follow-up on issues
• Staff training by: staff member, by course, by budget (annually)• Professional and university designations by: staff group
(annually)• Types of purchasing programs/tools implemented and usage• Absenteeism rates• Documentation and procedural reviews about every three to
four years
Qualitative Performance Indicators for Measuring Effectiveness Best Practice
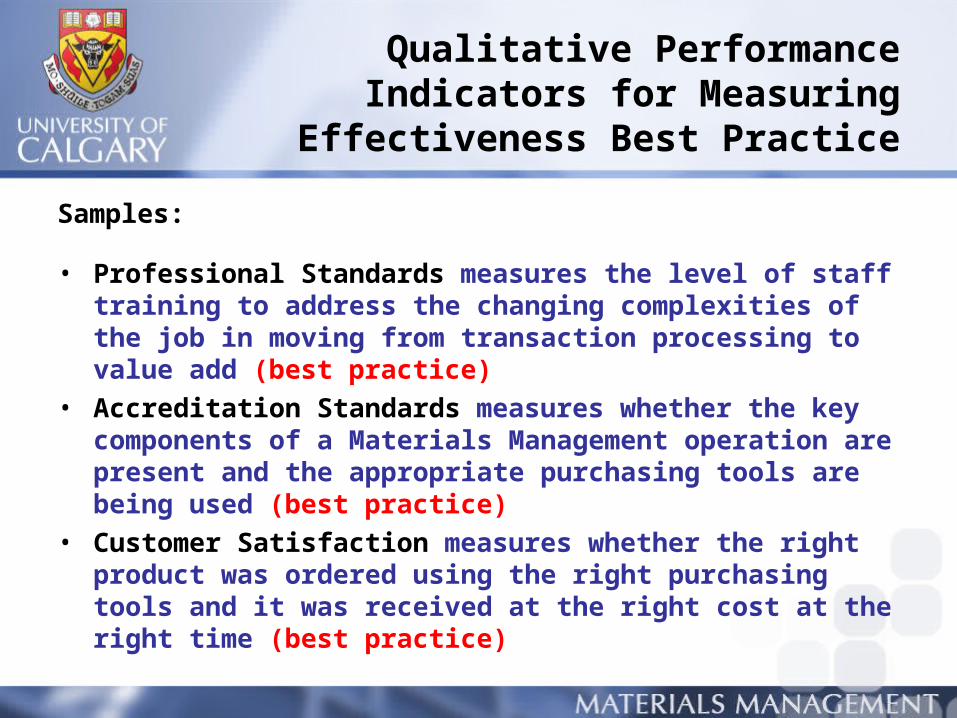
Samples:
• Professional Standards measures the level of staff training to address the changing complexities of the job in moving from transaction processing to value add (best practice)
• Accreditation Standards measures whether the key components of a Materials Management operation are present and the appropriate purchasing tools are being used (best practice)
• Customer Satisfaction measures whether the right product was ordered using the right purchasing tools and it was received at the right cost at the right time (best practice)
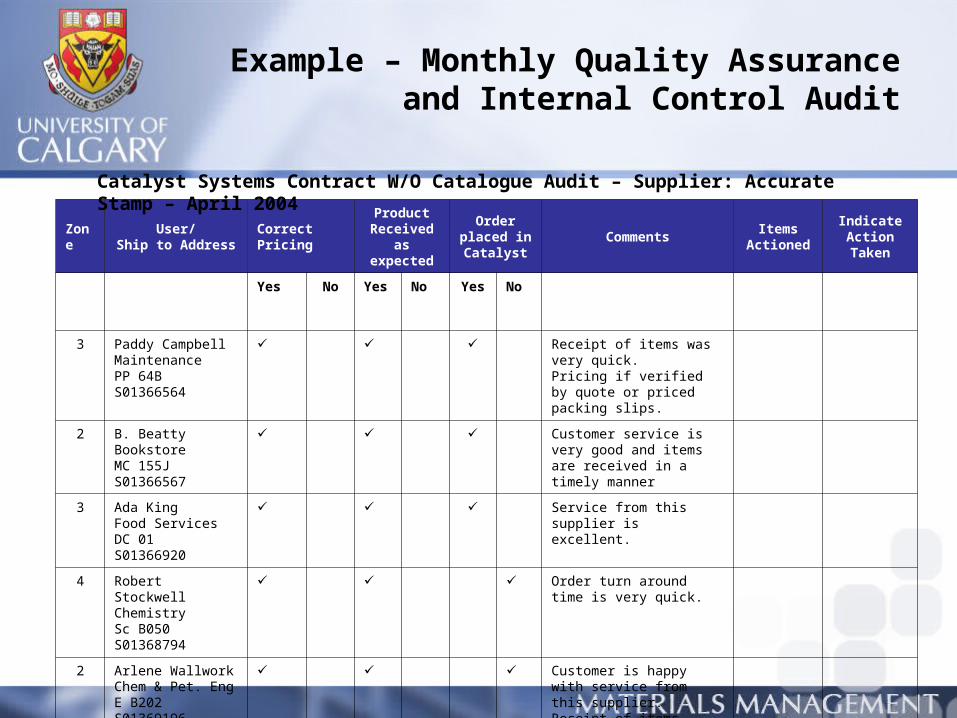
Example – Monthly Quality Assurance and Internal Control Audit
ZoneUser/
Ship to AddressCorrectPricing
Product Received as
expected
Order placed in Catalyst
CommentsItems
Actioned
Indicate Action Taken
Yes No Yes No Yes No
3 Paddy CampbellMaintenancePP 64BS01366564
Receipt of items was very quick.Pricing if verified by quote or priced packing slips.
2 B. BeattyBookstoreMC 155JS01366567
Customer service is very good and items are received in a timely manner
3 Ada KingFood ServicesDC 01S01366920
Service from this supplier is excellent.
4 Robert StockwellChemistrySc B050S01368794
Order turn around time is very quick.
2 Arlene WallworkChem & Pet. EngE B202S01369196
Customer is happy with service from this supplier. Receipt of items ordered is generally very fast.
Catalyst Systems Contract W/O Catalogue Audit – Supplier: Accurate Stamp – April 2004
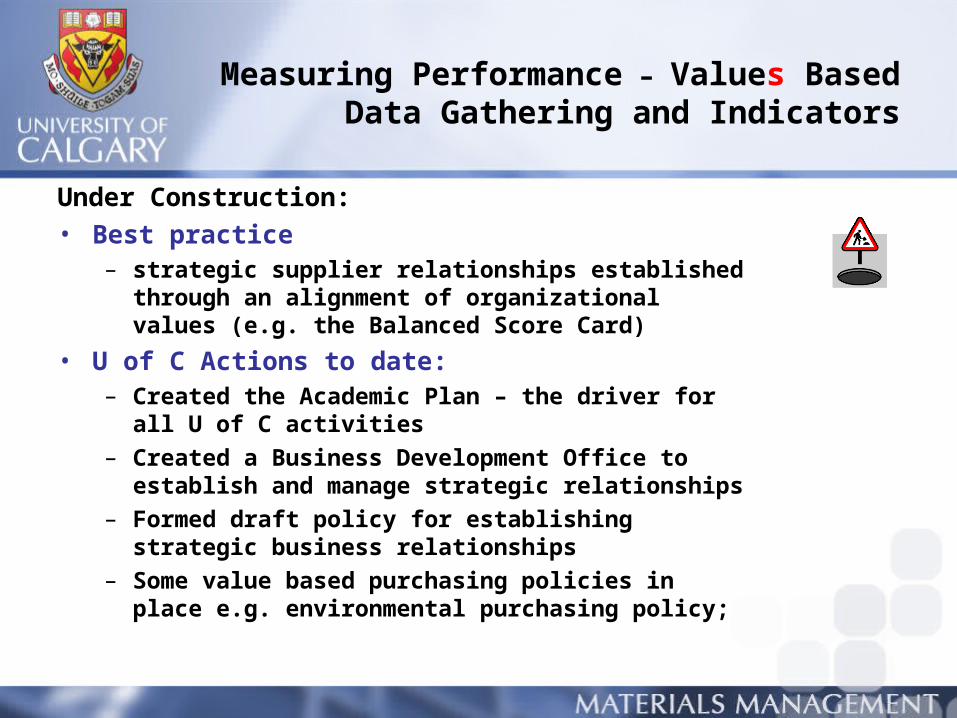
Measuring Performance – Values Based Data Gathering and Indicators
Under Construction:• Best practice
– strategic supplier relationships established through an alignment of organizational values (e.g. the Balanced Score Card)
• U of C Actions to date:– Created the Academic Plan – the driver for all U of C
activities
– Created a Business Development Office to establish and manage strategic relationships
– Formed draft policy for establishing strategic business relationships
– Some value based purchasing policies in place e.g. environmental purchasing policy;
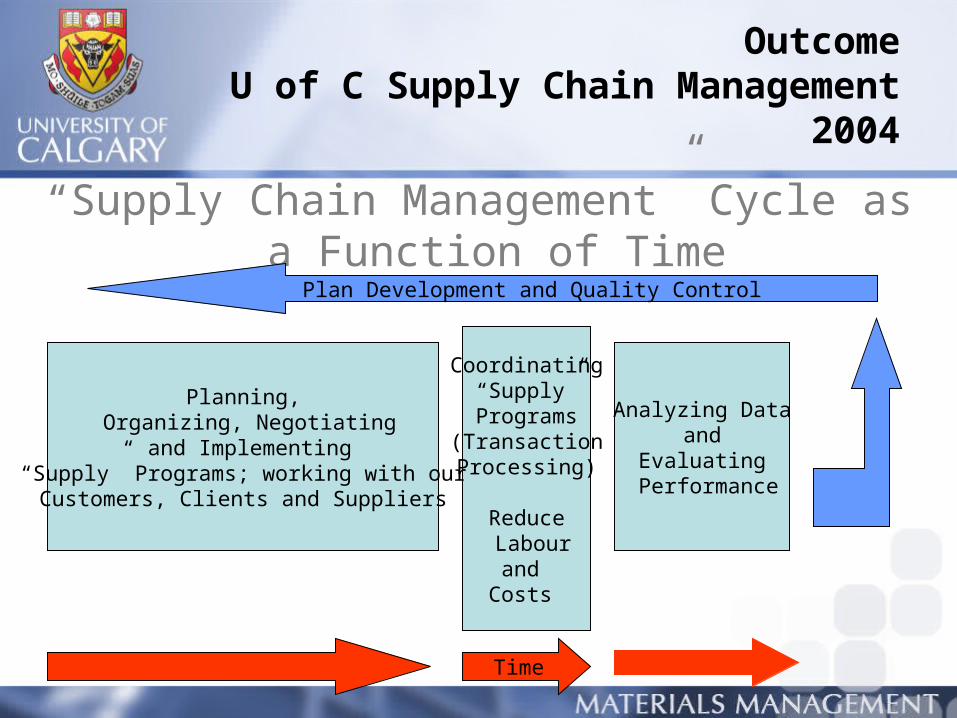
OutcomeU of C Supply Chain Management
2004
“Supply Chain Management” Cycle as a Function of Time
Coordinating“Supply”
Programs (Transaction Processing)
Reduce Labour
and Costs
Time
Planning, Organizing, Negotiating
and Implementing“Supply” Programs; working with our
Customers, Clients and Suppliers
Analyzing Dataand
Evaluating Performance
Plan Development and Quality Control
Benchmarking as Best Practice
The U of C Materials Management Experience:
• benchmarking is in itself a best practice• benchmarking is all about continuous business improvement – it cannot be a one hit wonder – it has to be integrated into your business philosophy and business practice• benchmarking is about change management – giving staff and administration an understanding of what you want to achieve, reporting your progress and rewarding outcomes• benchmarking is about ensuring that you are selecting the best tools (best practices) to get the job done
……. we would not have achieved our significant business advancements and improvements without it ……..
University Supply Management BenchmarkingSome Challenges and Issues
• Lack of qualitative standards e.g. accreditation standards are non-existent that define, if not best practice, accepted practice• Lack of external reviews focusing on best and accepted practice• “The One Hit Wonder” i.e. no sustained benchmarking activity, that would benchmark institutions on a periodic but regular basis e.g. every 3 to 4 years• Institutions not geared for service evaluation e.g. treading water syndrome• Institutions not identifying the values and guiding principles that should drive business relationships with suppliers e.g. not only missing out on a best practice but how do you measure the effectiveness of these business relationships if you do not understand the basis on which they are built


