36
Benchmarking DBMS’s for Communication Cost Analysis A Work Term Report Presentation Tony Young M.Math Candidate May 27 th , 2005
| Date post: | 19-Dec-2015 |
| Category: |
Documents |
| View: | 213 times |
| Download: | 0 times |
Benchmarking DBMS’s for Communication Cost Analysis
A Work Term Report Presentation
Tony Young
M.Math Candidate
May 27th, 2005

Introduction What is a federated system? Travelocity
Remote searches of airline databases Performs bookings, adds payment details, etc.
Google Scholar Remote searches of ACM, IEEE, etc. databases Presents consolidated view of papers matching
common search criteria

Outline Introduction Organization Optimization Global Cost Modeling Experiments Experimental Procedure Results Conclusion Future Work

Organization
Multidatabase Language Approach Pass-through Querying Global Schema Approach

Organization
Global schema approach Burden of integration is on global DBA Logical global schema Functional compensation Possibly high maintenance

Organization
Global Schema Approach
Physical Org. Logical Org.

Optimization Optimization challenges for the FDBS
Remote site autonomy Remote parameters Translation Heterogeneous capabilities Additional costs
From the perspective of the remote source, the FDBS is just another application requesting data!

Optimization
Omni module in iAnywhere ASA Supports GS approach and pass-through
querying Performance of global queries is not as good
as local queries

Global Cost Modeling Many factors must be taken into account
Optimization Cost (OPT) Communication Cost (COMM) Execution Cost (EXEC) Sub-query/Method Call Costs (SM) Reformatting Costs (RF)
Working Cost Model

Global Cost Modeling Interest for this project is communication cost
LS = Link Speed S = Source/DBMS DS = Data Size DT = Data Type PF = Prefetch Status PS = Packet Size R = Processor Speed

Experiments Goal
Determine if communication cost can be modeled using simple network applications
Determine what factors affect communication cost
Two sets of experiments Pure network benchmarking DBMS benchmarking
Varied each factor mentioned previously, one at a time

Experimental Procedure
Hot cache 30 trials Experimental error below 5% Parameters varied during both sets of
experiments Semantics of prefetching for network
benchmarking
Experimental Procedure
Applications DBCreate NetBench DBBench ResultParse
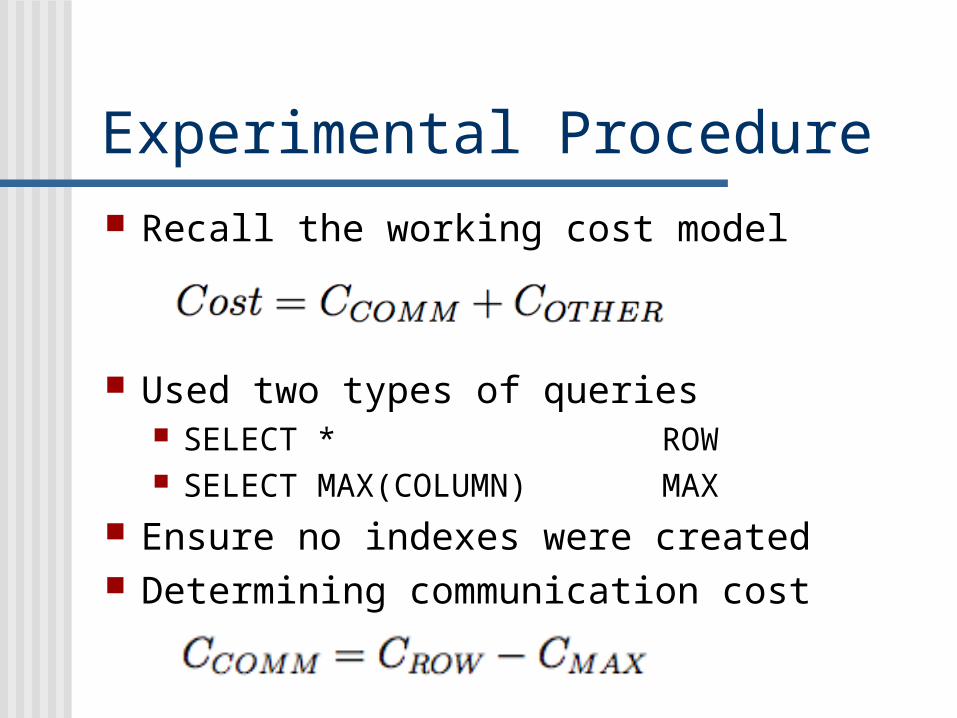
Experimental Procedure Recall the working cost model
Used two types of queries SELECT * ROW SELECT MAX(COLUMN) MAX
Ensure no indexes were created Determining communication cost

Experimental Procedure Recording query execution time

Experimental Procedure Many ways to calculate
Similar overhead in both types of queries
Assumptions Hot cache Transfer of max() value negligible Loop evaluation is negligible
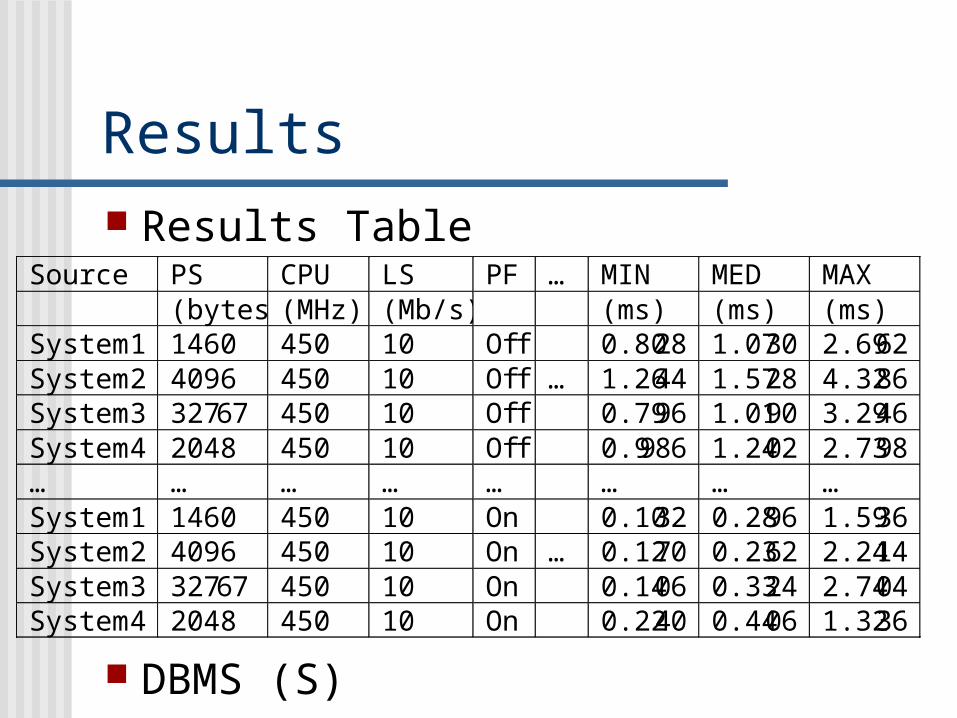
Results Results Table
DBMS (S)
Source PS CPU LS PF … MIN MED MAX (bytes) (MHz) (Mb/s) (ms) (ms) (ms) System 1 1460 450 10 Off 0.8028 1.0730 2.6962 System 2 4096 450 10 Off … 1.2644 1.5728 4.3286 System 3 32767 450 10 Off 0.7996 1.0190 3.2946 System 4 2048 450 10 Off 0.9986 1.2402 2.7398 … … … … … … … … System 1 1460 450 10 On 0.1032 0.2896 1.5936 System 2 4096 450 10 On … 0.1270 0.2362 2.2414 System 3 327 67 450 10 On 0.14 06 0.33 24 2.74 04 System 4 2048 450 10 On 0.22 40 0.44 06 1.32 36

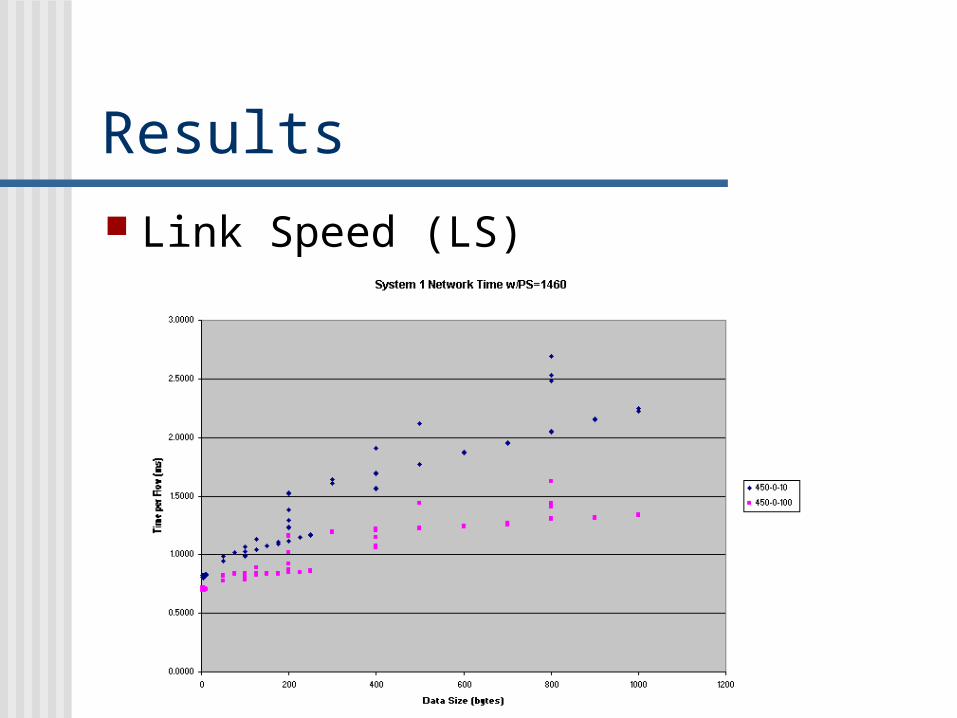
Results
Link Speed (LS)
Source Avg LS
(% Reduction)
System 1 23.79
System 2 12.34
System 3 36.37
System 4 20.61
NetBench 48.90
Results
Link Speed (LS)

Results
Data Size (DS)

Results
Data Type (DT)
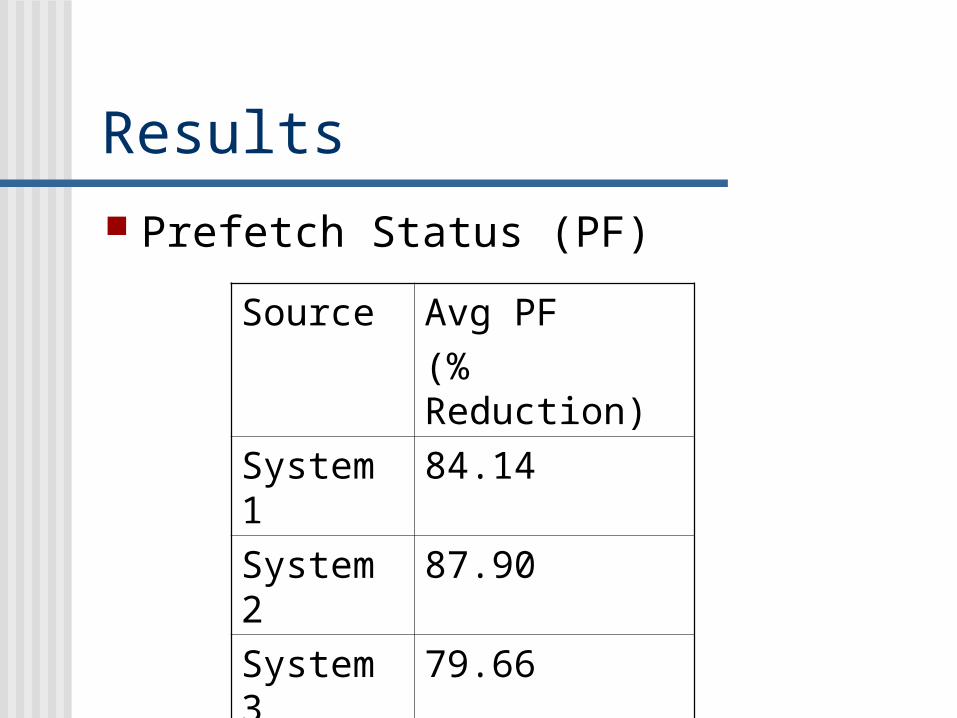
Results
Prefetch Status (PF)
Source Avg PF
(% Reduction)
System 1 84.14
System 2 87.90
System 3 79.66
System 4 75.82
NetBench 99.58
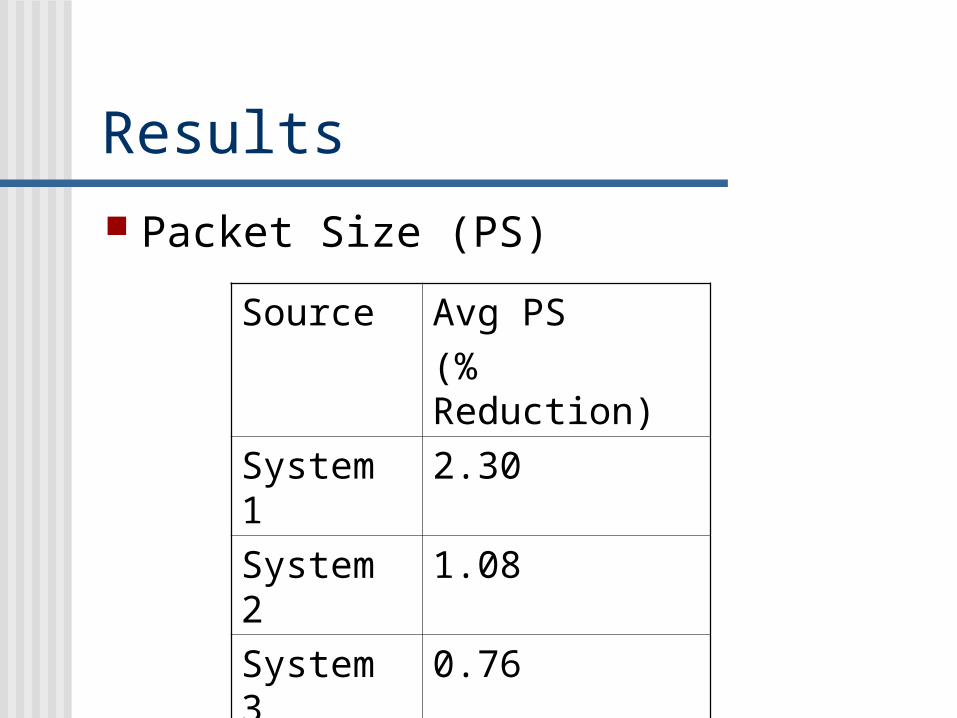
Results
Packet Size (PS)
Source Avg PS
(% Reduction)
System 1 2.30
System 2 1.08
System 3 0.76
System 4 -2.52
NetBench 1.02

Results
Server CPU Speed (CPU)
Source Avg CPU
(% Reduction)
System 1 11.29
System 2 6.37
System 3 10.69
System 4 6.56
NetBench 12.54

Results Other notes
Dominant Factors Consistency
Source Avg Time
(% of NetBench)
System 1 173.04
System 2 239.14
System 3 177.44
System 4 261.86
NetBench 100.00
Source Avg Rel
Error (%)
System 1 0.0274
System 2 0.2026
System 3 0.5756
System 4 0.5043
NetBench 0.0023
Efficiency of Link Usage

Conclusion
Many factors need to be included in cost models Dominant Factors Affecting Factors
Communication cost is not a pure networking problem

Conclusion Each DBMS is different in added
overhead Systems are consistent in overhead Efficiency of link use could improve Ease of control of the factors
Easily controllable Not easily controllable
Much work still to be done!

Future Work
Collection of additional data Generation and testing of a
communication cost model Gathering and analysis of other global
cost model parameters

Acknowledgements iAnywhere for their support
Glenn and Ivan• Support and countless questions
Mike, Anil, Ani, Dan, Matthew• Help and guidance
Mark, Scott and Dave• Hardware loans
Karim, Graham and Ian• Software help
Frank Arranging the work term and help with the report and talk

Want More?
Check out the work term report at http://www.tonyyoung.ca/wtr.pdf

Optimization Semijoin algorithm
Site selection Remote reduction Global reduction Assembly
Minimizes communication costs Exploits heterogeneous capabilities

Optimization Replicate algorithm
Site selection Data transfer Query execution Assembly
Minimizes query response time Exploits varying hardware configurations

Optimization
Difference between semijoin and replicate Assumptions made Execution location

Optimization Garlic
Fire access STAR’s Fire join STAR’s Fire FinishRoot STAR
Hybrid of semijoin and replicate algorithms
Large amount of overhead

Motivation
Proliferation of heterogeneous DBMS’s Data sharing within organizations Differing rates of technology adoption Mergers and acquisitions Geographic separation of teams

Want More?
Check out the work term report at http://www.tonyyoung.ca/wtr.pdf


