Postic and Doussan Plant Methods (2016) 12:33 DOI 10.1186/s13007-016-0133-7
METHODOLOGY
Benchmarking electrical methods for rapid estimation of root biomassFrançois Postic1,2 and Claude Doussan2*
Abstract
Background: To face climate change and subsequent rainfall instabilities, crop breeding strategies now include root traits phenotyping. Rapid estimation of root traits in controlled conditions can be achieved by using parallel electrical capacitance and its linear correlation with root dry mass. The aim of the present study was to improve robustness and efficiency of methods based on capacitance and other electrical variables, such as serial/parallel resistance, conduct-ance, impedance or reactance. Using different electrode configurations and stem contact electrodes, we have meas-ured the electrical impedance spectra of wheat plants grown in pots filled with three types of soil.
Results: For each configuration, parallel capacitance and other linearly independent electrical variables were com-puted and their quality as root dry mass estimator was evaluated by a ‘sensitivity score’ that we derived from Pear-son’s correlation coefficient r and linear regression parameters. The highest sensitivity score was obtained by parallel capacitance at an alternating current frequency of 116 Hz in three-terminal configuration. Using a clamp, instead of a needle, as a stem electrode did not significantly affect the capacitance measurements. Finally, in handheld LCR meter equivalent conditions, capacitance had the highest sensitivity score and determination coefficient (r2 = 0.52) at 10 kHz frequency.
Conclusion: Our benchmarking of linear correlations between different electrical variables and root dry mass ena-bles to determine more coherent practices for ensuring a sensitive and robust root dry mass estimation, including in handheld LCR meter conditions. This would enhance the value of electrical capacitance as a tool for screening crops in relation with root systems in breeding programs.
BackgroundHigher cereal yield are needed to feed a growing popu-lation in the near future [1]. However, partly as a con-sequence of climate change, yield of cereals tends to level off in different parts of the world as crops are fac-ing more often sub-optimal conditions (water, nutrients, temperature) for growth [2]. The root system is a central actor in alleviating stress when inputs are suboptimal or limiting [3] and, in such conditions, water/nutrient cap-ture is directly linked to root distribution and activity in soil in relation with the temporal pattern of resource
availability. For example, depending on rainfall pattern, root proliferation in shallow soil layer may exhaust soil water too quickly before anthesis, detrimentally to yield, while deep rooting would be advantageous in capturing deep stored water at post-anthesis, and beneficial to yield [4–7]. Both modelling and field experiments showed that such a deep rooting could indeed increase or maintain grain yield for rainfed wheat [8, 9]. Nevertheless, regard-less of the root distribution pattern, increase/decrease in root density and biomass would be a factor influenc-ing yield, depending on the environmental conditions [6, 7]. Besides, the early vigour and growth of root systems also plays a major role in drought tolerance, as shown for barley [10]. Whereas high-throughput phenotyping is developing extensively [11, 12], especially on aerial parts,
Open Access
Plant Methods
*Correspondence: [email protected] 2 UMR EMMAH, INRA, UAPV, Domaine Saint-Paul, Site Agroparc, 84914 Avignon, FranceFull list of author information is available at the end of the article
Page 2 of 11Postic and Doussan Plant Methods (2016) 12:33
root system traits’ estimation is still time-consuming, expensive in terms of manpower and highly destructive [13]. In the context of crop selection based on root traits, including greenhouse and field selection stages [14], fast techniques for root systems characterization are relevant and needed [15]. Fast imaging techniques [16] and meth-ods based on the root electrical properties could shorten greenhouse selection stages, but at the cost of limited pot size and varying measurement reliability, respectively.
A linear correlation between root mass and electrical capacitance has been empirically found [17] and, later, an equivalent electrical model has been proposed [18]. The capacitance measurement has been tested for dif-ferent plants under greenhouse condition, for different potting conditions: soil, potting mix substrates, hydro-ponics, pots of different sizes [19–24]. It has been argued that the correlation between capacitance and root mass comes from allometric relationships in hydroponics [25, 26]. However, such electrical measurements were also successfully experimented these last years in the field for root length density estimation [27] and root trait selec-tion in wheat [28]. In addition, 3D capacitance tomog-raphy has been used as a root distribution probe in laboratory [29].
Only few studies [17, 22] were aimed at improving the efficiency, practicability and sensitivity of root biomass estimation with electrical methods. The response of elec-trical methods applied to soil can be affected by environ-mental factors (soil water content, temperature, salinity) [30]. However, for soil–plant applications of electrical methods, the optimal experimental setup of measure-ment remains to be determined: current frequency and voltage, the number of terminals, the electrode type and the electrical variable used as a root mass estimator.
In this study, we propose to (1) evaluate the correlation between root dry mass (RDM, in g) and parallel capaci-tance over a frequency range of 0.5–20,000 Hz, (2) meas-ure the impact of electrode-stem contact on capacitance values, (3) measure the impact of terminal number on the coefficient of determination between root dry mass and capacitance, (4) compare different widely used elec-trical variables and (5) evaluate the accuracy of handheld equivalent LCR meter measurements.
TheoryElectrical parameters and equivalent RC circuitsIn alternating current circuits, electrical impedance is an extension of the concept of resistance in Ohm’s Law. Impedance is defined by two parameters, which are measured with an LCR meter: (1) the magnitude Z (equal to the ratio U/I, where U and I are the sinusoidal volt-age and current amplitudes respectively), and (2) the phase angle θ (which expresses the phase shift between
sinusoidal tension and current or equivalently the time difference between the maxima of sinusoidal current and tension). The variation of these two parameters with respect to frequency is the impedance spectrum. Imped-ance Z∗ is a complex number that describes the effect of the circuit on both the magnitude and phase of the electrical signal. In complex notation, impedance can be decomposed in its real (in phase) and imaginary (out of phase) part as follow:
where j =√−1. However, other electrical descriptions
can also be used, assuming that the equivalent circuit of the investigated system is serial or parallel. In the case of serial circuits, classical simple variables would be either the resistance R (Eqs. 2, 3) and reactance X (Eqs. 2, 4) which are respectively the real and imaginary parts of impedance (both in Ω), or expressed as elements of a serial RC circuit: the serial resistance Rs (in Ω, Eq. 6) and serial capacitance Cs (in farads, Eq. 7) of. All these electri-cal variables can be expressed as functions of Z and θ, as follow:
ω = 2π f is the angular frequency, with f frequency of injected current.
In the case of parallel circuits, classical variables would be the conductance G (Eq. 10) and susceptance B (Eq. 11), both in Siemens, which are the real and imagi-nary part of admittance Y∗ (inverse of impedance, Eq. 8, in Siemens), respectively. The parallel resistance Rp (in Ω) and parallel capacitance Cp (in farads) of the parallel RC equivalent circuit are given by Eqs. 13 and 14.
(1)Z∗ = Z × ejθ = Z × cos(θ)+ j × Z × sin(θ)
(2)Z∗ = R+ j × X
(3)R = Z × cos(θ)
(4)X = Z × sin(θ)
(5)Z = Rs +1
j × ω × Cs
(6)Rs = Z × cos(θ)
(7)Cs =−1
ω × Z × sin(θ)
(8)Y ∗ =1
Z∗ = G + j × B
(9)Y =1
Zejθ
(10)G =cos(θ)
Z
Page 3 of 11Postic and Doussan Plant Methods (2016) 12:33
Each of these interlinked variables could be tested for a link with plant roots. For simplifying the choice and number of electrical variables to be studied in relation with plant roots, we consider only those that are neither equal nor proportional to each other. Thus, we can dis-card R which is equal to Rs, and B which is proportional to Cp.
Effect of injected current frequencyA classic RC parallel circuit (i.e. a circuit with a constant capacitor C and a constant resistor R in parallel) displays a constant value of Cp and Rp over the whole spectrum (i.e. with any test signal frequency). Likewise, a RC serial circuit (i.e. a circuit with a constant capacitor C and a constant resistor R in series) displays a constant value of Cs and Rs over the whole spectrum. These simple circuits can be described by one or two electrical variables that are constant with respect to frequency.
However, in complex systems like biological entities, the electrical variable measured can show frequency dependence (e.g., measured Cp varies with frequency). Such variations point to a more complex equivalent elec-trical circuit than a simple lumped RC circuit.
Furthermore, a non-linear behaviour of an electrical variable with frequency implies that comparison of two investigated systems is also frequency dependant. For example, if one uses an electrical parameter as an explan-atory variable of the mass a plant root system, conclu-sions of comparative studies of two plants will depend on the frequency. A ratio of these two electrical parameters computed at a given frequency will differ from a ratio of these parameters computed at another frequency. As a consequence, measurements performed at different fre-quencies are not equivalent.
Electrode configuration in impedance measurementsImpedance measurements can be done with different electrode configurations, which are more or less sensitive to bias. Four-terminal (4T) sensing is a technique that eliminates the electrodes’ contact impedance from meas-urement. This is achieved by separating pairs of current
(11)B =sin(θ)
Z
(12)1
Z∗ =1
Rp+ j × ω × Cp
(13)Rp =Z
cos(θ)
(14)Cp =− sin(θ)
ω × Z
injection electrodes (C1 and C2) and voltage-measuring electrodes (P1 and P2). However, most measurements on plants are performed in a two-terminal (2T) configura-tion, where current and voltage-measuring electrodes are merged, leading to C1–P1 and C2–P2 electrode patterns. This configuration is sensitive to contact impedance. Finally, an intermediate configuration with three termi-nals (3T) is made possible by merging a current electrode and a voltage-measuring electrode (e.g., merging C1 and P1), analogous to ground resistance measurement.
MethodsSoil and plant materialWe used three soil types of contrasting textures: a silt loam (20.9 % sand, 53.3 % silt and 25.8 % clay), a loam (37.7 % sand, 48.7 % silt and 13.6 % clay) and a sandy loam (60.4 % sand, 26.6 % silt and 12.9 % clay). Plas-tic pots (12.5 cm × 12.5 cm × 22 cm) were filled with 2.5 dm3 of these air-dry soils, over a coarse sand and gravel layer for drainage. The field capacity of pots for the different potting substrates was estimated before sowing. Pots were watered with 500 cm3 of tap water. Three seeds of durum wheat (cv Isildur) were planted in each pot and the pots were transferred into a growth chamber maintained at 25 °C. Twenty-four hours after sowing, 100 cm3 of tap water were added. After emer-gence, plants were brought to a greenhouse. The pots were thinned to one seedling per pot about 1 week after emergence. In the course of plant growth, pots were weighted regularly (each 2–3 days) and water added to reach the estimated field capacity. Electrical measure-ments in pots containing silt loam soil were performed 15, 21, 30, 37, and 45 days after sowing, with 4, 2, 2, 2, 2 and 4 replicates, respectively. Measurements for pots containing loam and sandy loam substrates were performed 15, 30, 38 and 45 days after sowing, with 2 replicates for each sampling date. After electrical meas-urement completion, root systems were collected by carefully washing off the soil and collecting roots on 0.5 mm and 2 mm sieves. The roots were oven-dried at 65 °C for 24 h and their dry masses were precisely recorded on an electronic scale.
Measurement of the electrical impedance spectrumElectrical impedance was measured with a SIP FUCHS III LCR-meter (Radic Research, Germany) at 26 logarith-mically distributed, pre-programmed current frequen-cies, ranging from 0.5 to 20,000 Hz, with 1 V terminal voltage. This device enables measurements with 2 ter-minals (2T), 3 terminals (3T) and 4 terminals (4T) con-figuration. The electrical variables delivered by the SIP FUCHS III are the magnitude of impedance (Z) and the phase angle (θ).
Page 4 of 11Postic and Doussan Plant Methods (2016) 12:33
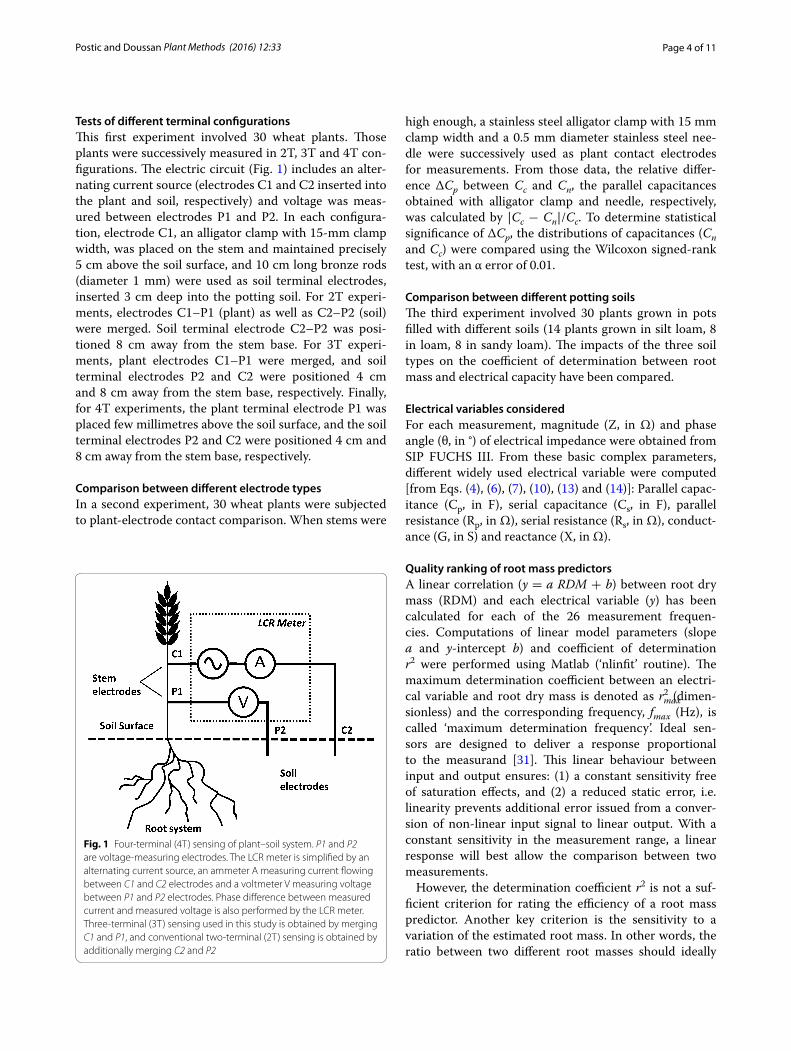
Tests of different terminal configurationsThis first experiment involved 30 wheat plants. Those plants were successively measured in 2T, 3T and 4T con-figurations. The electric circuit (Fig. 1) includes an alter-nating current source (electrodes C1 and C2 inserted into the plant and soil, respectively) and voltage was meas-ured between electrodes P1 and P2. In each configura-tion, electrode C1, an alligator clamp with 15-mm clamp width, was placed on the stem and maintained precisely 5 cm above the soil surface, and 10 cm long bronze rods (diameter 1 mm) were used as soil terminal electrodes, inserted 3 cm deep into the potting soil. For 2T experi-ments, electrodes C1–P1 (plant) as well as C2–P2 (soil) were merged. Soil terminal electrode C2–P2 was posi-tioned 8 cm away from the stem base. For 3T experi-ments, plant electrodes C1–P1 were merged, and soil terminal electrodes P2 and C2 were positioned 4 cm and 8 cm away from the stem base, respectively. Finally, for 4T experiments, the plant terminal electrode P1 was placed few millimetres above the soil surface, and the soil terminal electrodes P2 and C2 were positioned 4 cm and 8 cm away from the stem base, respectively.
Comparison between different electrode typesIn a second experiment, 30 wheat plants were subjected to plant-electrode contact comparison. When stems were
high enough, a stainless steel alligator clamp with 15 mm clamp width and a 0.5 mm diameter stainless steel nee-dle were successively used as plant contact electrodes for measurements. From those data, the relative differ-ence ΔCp between Cc and Cn, the parallel capacitances obtained with alligator clamp and needle, respectively, was calculated by |Cc − Cn|/Cc. To determine statistical significance of ΔCp, the distributions of capacitances (Cn and Cc) were compared using the Wilcoxon signed-rank test, with an α error of 0.01.
Comparison between different potting soilsThe third experiment involved 30 plants grown in pots filled with different soils (14 plants grown in silt loam, 8 in loam, 8 in sandy loam). The impacts of the three soil types on the coefficient of determination between root mass and electrical capacity have been compared.
Electrical variables consideredFor each measurement, magnitude (Z, in Ω) and phase angle (θ, in °) of electrical impedance were obtained from SIP FUCHS III. From these basic complex parameters, different widely used electrical variable were computed [from Eqs. (4), (6), (7), (10), (13) and (14)]: Parallel capac-itance (Cp, in F), serial capacitance (Cs, in F), parallel resistance (Rp, in Ω), serial resistance (Rs, in Ω), conduct-ance (G, in S) and reactance (X, in Ω).
Quality ranking of root mass predictorsA linear correlation (y = a RDM + b) between root dry mass (RDM) and each electrical variable (y) has been calculated for each of the 26 measurement frequen-cies. Computations of linear model parameters (slope a and y-intercept b) and coefficient of determination r2 were performed using Matlab (‘nlinfit’ routine). The maximum determination coefficient between an electri-cal variable and root dry mass is denoted as rmax
2 (dimen-sionless) and the corresponding frequency, fmax (Hz), is called ‘maximum determination frequency’. Ideal sen-sors are designed to deliver a response proportional to the measurand [31]. This linear behaviour between input and output ensures: (1) a constant sensitivity free of saturation effects, and (2) a reduced static error, i.e. linearity prevents additional error issued from a conver-sion of non-linear input signal to linear output. With a constant sensitivity in the measurement range, a linear response will best allow the comparison between two measurements.
However, the determination coefficient r2 is not a suf-ficient criterion for rating the efficiency of a root mass predictor. Another key criterion is the sensitivity to a variation of the estimated root mass. In other words, the ratio between two different root masses should ideally
Fig. 1 Four-terminal (4T) sensing of plant–soil system. P1 and P2 are voltage-measuring electrodes. The LCR meter is simplified by an alternating current source, an ammeter A measuring current flowing between C1 and C2 electrodes and a voltmeter V measuring voltage between P1 and P2 electrodes. Phase difference between measured current and measured voltage is also performed by the LCR meter. Three-terminal (3T) sensing used in this study is obtained by merging C1 and P1, and conventional two-terminal (2T) sensing is obtained by additionally merging C2 and P2
Page 5 of 11Postic and Doussan Plant Methods (2016) 12:33
equal the ratio of two measurements of an electrical vari-able. For linear correlation, it is equivalent to a negligible value of the ratio between interception and slope for a characteristic mass of root.
For two given root masses m1 and m2, two measure-ments of an electrical variable are obtained (y1 and y2), thus:
For a given characteristic root mass, i.e. the order of magnitude of the average root mass measured, we can state:
Thus Eq. (15) becomes:
Equation (16) becomes: y1y2 = αβ= m1
m2, which is the true
ratio between the root masses. Thus, as shown in Eq. (17) when this ratio become close to 1 or is higher, the sensi-tivity of electrical variable is poor, and it makes the elec-trical variable unreliable for comparison of root masses.
In order to rank the electrical variables tested as pre-dictors of root dry mass, we introduced a ‘sensitivity score’ s, calculated as follows:
where m0 (in g) is a characteristic mass of dry roots, in our case m0 = 1 g. The sensitivity score represents the accuracy of the comparison between measurements obtained from 2 plants, with the same order of magni-tude of root dry mass (m0). A maximum score (s = 1) means that the ratio between two measurements is equal to the ratio between two plants root mass. A minimum score (s = 0) means that only very large variations of root mass would be reliably estimated.
Literature dataData that we could retrieve from prior experiments on the quantification of plant root biomass using electrical capac-itance were compiled [18, 19, 22–25, 32]. Most of these experiments used Cp measured in a 2T configuration at 1 kHz for root biomass estimation. The growth media, the measured characteristic biomass of wet or dry roots, the parameters linear regression found between root biomass and Cp and the coefficient of determination were extracted
(15)y1
y2=
a×m1 + b
a×m2 + b
m1 = α ×m0 and m2 = β ×m0 with α ≈ 1 and β ≈ 1.
(16)y1
y2=
α + ba×m0
β + ba×m0
(17)If
∣
∣
∣
∣
b
a×m0
∣
∣
∣
∣
<< 1
(18)s = max
(
r2max ×(
1−∣
∣
∣
∣
b
a×m0
∣
∣
∣
∣
)
; 0)
in order to computed their respective y-intercept:slope ratio (Eq. 17) and their ‘sensitivity score’ s (Eq. 18). The measured characteristic biomass of roots was roughly the median of root biomass measured in each experiment.
ResultsRoot massThe harvested plants presented a root mass ranging from 0.02 to 0.72 g, with a mean value of 0.2 g and a standard deviation of 0.19 g. This reflects the fact that plants were harvested at different times and that they were relatively young (Additional file 1).
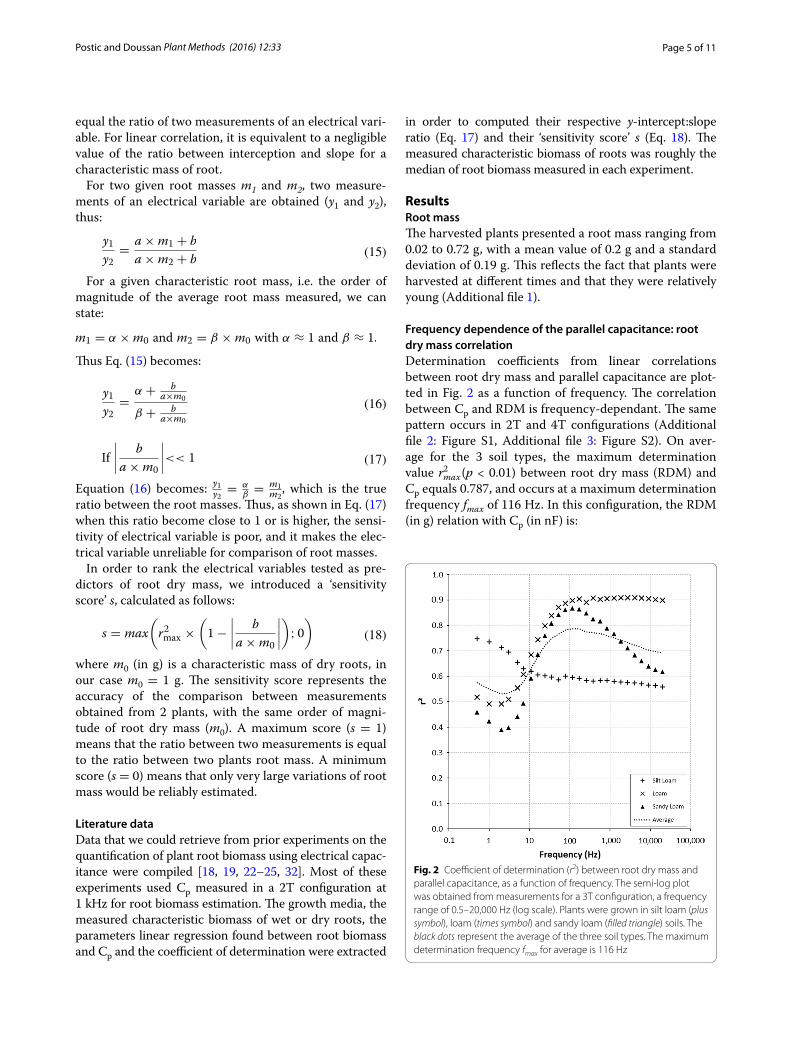
Frequency dependence of the parallel capacitance: root dry mass correlationDetermination coefficients from linear correlations between root dry mass and parallel capacitance are plot-ted in Fig. 2 as a function of frequency. The correlation between Cp and RDM is frequency-dependant. The same pattern occurs in 2T and 4T configurations (Additional file 2: Figure S1, Additional file 3: Figure S2). On aver-age for the 3 soil types, the maximum determination value rmax
2 (p < 0.01) between root dry mass (RDM) and Cp equals 0.787, and occurs at a maximum determination frequency fmax of 116 Hz. In this configuration, the RDM (in g) relation with Cp (in nF) is:
Fig. 2 Coefficient of determination (r2) between root dry mass and parallel capacitance, as a function of frequency. The semi-log plot was obtained from measurements for a 3T configuration, a frequency range of 0.5–20,000 Hz (log scale). Plants were grown in silt loam (plus symbol), loam (times symbol) and sandy loam (filled triangle) soils. The black dots represent the average of the three soil types. The maximum determination frequency fmax for average is 116 Hz
Page 6 of 11Postic and Doussan Plant Methods (2016) 12:33
The magnitude of r2 at fmax depends on the soil. Thus, at fmax = 116 Hz, the determination coefficient from the linear correlation between biomass and Cp in a loam soil reaches high value (r2 = 0.898), while a silty loam soil has a lower maximum r2 value of 0.595. In addition, each soil type displays different fmax value, in all terminal configurations.
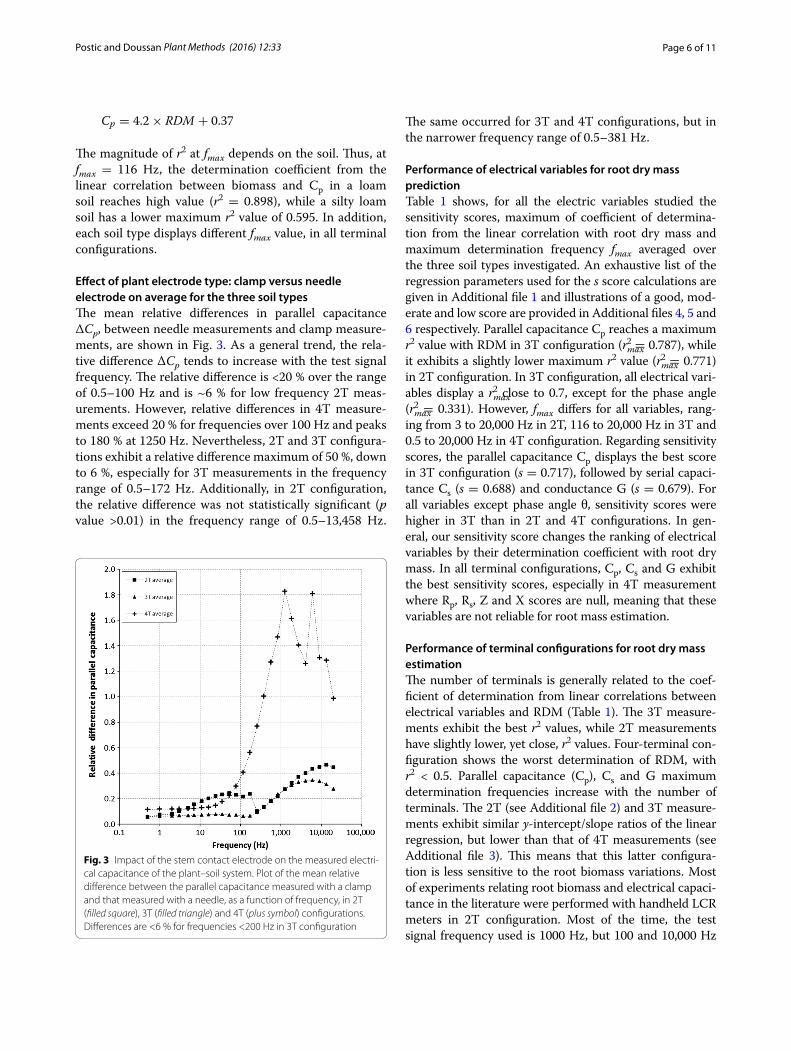
Effect of plant electrode type: clamp versus needle electrode on average for the three soil typesThe mean relative differences in parallel capacitance ΔCp, between needle measurements and clamp measure-ments, are shown in Fig. 3. As a general trend, the rela-tive difference ΔCp tends to increase with the test signal frequency. The relative difference is <20 % over the range of 0.5–100 Hz and is ~6 % for low frequency 2T meas-urements. However, relative differences in 4T measure-ments exceed 20 % for frequencies over 100 Hz and peaks to 180 % at 1250 Hz. Nevertheless, 2T and 3T configura-tions exhibit a relative difference maximum of 50 %, down to 6 %, especially for 3T measurements in the frequency range of 0.5–172 Hz. Additionally, in 2T configuration, the relative difference was not statistically significant (p value >0.01) in the frequency range of 0.5–13,458 Hz.
Cp = 4.2× RDM + 0.37 The same occurred for 3T and 4T configurations, but in the narrower frequency range of 0.5–381 Hz.
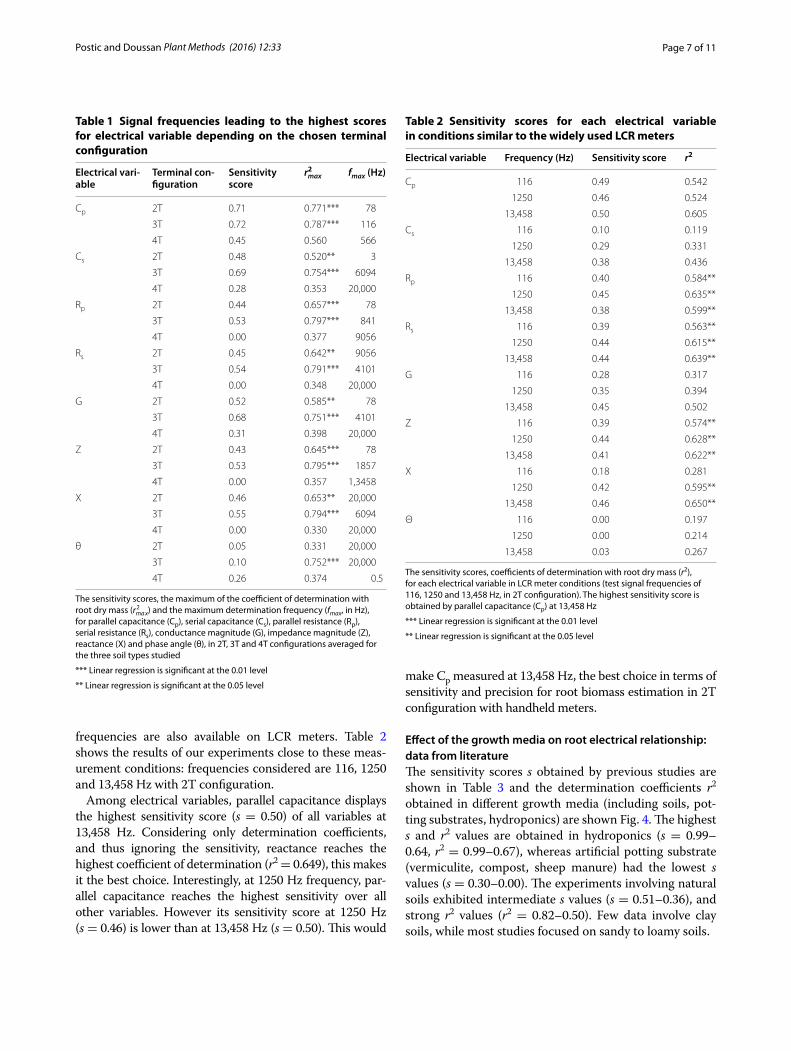
Performance of electrical variables for root dry mass predictionTable 1 shows, for all the electric variables studied the sensitivity scores, maximum of coefficient of determina-tion from the linear correlation with root dry mass and maximum determination frequency fmax averaged over the three soil types investigated. An exhaustive list of the regression parameters used for the s score calculations are given in Additional file 1 and illustrations of a good, mod-erate and low score are provided in Additional files 4, 5 and 6 respectively. Parallel capacitance Cp reaches a maximum r2 value with RDM in 3T configuration (rmax
2 = 0.787), while it exhibits a slightly lower maximum r2 value (rmax
2 = 0.771) in 2T configuration. In 3T configuration, all electrical vari-ables display a rmax
2 close to 0.7, except for the phase angle (rmax
2 = 0.331). However, fmax differs for all variables, rang-ing from 3 to 20,000 Hz in 2T, 116 to 20,000 Hz in 3T and 0.5 to 20,000 Hz in 4T configuration. Regarding sensitivity scores, the parallel capacitance Cp displays the best score in 3T configuration (s = 0.717), followed by serial capaci-tance Cs (s = 0.688) and conductance G (s = 0.679). For all variables except phase angle θ, sensitivity scores were higher in 3T than in 2T and 4T configurations. In gen-eral, our sensitivity score changes the ranking of electrical variables by their determination coefficient with root dry mass. In all terminal configurations, Cp, Cs and G exhibit the best sensitivity scores, especially in 4T measurement where Rp, Rs, Z and X scores are null, meaning that these variables are not reliable for root mass estimation.
Performance of terminal configurations for root dry mass estimationThe number of terminals is generally related to the coef-ficient of determination from linear correlations between electrical variables and RDM (Table 1). The 3T measure-ments exhibit the best r2 values, while 2T measurements have slightly lower, yet close, r2 values. Four-terminal con-figuration shows the worst determination of RDM, with r2 < 0.5. Parallel capacitance (Cp), Cs and G maximum determination frequencies increase with the number of terminals. The 2T (see Additional file 2) and 3T measure-ments exhibit similar y-intercept/slope ratios of the linear regression, but lower than that of 4T measurements (see Additional file 3). This means that this latter configura-tion is less sensitive to the root biomass variations. Most of experiments relating root biomass and electrical capaci-tance in the literature were performed with handheld LCR meters in 2T configuration. Most of the time, the test signal frequency used is 1000 Hz, but 100 and 10,000 Hz
Fig. 3 Impact of the stem contact electrode on the measured electri-cal capacitance of the plant–soil system. Plot of the mean relative difference between the parallel capacitance measured with a clamp and that measured with a needle, as a function of frequency, in 2T (filled square), 3T (filled triangle) and 4T (plus symbol) configurations. Differences are <6 % for frequencies <200 Hz in 3T configuration
Page 7 of 11Postic and Doussan Plant Methods (2016) 12:33
frequencies are also available on LCR meters. Table 2 shows the results of our experiments close to these meas-urement conditions: frequencies considered are 116, 1250 and 13,458 Hz with 2T configuration.
Among electrical variables, parallel capacitance displays the highest sensitivity score (s = 0.50) of all variables at 13,458 Hz. Considering only determination coefficients, and thus ignoring the sensitivity, reactance reaches the highest coefficient of determination (r2 = 0.649), this makes it the best choice. Interestingly, at 1250 Hz frequency, par-allel capacitance reaches the highest sensitivity over all other variables. However its sensitivity score at 1250 Hz (s = 0.46) is lower than at 13,458 Hz (s = 0.50). This would
make Cp measured at 13,458 Hz, the best choice in terms of sensitivity and precision for root biomass estimation in 2T configuration with handheld meters.
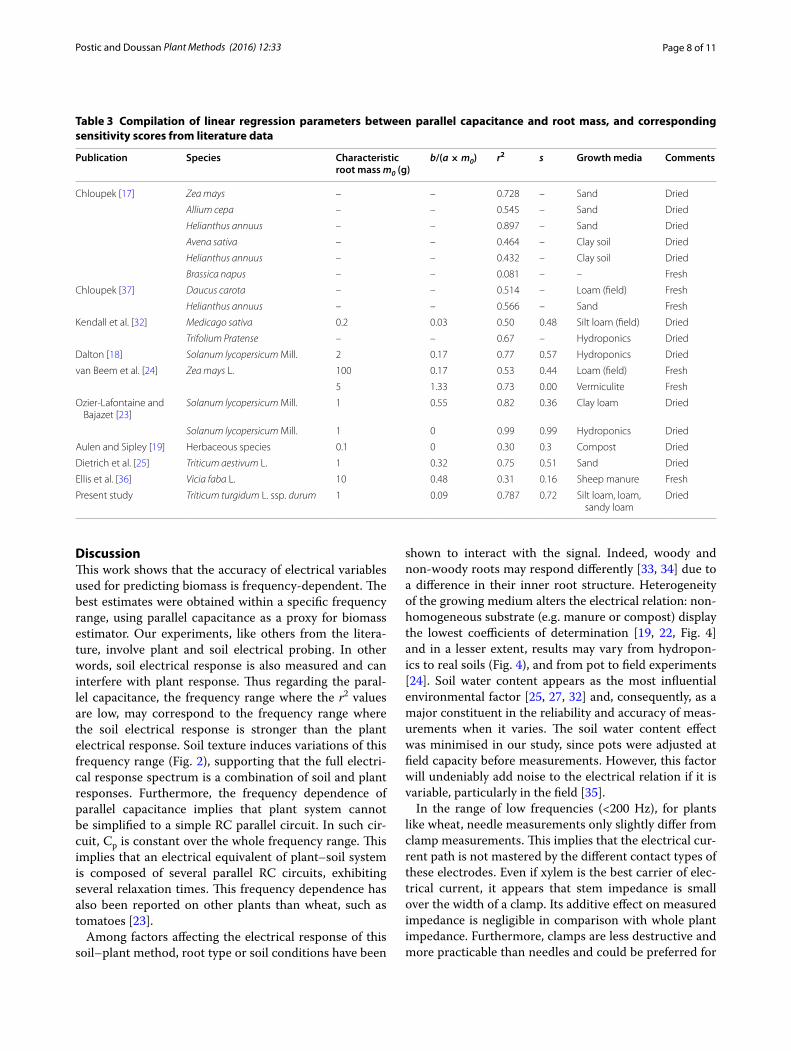
Effect of the growth media on root electrical relationship: data from literatureThe sensitivity scores s obtained by previous studies are shown in Table 3 and the determination coefficients r2 obtained in different growth media (including soils, pot-ting substrates, hydroponics) are shown Fig. 4. The highest s and r2 values are obtained in hydroponics (s = 0.99–0.64, r2 = 0.99–0.67), whereas artificial potting substrate (vermiculite, compost, sheep manure) had the lowest s values (s = 0.30–0.00). The experiments involving natural soils exhibited intermediate s values (s = 0.51–0.36), and strong r2 values (r2 = 0.82–0.50). Few data involve clay soils, while most studies focused on sandy to loamy soils.
Table 1 Signal frequencies leading to the highest scores for electrical variable depending on the chosen terminal configuration
The sensitivity scores, the maximum of the coefficient of determination with root dry mass (rma x
2 ) and the maximum determination frequency (fmax, in Hz), for parallel capacitance (Cp), serial capacitance (Cs), parallel resistance (Rp), serial resistance (Rs), conductance magnitude (G), impedance magnitude (Z), reactance (X) and phase angle (θ), in 2T, 3T and 4T configurations averaged for the three soil types studied
*** Linear regression is significant at the 0.01 level
** Linear regression is significant at the 0.05 level
Electrical vari-able
Terminal con-figuration
Sensitivity score
rmax2 fmax (Hz)
Cp 2T 0.71 0.771*** 78
3T 0.72 0.787*** 116
4T 0.45 0.560 566
Cs 2T 0.48 0.520** 3
3T 0.69 0.754*** 6094
4T 0.28 0.353 20,000
Rp 2T 0.44 0.657*** 78
3T 0.53 0.797*** 841
4T 0.00 0.377 9056
Rs 2T 0.45 0.642** 9056
3T 0.54 0.791*** 4101
4T 0.00 0.348 20,000
G 2T 0.52 0.585** 78
3T 0.68 0.751*** 4101
4T 0.31 0.398 20,000
Z 2T 0.43 0.645*** 78
3T 0.53 0.795*** 1857
4T 0.00 0.357 1,3458
X 2T 0.46 0.653** 20,000
3T 0.55 0.794*** 6094
4T 0.00 0.330 20,000
θ 2T 0.05 0.331 20,000
3T 0.10 0.752*** 20,000
4T 0.26 0.374 0.5
Table 2 Sensitivity scores for each electrical variable in conditions similar to the widely used LCR meters
The sensitivity scores, coefficients of determination with root dry mass (r2), for each electrical variable in LCR meter conditions (test signal frequencies of 116, 1250 and 13,458 Hz, in 2T configuration). The highest sensitivity score is obtained by parallel capacitance (Cp) at 13,458 Hz
*** Linear regression is significant at the 0.01 level
** Linear regression is significant at the 0.05 level
Electrical variable Frequency (Hz) Sensitivity score r2
Cp 116 0.49 0.542
1250 0.46 0.524
13,458 0.50 0.605
Cs 116 0.10 0.119
1250 0.29 0.331
13,458 0.38 0.436
Rp 116 0.40 0.584**
1250 0.45 0.635**
13,458 0.38 0.599**
Rs 116 0.39 0.563**
1250 0.44 0.615**
13,458 0.44 0.639**
G 116 0.28 0.317
1250 0.35 0.394
13,458 0.45 0.502
Z 116 0.39 0.574**
1250 0.44 0.628**
13,458 0.41 0.622**
X 116 0.18 0.281
1250 0.42 0.595**
13,458 0.46 0.650**
Θ 116 0.00 0.197
1250 0.00 0.214
13,458 0.03 0.267
Page 8 of 11Postic and Doussan Plant Methods (2016) 12:33
DiscussionThis work shows that the accuracy of electrical variables used for predicting biomass is frequency-dependent. The best estimates were obtained within a specific frequency range, using parallel capacitance as a proxy for biomass estimator. Our experiments, like others from the litera-ture, involve plant and soil electrical probing. In other words, soil electrical response is also measured and can interfere with plant response. Thus regarding the paral-lel capacitance, the frequency range where the r2 values are low, may correspond to the frequency range where the soil electrical response is stronger than the plant electrical response. Soil texture induces variations of this frequency range (Fig. 2), supporting that the full electri-cal response spectrum is a combination of soil and plant responses. Furthermore, the frequency dependence of parallel capacitance implies that plant system cannot be simplified to a simple RC parallel circuit. In such cir-cuit, Cp is constant over the whole frequency range. This implies that an electrical equivalent of plant–soil system is composed of several parallel RC circuits, exhibiting several relaxation times. This frequency dependence has also been reported on other plants than wheat, such as tomatoes [23].
Among factors affecting the electrical response of this soil–plant method, root type or soil conditions have been
shown to interact with the signal. Indeed, woody and non-woody roots may respond differently [33, 34] due to a difference in their inner root structure. Heterogeneity of the growing medium alters the electrical relation: non-homogeneous substrate (e.g. manure or compost) display the lowest coefficients of determination [19, 22, Fig. 4] and in a lesser extent, results may vary from hydropon-ics to real soils (Fig. 4), and from pot to field experiments [24]. Soil water content appears as the most influential environmental factor [25, 27, 32] and, consequently, as a major constituent in the reliability and accuracy of meas-urements when it varies. The soil water content effect was minimised in our study, since pots were adjusted at field capacity before measurements. However, this factor will undeniably add noise to the electrical relation if it is variable, particularly in the field [35].
In the range of low frequencies (<200 Hz), for plants like wheat, needle measurements only slightly differ from clamp measurements. This implies that the electrical cur-rent path is not mastered by the different contact types of these electrodes. Even if xylem is the best carrier of elec-trical current, it appears that stem impedance is small over the width of a clamp. Its additive effect on measured impedance is negligible in comparison with whole plant impedance. Furthermore, clamps are less destructive and more practicable than needles and could be preferred for
Table 3 Compilation of linear regression parameters between parallel capacitance and root mass, and corresponding sensitivity scores from literature data
Publication Species Characteristic root mass m0 (g)
Aulen and Sipley [19] Herbaceous species 0.1 0 0.30 0.3 Compost Dried
Dietrich et al. [25] Triticum aestivum L. 1 0.32 0.75 0.51 Sand Dried
Ellis et al. [36] Vicia faba L. 10 0.48 0.31 0.16 Sheep manure Fresh
Present study Triticum turgidum L. ssp. durum 1 0.09 0.787 0.72 Silt loam, loam, sandy loam
Dried
Page 9 of 11Postic and Doussan Plant Methods (2016) 12:33
root capacitance measurements. At higher frequencies, needle and clamp measurements can exhibit discrepan-cies. This is particularly true for the 4T configuration, for which the relative difference between electrode types peaks at 180 %. 4T configuration is generally known for being more reliable. It eliminates contact impedance and enables precise measurements of impedance. Thus, the higher differences between needle and clamp measure-ments found with 4T, compared with 2T and 3T configu-rations in our experiment, could seem counter-intuitive. These larger differences found in 4T may have various causes.
Firstly, needle electrodes, implanted trough the stem, are more invasive than clamp electrodes. Perturbation of the flow in the xylem can occur and modify the displace-ment of the electric charges between electrodes, creating a parasitic effect in the measured medium. This parasitic effect on the charge carrying medium is supported by the lower coefficients of determination with root dry mass found in 4T configuration.
Secondly, it has been shown that measured capaci-tance is very sensitive to electrode position on the stem [18, 36], in particular for electrode located close to the base of the stem. Our 4T configuration measurements involved electrode contact very close to the base of the stem (few mm). Thus a small deviation on the position of the electrode located at the base of the stem could imply a large difference in the measured capacitance.
In our experiments, 2T and 3T configurations are less sensitive to the stem electrode position. This electrode was located much higher (5 cm), and thus less sensible to a deviation on its position. In consequence, differences found between needle and clamp measurements in 2T and 3T configurations are much lower.
Depending on the type of terminal configuration, the measurements may be biased in different ways. For exam-ple, in 2T configuration, measurements could biased by wire and contact impedance, while in 4T configuration, a more representative impedance, eliminating contacts and wire effects, of the device under test would be measured. The 3T configuration is an intermediate configuration, where only contact impedance of the plant electrode is involved. The lower correlations with root dry mass in 4T configuration than in 2T and 3T are probably due to plant electrode issues.
Finally, it appears that classical handheld LCR meter measurements could be revised in terms of frequency and electrical variable used. In the terminal configura-tion used by this kind of device, i.e. 2T configuration, Cp obtained the best sensitivity score at around 10 kHz. However, in these handheld LCR equivalent configura-tions, sensitivity scores obtained were significantly lower than sensitivity scores obtained with the optimal configu-ration, i.e. using a 3T configuration at 116 Hz.
As shown Table 3, hydroponics shows the best condi-tions for root biomass estimation using electrical Cp. This growth media exhibits an optimal contact with roots as well as homogeneity. In real soils, the root-medium contact is not controlled, the heterogeneity is greatly increased. This results in less precise root biomass esti-mations, but the electrical-root biomass relationship is still effective. This work enhances root biomass estima-tions under more representative conditions, by using various real soils instead of hydroponics, providing framework for agronomical relevant root studies.
ConclusionsIn this study, we found that the estimation of wheat root biomass through electrical measurements would be more accurate when performed in 3T configuration with a 116 Hz frequency and using parallel capacitance as the electrical variable. With this measurement setting, low differences (6.7 %) were found when using clamp or needle as plant contact electrode. This result means that reliable measurements can be achieved by using clamps, which are more practicable and less destructive than nee-dles trough stem. We also found that a handheld LCR meter could result in better measurements when used at 10,000 Hz and measuring parallel capacitance, even though reactance obtained better determination coeffi-cients from linear correlation with root dry mass. These
Fig. 4 Growth media used in root biomass estimation found in related literature and in our study. The size of the circles is propor-tional to the coefficient of determination r2 found in each study. When more than two studies involved the same growth media, the mean (in black ring), the minimum (in grey circle) and the maximum (dashed circle) of coefficient of determination r2 were plotted
Page 10 of 11Postic and Doussan Plant Methods (2016) 12:33
methodological optimizations strengthen the robust-ness of the electrical methodology to assess wheat root biomass and would be useful in pot studies and green-house/controlled conditions used in phenotyping. How-ever, application to field trials requires the quantification of the impact of possible interfering factors. Our study was focused on a monocot crop grown in medium sized pots, measured during early growth stages with limited tillering and a moist soil. The electrical relations with root mass and our derived sensitivity score shall be tested with different species (particularly woody or non-woody species) and, more importantly, with contrasted soil water contents.
Authors’ contributionsFP preformed the experiments. FP and CD jointly conceptualized the study, analysed the data, and wrote the manuscript. Both authors read and approved the final manuscript.
Author details1 ARVALIS Institut du végétal, 75116 Paris, France. 2 UMR EMMAH, INRA, UAPV, Domaine Saint-Paul, Site Agroparc, 84914 Avignon, France.
Additional files
Additional file 1: Table S1. Sensitivity score details and linear regres-sion parameters between root dry mass and each electrical variable. The table lists the maximum determination frequency (fmax, Hz), sensitivity scores, maximum of coefficient of determination with root dry mass (rmax
2), y-intercept of the linear regression (in standard unit of the related electri-cal variable) and slope (in standard unit of the related electrical variable per g) for parallel capacitance (Cp), serial capacitance (Cs), parallel resist-ance (Rp), serial resistance (Rs), conductance magnitude (G), impedance magnitude (Z), reactance (X) and impedance phase angle (θ) in 2T, 3T and 4T configurations, on average for 3 soil types.
Additional file 2: Figure S1. Coefficient of determination (r2) between root dry mass and parallel capacitance, in 2T configuration. The semi-log plot of the determination coefficients (r2) was obtained over a frequency range of 0.5 to 20,000 Hz (log scale), for plants grown in silt loam (+), loam (×), sandy loam (▲), averaged for the three soil types (black dots).
Additional file 3: Figure S2. Coefficient of determination (r2) between root dry mass and parallel capacitance, in 4T configuration. The semi-log plot of the determination coefficients (r2) was obtained over a frequency range of 0.5 to 20,000 Hz (log scale), for plants grown in silt loam (+), loam (×), sandy loam (▲), averaged for the three soil types (black dots).
Additional file 4: Figure S3. Illustration of a linear regression with high coefficient of determination and high sensitivity score s. Parallel capaci-tance measured at 116 Hz, rated as the best configuration obtained in this study. Data from plants grown in pots containing loam, measured in 3T configuration.
Additional file 5: Figure S4. Illustration of a linear regression with high coefficient of determination but low sensitivity score s. Due to its high r2, reactance measured at 20 kHz may turn out to be a good candidate, however its interception is largely greater than zero implying a lowered score. Data from plants grown in pots containing loam, measured in 3T configuration.
Additional file 6: Figure S5. Illustration of a linear regression with low coefficient of determination and low sensitivity score s. Low r2 coupled with non-negligible intercept. Data from plants grown in pots containing sandy loam, measured in 3T configuration.
AcknowledgementsThis work was supported by Grants from the FSOV (French fund for plant breeding number FSOV 2012) involving INRA and ARVALIS Institut du végétal.
Competing interestsThe authors declare that they have no competing interests.
Received: 2 March 2016 Accepted: 8 June 2016
References 1. FAO of the United Nations. Crop prospects and food situation. October
(No. 3). Rome: FAO; 2014. 2. Brisson N, Gate P, Gouache D, Charmet G, Oury F-X, Huard F. Why are
wheat yields stagnating in Europe? A comprehensive data analysis for France. Field Crops Res. 2010;119:201–12.
3. Waines JG, Ehdaie B. Domestication and crop physiology: roots of green-revolution wheat. Ann Bot. 2007;100:991–8.
4. Zhan A, Schneider H, Lynch JP. Reduced lateral root branching density improves drought tolerance in maize. Plant Physiol. 2015;168:1603–15.
5. Passioura JB. Grain yield, harvest index, and water use of wheat. J Aust Inst Agric Sci. 1977;43:117–20.
6. Manschadi AM, Christopher J, deVoil P, Hammer GL. The role of root architectural traits in adaptation of wheat to water-limited environments. Funct Plant Biol. 2006;33:823.
7. Manschadi AM, Hammer GL, Christopher JT, deVoil P. Genotypic variation in seedling root architectural traits and implications for drought adapta-tion in wheat (Triticum aestivum L.). Plant Soil. 2008;303:115–29.
8. Lilley JM, Kirkegaard JA. Benefits of increased soil exploration by wheat roots. Field Crops Res. 2011;122:118–30.
9. Ober ES, Werner P, Flatman E, Angus WJ, Jack P, Smith-Reeve L, et al. Genotypic differences in deep water extraction associated with drought tolerance in wheat. Funct Plant Biol. 2014;41:1078.
10. Bertholdsson N-O, Brantestam AK. A century of Nordic barley breed-ing—effects on early vigour root and shoot growth, straw length, harvest index and grain weight. Eur J Agron. 2009;30:266–74.
11. Araus JL, Cairns JE. Field high-throughput phenotyping: the new crop breeding frontier. Trends Plant Sci. 2014;19:52–61.
12. Comar A, Burger P, de Solan B, Baret F, Daumard F, Hanocq J-F. A semi-automatic system for high throughput phenotyping wheat cultivars in-field conditions: description and first results. Funct Plant Biol. 2012;39:914–24.
13. Trachsel S, Kaeppler SM, Brown KM, Lynch JP. Shovelomics: high through-put phenotyping of maize (Zea mays L.) root architecture in the field. Plant Soil. 2011;341:75–87.
14. Wasson AP, Richards RA, Chatrath R, Misra SC, Prasad SS, Rebetzke GJ, et al. Traits and selection strategies to improve root systems and water uptake in water-limited wheat crops. J Exp Bot. 2012;63:3485–98.
15. Polomski J, Kuhn N. Root research methods. In: Waisel Y, Eshel A, Kafkafi U, editors. Plant Roots Hidden Half. 3rd ed. Marcel Dekker NY Pub; 2002. pp 447–88
16. Metzner R, Eggert A, van Dusschoten D, Pflugfelder D, Gerth S, Schurr U, et al. Direct comparison of MRI and X-ray CT technologies for 3D imaging of root systems in soil: potential and challenges for root trait quantifica-tion. Plant Methods. 2015;11:17.
17. Chloupek O. The relationship between electric capacitance and some other parameters of plant roots. Biol Plant. 1972;14:227–30.
19. Aulen M, Shipley B. Non-destructive estimation of root mass using electrical capacitance on ten herbaceous species. Plant Soil. 2012;355:41–9.
20. Cermak J, Radek U, Stranek Z, Koller J, Aubrecht L. Electrical measurement of tree root absorbing surfaces by the earth impedance method: 2. Veri-fication based on allometric relationships and root severing experiments. Tree Physiol. 2006;26:1113–21.
21. Cseresnyes I, Rajkai K, Vozary E. Role of phase angle measurement in electrical impedance spectroscopy. Int Agrophys. 2013;27:377–83.
Page 11 of 11Postic and Doussan Plant Methods (2016) 12:33
• We accept pre-submission inquiries
• Our selector tool helps you to find the most relevant journal
• We provide round the clock customer support
• Convenient online submission
• Thorough peer review
• Inclusion in PubMed and all major indexing services
• Maximum visibility for your research
Submit your manuscript atwww.biomedcentral.com/submit
Submit your next manuscript to BioMed Central and we will help you at every step:
22. Ellis T, Murray W, Kavalieris L. Electrical capacitance of bean (Vicia faba) root systems was related to tissue density—a test for the Dalton Model. Plant Soil. 2013;366:575–84.
23. Ozier-Lafontaine H, Bajazet T. Analysis of root growth by impedance spectroscopy (EIS). Plant Soil. 2005;277:299–313.
24. van Beem J, Smith ME, Zobel RW. Estimating root mass in maize using a portable capacitance meter. Agron J. 1998;90:566–70.
25. Dietrich RC, Bengough AG, Jones HG, White PJ. Can root electrical capaci-tance be used to predict root mass in soil? Ann Bot. 2013;112:457–64.
26. Dietrich RC, Bengough AG, Jones HG, White PJ. A new physical interpreta-tion of plant root capacitance. J Exp Bot. 2012;63:6149–59.
27. Nakhforoosh A, Grausgruber H, Kaul H-P, Bodner G. Wheat root diversity and root functional characterization. Plant Soil. 2014;380:211–29.
28. Heřmanská A, Středa T, Chloupek O. Improved wheat grain yield by a new method of root selection. Agron Sustain Dev. 2015;35:195–202.
29. Liao A, Zhou Q, Zhang Y. Application of 3D electrical capacitance tomography in probing anomalous blocks in water. J Appl Geophys. 2015;117:91–103.
30. Samouëlian A, Cousin I, Tabbagh A, Bruand A, Richard G. Electrical resistiv-ity survey in soil science: a review. Soil Tillage Res. 2005;83:173–93.
31. Nyce DS. Linear position sensors: theory and application. Hoboken: Wiley-Interscience; 2004.
32. Kendall WA, Pederson GA, Hill RR. Root size estimates of red clover and alfalfa based on electrical capacitance and root diameter measurements. Grass Forage Sci. 1982;37:253–6.
33. Zanetti C, Weller A, Vennetier M, Meriaux P. Detection of buried tree root samples by using geoelectrical measurements: a laboratory experiment. Plant Soil. 2011;339:273–83.
34. Cao Y, Repo T, Silvennoinen R, Lehto T, Pelkonen P. Analysis of the willow root system by electrical impedance spectroscopy. J Exp Bot. 2011;62:351–8.
35. Chloupek O, Dostál V, Středa T, Psota V, Dvořáčková O. Drought toler-ance of barley varieties in relation to their root system size. Plant Breed. 2010;129:630–6.
36. Ellis TW, Murray W, Paul K, Kavalieris L, Brophy J, Williams C, et al. Electrical capacitance as a rapid and non-invasive indicator of root length. Tree Physiol. 2013;33:3–17.
37. Chloupek O. Evaluation of the size of a plant’s root system using its elec-trical capacitance. Plant Soil. 1977;48:525–32