Benchmarking Energy and Sustainability: How do your corporate programs stack up? Danny Macri, U.S. Environmental Protection Agency ENERGY STAR Program ABSTRACT A critical responsibility of an energy manager is to identify opportunities for continuous improvement. While many companies have programs that revolve around energy, the approaches and practices they apply to energy can be used for the management of other resources, including water, waste and other materials. In the summer of 2020, ENERGY STAR designed a benchmarking activity to help its industrial partners assess their corporate energy management practices across a series of key metrics aligning with the ENERGY STAR Guidelines for Energy Management (the Guidelines). Over 40 companies participated reflecting a broad spectrum of the manufacturing sector. The insights from this activity offer a snapshot of common trends among companies committed to continuous improvement of their energy performance and provide a roadmap for other manufacturers on how parts of the Guidelines can be implemented. This paper will discuss the importance of benchmarking management practices and will help manufacturers understand how they stack up against their peers around energy program influence, goals, staffing, metering, program and project funding, and best practice sharing. They’ll see the range of practices used in these topical areas and learn new approaches that can be applied to energy, water, waste, and other resource management. Introduction A critical responsibility of an energy manager is to identify opportunities for continuous improvement. While many companies have programs that revolve around energy, the approaches and practices they apply to energy can also be applied to managing other resources, such as water and waste. Two key resources that have helped companies in the manufacturing sector establish management practices that support continuous improvement of energy performance have been the ENERGY STAR Guidelines for Energy Management (the Guidelines) and the Energy Program Assessment Matrix (the Matrix). The Guidelines provide organizations a roadmap for developing an energy program. The Matrix is a benchmarking tool that helps organizations see how their energy management program stacks up to an established set of industry best practices. Both resources were developed by the U.S. Environmental Protection Agency based on best practices from leading ENERGY STAR partners, the nation's leaders in energy management. The common denominator of success among these companies was that energy was managed continuously. Energy was not addressed intermittently or with quick fixes; energy was engrained in companies’ cultures and management systems, similar to how safety and quality assurance are typically approached throughout an organization. In other words, these organizations all had a programmatic versus a project based approach to energy related activities.
Transcript
Benchmarking Energy and Sustainability: How do your corporate programs stack up?
Danny Macri, U.S. Environmental Protection Agency ENERGY STAR Program
ABSTRACT
A critical responsibility of an energy manager is to identify opportunities for continuous improvement. While many companies have programs that revolve around energy, the approaches and practices they apply to energy can be used for the management of other resources, including water, waste and other materials.
In the summer of 2020, ENERGY STAR designed a benchmarking activity to help its industrial partners assess their corporate energy management practices across a series of key metrics aligning with the ENERGY STAR Guidelines for Energy Management (the Guidelines). Over 40 companies participated reflecting a broad spectrum of the manufacturing sector. The insights from this activity offer a snapshot of common trends among companies committed to continuous improvement of their energy performance and provide a roadmap for other manufacturers on how parts of the Guidelines can be implemented.
This paper will discuss the importance of benchmarking management practices and will help manufacturers understand how they stack up against their peers around energy program influence, goals, staffing, metering, program and project funding, and best practice sharing. They’ll see the range of practices used in these topical areas and learn new approaches that can be applied to energy, water, waste, and other resource management.
Introduction
A critical responsibility of an energy manager is to identify opportunities for continuous improvement. While many companies have programs that revolve around energy, the approaches and practices they apply to energy can also be applied to managing other resources, such as water and waste.
Two key resources that have helped companies in the manufacturing sector establish management practices that support continuous improvement of energy performance have been the ENERGY STAR Guidelines for Energy Management (the Guidelines) and the Energy Program Assessment Matrix (the Matrix). The Guidelines provide organizations a roadmap for developing an energy program. The Matrix is a benchmarking tool that helps organizations see how their energy management program stacks up to an established set of industry best practices.
Both resources were developed by the U.S. Environmental Protection Agency based on best practices from leading ENERGY STAR partners, the nation's leaders in energy management. The common denominator of success among these companies was that energy was managed continuously. Energy was not addressed intermittently or with quick fixes; energy was engrained in companies’ cultures and management systems, similar to how safety and quality assurance are typically approached throughout an organization. In other words, these organizations all had a programmatic versus a project based approach to energy related activities.
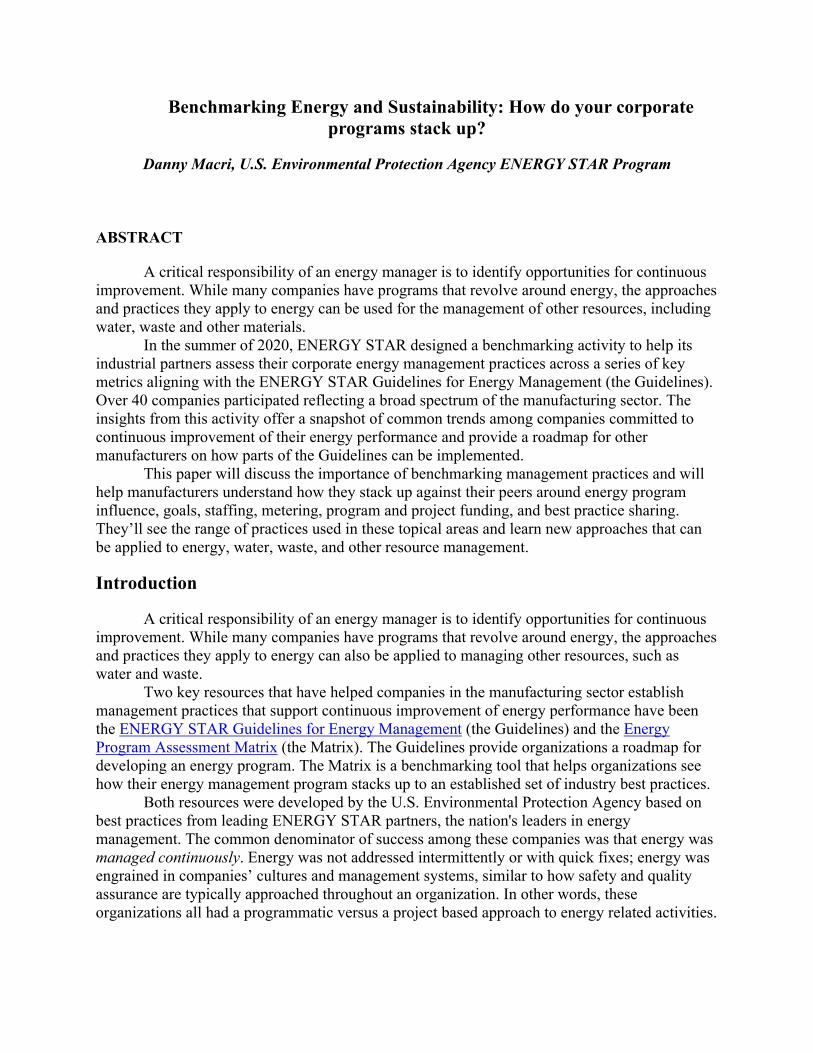
To distinguish between these two approaches further Table 1 provides some key differences between energy projects and energy programs.
Table 1. Key distinctions between a program vs. project-based approach to energy managment
Project Program Location Usually plant specific Organization wide Duration Limited Ongoing Scope Narrow (single activity) Wide-ranging (multiple projects
and activities) Goals Specific to project scope
i.e. Install LED lighting; make chillers more efficient
Specific to a portfolio of activities i.e. Reduce energy intensity by 15% in 10 years; create a culture of efficiency
Guiding resources for implementation
Project specifications Program policy
Expectations set by Varies, but based on manager who has technical area of expertise
Senior management/CEO
Staff scope Typically lasts until project is installed/completed
Permanent
In the summer of 2020 ENERGY STAR partners participated in an activity that
benchmarked their energy management practices amongst each other. The Guidelines and the Matrix both informed the benchmarking topics. The Guidelines and Matrix, for example, encourage companies to set goals and track their energy use on a routine basis. The benchmarking activity asked companies to share the kind of goals they have and where exactly they were tracking energy use. Similarly, the Guidelines and Matrix encourage companies to appoint an energy director and establish energy teams. The benchmarking activity asked companies the number of employees who have a formal role in energy management and where in the organization they sit.
After aggregating the responses, participants were able to learn how their management practices stacked up against their peers and how their peers implemented parts of the Guidelines. They learned, for example, how ambitious their goals were compared to other manufacturers and whether the resolution at which they are tracking energy and water use is the norm. Companies with more ambitious goals learned they were leaders among peers; those with less could use that information to help push for more ambitious goals in the future.
ENERGY STAR partners who participated in the activity received custom reports showing how they stacked up for all questions and topic areas. This paper shares a few key topic areas that are relevant for not just managing energy but other resources and can help manufacturers understand how different parts of the Guidelines for Energy Management can be implemented.
Guidelines for Energy Management
Since the Guidelines provided the framework for the benchmarking activity, this section describes the Guidelines in more detail and what they look like in practice.
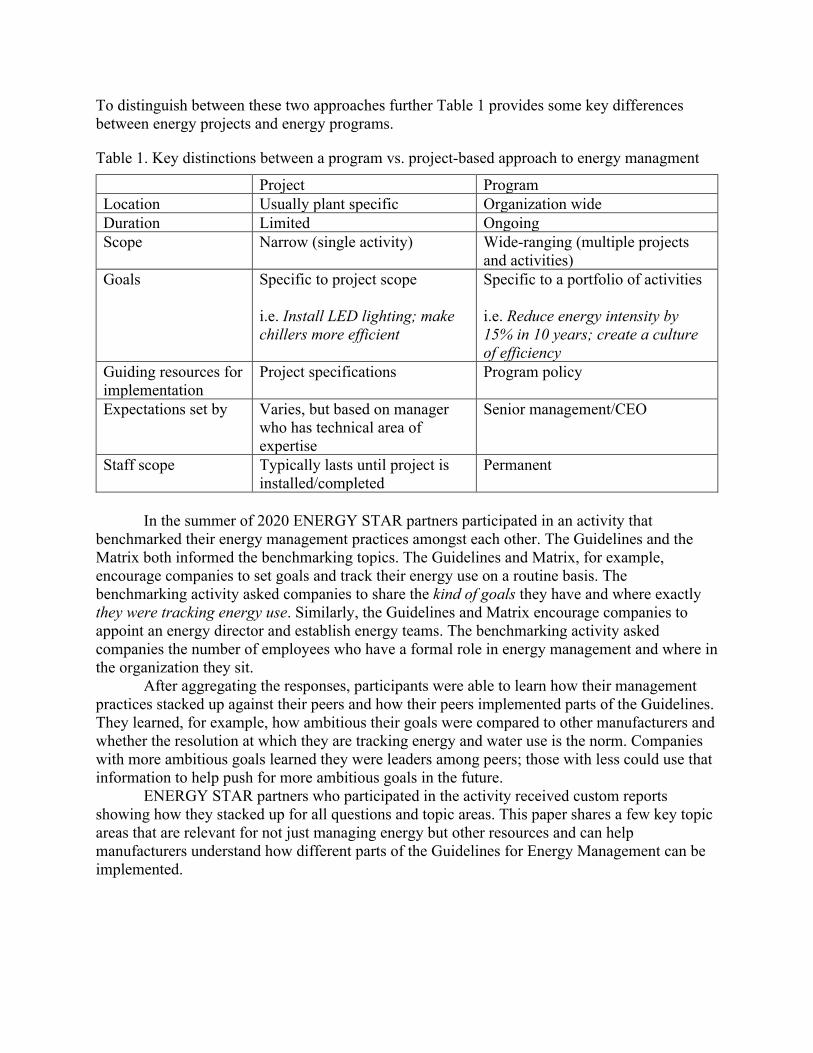
The Guidelines incorporate best practices from leading companies in a plan-do-check-act framework. See Figure 1 for a visualization of the framework structure. The Guidelines have informed Strategic Energy Management programs operated by utilities or energy program administrators and the ISO 50001 standard. The goal of the Guidelines is not just improvement, but continuous improvement. Without continuous improvement, or rather a process that promotes continuous improvement, any incremental improvements made could slip over time. ENERGY STAR recognizes current leaders in energy management annually through its ENERGY STAR Award for Energy Management. Profiles of leaders in this space and some of their management practices can be found at https://www.energystar.gov/about/awards/2021_energy_star_award_winners and sorted by the award name, Energy Management.
The Guidelines are written for energy, but they can be applied to managing other resources, including water and waste. The U.S. Environmental Protection Agency’s ENERGY STAR program has seen its partners apply the Guidelines more broadly when it comes to managing other materials and resources as part of their sustainability work. In addition, the Guidelines have also served as a foundation for best practices when it comes to water and waste1.
For those who have not been part of an energy management or similar program it may be difficult to conceptualize what exactly it is and what the Guidelines look like in practice. A narrative of a company that follows the Guidelines may look something like this:
The company has made a commitment to energy through a policy that was endorsed by senior leadership. Management demonstrated its commitment by creating an energy director position or integrating energy management as a formal responsibility within an existing position. The energy director/champion assessed current and past energy use to develop KPIs and baselines to track energy use on a regular basis. She worked with different divisions in the company and with senior leadership to estimate the organization’s potential for improvement and set energy related goals. With goals in place, the organizations didn’t just hope for the best. The energy manager created a plan and gained the support of key people within the organization to achieve the goals. Senior leadership’s commitment to energy helped. The energy manager worked with plant managers to identify energy champions in each plant and helped them develop plant level energy teams. The energy champions and teams monitored energy use on a regular basis, identified when energy consumption was abnormal to identify corrective action, and evaluated progress against goals. The organization energy manager
1 EPA’s Water Sense program, for example, in its Water Sense at Work guidebook presents a framework on how to effectively plan water management based on the based on the ENERGY STAR Guidelines for Energy Management. The Water Sense framework consists of the same steps shown in Figure 1. Similar guidance is given to organizations on how to manage and reduce waste from EPA’s Sustainable Materials Management Program.
recognized achievements of buildings, plants and individuals and helps identify opportunities for continuous improvement.
The Energy Manager followed the Guidelines and the organization increased its energy performance. She thought her organization was doing everything it reasonably could to manage energy but was curious how others were handling different aspects of their management system. She wondered: Are there more efficient ways to track energy use? What are techniques for getting large capital projects funded? Are we really doing enough?
That’s where benchmarking comes in. Although the organization in the example above
could be considered a model for following the Guidelines, it could still do so much more from seeing how peers were implementing specific aspects of the Guidelines.
Figure 1: Framework for the ENERGY STAR Guidelines for Energy Management
Benchmarking as a Best Practice for Energy and Other Resources
A key component of continuous improvement and the Guidelines is benchmarking. Benchmarking can be done quantitatively by comparing numerical measures of performance. Or it can be done qualitatively by comparing management and operational practices. While quantitative analysis can reveal important trends, benchmarking energy management practices can reveal an additional source of rich information and ideas of what can be done to drive performance.
EPA’s ENERGY STAR program routinely facilitates activities that promote benchmarking energy management practices among its industrial partners.2 Energy managers
2 Over 800 manufacturing companies, from large to small, are partners with ENERGY STAR. Companies join the ENERGY STAR industrial partnership to demonstrate a commitment to energy management, strengthen their
have learned tips and ideas from their peers and have replicated practices in their own organizations. While most benchmarking has focused on energy management, improvements in decarbonization, water and waste management can be similarly achieved through these efforts.
In the summer of 2020, ENERGY STAR designed a benchmarking activity to help its industrial partners gain more resolution into how others were implementing the Guidelines and assess their corporate energy management practices across a series of key metrics. Over 40 companies participated, reflecting a broad spectrum of the manufacturing sector. As ENERGY STAR Partners, this group of companies has already committed to energy management. The insights from this activity offer a snapshot of common trends among companies committed to continuous improvement of their energy performance and provide a greater insight for other manufacturers how parts of the Guidelines can be implemented.
Five topic areas from this exercise are relevant to the management of energy and other resources: energy program influence, setting goals, staffing, metering, program and project funding, and best practice sharing. While many of the questions focused on energy, the practices can be more broadly applied to other resources, namely water and waste.
Benchmarking Energy Management
The responses from the summer of 2020 ENERGY STAR industrial partner benchmarking activity were aggregated and visualized by topic area to show a distribution of responses along a continuum. Least desirable activities are on the left and most desirable activities are on the right. For example, the first section below discusses how much influence energy programs have on process energy use. The results are ordered in Figure 1 to show from left to right the percentage of energy programs that have no, little, some, and a lot of influence on process energy. A lot of influence is considered to be the most preferable response and no influence is considered to be the least preferable. A line was drawn at the median, the 50th percentile, showing that the current norm is for companies to have some influence on process energy. The sections below present some of the results from this exercise.
Energy program influence
The Guidelines for Energy Management encourage companies to create a culture of energy efficiency. Energy is not just managed in HVAC, boiler, chiller, and compressed air systems, but through the organization. While most companies strive to create a culture of energy the amount of influence energy programs have on business operations varies as shown in Figure 1. About half of the companies that responded explained their energy programs have “a lot of influence” on most areas of business operations where energy is used and over three-quarters indicated energy programs having at least some influence.
energy program through coaching and mentoring, learn from leading energy managers and their programs, and gain access to partner events and meetings. As a voluntary program, there are no fees, legal commitments, nor reporting requirements for Partners. In 2019, the ENERGY STAR program for industrial plants helped businesses save 35 billion kilowatt-hours of electricity, avoid $2 billion in energy costs, and achieve 40 million metric tons of greenhouse gas reductions.
Figure 1. Amount of influence energy programs have on different parts of company operations
The amount of control a program has over process energy is a key question that comes up in benchmarking discussions. For some manufacturing sectors process energy comprises the largest share of a company’s total energy consumption. Figure 1 shows that the norm (where median line bisects the bar) is for companies to have some influence over process energy though nearly 40% of companies have A lot of influence in this area. For companies that had no or little influence on process energy, they learned that many of their peers have at least some influence in this area and may be able to learn from them. Similarly, energy managers can use this information during internal discussions about their program to explain that it is not uncommon for energy programs in peer companies to have some involvement in managing process energy.
Goals
The Guidelines explain that “performance goals drive energy management activities and promote continuous improvement. Setting clear and measurable goals is critical for understanding intended results, developing effective strategies, and reaping financial gains.”
Ninety percent of participating companies had at least one sustainability goal as shown in Figure 2. On average, companies had three goals. The most common goal to have was energy, followed by GHG, water, waste and then renewable energy. Since this exercise was facilitated among companies that have committed to energy improvement, it is no surprise that having an energy goal was most common.
While most companies had an energy goal, it was not uncommon for them to have a separate greenhouse gas or renewable energy goal. Two-thirds, in fact, had both an energy and GHG goal. Forty-seven percent had both energy and renewable or GHG and renewable goals.
The takeaway from this section it is common to have multiple sustainability goals.
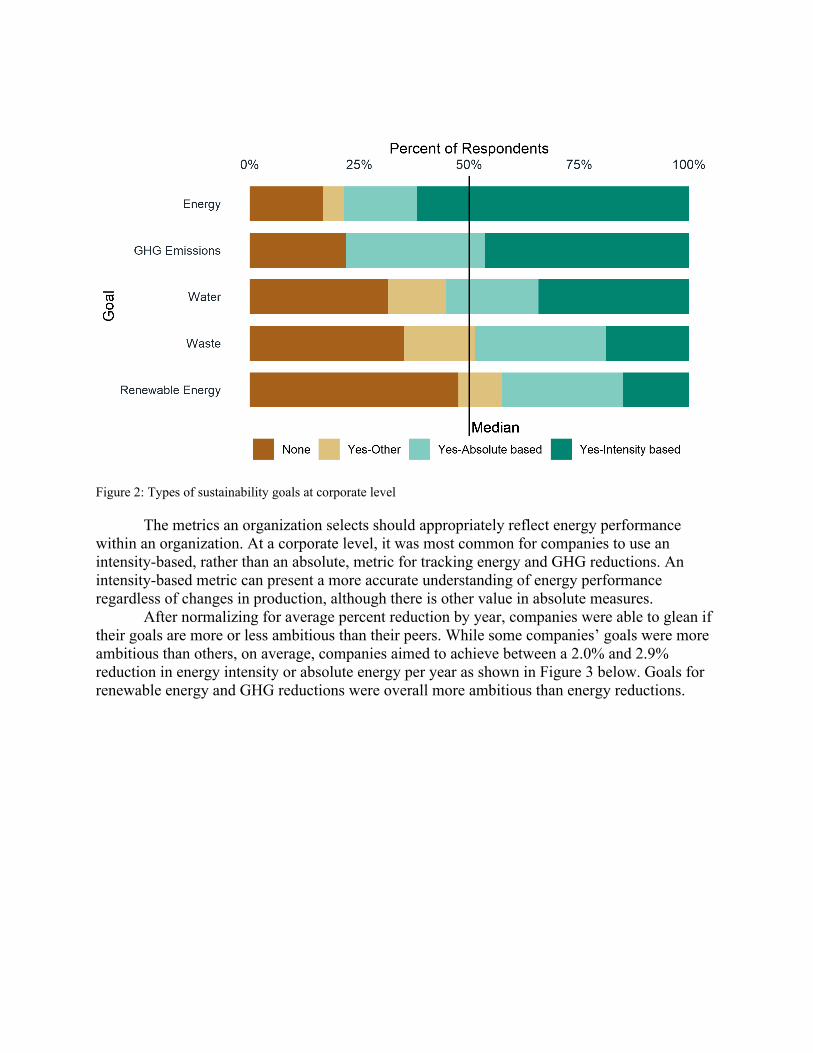
Figure 2: Types of sustainability goals at corporate level
The metrics an organization selects should appropriately reflect energy performance within an organization. At a corporate level, it was most common for companies to use an intensity-based, rather than an absolute, metric for tracking energy and GHG reductions. An intensity-based metric can present a more accurate understanding of energy performance regardless of changes in production, although there is other value in absolute measures.
After normalizing for average percent reduction by year, companies were able to glean if their goals are more or less ambitious than their peers. While some companies’ goals were more ambitious than others, on average, companies aimed to achieve between a 2.0% and 2.9% reduction in energy intensity or absolute energy per year as shown in Figure 3 below. Goals for renewable energy and GHG reductions were overall more ambitious than energy reductions.
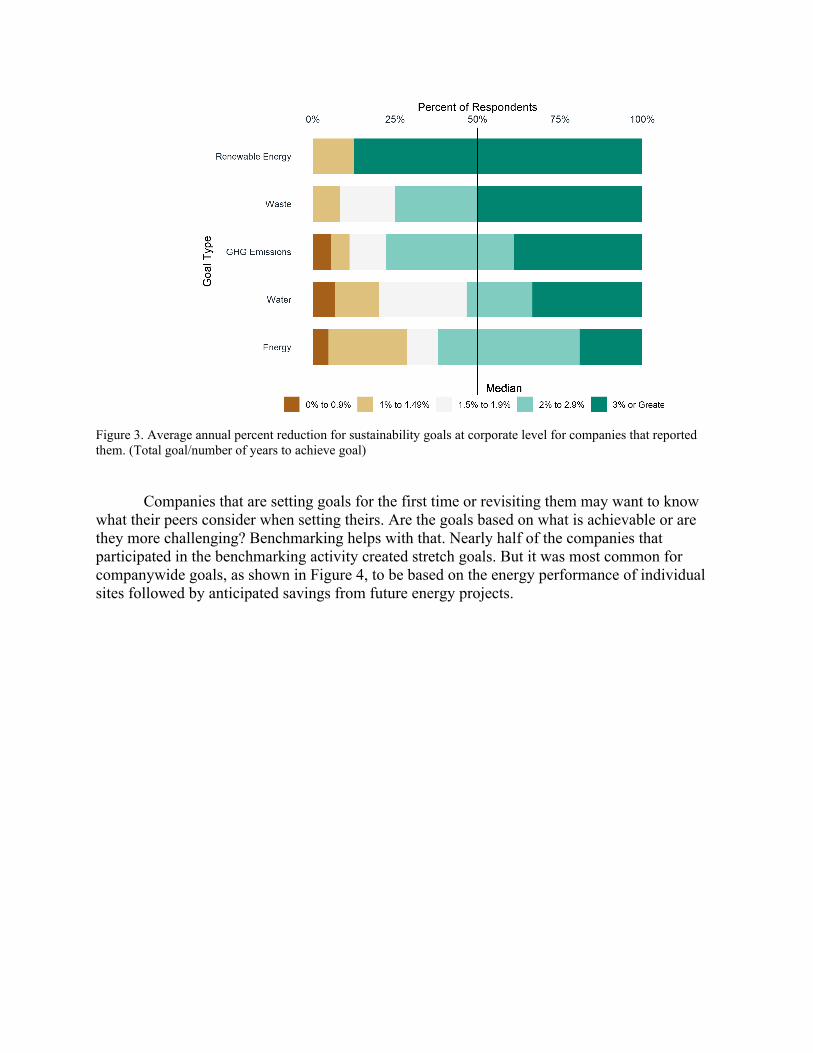
Figure 3. Average annual percent reduction for sustainability goals at corporate level for companies that reported them. (Total goal/number of years to achieve goal)
Companies that are setting goals for the first time or revisiting them may want to know
what their peers consider when setting theirs. Are the goals based on what is achievable or are they more challenging? Benchmarking helps with that. Nearly half of the companies that participated in the benchmarking activity created stretch goals. But it was most common for companywide goals, as shown in Figure 4, to be based on the energy performance of individual sites followed by anticipated savings from future energy projects.
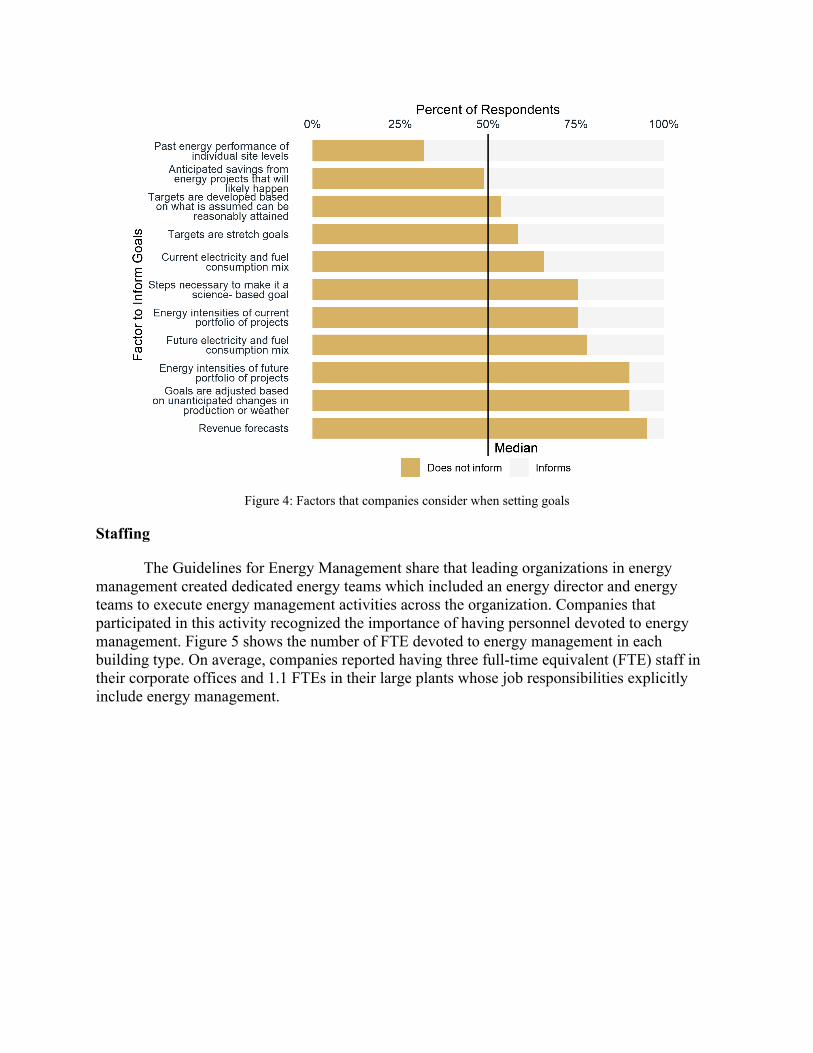
Figure 4: Factors that companies consider when setting goals
Staffing
The Guidelines for Energy Management share that leading organizations in energy management created dedicated energy teams which included an energy director and energy teams to execute energy management activities across the organization. Companies that participated in this activity recognized the importance of having personnel devoted to energy management. Figure 5 shows the number of FTE devoted to energy management in each building type. On average, companies reported having three full-time equivalent (FTE) staff in their corporate offices and 1.1 FTEs in their large plants whose job responsibilities explicitly include energy management.
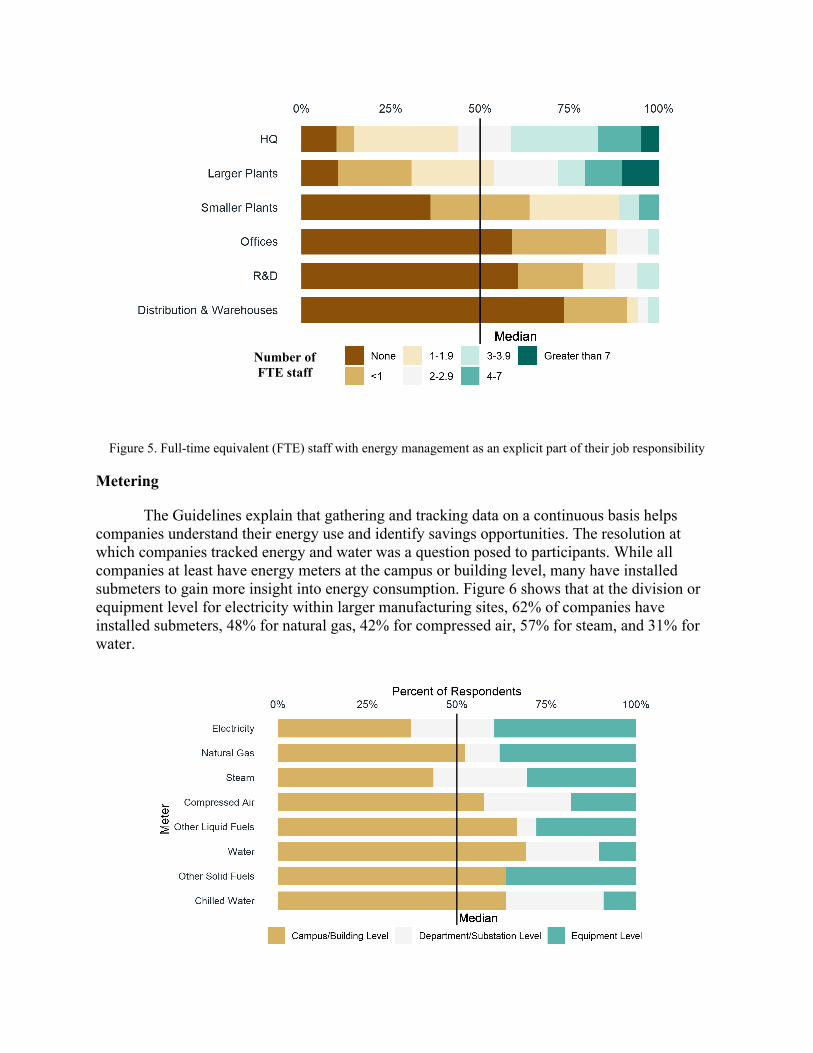
Figure 5. Full-time equivalent (FTE) staff with energy management as an explicit part of their job responsibility
Metering
The Guidelines explain that gathering and tracking data on a continuous basis helps companies understand their energy use and identify savings opportunities. The resolution at which companies tracked energy and water was a question posed to participants. While all companies at least have energy meters at the campus or building level, many have installed submeters to gain more insight into energy consumption. Figure 6 shows that at the division or equipment level for electricity within larger manufacturing sites, 62% of companies have installed submeters, 48% for natural gas, 42% for compressed air, 57% for steam, and 31% for water.
Number of FTE staff
Figure 6. Most granular level of metering in larger manufacturing plants
The takeaway from this topic is that if a company has installed electricity and steam
submeters in its largest plant, it is keeping up with industry trends since more than 50% of companies that participated have installed steam or electricity submeters at either the equipment, department or substation level. For other utilities, companies that have installed submeters may be leading the pack. Approximately 40% of companies have installed electricity or natural gas submeters at the equipment level in large plants. Energy managers who may try to justify installing submeters can point to these results showing where their peers have installed submeters and also discuss how peers have leveraged submeters.
Energy Program and Project Funding
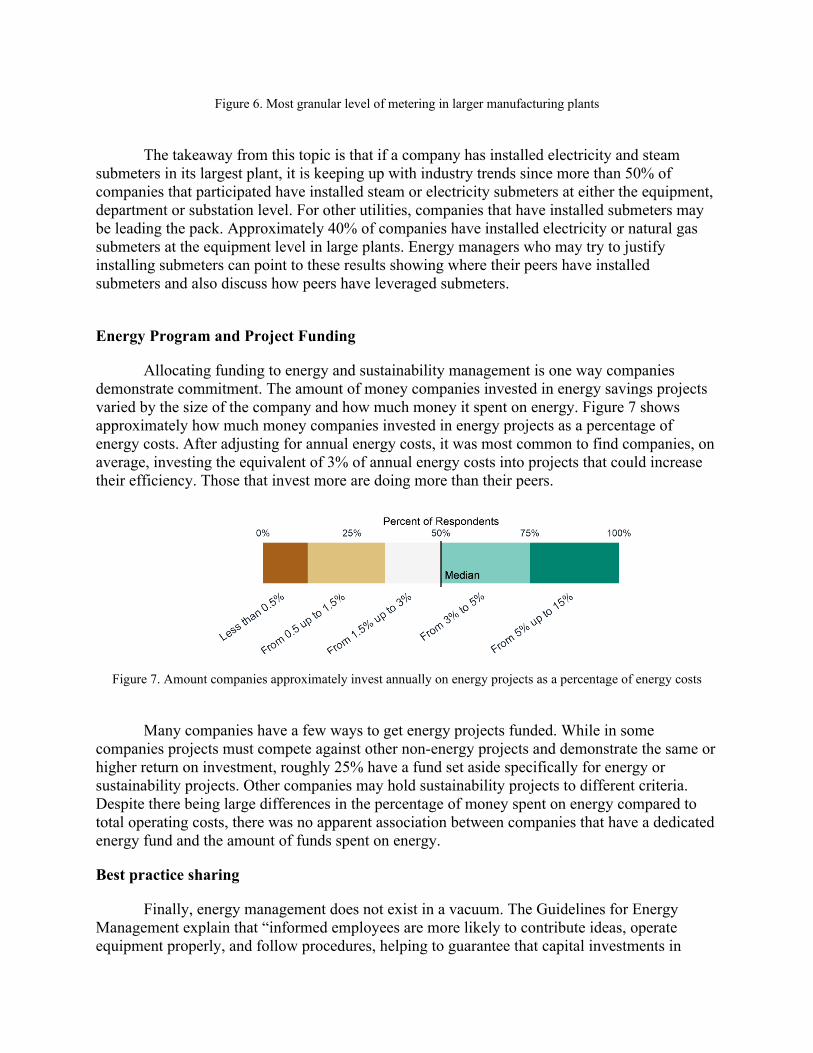
Allocating funding to energy and sustainability management is one way companies demonstrate commitment. The amount of money companies invested in energy savings projects varied by the size of the company and how much money it spent on energy. Figure 7 shows approximately how much money companies invested in energy projects as a percentage of energy costs. After adjusting for annual energy costs, it was most common to find companies, on average, investing the equivalent of 3% of annual energy costs into projects that could increase their efficiency. Those that invest more are doing more than their peers.
Figure 7. Amount companies approximately invest annually on energy projects as a percentage of energy costs
Many companies have a few ways to get energy projects funded. While in some
companies projects must compete against other non-energy projects and demonstrate the same or higher return on investment, roughly 25% have a fund set aside specifically for energy or sustainability projects. Other companies may hold sustainability projects to different criteria. Despite there being large differences in the percentage of money spent on energy compared to total operating costs, there was no apparent association between companies that have a dedicated energy fund and the amount of funds spent on energy.
Best practice sharing
Finally, energy management does not exist in a vacuum. The Guidelines for Energy Management explain that “informed employees are more likely to contribute ideas, operate equipment properly, and follow procedures, helping to guarantee that capital investments in
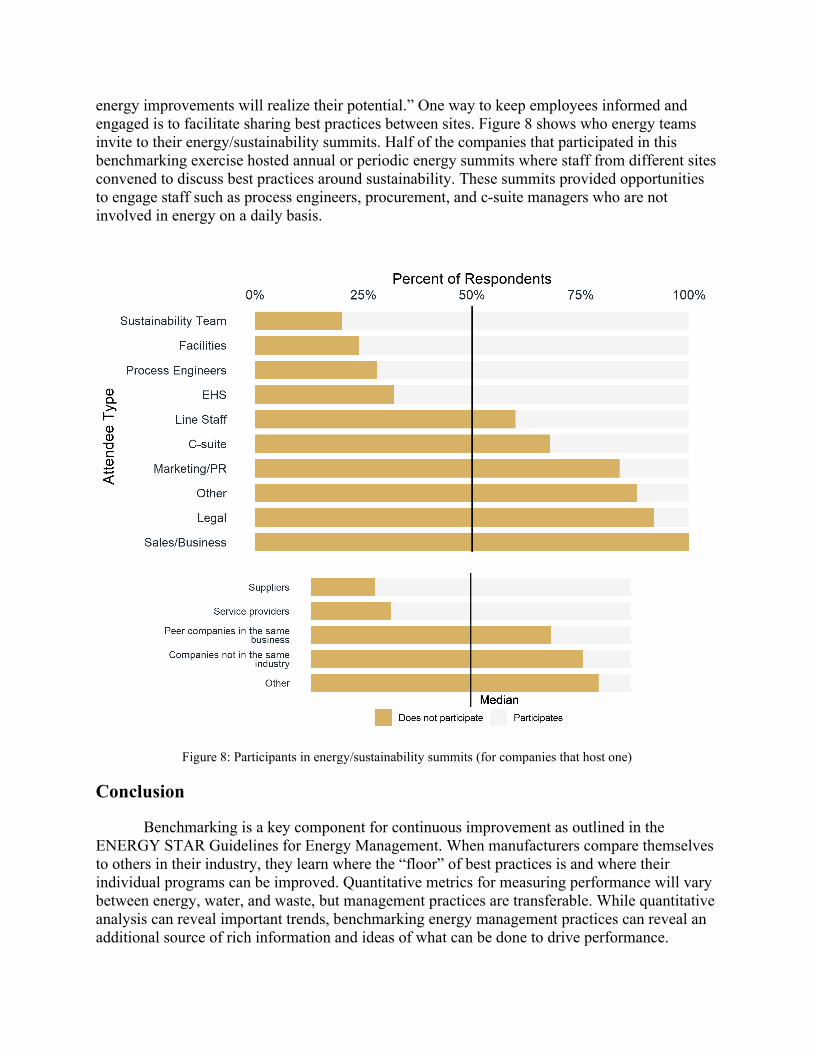
energy improvements will realize their potential.” One way to keep employees informed and engaged is to facilitate sharing best practices between sites. Figure 8 shows who energy teams invite to their energy/sustainability summits. Half of the companies that participated in this benchmarking exercise hosted annual or periodic energy summits where staff from different sites convened to discuss best practices around sustainability. These summits provided opportunities to engage staff such as process engineers, procurement, and c-suite managers who are not involved in energy on a daily basis.
Figure 8: Participants in energy/sustainability summits (for companies that host one)
Conclusion
Benchmarking is a key component for continuous improvement as outlined in the ENERGY STAR Guidelines for Energy Management. When manufacturers compare themselves to others in their industry, they learn where the “floor” of best practices is and where their individual programs can be improved. Quantitative metrics for measuring performance will vary between energy, water, and waste, but management practices are transferable. While quantitative analysis can reveal important trends, benchmarking energy management practices can reveal an additional source of rich information and ideas of what can be done to drive performance.
Qualitative benchmarking provides greater resolution into how organizations implement management frameworks such as the Guidelines, helps organizations understand different approaches that could benefit their organizations, and provides insight into how ambitious and comprehensive their programs are compared to their peers.