Ernst Worrell Copernicus Institute for Innovation & Sustainability Utrecht University, Utrecht, The Netherlands Benchmarking energy efficiency in the Iron & Steel Industry IIP Advisory Panel Paris, June 2011
Transcript
Ernst Worrell Copernicus Institute for Innovation & Sustainability Utrecht University, Utrecht, The Netherlands
Benchmarking energy efficiency in the Iron & Steel Industry IIP Advisory Panel Paris, June 2011
Why Benchmarking?
• A Reality Check • “What you don’t measure, you can’t manage” • Companies often have the perception that they are highly energy-
efficient • Benchmarking provides a tool to test this perception using
accepted benchmark values for technology • Benchmarking can improve the understanding of a process and
help identify best practices
• Benchmarking • Benchmarking provides insight in the efficiency relative to a
reference (or benchmark) performance/technology • Benchmarking can help enterprises to identify inefficiencies and
search for more efficient technology opportunities • Experience with benchmarking programs worldwide has shown
increased attention for energy-efficiency and performance • Benchmarking approach depends on goals
Is this benchmarking?
Source: US DOE. 2011. Meeting Energy Efficiency and Emissions Reduction Gals in the U.S. Steel Industry
NO !
What is Benchmarking?
• A fair comparison of the performance • NOT comparing energy intensities • NOT an infinite number of correction factors • NOT comparing apples and oranges
• Benchmarking addresses the specific product and
feedstock mix: • Differences in feedstock
• Raw materials • Differences in product
• Iron and steel • Types of steel products
Iron & Steelmaking
Steel & Energy Use
• Steel is a complex product - Primary vs. secondary steel, that
partially serve overlapping markets - Degree of processing - Alloys
• Energy use affected by • Process route • Degree of processing • Finishing • Energy efficiency • Material losses
• Many energy efficiency options
• In each process • Heat recovery • Process integration (e.g. thin slab
casting, smelt reduction) • Difficult to benchmark
• What products to distinguish? • System boundaries
• Limited Experience to date
i r o n o r e c o a l l i m e s t o n e s c r a p i r o n o r e f u e l s
p r e p a r a t i o n c o k e o v e n
b l a s t f u r n a c e
b a s i c o x y g e n f u r n a c e
o p e n h e a r t h f u r n a c e
o x y g e n
p r i m a r y s t e e l
e l e c t r i c a r c f u r n a c e
C - e l e c t r o d e
s t e e l
P r i m a r y S t e e l R o u t e S e c o n d a r y S t e e l R o u t e
c a s t i n g ( i n g o t / c o n t i n u o u s )
h o t r o l l i n g ( p r o f i l e , s t r i p , w i r e )
c o l d r o l l i n g
f i n i s h i n g
v a r i o u s s t e e l p r o d u c t s
D i r e c t R e d u c t i o n R o u t e
d i r e c t r e d u c t i o n s h a f t
s p o n g e i r o n
History Energy Benchmarking
• Benchmarking first introduced as tool for the petroleum refining industry by Solomon (1980’s).
• Later extended to ethylene plants • Intra-company efforts to understand differences • Extension of private benchmarking to other sectors
(1990’s) • Various consultants offering services (not for steel)
• Government Programs SUPPORTING benchmarking (1990’s)
• Norway, Canada, Malaysia, United Kingdom, United States • Government programs USING benchmarking (2000):
• Netherlands/Flanders: Benchmarking Covenant • EU ETS allocation new entrants (e.g. Germany, UK) • EU ETS: allocation tool in 3rd trading perios • ENERGY STAR: benchmarking to recognize plants achievements
• International sector-driven initiatives • WBSCD- Cement Sustainability Initiative • IAI – Aluminium industry • World Steel Association (?)
Malaysia
Accounting for Apples and Oranges
∑∑
∑
==
=
⋅⋅=
⋅
⋅⋅= n
iBPii
totn
iBPii
n
iii
EIP
E
EIP
EIPEEI
1,
1,
1 100100
EEI = energy efficiency index n = number of products to be aggregated EIi = actual energy intensity for product i EIi,BP = best practice energy intensity for product i Pi = production quantity for product i. Etot = total actual energy consumption for all products
Energy efficiency in the iron and steel industry
0
50
100
150
200
250
300
350Ca
nada
Fran
ceG
erm
any
Italy
Japa
nUn
ited
King
dom
Unite
d St
ates
Russ
iaBr
azil
Chin
a
Indi
aM
exic
oSo
uth
Afric
a
Ener
gy E
ffici
ency
Inde
x
1996-2000 2001-2005
Source: REEEP Global Status Report on Energy Efficiency 2008
EU–ETS – 3rd Period Allocation
• Benchmarking to be used as tool to coke to more fair allocation of emission rights
• Developed by Ecofys and Fraunhofer Institute • In contrast to other sectors • No aggregated benchmark curve for EU iron & steel industry
• Developed benchmark approach by intermediate product:
• For some processes benchmark curves were (are being) established (by Eurofer)
• Sinter plant • EAF
• For some based on IISI 1998 best practices and assumed fuel mix • Coke ovens • Blast furnace
BEST
• Based on international comparsions work (1994-1996) • Combines benchmarking with opportunity assessment • Approach developed by LBNL/Utrecht University
• Approach presented in 2006 paper • Tested on hypothetical Chinese integrated mill
Source: Worrell & Price. IJGE 3: 117-126 (2006)
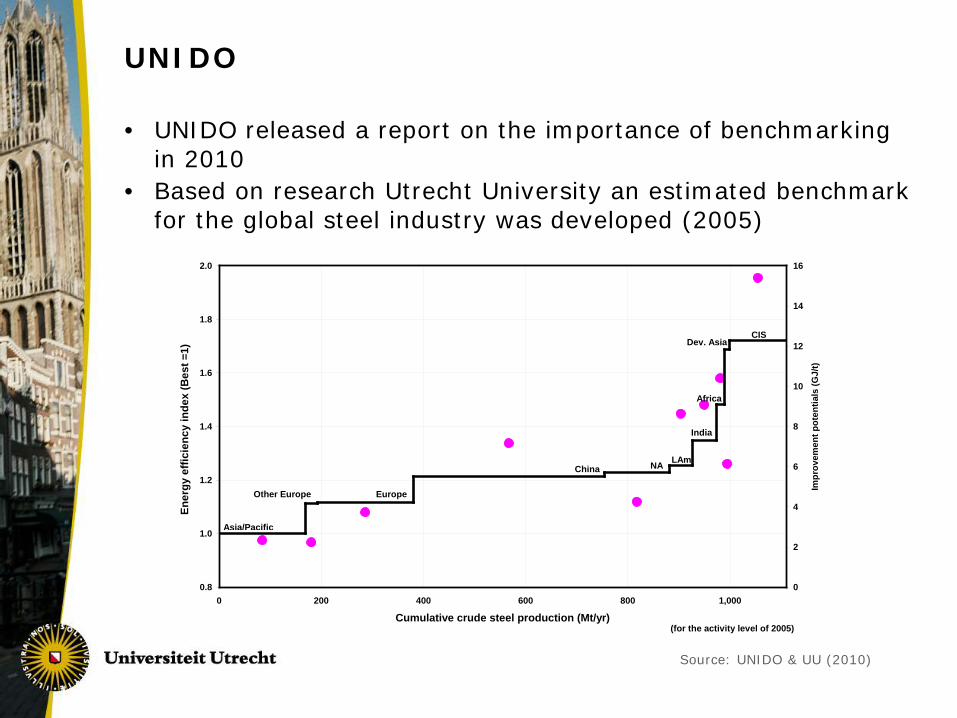
UNIDO
• UNIDO released a report on the importance of benchmarking in 2010
• Based on research Utrecht University an estimated benchmark for the global steel industry was developed (2005)
0.8
1.0
1.2
1.4
1.6
1.8
2.0
0 200 400 600 800 1,000
Cumulative crude steel production (Mt/yr)
Ener
gy e
ffici
ency
inde
x (B
est =
1)
0
2
4
6
8
10
12
14
16
Impr
ovem
ent p
oten
tials
(GJ/
t)
Asia/Pacific
India
CIS
NA
Other Europe
(for the activity level of 2005)
Europe
ChinaLAm
Dev. Asia
Africa
Source: UNIDO & UU (2010)
ENERGY STAR: EPI
• ENERGY STAR provides focus companies a benchmarking tool to:
• Evaluate performance • Identify potential for improvement • Recognize the ENERGY STAR Partner of the Year
• Based on statistical model for EAFs, using:
• Data from the US Census • Reported on a consistent basis for all plants • Confidentiality assured
• Public data collected from various sources • EAF Roundup
• Data provided by companies
• Results in statistical model • Confidentiality
• Currently under development and tested by industry
Canada – 2007 Benchmarking Study
• Benchmarking of energy intensity • Benchmarking of individual processes
• Against 1998 IISI Ecotech ‘Best Practice’ performance • Unclear for what factors has been corrected • Example: blast furnaces
Source: NRCan (2007) Benchmarking the Energy Intensity of the Canadian Steel Industry
Wrap Up – Challenges and Opportunities
• There is no single tool or approach that is accepted by the industry and/or policymakers
• Benchmarking has taken different forms • Most often based on “best practices” approach • Intensity • Efficiency index • CO2
• System boundaries and correction factors differ
• Need to develop a widely accepted method • Develop system boundaries • Determine structural correction factors