33
Benchmarking Healthcare Facilities Performance: A Key Competency for Today’s Healthcare Facility Manager
Benchmarking Healthcare Facilities
Performance: A Key Competency for
Today’s Healthcare Facility Manager
Outline
• Benchmarking; What? Why? How?
• Benchmarking Focus for the Facility Manager
• Brief Overview of Relevant Tools/Benchmark
Sources
• Case Study of Selected Memorial Hermann
Initiatives
• Q & A Follow-up
2
Why?
3
* Benchmark: A standard by which something can be judged. A surveyor’s mark made on a stationary object and used as a reference point.
• Which definition is most relevant to healthcare
facilities management?
• Is your operation a “stationary object”?
• Do you benchmark to justify current state, or
benchmark, to improve outcomes?
* Source: American Heritage Dictionary
‘Myth Busters’ in Our Industry
4
• The new building will operate more energy efficient than my 1975 facility.
• The latest HVAC widget will reduce operating expenses by 15%.
• This new computerized CMMS database is easy to use and is a simple tool to benchmark your organization’s performance.
• This new expansion was designed to be LEED/ES certified and will meet the energy efficient standard at occupancy.
• This widget will eliminate all chemical water treatment at your central plant
• My project has never had a ‘change order’ (varying project delivery methods)
• ‘Value Engineering’ produces a higher value product for the owner.
Benchmarking Toolkit
5
• People (a financial analyst would be beneficial)
• Excel (and) Excel Wiz
• Facility Square Feet Statistic (which standard?)
• Financial Summaries (R&M, Utilities, FTE’s, Contract Services)
• Historical Perspective (not just current year performance)
• Other Regional Facilities
• Other National Facilities
• A Method (knowledge of) Normalizing Data
• Logic and Common Sense
• Open Mind
Definitions/Buzz Words/ Statistics
6
• Adjusted Patient Days
• Adjusted Discharges
• Bed Count vs. Operating Beds
• Cooling Degree Days/Heating Degree Days
• Current Replacement Value (CRV) Index
• Gross Square Foot (GSF) vs. NRA, NUA
• n, mean, median, reversion to the mean
Relevance
All has direct impact on benchmarking outcomes.
7
• So: We know what it takes to operate an acute care
hospital or medical center.
However
• As we construct and operate the outpatient ambulatory,
retail and hybrid facilities how do we calculate and
justify staffing, R&M $, utilities, capital replacement $ ?
• Focus Shift: facility responsibility vs. regional and/or
multiple small facilities
Future State (Logic)
8
• Does this historical benchmarking data mean anything given declining reimbursements and bottom line erosion in healthcare?
• “We’ve Always Done it This Way”
Therefore…
• Best value of benchmarking is internal self improvement
• Find your inefficiencies
• Resolve/Harvest low hanging fruit
Benchmarking is a Change Management Tool
• Benchmarking as a self-preservation ‘evolutionary’ tool
• Dinosaur vs. Bacterium (Which are you?)
Future State (Reality)
9
Systems That Never Seem to Work the First Time
• Internal Sub-Metering
• Building Control Dashboards
• Data Archiving from your BCS
• Tenant Allocations (i.e., Billbacks)
• ‘Clean’ Building Separations (office/research/acute care)
All of these are Challenging to ‘Normalize’:
• To Other Facilities in your Portfolio
• To Neighbors; Regional, National
Necessary Data Collection
Tools To Benchmark
10
• Often only Year/Year is evaluated and rewarded (close the books at year-end)
• Law of Large Numbers: Long Term focus (trends)
• Do we know what the latest MEP “widget” actual does compared to a traditional system? Facts vs. Sales
• Do you have the tools in place to evaluate
- Kwh, chilled water tons, kw/ton, heating Btu production, etc. Is it readily available to the operator via a simple dashboard.
• How do the various buildings on your campus perform:
against each others
against a neighbor
against a national standard
against what the design team stated as a goal (i.e., LEED, energy model)
Benchmarking Thoughts To
Consider
11
• Do you trust your own data? (be critical)
o What are you truly metering?
o What method of sq ft are you using? Verified?
o What “other” cost data is mixed in with your
R&M Budget
Utility Budget
i.e., Activities Based Costing Concept
• Nationally recognized benchmarking and/or quality standards in our
industry
Benchmarking Thoughts To
Consider
o LEED o Delta
o ENERGY STAR© o ASHRAE’s – (Energy Performance Ratio)
o Solutient
o ASHE/IFMA
12
• ‘Normalization’ of data (using linear regression modeling to compare the features of an apple to a soccer ball out six decimal places). Humor, or Reality?
• Can buildings from different eras, regions, and climate zones truly be compared?
• Benchmarking ‘standards’ are not standard
• Normalization process often obfuscates the obvious (Focus vs. Fixing)
• Historical data may not justify current operating environment (bottom line); I trust your data but… cut 10% regardless!
However;
• Several good sources of benchmark data and benchmark processes
What’s Wrong With a
National Benchmark?
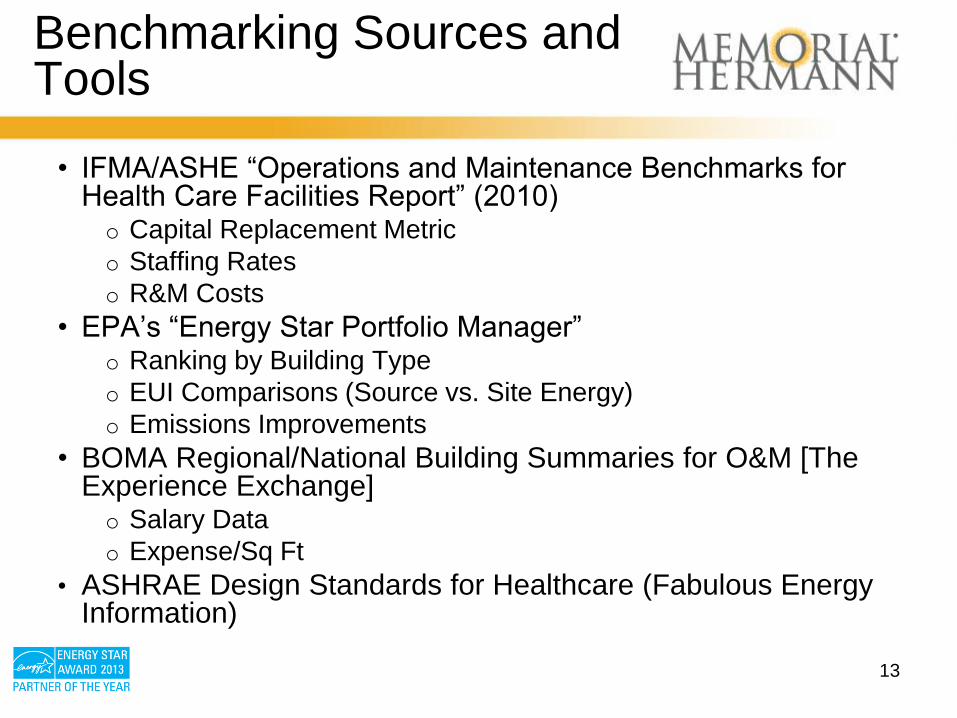
• IFMA/ASHE “Operations and Maintenance Benchmarks for Health Care Facilities Report” (2010) o Capital Replacement Metric
o Staffing Rates
o R&M Costs
• EPA’s “Energy Star Portfolio Manager” o Ranking by Building Type
o EUI Comparisons (Source vs. Site Energy)
o Emissions Improvements
• BOMA Regional/National Building Summaries for O&M [The Experience Exchange] o Salary Data
o Expense/Sq Ft
• ASHRAE Design Standards for Healthcare (Fabulous Energy Information)
13
Benchmarking Sources and Tools
14
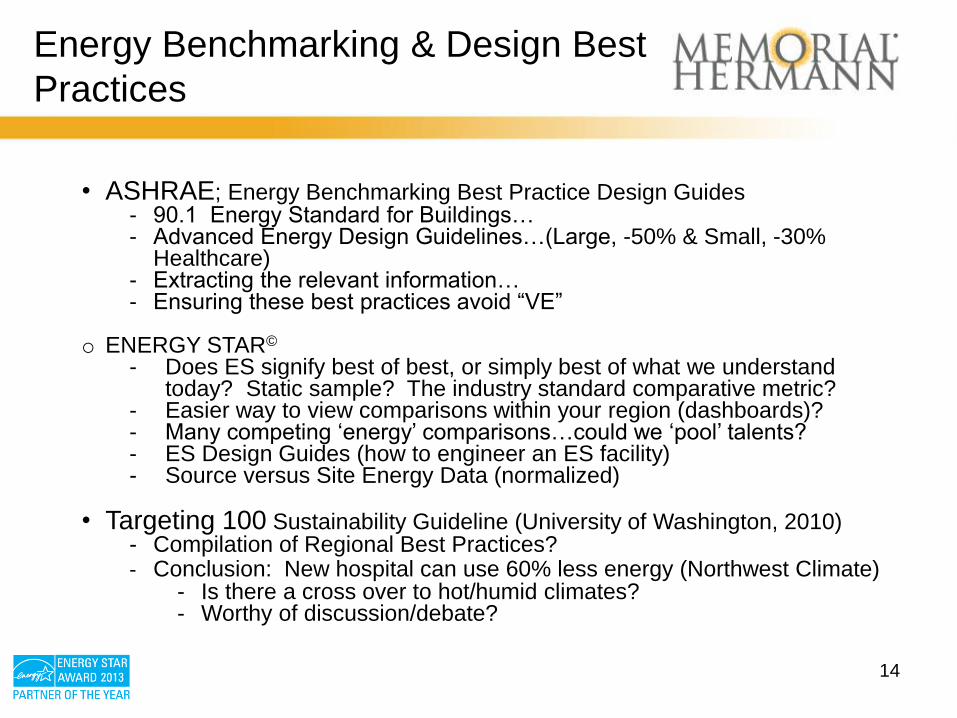
• ASHRAE; Energy Benchmarking Best Practice Design Guides - 90.1 Energy Standard for Buildings… - Advanced Energy Design Guidelines…(Large, -50% & Small, -30%
Healthcare) - Extracting the relevant information… - Ensuring these best practices avoid “VE”
o ENERGY STAR©
- Does ES signify best of best, or simply best of what we understand today? Static sample? The industry standard comparative metric?
- Easier way to view comparisons within your region (dashboards)? - Many competing ‘energy’ comparisons…could we ‘pool’ talents? - ES Design Guides (how to engineer an ES facility) - Source versus Site Energy Data (normalized)
• Targeting 100 Sustainability Guideline (University of Washington, 2010)
- Compilation of Regional Best Practices? - Conclusion: New hospital can use 60% less energy (Northwest Climate)
- Is there a cross over to hot/humid climates? - Worthy of discussion/debate?
Energy Benchmarking & Design Best
Practices
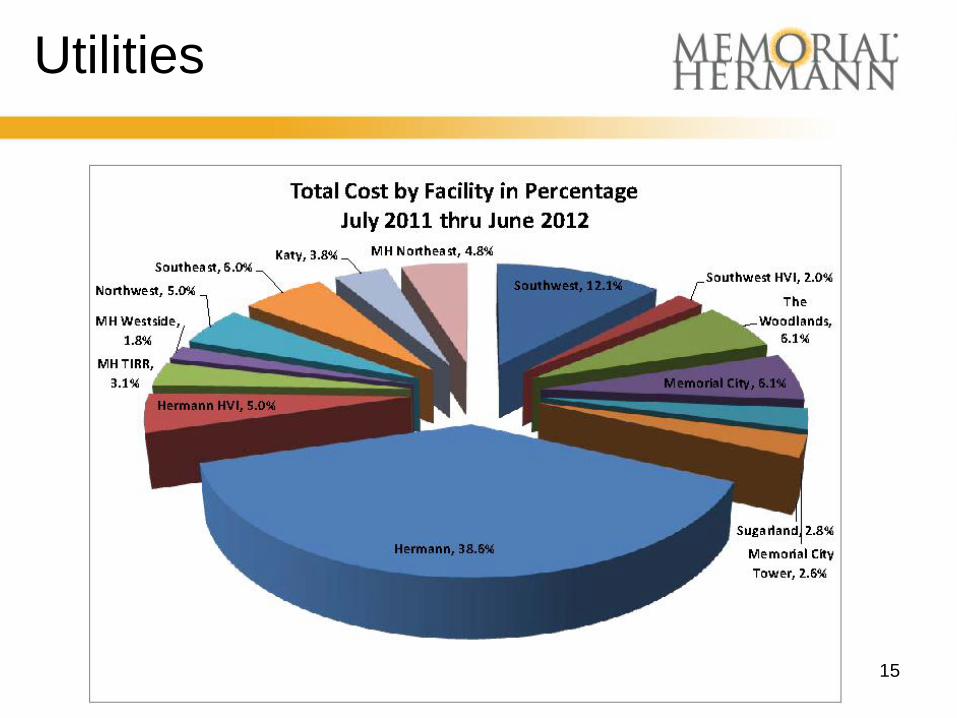
Utilities
15
16
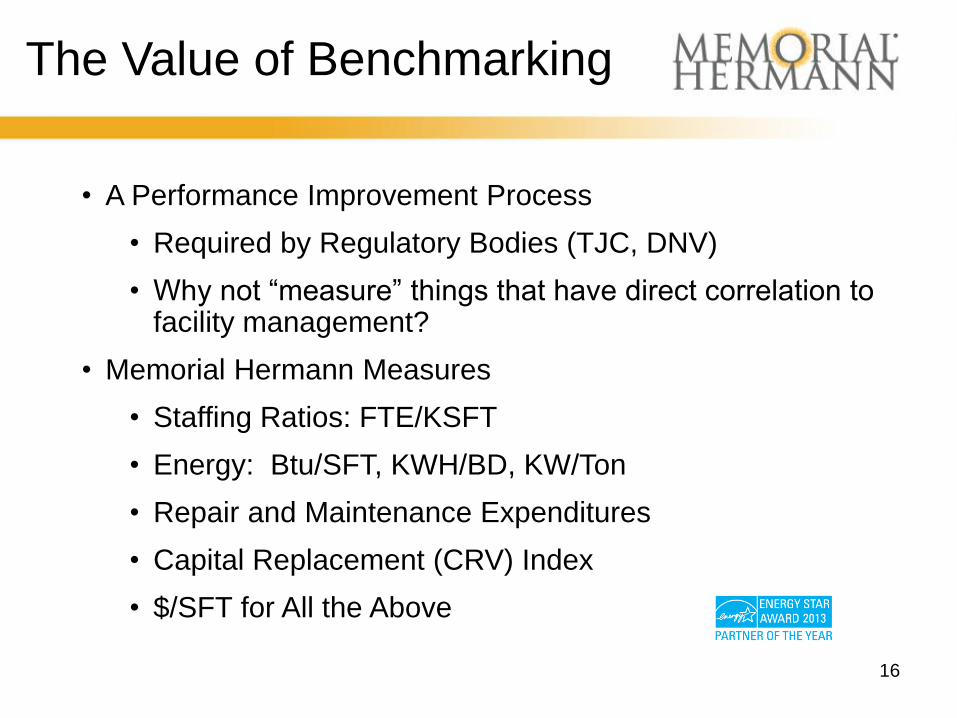
• A Performance Improvement Process
• Required by Regulatory Bodies (TJC, DNV)
• Why not “measure” things that have direct correlation to facility management?
• Memorial Hermann Measures
• Staffing Ratios: FTE/KSFT
• Energy: Btu/SFT, KWH/BD, KW/Ton
• Repair and Maintenance Expenditures
• Capital Replacement (CRV) Index
• $/SFT for All the Above
The Value of Benchmarking
17
• i.e., the ‘Engineer’ vs. the CFO
• Engineer/Architect/Facility Manager
• LEED
• ENERGY STAR©
• Lean Six Sigma
• Kbtu/SFT+
• EUI Rating
• CFO:
$
Why $ Are Actually More
Important Than “Units” (Sales)
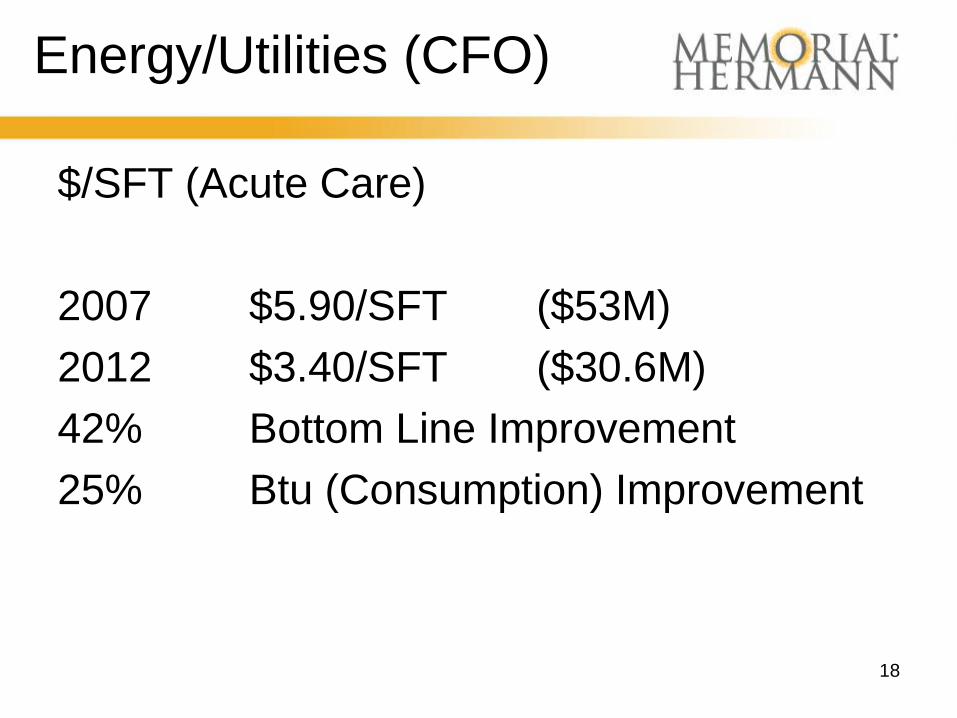
Energy/Utilities (CFO)
$/SFT (Acute Care)
2007 $5.90/SFT ($53M)
2012 $3.40/SFT ($30.6M)
42% Bottom Line Improvement
25% Btu (Consumption) Improvement
18
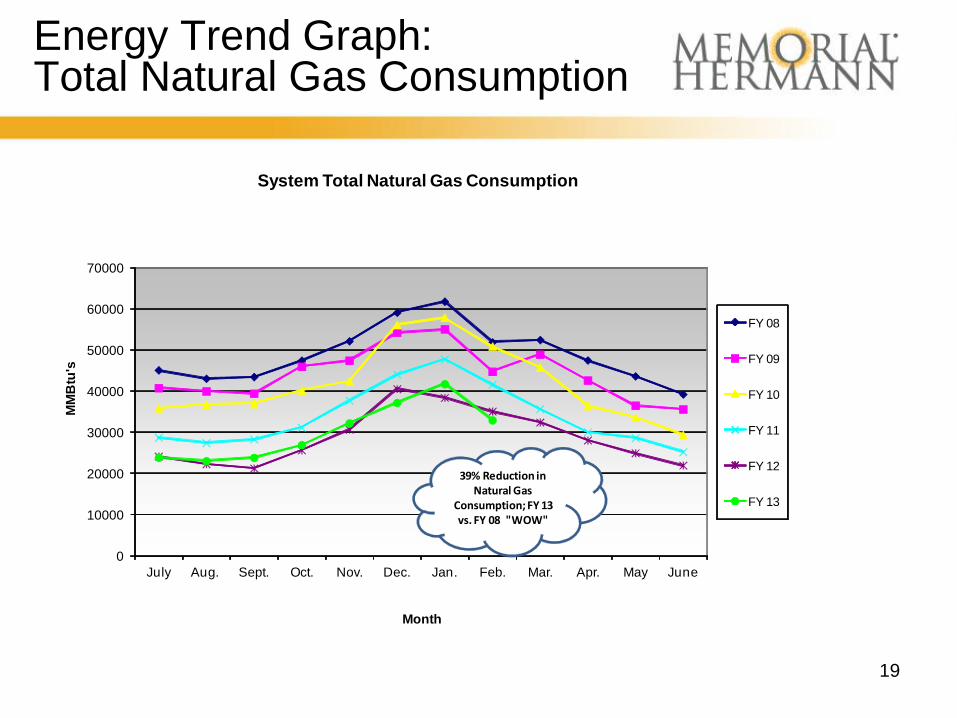
Energy Trend Graph: Total Natural Gas Consumption
19
0
10000
20000
30000
40000
50000
60000
70000
July Aug. Sept. Oct. Nov. Dec. Jan. Feb. Mar. Apr. May June
MM
Btu
's
Month
System Total Natural Gas Consumption
FY 08
FY 09
FY 10
FY 11
FY 12
FY 13
39% Reduction in Natural Gas
Consumption; FY 13 vs. FY 08 "WOW"
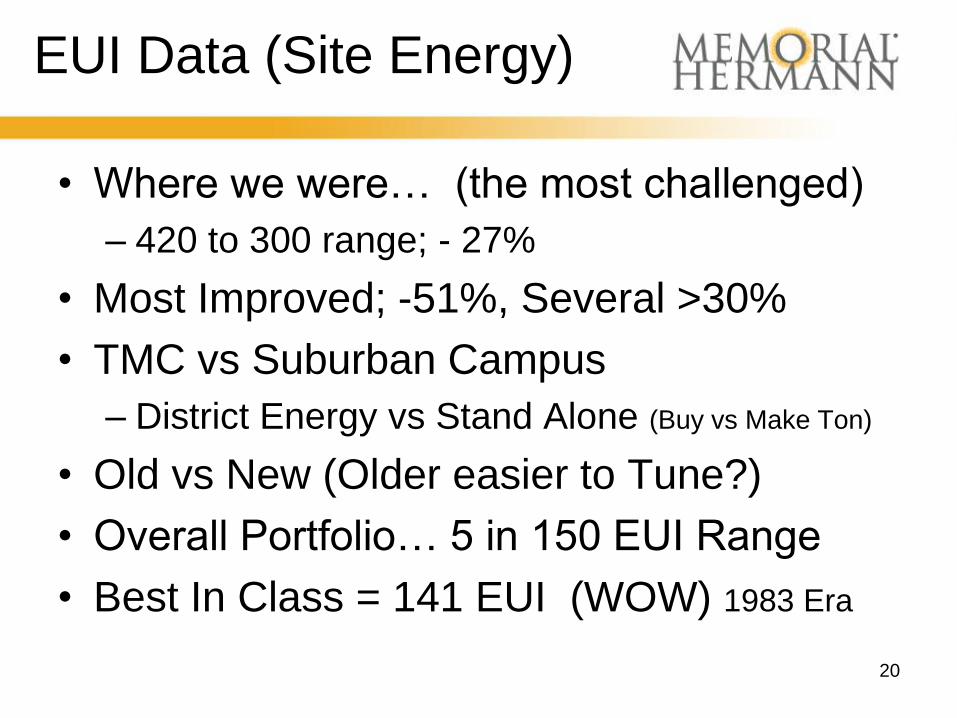
EUI Data (Site Energy)
• Where we were… (the most challenged)
– 420 to 300 range; - 27%
• Most Improved; -51%, Several >30%
• TMC vs Suburban Campus
– District Energy vs Stand Alone (Buy vs Make Ton)
• Old vs New (Older easier to Tune?)
• Overall Portfolio… 5 in 150 EUI Range
• Best In Class = 141 EUI (WOW) 1983 Era
20
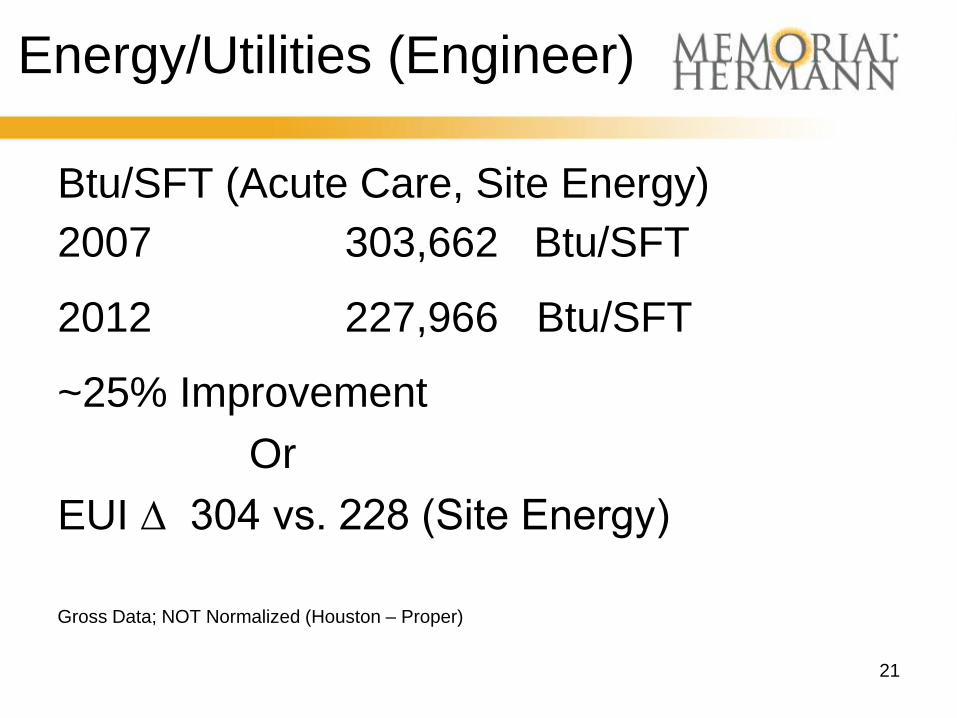
Energy/Utilities (Engineer)
Btu/SFT (Acute Care, Site Energy)
2007 303,662 Btu/SFT
2012 227,966 Btu/SFT
~25% Improvement
Or
EUI ∆ 304 vs. 228 (Site Energy)
Gross Data; NOT Normalized (Houston – Proper)
21
22
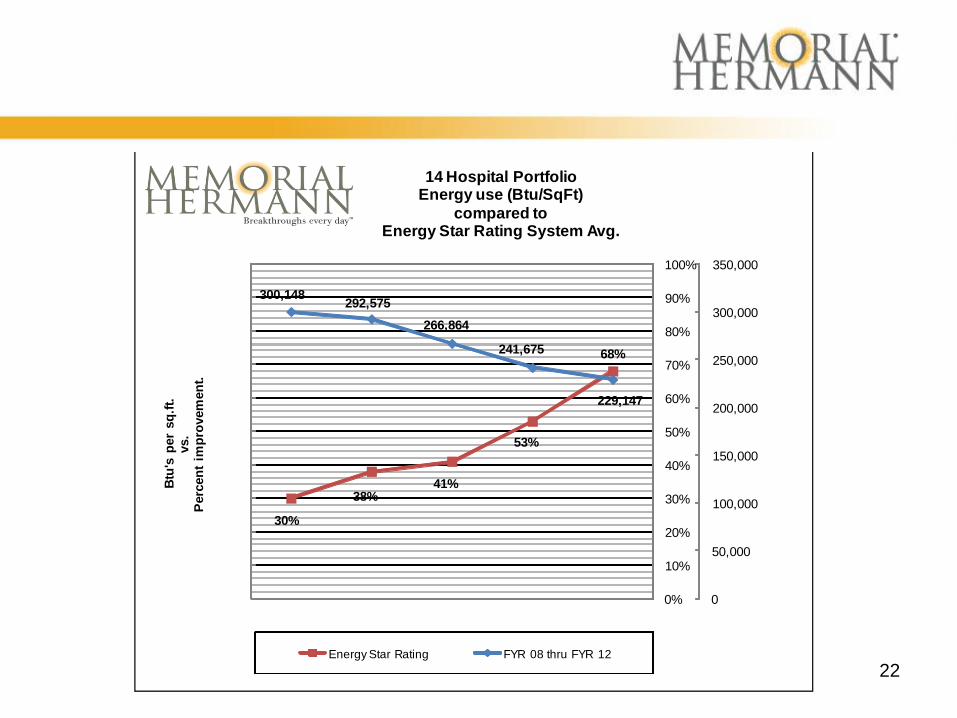
30%
38%41%
53%
68%
300,148292,575
266,864
241,675
229,147
0
50,000
100,000
150,000
200,000
250,000
300,000
350,000
0%
10%
20%
30%
40%
50%
60%
70%
80%
90%
100%
Btu
's p
er
sq
.ft.
vs.
Perc
en
t im
pro
vem
en
t.
14 Hospital PortfolioEnergy use (Btu/SqFt)
compared toEnergy Star Rating System Avg.
Energy Star Rating FYR 08 thru FYR 12
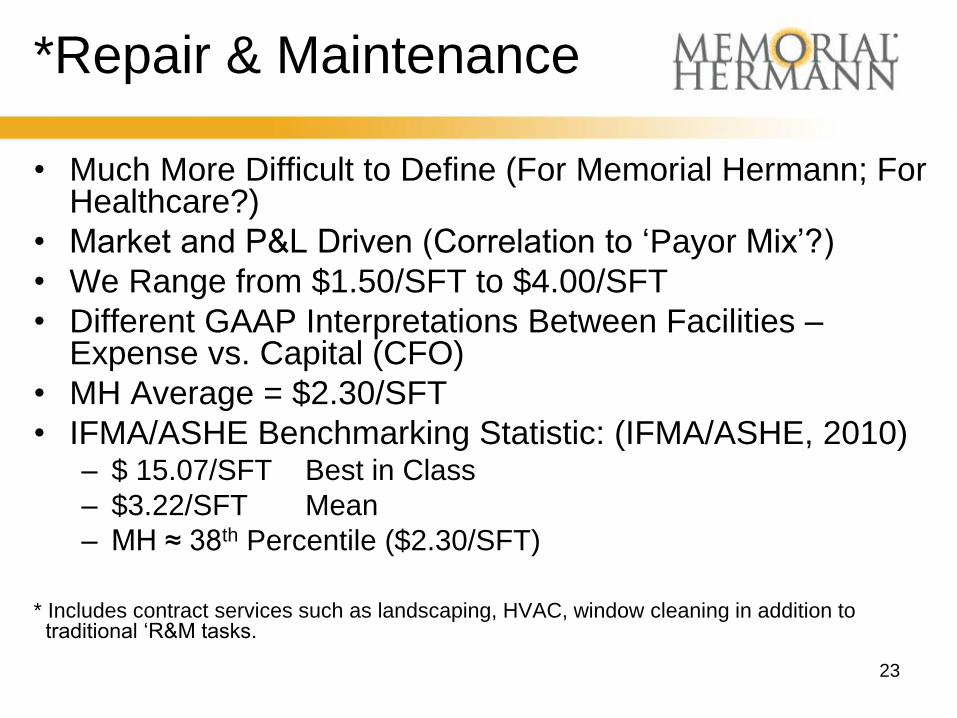
*Repair & Maintenance
• Much More Difficult to Define (For Memorial Hermann; For Healthcare?)
• Market and P&L Driven (Correlation to ‘Payor Mix’?)
• We Range from $1.50/SFT to $4.00/SFT
• Different GAAP Interpretations Between Facilities – Expense vs. Capital (CFO)
• MH Average = $2.30/SFT
• IFMA/ASHE Benchmarking Statistic: (IFMA/ASHE, 2010) – $ 15.07/SFT Best in Class
– $3.22/SFT Mean
– MH ≈ 38th Percentile ($2.30/SFT)
* Includes contract services such as landscaping, HVAC, window cleaning in addition to
traditional ‘R&M tasks.
23
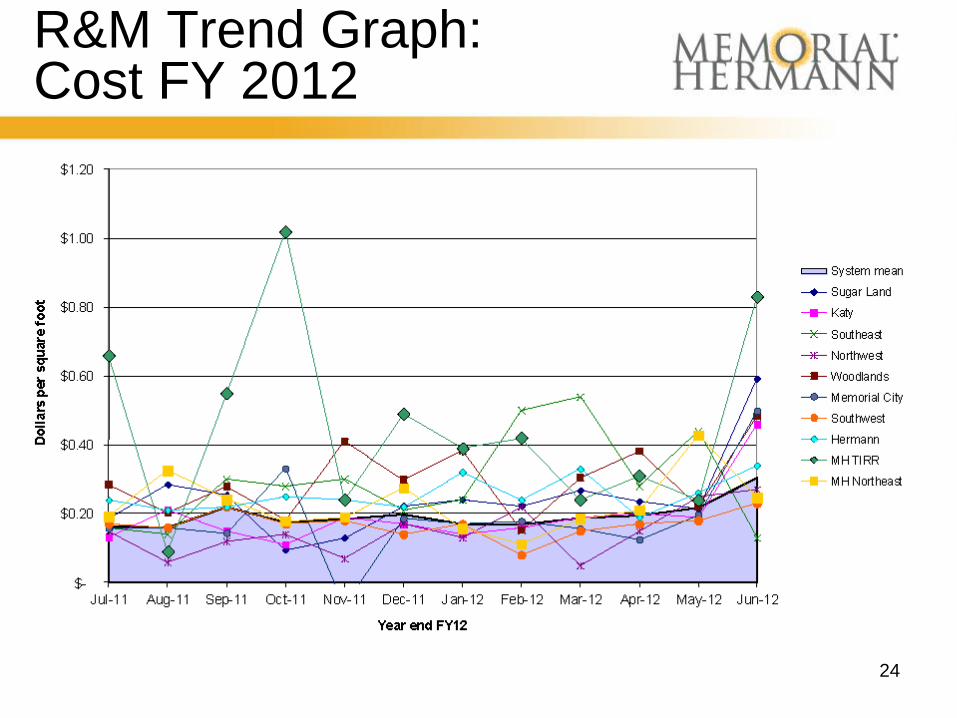
R&M Trend Graph: Cost FY 2012
24
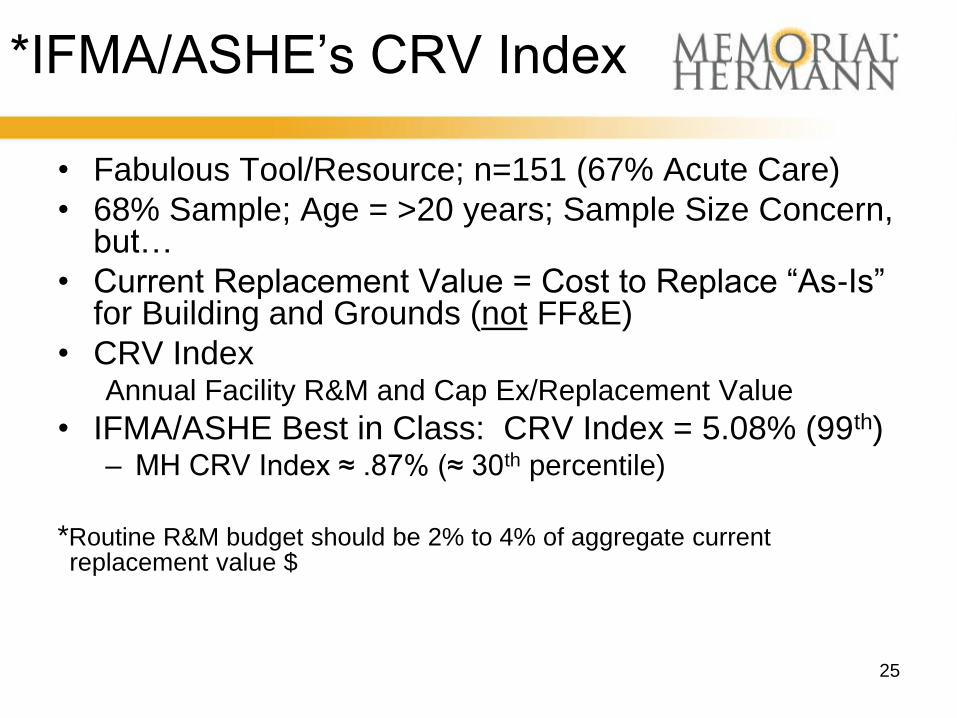
*IFMA/ASHE’s CRV Index
• Fabulous Tool/Resource; n=151 (67% Acute Care)
• 68% Sample; Age = >20 years; Sample Size Concern, but…
• Current Replacement Value = Cost to Replace “As-Is” for Building and Grounds (not FF&E)
• CRV Index Annual Facility R&M and Cap Ex/Replacement Value
• IFMA/ASHE Best in Class: CRV Index = 5.08% (99th) – MH CRV Index ≈ .87% (≈ 30th percentile)
*Routine R&M budget should be 2% to 4% of aggregate current replacement value $
25
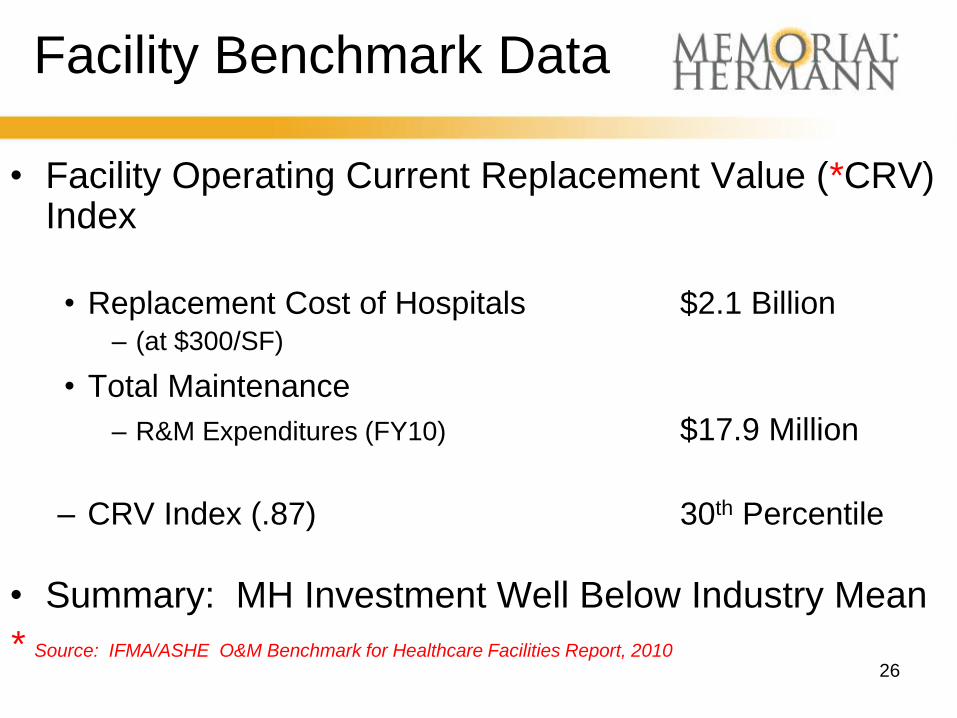
Facility Benchmark Data
• Facility Operating Current Replacement Value (*CRV) Index
• Replacement Cost of Hospitals $2.1 Billion – (at $300/SF)
• Total Maintenance – R&M Expenditures (FY10) $17.9 Million
– CRV Index (.87) 30th Percentile
• Summary: MH Investment Well Below Industry Mean
* Source: IFMA/ASHE O&M Benchmark for Healthcare Facilities Report, 2010
26
CRV Index
• What did we do?
– Tool (Real Data) to Leverage $20M/year for
Infrastructure Projects at Facilities
• Roofs
• Exterior Building Façade
• AHU’s/RTU’s
• Boilers/HVAC Items
– Data and Benchmarking can work!
– Benchmarking = Proactive Approach to
Capital Planning! Duty to ‘Inform’
27
28
• Worthy of Your Review
• Google IFMA/ASHE
Benchmark to Download
• Now: Who will keep up
this effort to improve
statistical validity?
• A Real “Tool” for
Healthcare?
Memorial Hermann Lessons Learned
• So, Wisdom or Sinkholes? (A Summary)
– Engineer’s Cost Estimate – The Cost of Construction in
Heaven
– Low Bidder – A Contractor Who is Wondering What He Left Out
– Liquidated Damages – A Penalty for Failing to Achieve the Impossible
– Auditor – People who go in after the war is lost and bayonet the wounded
– Lawyer – People who go in after the Auditors and strip the bodies
(Humor or Reality?)
29
Opportunity/Reflections
• Utility Costs and ‘Breakeven on Medicare’ Focus – Hospitals consume 250% more energy than other building
types (ASHRAE)
– Noted that > 1 B GSF of Healthcare Real Estate in USA
– Some have stated that over $8 Billion/year in Healthcare Utility Expenditures
– Memorial Hermann has improved portfolio (Reduced waste ≈ 25%)
– Memorial Hermann has reduced utility expenditures ≈ $1.25/GSF (Consumption)
– Memorial Hermann has yet to capture all the low hanging fruit
Therefore, could there be greater than $1.3 Billion in wasted energy among our healthcare peers?
30
‘Bragging’ Page
• Seven Energy Star Hospitals
• Eight Energy Star Medical Office Buildings
• 33 ASHE E2C Awards (more to come?)
• Energy Star Leader 2012
• Energy Star Partner of the Year 2013
• Improved from ~30th to 64th Percentile Across the Portfolio
• We started at the 5th Percentile with One “New” Facility
• Our journey has just started…
• You Can Do it Also; TAHFM Texas Healthcare Energy Challenge – April 2013 (FREE)
31
32
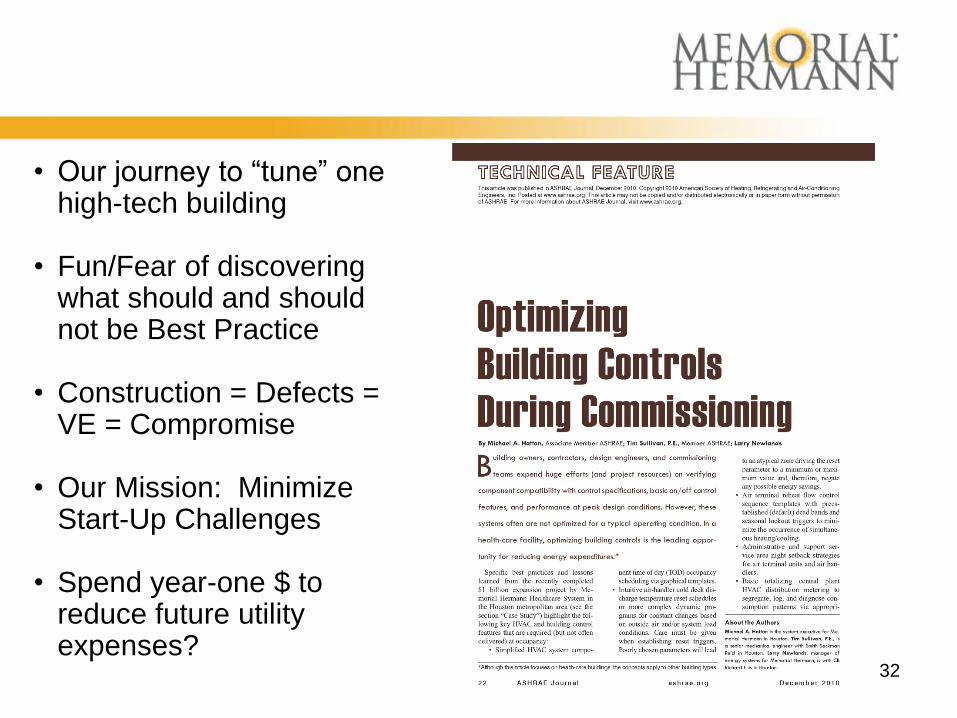
• Our journey to “tune” one high-tech building
• Fun/Fear of discovering what should and should not be Best Practice
• Construction = Defects = VE = Compromise
• Our Mission: Minimize Start-Up Challenges
• Spend year-one $ to reduce future utility expenses?

33


