40
MGMA Anesthesia Conference 2016 National Harbor, Maryland May 5-7, 2016 Benchmarking Performance Joe Laden Louisville, Kentucky AdvantEdge Healthcare Solutions (AHS) [email protected] 1
MGMA Anesthesia Conference 2016 National Harbor, Maryland
May 5-7, 2016
Benchmarking Performance
Joe LadenLouisville, Kentucky
AdvantEdge Healthcare Solutions (AHS)[email protected]
1
Benchmarking Performance
This session will provide you with the knowledge to:
• Discover the available resources for benchmarking anesthesiology
• Compare previous and present practice performance data, allowing for intelligent business decisions
2
• A standard of excellence, achievement, etc., against which similar things must be measured or judged
• Any standard or reference by which others can be measured or judged.
• A baseline or standard used to improve, set goals, and measure performance over time.
Benchmark Definition
3
Benchmarking is comparison of your practice’s performance on key measures to the performance of others.
Comparison can go beyond comparing to the average by defining objectives of excellence.
Benchmarking should involve a continuous comparison with benchmarks with the intent to improve, if necessary.
Benchmarking Definition
4
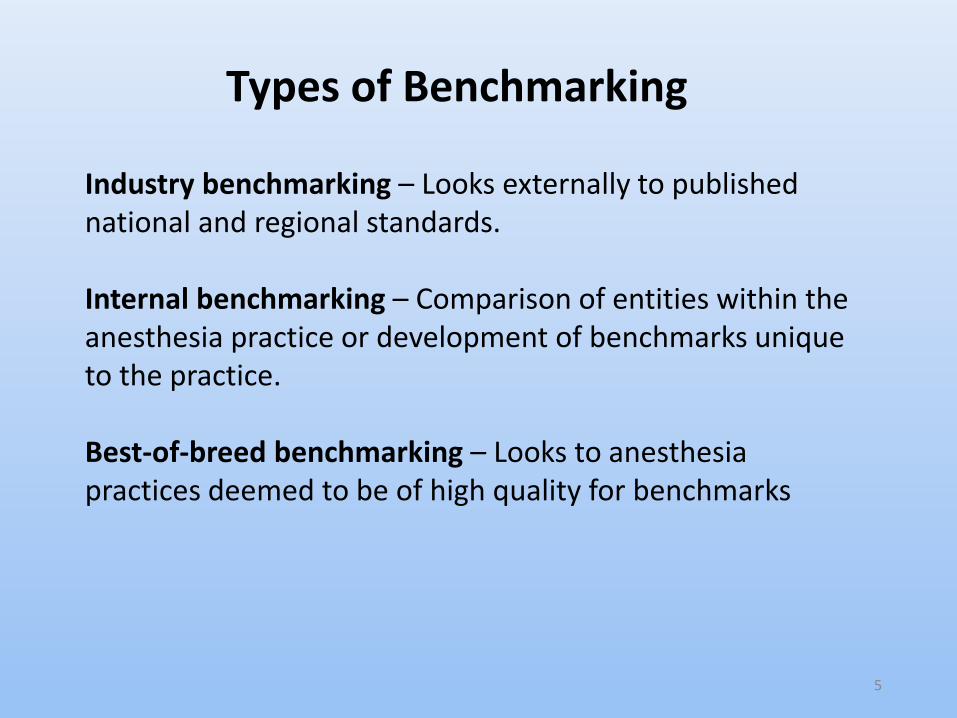
Industry benchmarking – Looks externally to published national and regional standards.
Internal benchmarking – Comparison of entities within the anesthesia practice or development of benchmarks unique to the practice.
Best-of-breed benchmarking – Looks to anesthesia practices deemed to be of high quality for benchmarks
Types of Benchmarking
5
6
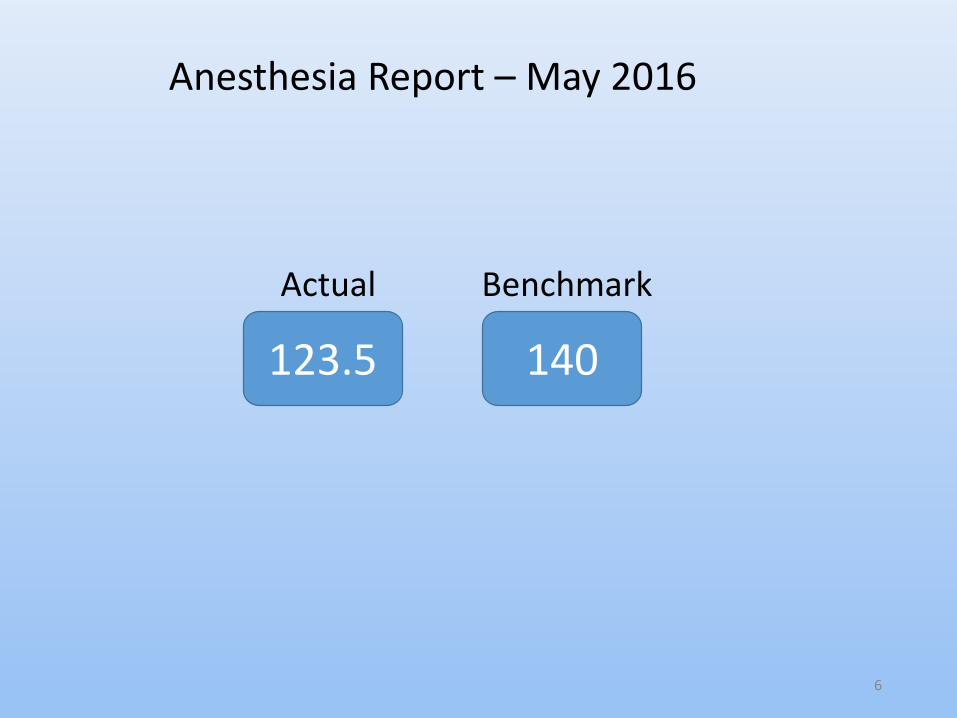
123.5
Actual
140
Benchmark
Anesthesia Report – May 2016
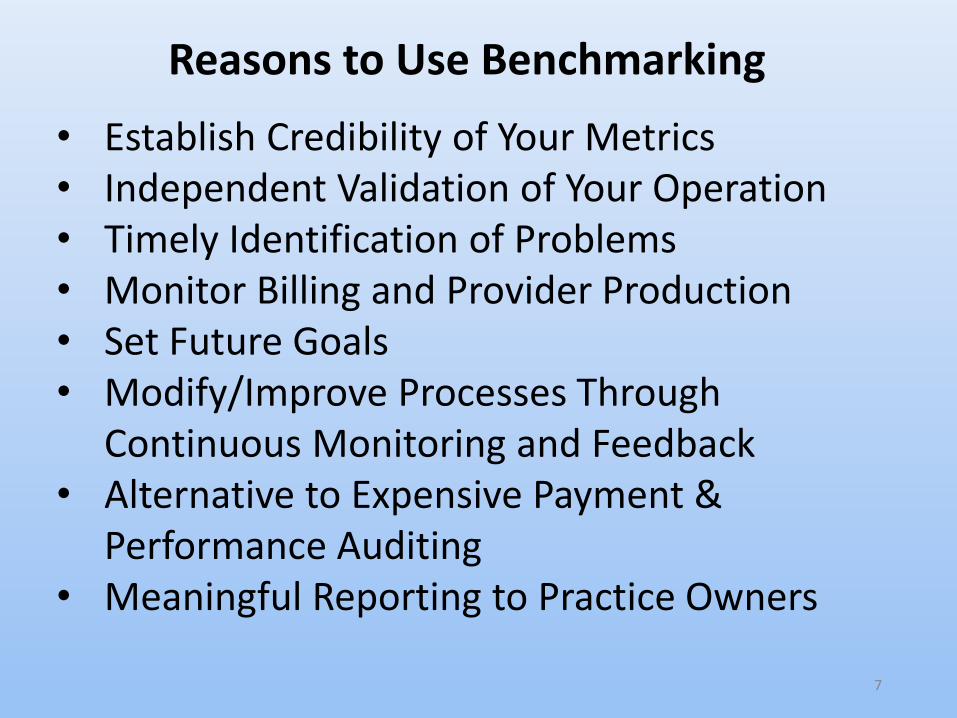
• Establish Credibility of Your Metrics• Independent Validation of Your Operation• Timely Identification of Problems• Monitor Billing and Provider Production• Set Future Goals• Modify/Improve Processes Through
Continuous Monitoring and Feedback• Alternative to Expensive Payment &
Performance Auditing• Meaningful Reporting to Practice Owners
Reasons to Use Benchmarking
7
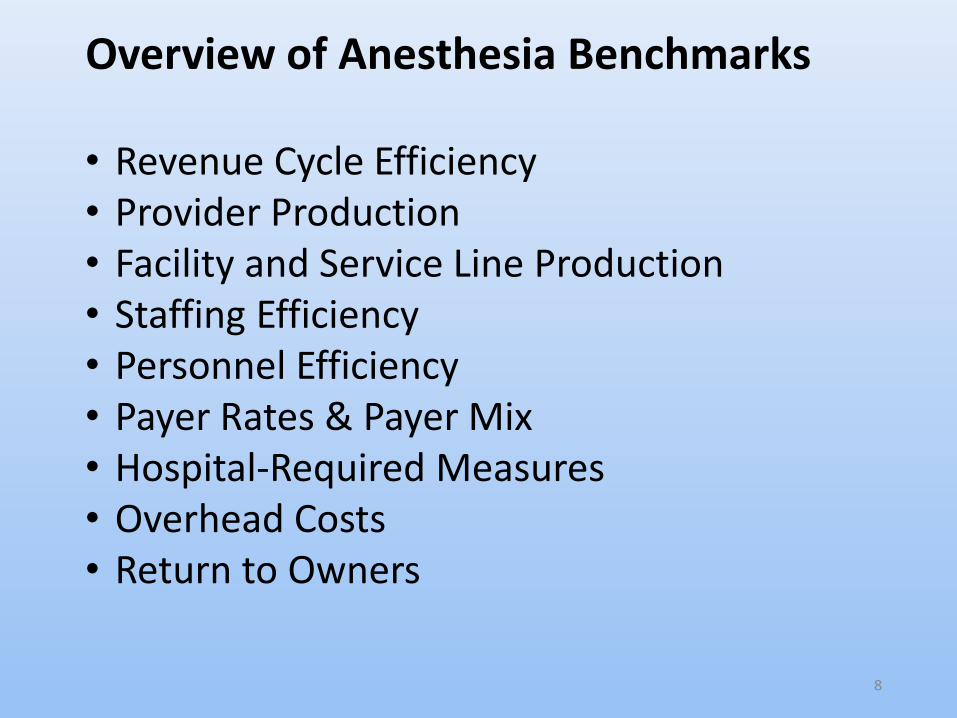
• Revenue Cycle Efficiency• Provider Production• Facility and Service Line Production• Staffing Efficiency • Personnel Efficiency• Payer Rates & Payer Mix• Hospital-Required Measures• Overhead Costs• Return to Owners
Overview of Anesthesia Benchmarks
8
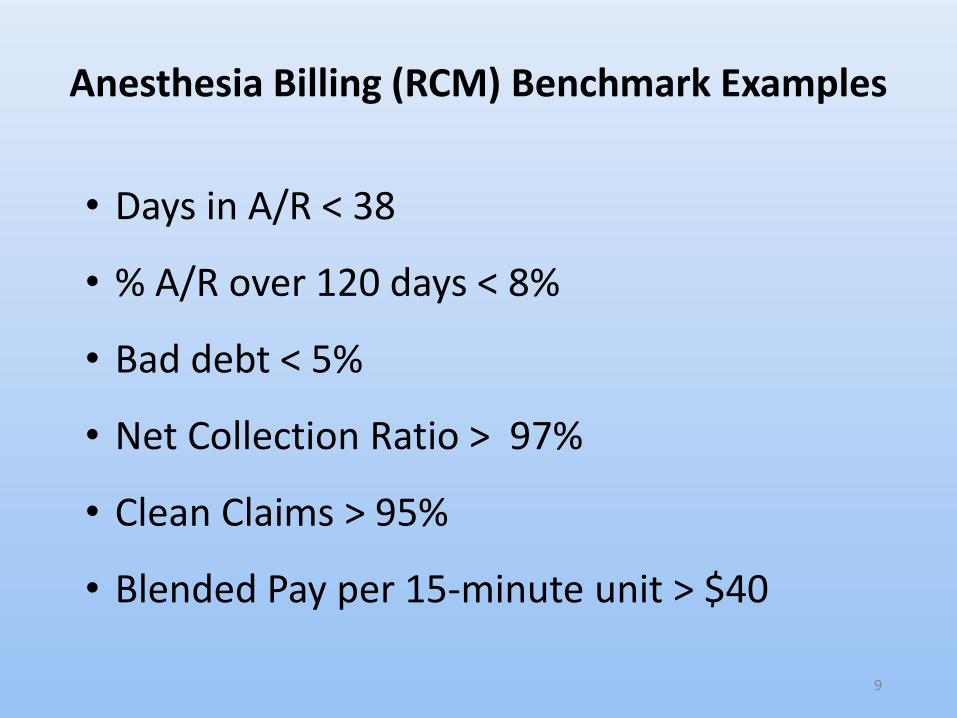
• Days in A/R < 38
• % A/R over 120 days < 8%
• Bad debt < 5%
• Net Collection Ratio > 97%
• Clean Claims > 95%
• Blended Pay per 15-minute unit > $40
Anesthesia Billing (RCM) Benchmark Examples
9

• Cases, Minutes, Units billed by provider and/or facility
• Hours worked per time period
• Percentage of overtime hours worked
• Net patient revenue per unit by facility
• Net patient revenue per unit by surgeon
• Hospital support per anesthetizing location
Anesthesia Provider/Facility Production Examples
10
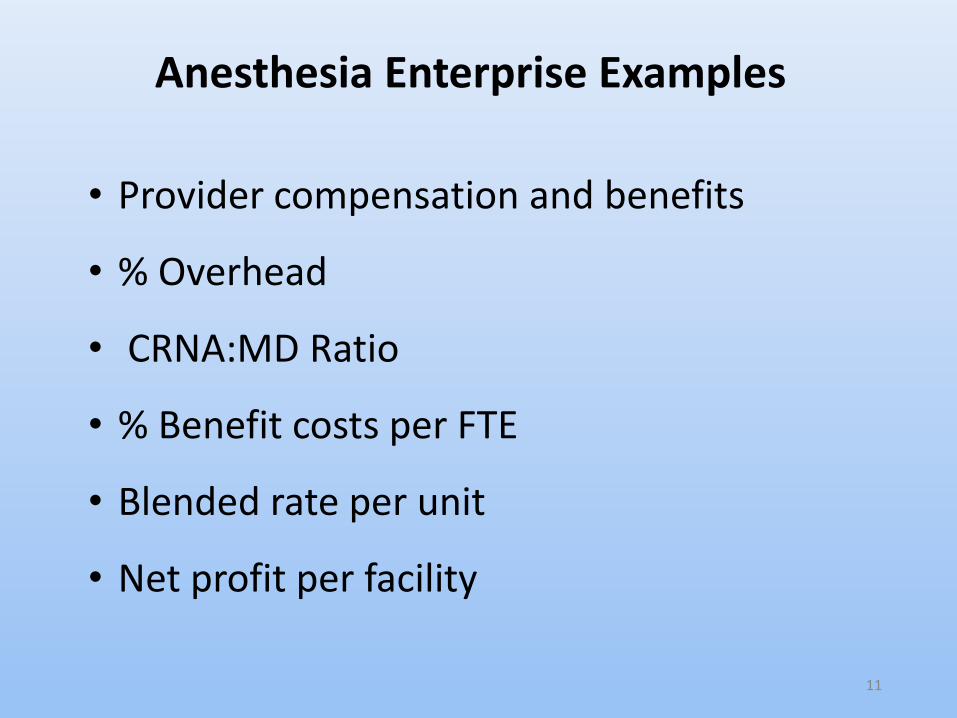
• Provider compensation and benefits
• % Overhead
• CRNA:MD Ratio
• % Benefit costs per FTE
• Blended rate per unit
• Net profit per facility
Anesthesia Enterprise Examples
11
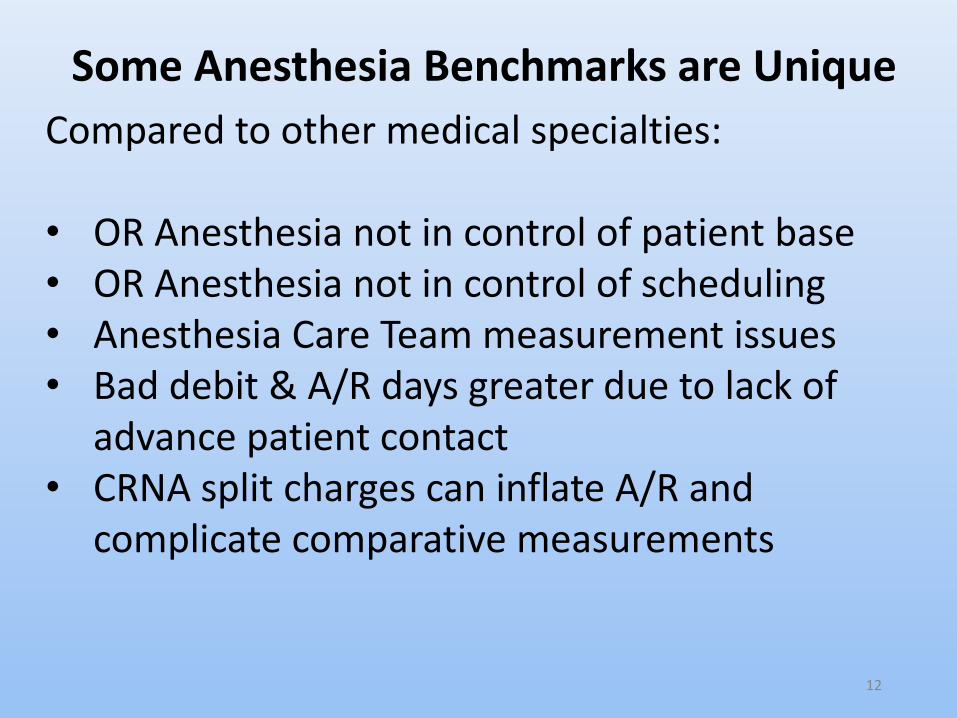
Compared to other medical specialties:
• OR Anesthesia not in control of patient base• OR Anesthesia not in control of scheduling• Anesthesia Care Team measurement issues• Bad debit & A/R days greater due to lack of
advance patient contact• CRNA split charges can inflate A/R and
complicate comparative measurements
Some Anesthesia Benchmarks are Unique
12
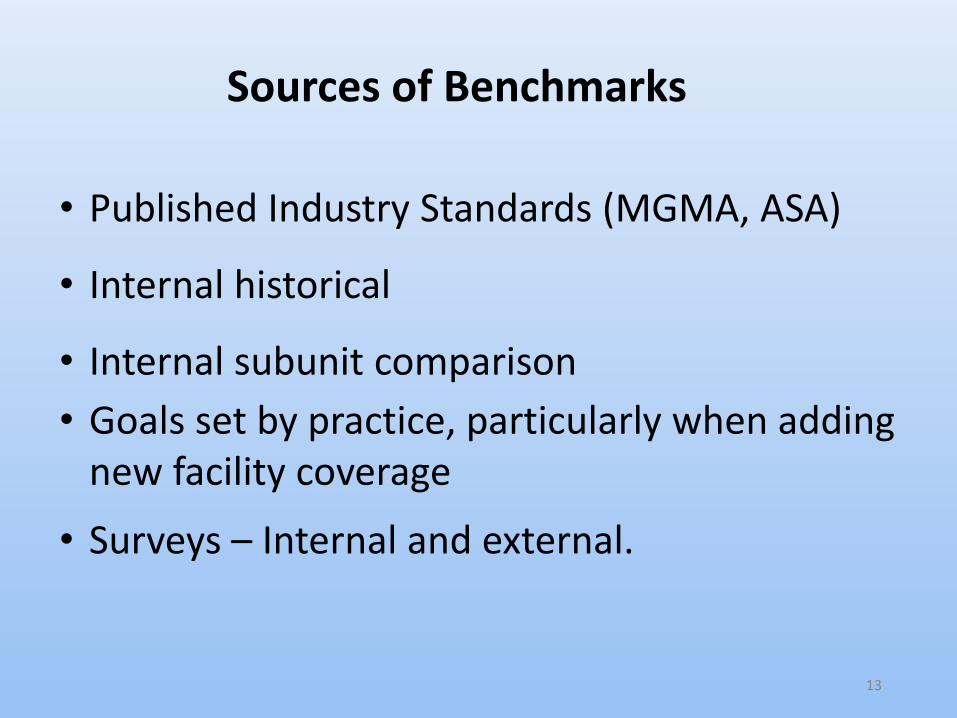
• Published Industry Standards (MGMA, ASA)
• Internal historical
• Internal subunit comparison
• Goals set by practice, particularly when adding new facility coverage
• Surveys – Internal and external.
Sources of Benchmarks
13
• MGMA➢ Cost Survey – Single Specialty➢ Cost Survey for Anesthesia & Pain➢ Above in print or MGMA Data Dive➢ MGMA Performance and Practices of
Successful Medical Groups• ASA Newsletters and website• Anesthesia Publications (eg. Anesthesiology)• Anesthesia Vendor Publications • Your Outsourced Vendor
Source of External Anesthesia Benchmarks
14
15
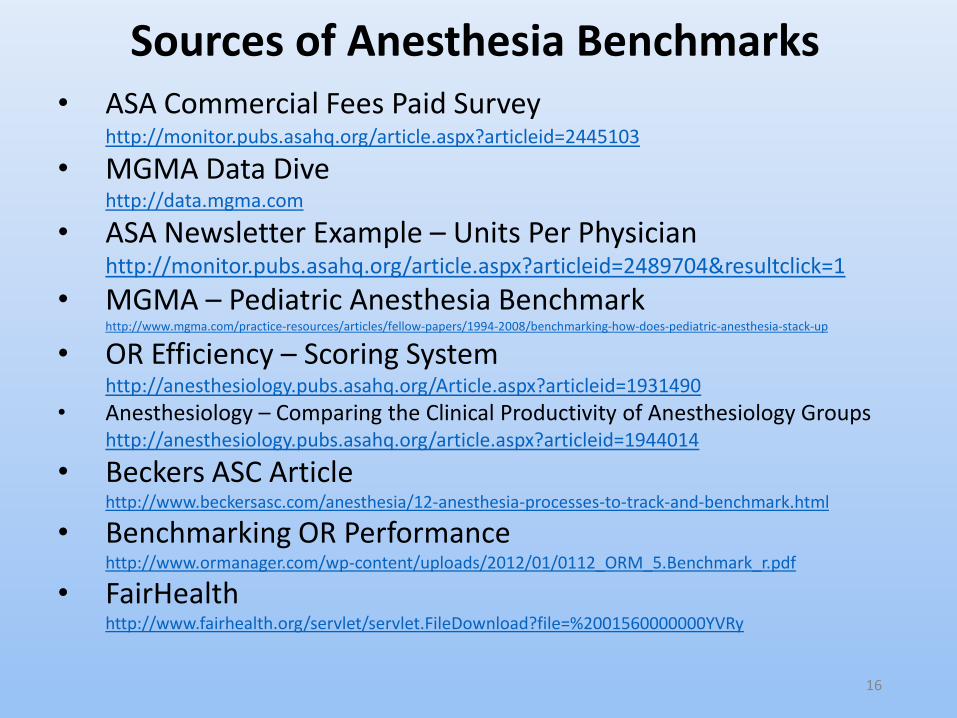
• ASA Commercial Fees Paid Surveyhttp://monitor.pubs.asahq.org/article.aspx?articleid=2445103
• MGMA Data Dive http://data.mgma.com
• ASA Newsletter Example – Units Per Physicianhttp://monitor.pubs.asahq.org/article.aspx?articleid=2489704&resultclick=1
• MGMA – Pediatric Anesthesia Benchmarkhttp://www.mgma.com/practice-resources/articles/fellow-papers/1994-2008/benchmarking-how-does-pediatric-anesthesia-stack-up
• OR Efficiency – Scoring Systemhttp://anesthesiology.pubs.asahq.org/Article.aspx?articleid=1931490
• Anesthesiology – Comparing the Clinical Productivity of Anesthesiology Groupshttp://anesthesiology.pubs.asahq.org/article.aspx?articleid=1944014
• Beckers ASC Articlehttp://www.beckersasc.com/anesthesia/12-anesthesia-processes-to-track-and-benchmark.html
• Benchmarking OR Performancehttp://www.ormanager.com/wp-content/uploads/2012/01/0112_ORM_5.Benchmark_r.pdf
• FairHealthhttp://www.fairhealth.org/servlet/servlet.FileDownload?file=%2001560000000YVRy
Sources of Anesthesia Benchmarks
16
• Surveys conducted by state or local anesthesia organizations
• Informally through colleagues
• MYOBM
Additional Sources of Anesthesia Benchmarks
17
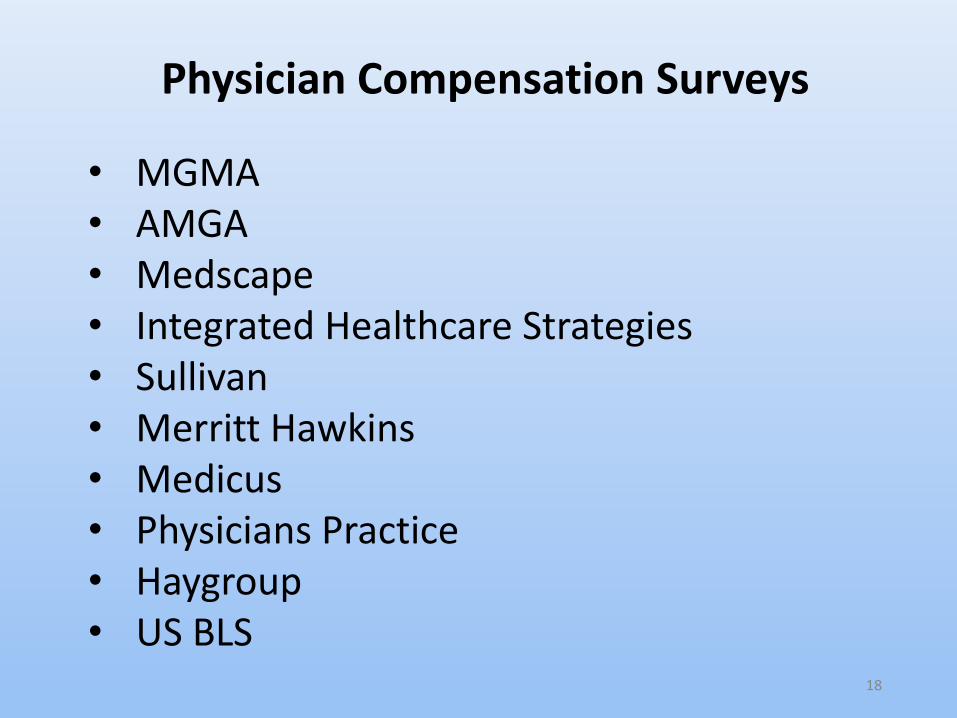
• MGMA• AMGA• Medscape• Integrated Healthcare Strategies • Sullivan• Merritt Hawkins• Medicus• Physicians Practice• Haygroup• US BLS
Physician Compensation Surveys
18
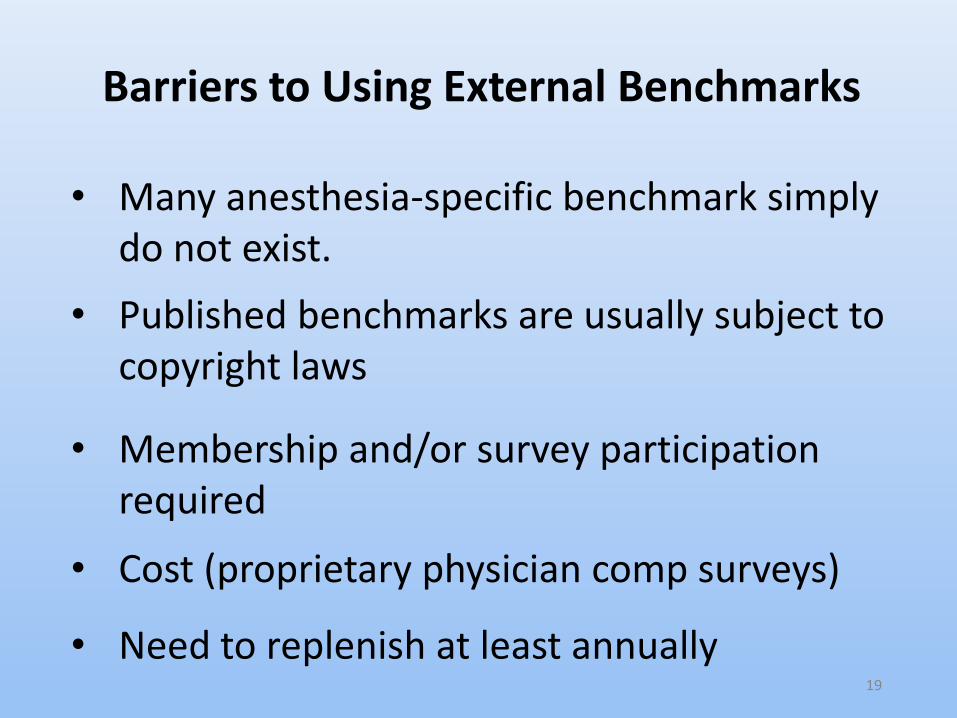
• Many anesthesia-specific benchmark simply do not exist.
• Published benchmarks are usually subject to copyright laws
• Membership and/or survey participation required
• Cost (proprietary physician comp surveys)
• Need to replenish at least annually
Barriers to Using External Benchmarks
19
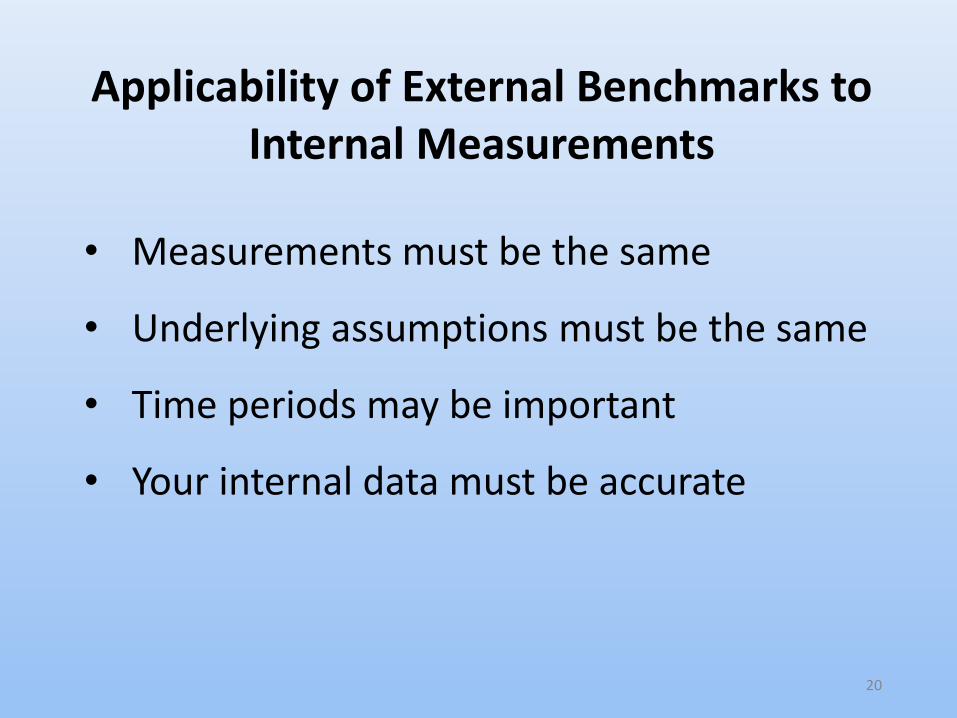
• Measurements must be the same
• Underlying assumptions must be the same
• Time periods may be important
• Your internal data must be accurate
Applicability of External Benchmarks to Internal Measurements
20
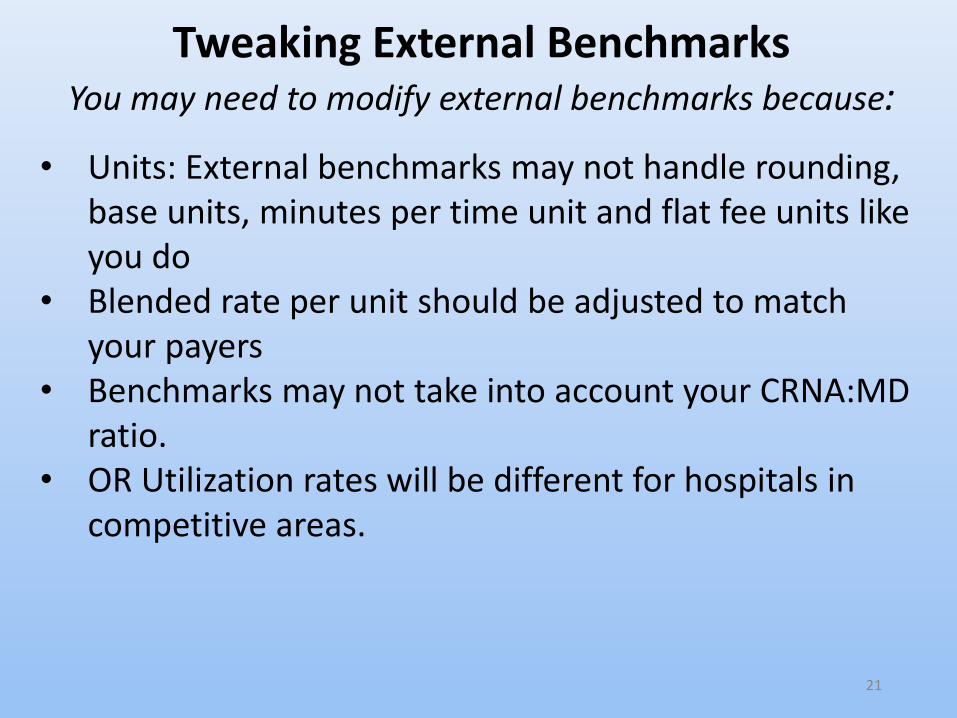
• Units: External benchmarks may not handle rounding, base units, minutes per time unit and flat fee units like you do
• Blended rate per unit should be adjusted to match your payers
• Benchmarks may not take into account your CRNA:MD ratio.
• OR Utilization rates will be different for hospitals in competitive areas.
Tweaking External BenchmarksYou may need to modify external benchmarks because:
21
• Billing reports are usually done by date of entry
• Delayed or accelerated transaction entry can alter benchmarked measures
• Payments should be reported by date of deposit to match financial & banking
• Provider and facility production reports mustbe done by date of service
Comparison Issue: DOS vs DOE vs DOD
22
Medical Direction Split Billing “Inflation”:
Some billing entities and PM software enter QK and QX charges in A/R at > 50% each (units
and minutes also “doubled”)
Introduces problem of benchmarking practices with “inflation” vs. practices w/o
Benchmarking CRNA/AA Billing Issue
23
• Many external benchmarks are too general to be applicable to a specific practice
• Which %ile or median or mean to use?
• Some benchmarks are useful only if reported by specific category such as payer, facility, provider type, type of service.
Benchmarking Issues to Resolve
24
• Pressures from Hospitals for Efficiency and Reporting. Eg. Stipends based on performance measures.
• CMS Value-Based Reporting - MACRA
• Increasing Need to Document Performance for Owners and Stakeholders
• Preparation for sale of practice
Why Benchmarking is More Important Now
25
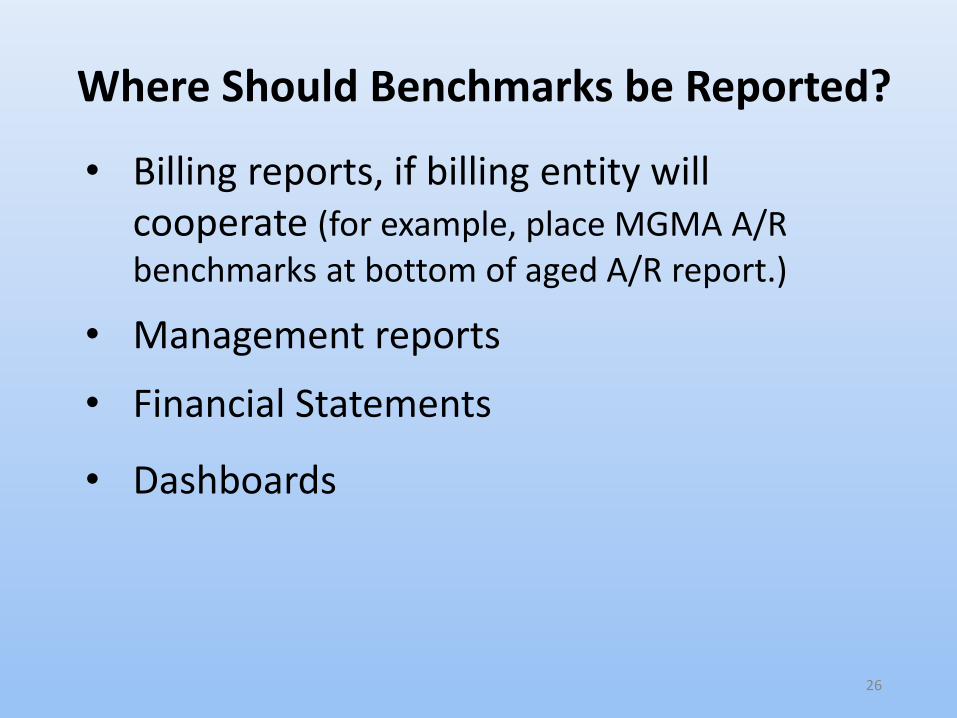
• Billing reports, if billing entity will cooperate (for example, place MGMA A/R benchmarks at bottom of aged A/R report.)
• Management reports
• Financial Statements
• Dashboards
Where Should Benchmarks be Reported?
26
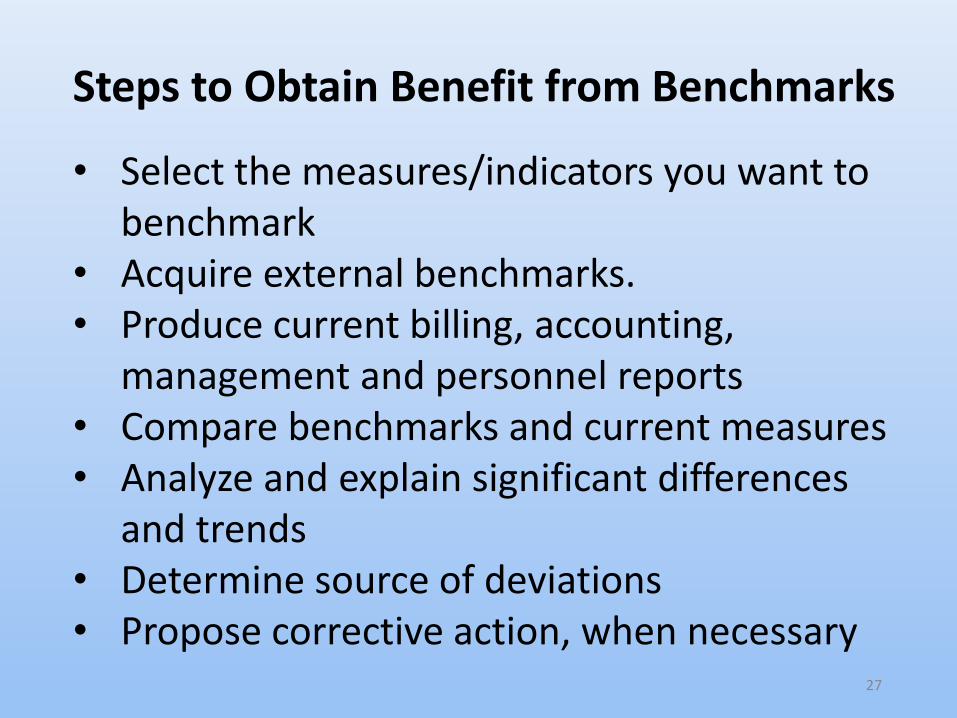
• Select the measures/indicators you want to benchmark
• Acquire external benchmarks. • Produce current billing, accounting,
management and personnel reports• Compare benchmarks and current measures• Analyze and explain significant differences
and trends• Determine source of deviations • Propose corrective action, when necessary
Steps to Obtain Benefit from Benchmarks
27
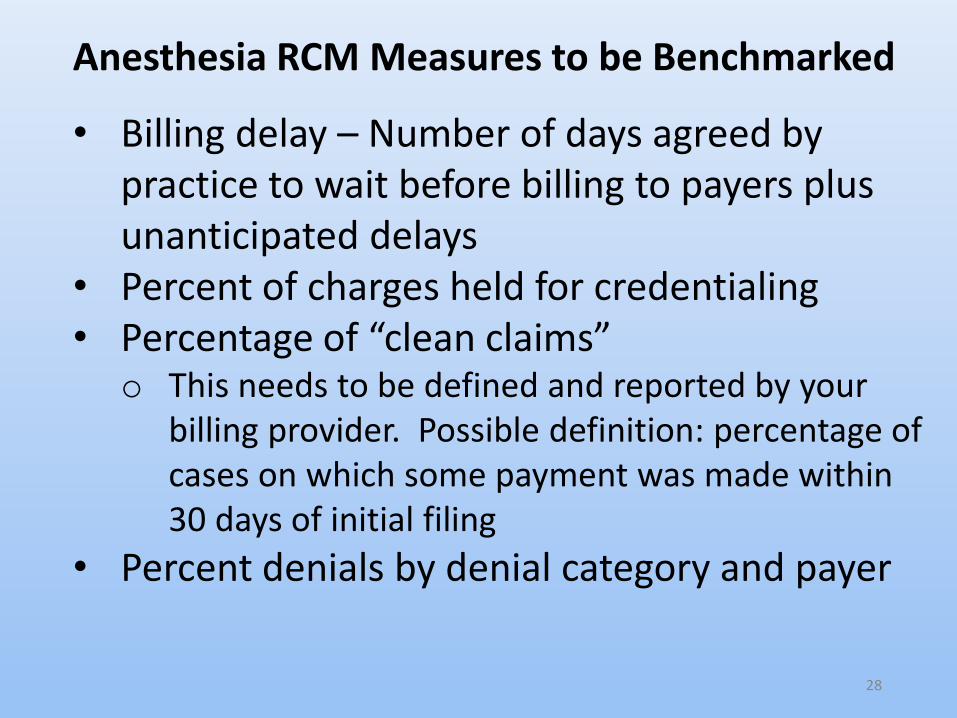
• Billing delay – Number of days agreed by practice to wait before billing to payers plus unanticipated delays
• Percent of charges held for credentialing• Percentage of “clean claims”
o This needs to be defined and reported by your billing provider. Possible definition: percentage of cases on which some payment was made within 30 days of initial filing
• Percent denials by denial category and payer
Anesthesia RCM Measures to be Benchmarked
28
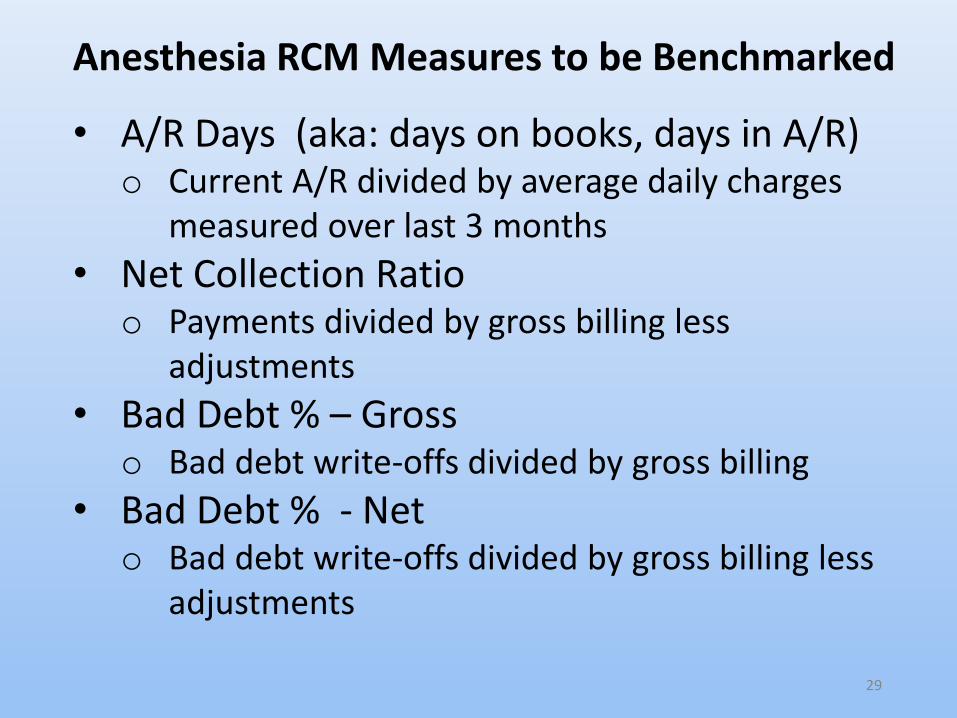
• A/R Days (aka: days on books, days in A/R)o Current A/R divided by average daily charges
measured over last 3 months
• Net Collection Ratioo Payments divided by gross billing less
adjustments
• Bad Debt % – Grosso Bad debt write-offs divided by gross billing
• Bad Debt % - Net o Bad debt write-offs divided by gross billing less
adjustments
Anesthesia RCM Measures to be Benchmarked
29
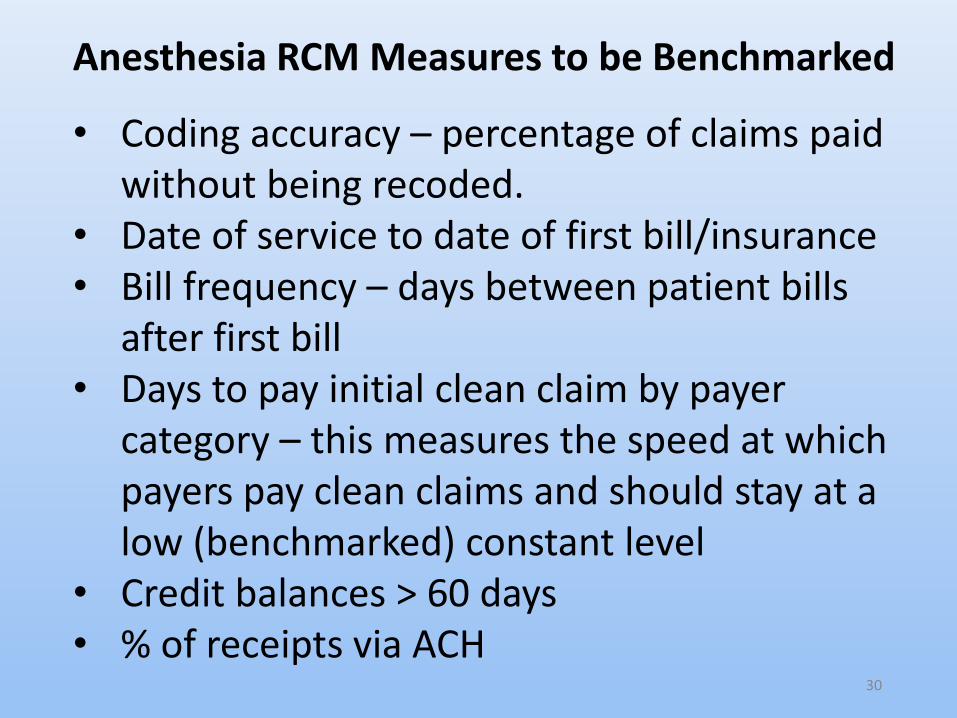
• Coding accuracy – percentage of claims paid without being recoded.
• Date of service to date of first bill/insurance • Bill frequency – days between patient bills
after first bill• Days to pay initial clean claim by payer
category – this measures the speed at which payers pay clean claims and should stay at a low (benchmarked) constant level
• Credit balances > 60 days• % of receipts via ACH
Anesthesia RCM Measures to be Benchmarked
30
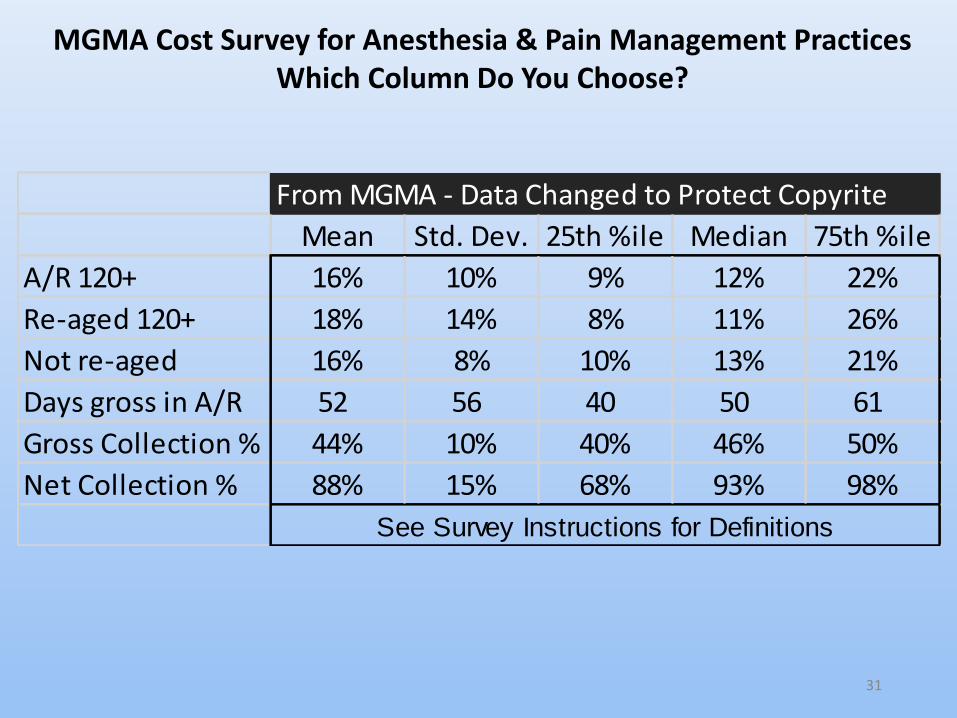
MGMA Cost Survey for Anesthesia & Pain Management PracticesWhich Column Do You Choose?
31
From MGMA - Data Changed to Protect Copyrite
Mean Std. Dev. 25th %ile Median 75th %ile
A/R 120+ 16% 10% 9% 12% 22%
Re-aged 120+ 18% 14% 8% 11% 26%
Not re-aged 16% 8% 10% 13% 21%
Days gross in A/R 52 56 40 50 61
Gross Collection % 44% 10% 40% 46% 50%
Net Collection % 88% 15% 68% 93% 98%
See Survey Instructions for Definitions
32
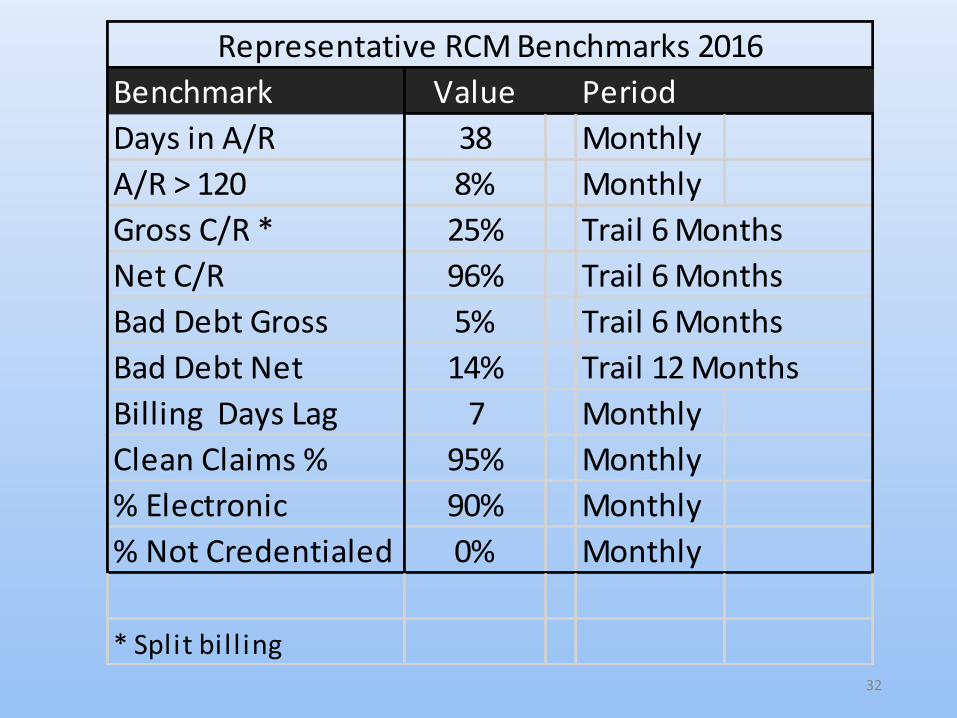
Benchmark Value Period
Days in A/R 38 Monthly
A/R > 120 8% Monthly
Gross C/R * 25% Trail 6 Months
Net C/R 96% Trail 6 Months
Bad Debt Gross 5% Trail 6 Months
Bad Debt Net 14% Trail 12 Months
Billing Days Lag 7 Monthly
Clean Claims % 95% Monthly
% Electronic 90% Monthly
% Not Credentialed 0% Monthly
* Split bil l ing
Representative RCM Benchmarks 2016
Current
Actual %
Charges
Days
in
A/R
A/R >
120
Gross
C/R *
Net
C/R
Bad
Debt
Gros
Bad
Debt
Net
Bill
Days
Lag
Clean
Claims
%
%
Elect.
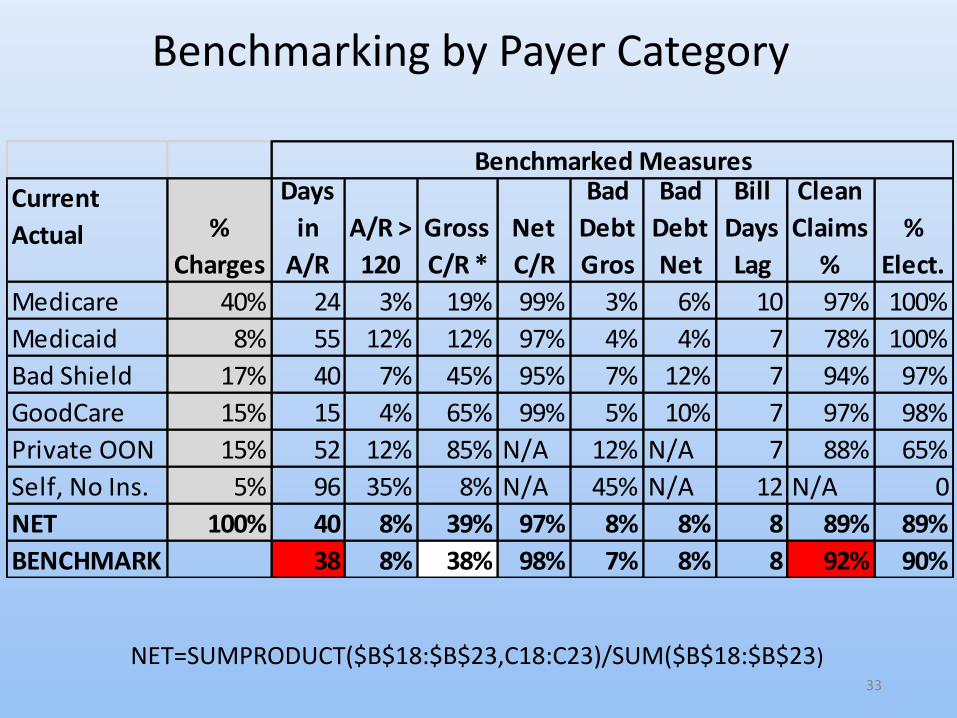
Medicare 40% 24 3% 19% 99% 3% 6% 10 97% 100%
Medicaid 8% 55 12% 12% 97% 4% 4% 7 78% 100%
Bad Shield 17% 40 7% 45% 95% 7% 12% 7 94% 97%
GoodCare 15% 15 4% 65% 99% 5% 10% 7 97% 98%
Private OON 15% 52 12% 85% N/A 12% N/A 7 88% 65%
Self, No Ins. 5% 96 35% 8% N/A 45% N/A 12 N/A 0
NET 100% 40 8% 39% 97% 8% 8% 8 89% 89%
BENCHMARK 38 8% 38% 98% 7% 8% 8 92% 90%
Benchmarked Measures
Benchmarking by Payer Category
NET=SUMPRODUCT($B$18:$B$23,C18:C23)/SUM($B$18:$B$23)33
34
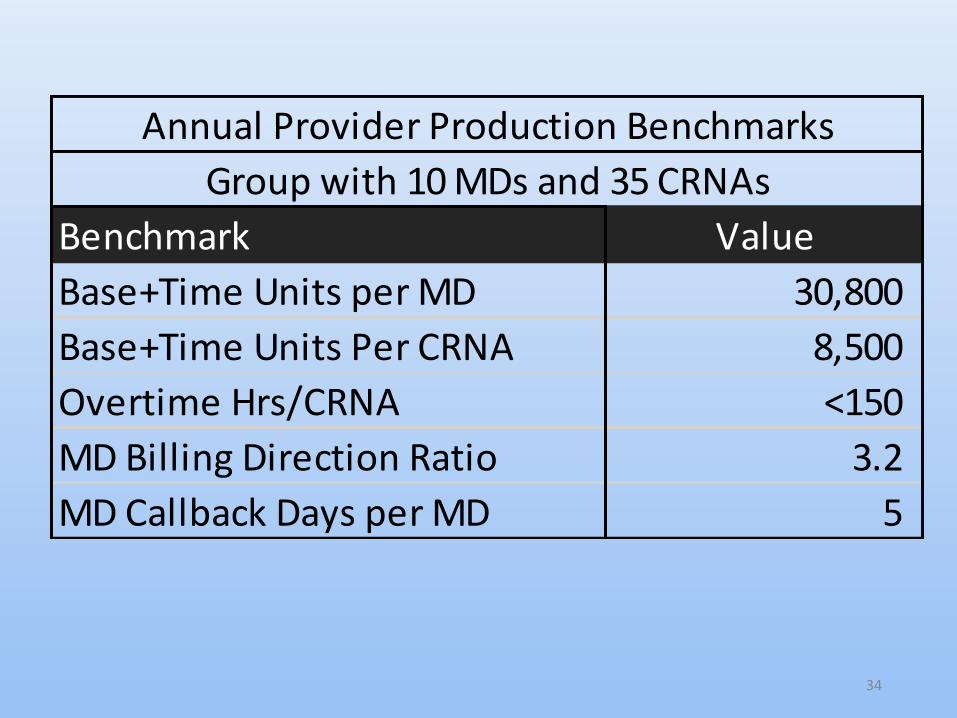
Benchmark Value
Base+Time Units per MD 30,800
Base+Time Units Per CRNA 8,500
Overtime Hrs/CRNA <150
MD Billing Direction Ratio 3.2
MD Callback Days per MD 5
Annual Provider Production Benchmarks
Group with 10 MDs and 35 CRNAs
35
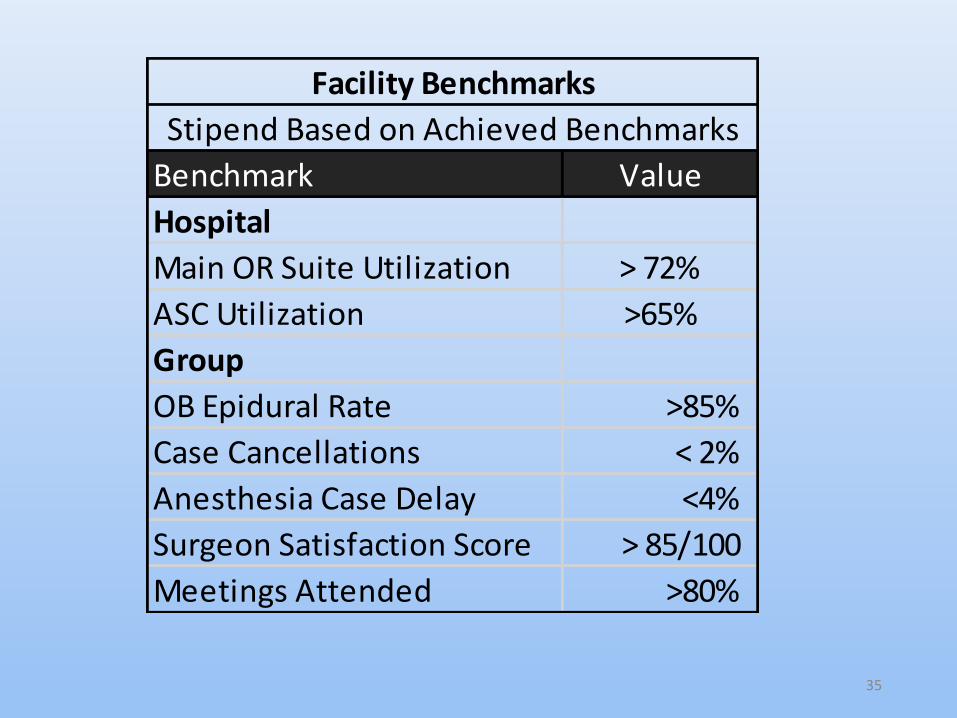
Benchmark Value
Hospital
Main OR Suite Utilization > 72%
ASC Utilization >65%
Group
OB Epidural Rate >85%
Case Cancellations < 2%
Anesthesia Case Delay <4%
Surgeon Satisfaction Score > 85/100
Meetings Attended >80%
Facility Benchmarks
Stipend Based on Achieved Benchmarks
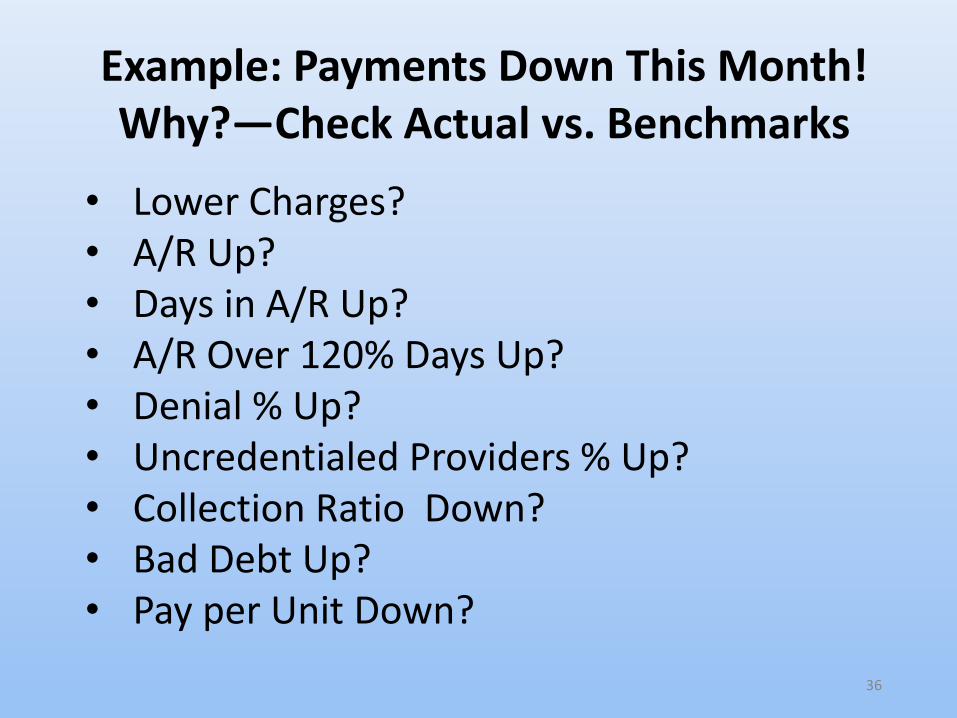
• Lower Charges?• A/R Up?• Days in A/R Up?• A/R Over 120% Days Up?• Denial % Up?• Uncredentialed Providers % Up?• Collection Ratio Down?• Bad Debt Up?• Pay per Unit Down?
Example: Payments Down This Month!Why?—Check Actual vs. Benchmarks
36
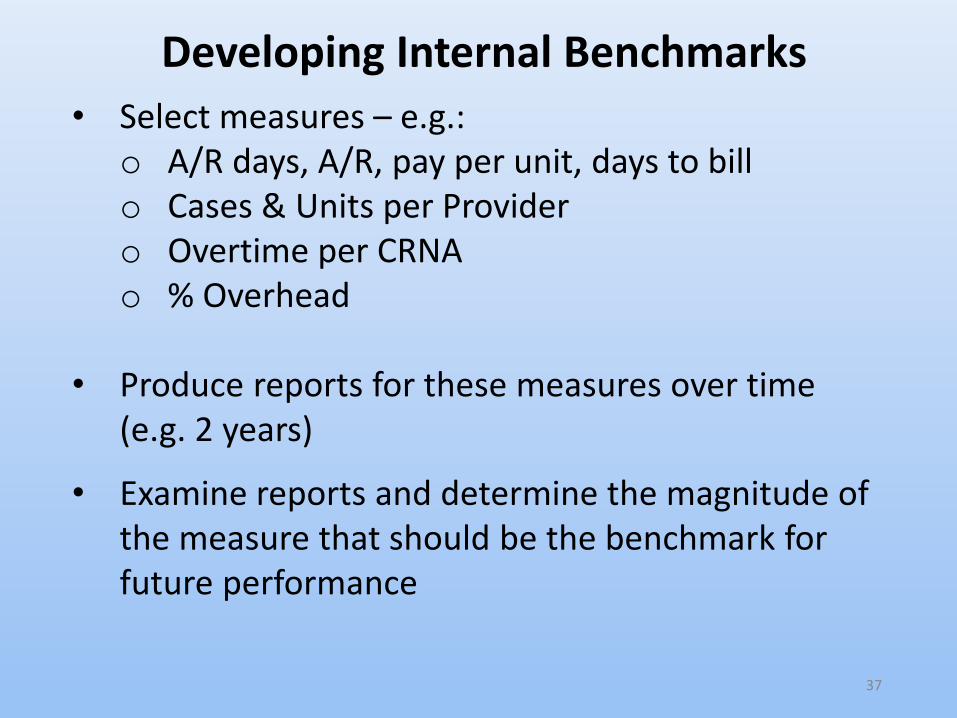
• Select measures – e.g.:o A/R days, A/R, pay per unit, days to billo Cases & Units per Providero Overtime per CRNAo % Overhead
• Produce reports for these measures over time (e.g. 2 years)
• Examine reports and determine the magnitude of the measure that should be the benchmark for future performance
Developing Internal Benchmarks
37
38
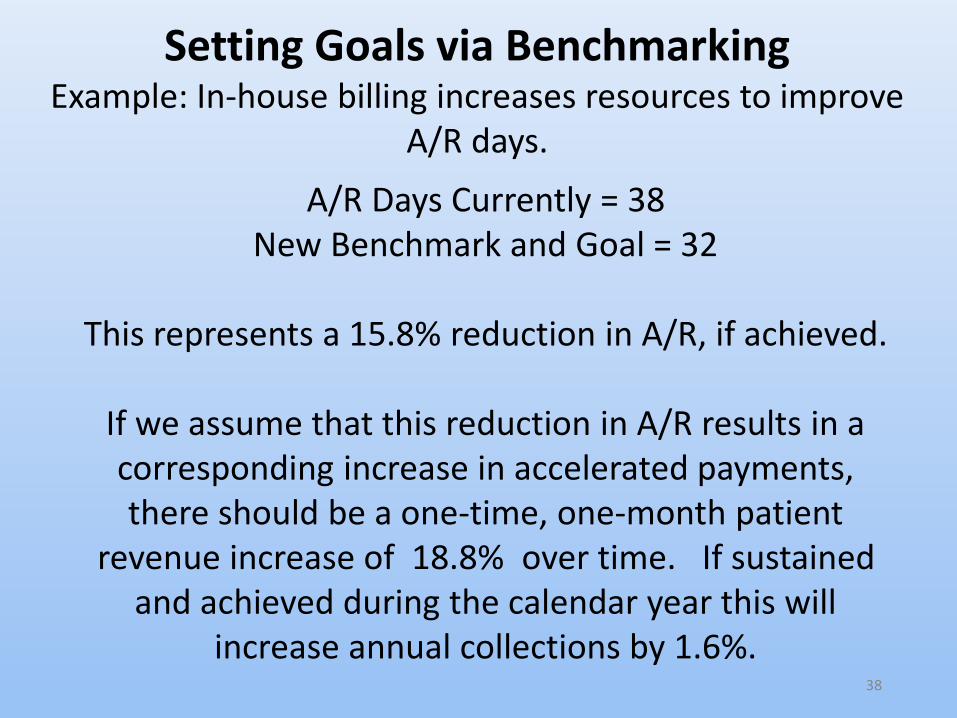
Setting Goals via BenchmarkingExample: In-house billing increases resources to improve
A/R days.
A/R Days Currently = 38 New Benchmark and Goal = 32
This represents a 15.8% reduction in A/R, if achieved.
If we assume that this reduction in A/R results in a corresponding increase in accelerated payments, there should be a one-time, one-month patient
revenue increase of 18.8% over time. If sustained and achieved during the calendar year this will
increase annual collections by 1.6%.
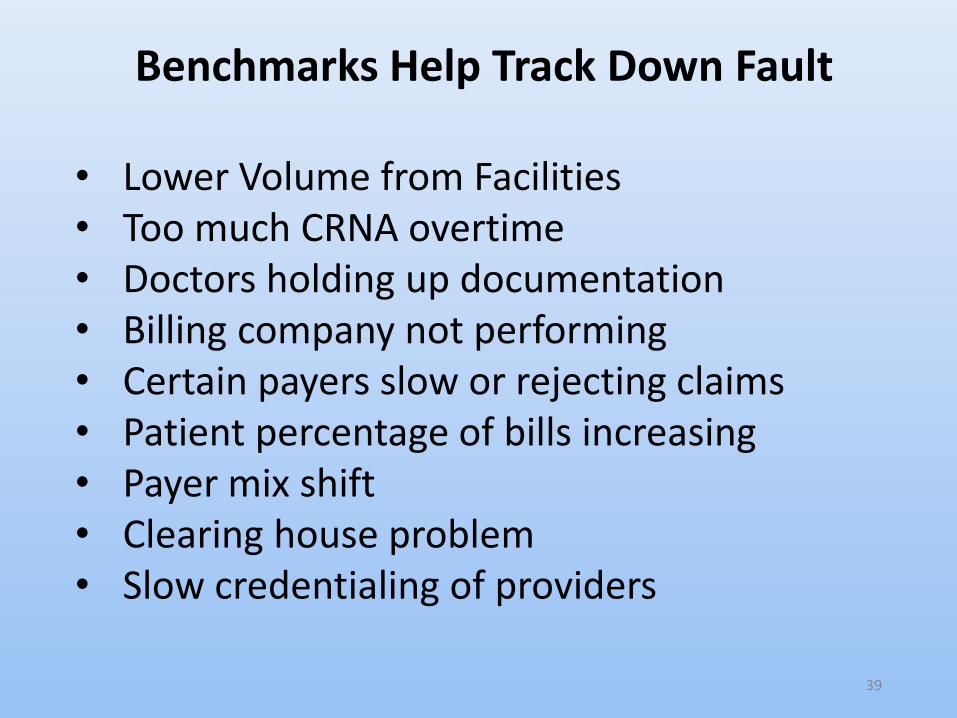
• Lower Volume from Facilities• Too much CRNA overtime• Doctors holding up documentation• Billing company not performing• Certain payers slow or rejecting claims• Patient percentage of bills increasing• Payer mix shift • Clearing house problem• Slow credentialing of providers
Benchmarks Help Track Down Fault
39

Questions, Comments?
Contact: [email protected]
Thank you and don’t forget to complete your evaluation form.
40


