47
Benchmarking refuse collection APRIL 2000 PUBLISHED BY AUDIT SCOTLAND A review of councils’ refuse collection services

Benchmarking refuse collection
APRIL 2000PUBLISHED BY AUDIT SCOTLAND
A review of councils’ refuse collection services
The Accounts Commission
The Accounts Commission is a statutory, independent body, which, through the audit
process, assists local authorities in Scotland to achieve the highest standards of financial
stewardship and the economic, efficient and effective use of their resources. The
Commission has five main responsibilities:
• securing the external audit
• following up issues of concern identified through the audit, to ensure satisfactory
resolutions
• reviewing the management arrangements which audited bodies have in place to
achieve value for money
• carrying out national value for money studies to improve economy, efficiency and
effectiveness in local government
• issuing an annual direction to local authorities which sets out the range of
performance information which they are required to publish.
The Commission secures the audit of 32 councils and 34 joint boards (including police
and fire services). Local authorities spend over £9 billion of public funds a year.
Audit Scotland
Audit Scotland is a statutory body set up in April 2000, under the Public Finance and
Accountability (Scotland) Act 2000. It provides services to the Accounts Commission and
the Auditor General for Scotland. Together they ensure that the Scottish Executive and
public sector bodies in Scotland are held to account for the proper, efficient and
effective use of around £16 billion of public funds.
This report is published by Audit Scotland on behalf of the Accounts Commission.
Comments and queries should be addressed to John Lincoln or Martin Christie.
CONTENTS
INTRODUCTION 3
THE REFUSE COLLECTION SERVICE 6
BENCHMARKING REFUSE COLLECTION SERVICES 11
MONITORING AND REVIEWING SERVICE PERFORMANCE 23
STUDY RECOMMENDATIONS AND KEY CHALLENGES FOR THE FUTURE 28
APPENDICES 34
ACKNOWLEDGEMENTS
We would like to thank the study’s Advisory Group, comprising a range of experts from
councils and other bodies. The Group provided valuable advice and acted as a useful
sounding board for the study team. See Appendix 1 for membership of the Group.
The Accounts Commission takes sole responsibility for the contents of this report.
Benchmarking refuse collection
Summary
In conducting this study, the Commission wishes to assist councils to achieveBest Value in their refuse collection services. It has provided all councils inScotland with operational and financial benchmarking information. Councilsare expected to use this information to challenge their current levels ofperformance and take action to achieve the standards of the best.
The Commission last reviewed the refuse collection service in 1990.Since then, there have been substantial productivity improvementsn The gross cost of refuse collection has risen from £90 million in 1990 to
£98 million in 1998/99, a 9% increase, which is less than the rate of inflation.n Over the same period, the tonnage of refuse collected by councils increased by
14%, the number of refuse collection employees fell by 44% from 4,800 to2,700, and the number of vehicles employed fell by 25%.
The cost of collecting household and commercial refuse variesamong councilsn In most councils, the average cost of collecting household and commercial
refuse ranges from £30-£40 per property per year, which is broadly similar tocouncils in England and Wales.
n The cost of collecting refuse in rural councils is higher because they are moresparsely populated.
n The average cost to councils of separately uplifting bulky items of wasteranges from £5-£15 per uplift. Twelve councils cover some of their costs bycharging for this service.
Councils need to know the real cost of providing refuse collectionservices, in order to set appropriate charges and make informedpolicy decisions about levels of service and allocation of resourcesto support individual collection servicesn Over three-quarters of councils do not maintain separate trading accounts
for commercial refuse services.n Councils should aim to recover all of their costs of collecting and disposing of
commercial refuse through charging. However, based on available study data,it is estimated that, across Scotland, councils may be subsidising theircommercial collection services by as much as £9.7 million a year.
n Most councils need to develop activity costing systems to enable them toknow the real cost of providing individual refuse collection services.
n Councils should take steps to reduce the avoidance of charges for collectingcommercial refuse.
n Councils should review their charging policies for chargeable collectionservices.
1
Benchmarking refuse collection
Councils need to ensure that resources are used efficiently andeffectively by improving performance monitoring and reviewn Examples of areas where the study has identified scope for efficiency
improvements include:_ management of sickness absence and bonus schemes_ management of vehicle replacement programmes, including the number of
reserve vehicles_ continuous review of the efficiency of refuse collection routes.
n Refuse collection managers need to further develop their use of performanceinformation to monitor and review service performance.
Councils face significant challenges in meeting environmentaltargetsn In 1998/99, the overall level of waste recycled by Scottish councils was 3.8%,
well below the government’s year 2000 target of 25%.n Councils that invest in separate collections of material for recycling, eg, paper,
tend to have higher recycling levels.n Because of falls in the market price of recyclable materials, a number of
councils have withdrawn or are considering withdrawing separate collections.n If councils are to meet government recycling and landfill targets, as set out in
the Nat ional Waste Strategy, they will have to g ive waste management a higherpriority. This wil l involve developing an effective waste management strategy,in partnership with other councils and agencies, and allocating sufficientfunding to support expensive, but environmentally desirable, collection andrecycling activities.
n The Scottish Executive has a strategic role to play and should consider how itcan assist councils to meet recycling and landfill reduction targets.
External auditors will be challenging councils to use thebenchmarking information supplied to identify areas forimprovement and take action to improve performancen All councils are expected to prepare action plans to make performance
improvements.n Auditors wil l be reviewing the implementation of these plans.
2

Benchmarking refuse collection
Introduction
3
Why look at the refuse collection service?Refuse collection is a highly visible service. It is unique in being provided to allhomes, usually on a weekly basis. It is a valued service; 31% of the members ofthe People’s Panel1 in Scotland ranked refuse collection among their five mostimportant public services, higher than the police (27%) or the fire andemergency services (23%). Only GP services (46%) and NHS hospitals (38%)were ranked as more important.
The Commission last reviewed councils’ refuse collection services in 1990. Sincethen there have been a number of changes in the external environment in whichthe refuse collection service operates. This study looks at how councils haveresponded, or will need to respond, to these changes.
n Local government reorganisation: As a result of local governmentreorganisation, the number of refuse collection authorities has reduced from56 to 32. The aggregation of former district councils into the new unitarycouncils presented challenges and opportunities for refuse collectionmanagers. Challenges included, for example, the need to harmonise differentemployee conditions of service, levels of collection charges, refuse collectioncontracts and vehicle types. However, significant opportunit ies for serviceimprovements arose from reorganisation. These included the opportunity toachieve economies of scale by reducing the number of depots and vehiclesrequired, and to review the efficiency of routes by reconfiguring them tooptimise productivity. This study provides councils with detailed informationto assist them in their review of refuse collection routes.
n Introduction of Best Value: All councils in Scotland undertake refuse collectionservices, having won these contracts in competition with the private sector. In1997 the government suspended the Compulsory Competitive Tendering(CCT) regime and introduced Best Value. This has resulted in some refusecollection services not being subject to market testing for seven years. BestValue has an emphasis on customer focus, delivering services to the standardsthat customers expect and need whilst achieving value for money. This studyprovides councils with information to support their Best Value reviews.
n Environmental targets: Since the Rio Earth Summit in June 1992, there hasbeen a government target which states that, by 2000, councils should recycle25% of household waste. A landfill tax has been introduced to discourage thedisposal of waste in landfill sites. The landfill tax rate was increased from£7 per tonne to £10 per tonne from April 1999, and will rise by £1 each yearuntil at least 2004.
1 In 1998 the Cabinet Office commissioned MORI and the School of Public Policy at BirminghamUniversity to set up the People’s Panel as part of a wider programme to moder nise government andmake it more responsive to users.

Benchmarking refuse collection4
In addition, the Landfill Directive2 requires a reduction in biodegradablemunicipal (household) waste taken to landfill sites. In response to this Directive,the Scott ish Environment Protection Agency (SEPA) has published a NationalWaste Strategy for Scotland, which has been adopted by the Scottish Executive.At the heart of this strategy is the proposal that area waste plans should beproduced by groups of councils working with enterprise agencies inconsultat ion with waste producers and the waste industry. This study providesbaseline information on refuse collection services to support the production ofarea waste plans.
Study objectivesIn conducting this study, the Commission wishes to help councils to achieveBest Value by assisting them to benchmark their refuse collection services usingvalidated information. Access to information on the cost and performancelevels achieved by other councils is essential to reviewing services. Thisinformation prompts councils to challenge their own practices and to review theimpact of changes. The Accounts Commission’s publication, ‘Measuring up tothe best, A manager’s guide to benchmarking’, provides guidance in this area.
This study provides benchmarking information on councils’ refuse collectionservices at both a national and local level. It provides baseline data on currentpractice and the performance of each council’s refuse collection service. Whilethis report is principally concerned with refuse collection services, it recognisesthe impact of refuse collection on other aspects of waste management, inparticular, refuse disposal and recycling activities. The information collectedduring this study will support councils in:n challenging their current levels of performancen introducing service improvementsn reducing costs, where possiblen reviewing charging policiesn conducting their Best Value service reviews and allowing them to compare
their performance on a like-for-like basis with other councils, andn formulating area waste plans in response to the Nat ional Waste Directives.
An additional objective of the study is to encourage all council refuse collectionmanagers to agree a standard set of key operational indicators and use these tomonitor the performance of their services over time.
About the studyThe study involved an extensive data-gathering exercise covering all aspects ofthe refuse collection service, including:n refuse collection costs and incomen analysis of resource inputs (eg, employees and vehicles) and outputs
(eg, tonnage collected and properties served)n analysis of refuse collection route performance, including establishing
performance benchmarks for different types of refuse collection routesn service quality issues, such as the number of complaintsn arrangements for performance monitoring and review.
The study was conducted in collaboration with the Association for PublicService Excellence (APSE) Scottish Region (formerly known as ADLO) and hasreceived excellent support from refuse collection managers in all 32 councils.They have been helpful in providing the prescribed service data and ensuring
2 Council Directive 1999/31/EC on the landfill of waste (better known as the Landfill Directive).

Benchmarking refuse collection 5
that the data provided reflects the actual performance of their councils. Thedata was collected during the spring of 1999 and relates to the financial year1998/99.
The study has two main outputs. In addition to this report, the study team hasalready provided councils and auditors with benchmarking software containingthe performance indicators derived from the study data. The performanceinformation is contained in two separate modules. The first includes over100 indicators covering all aspects of the refuse collection service; the secondprovides comparative performance information for over 500 refuse collectionroutes. A full list of these indicators is included in Appendix 2.
To facilitate comparison, councils were arranged into comparable familygroups. This means that councils can compare their performance on a like-for-like basis. The refuse collection route information was also analysed using afamily group approach. Details of the methodology used to create these groupsare included in Appendix 3.
Councils are expected to use this information to identify areas whereperformance can be improved and to prepare action plans to implementchanges. External auditors will be reviewing the implementation of these plans.
Structure of the reportThis report is in five sections. After this section:
Section two describes the operation of the refuse collection service and the scaleof the service in terms of total tonnage managed. It also looks at the overallcosts of providing the service, the level of income generated and the use oftrading accounts and activity costing.
Section three identifies the main changes in productivity since 1990 andprovides financial and operational benchmarking information on thecomponents of the refuse collection service including: mainstream refusecollection (including income for commercial refuse collection), special upliftservices and separate collection of materials for recycling. It then goes on toexamine service quality issues.
Section four examines councils’ arrangements for monitoring and reviewingservice performance, looking at the key employee and vehicle managementissues that councils should address to improve current performance.
Section five looks at the important challenges facing the refuse collection service.It makes recommendations on specific areas where further serviceimprovements could be made by most councils. It then suggests ways in whichcouncils could respond to the challenge of meeting government environmentaltargets.

Benchmarking refuse collection
Exhibit 1: Principal components of refuse collection
Note: The potential exists for mainstream refuse to be taken to a material recycling facility. However, at the time of thestudy this process was not widely used.
Mainstream refusecollection
(domestic andtrade waste)
Special and bulky uplifts,eg, white goods and large
quantities of waste
Separate collection ofrecyclable materials,
eg, paper, glass, metal,garden refuse
Material recycling facility
Landfill siteor
incineration plant
Transfer-loading station
The refuse collection service
6
The core refuse collection activity undertaken by all councils is the routinecollection of domestic and commercial refuse (referred to in this report asmainstream refuse collection). For most domestic properties, the collectionfrequency is weekly, but for some (eg, multi-storey properties) it may be up tothree times per week. For most commercial properties the collection frequencyis higher, usually two to three times per week, with some properties receiving adaily service.
A typical mainstream refuse collection route involves a vehicle and its crewtravelling from their base depot to the first collection point, uplifting refusealong the collection route, taking the collected refuse to an initial disposal point(eg, a transfer-loading station (TLS)3 or material recycling facility (MRF)3) or alandfill site, returning to the collection route, and after taking its final load to thedisposal point, returning to the depot. Routes generally consist of a mixture ofdomestic and commercial properties, although councils may operate separatecommercial routes in urban areas.
Other refuse collection services that may be provided by councils include:n separate collection of recyclable materials such as paper, cardboard and glassn provision of a special uplift service for bulky domestic refuse (ie, special
uplifts), mainly to households, on requestn giving assistance to householders unable to move wheeled bins to the kerbsiden provision of skips for the removal of domestic and commercial refusen special arrangements for the collection of hazardous or clinical waste.
Exhibit 1 illustrates the principal components of the refuse collection service andtheir links with interim and final disposal points.
3 Material recycling facility _ A facility for the sorting and baling of mixed, or separated at source,refuse to recover recyclable materials such as paper, cardboard, metals, plastics and glass.
Transfer-loading station _ A facility located close to the point of collection where r efuse istransferred to large haulage vehicles for transportation to treatment or disposal facilities. Transfer-loading stations are generally used in urban areas where local landfill sites are not available and inrural areas where it is not economic for expensive refuse collection vehicles to travel long distancesto landfill sites. Transfer-loading station costs are included in the cost of refuse disposal.
Benchmarking refuse collection 7
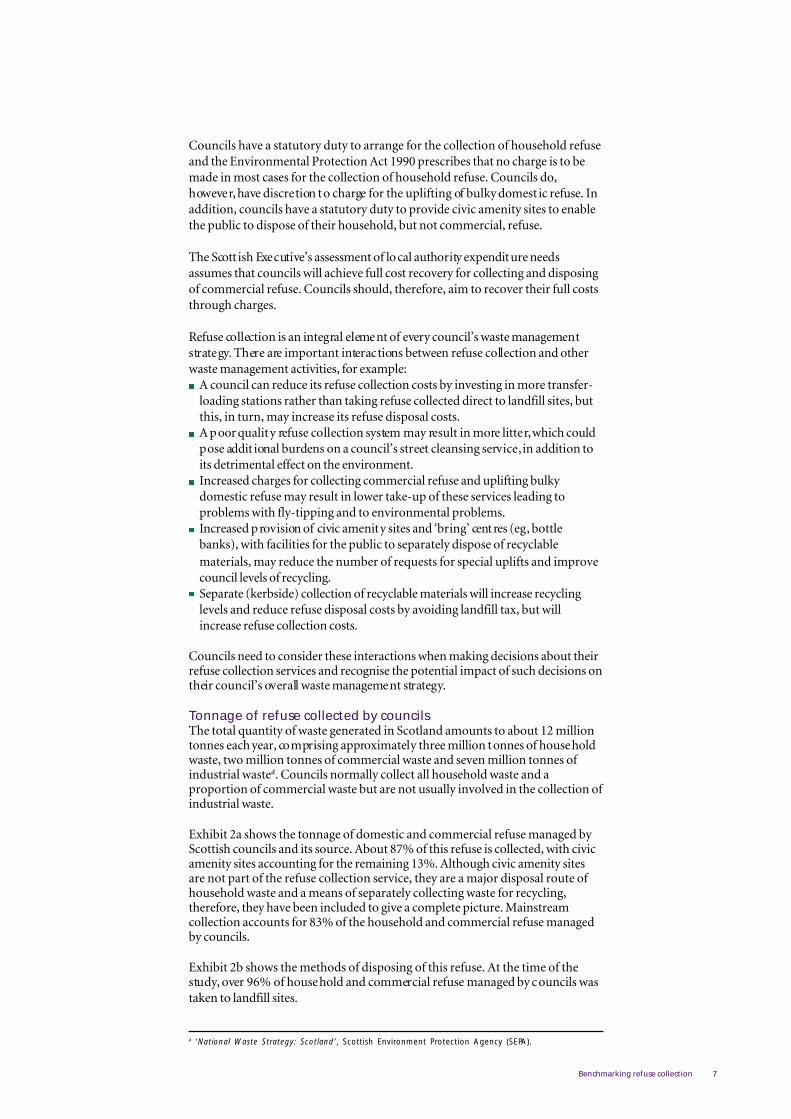
Councils have a statutory duty to arrange for the collection of household refuseand the Environmental Protection Act 1990 prescribes that no charge is to bemade in most cases for the collection of household refuse. Councils do,however, have discretion to charge for the uplifting of bulky domest ic refuse. Inaddition, councils have a statutory duty to provide civic amenity sites to enablethe public to dispose of their household, but not commercial, refuse.
The Scott ish Executive’s assessment of local authority expenditure needsassumes that councils will achieve full cost recovery for collecting and disposingof commercial refuse. Councils should, therefore, aim to recover their full coststhrough charges.
Refuse collection is an integral element of every council’s waste managementstrategy. There are important interactions between refuse collection and otherwaste management activities, for example:n A council can reduce its refuse collection costs by investing in more transfer-
loading stations rather than taking refuse collected direct to landfill sites, butthis, in turn, may increase its refuse disposal costs.
n A poor quality refuse collection system may result in more litter, which couldpose addit ional burdens on a council’s street cleansing service, in addition toits detrimental effect on the environment.
n Increased charges for collecting commercial refuse and uplifting bulkydomestic refuse may result in lower take-up of these services leading toproblems with fly-tipping and to environmental problems.
n Increased provision of civic amenity sites and ‘bring’ centres (eg, bottlebanks), with facilities for the public to separately dispose of recyclablematerials, may reduce the number of requests for special uplifts and improvecouncil levels of recycling.
n Separate (kerbside) collection of recyclable materials will increase recyclinglevels and reduce refuse disposal costs by avoiding landfill tax, but willincrease refuse collection costs.
Councils need to consider these interactions when making decisions about theirrefuse collection services and recognise the potential impact of such decisions ontheir council’s overall waste management strategy.
Tonnage of refuse collected by councilsThe total quantity of waste generated in Scotland amounts to about 12 milliontonnes each year, comprising approximately three million tonnes of householdwaste, two million tonnes of commercial waste and seven million tonnes ofindustrial waste4. Councils normally collect all household waste and aproportion of commercial waste but are not usually involved in the collection ofindustrial waste.
Exhibit 2a shows the tonnage of domestic and commercial refuse managed byScottish councils and its source. About 87% of this refuse is collected, with civicamenity sites accounting for the remaining 13%. Although civic amenity sitesare not part of the refuse collection service, they are a major disposal route ofhousehold waste and a means of separately collecting waste for recycling,therefore, they have been included to give a complete picture. Mainstreamcollection accounts for 83% of the household and commercial refuse managedby councils.
Exhibit 2b shows the methods of disposing of this refuse. At the time of thestudy, over 96% of household and commercial refuse managed by councils wastaken to landfill sites.
4 ‘National Waste Strategy: Scotland’, Scottish Environment Protection Agency (SEPA).

Benchmarking refuse collection
esuferfoecruoS llifdnalotnekaT)sennot(
)sennot(delcyceR delcyceregatnecreP
noitcellocmaertsniaMdnadlohesuoh(
)laicremmoc008,463,2 006,31 %1
fosnoitcellocetarapeS,draobdrac,repap
dnalatem,ssalgesufernedrag
003,31 009,35 %08
stfilpulaicepS 007,54 002,1 %3
*setisytinemaciviC 003,723 004,14 %11
latoT 001,157,2 001,011
%2.69 %8.3
Exhibit 2: Tonnage of commercial and domestic refuse managed by Scottish councils
a: Source of refuse
Most refuse is collected via mainstream collections ...
b: Disposal method
... and disposed of via landfill.
Note: Civic amenity sites are not part of the refuse collection service.
Source: Local audit returns
esuferfoecruoS )sennot(latoT latotfoegatnecreP
noitcellocmaertsniaM)laicremmocdnadlohesuoh(
004,873,2 %38
,repapfosnoitcellocetarapeSdnalatem,ssalg,draobdrac
esufernedrag002,76 %2
stfilpulaicepS 009,64 %2
*setisytinemaciviC 007,863 %31
latoT 002,168,2 %001
8
esuferfoecruoS )sennot(latoT latotfoegatnecreP
noitcellocmaertsniaM)laicremmocdnadlohesuoh(
004,873,2 %38
,repapfosnoitcellocetarapeSdnalatem,ssalg,draobdrac
esufernedrag002,76 %2
stfilpulaicepS 009,64 %2
*setisytinemaciviC 007,863 %31
latoT 002,168,2 %001
esuferfoecruoS llifdnalotnekaT)sennot(
)sennot(delcyceR delcyceregatnecreP
noitcellocmaertsniaMdnadlohesuoh(
)laicremmoc008,463,2 006,31 %1
fosnoitcellocetarapeS,draobdrac,repap
dnalatem,ssalgesufernedrag
003,31 009,35 %08
stfilpulaicepS 007,54 002,1 %3
*setisytinemaciviC 003,723 004,14 %11
latoT 001,157,2 001,011
%2.69 %8.3
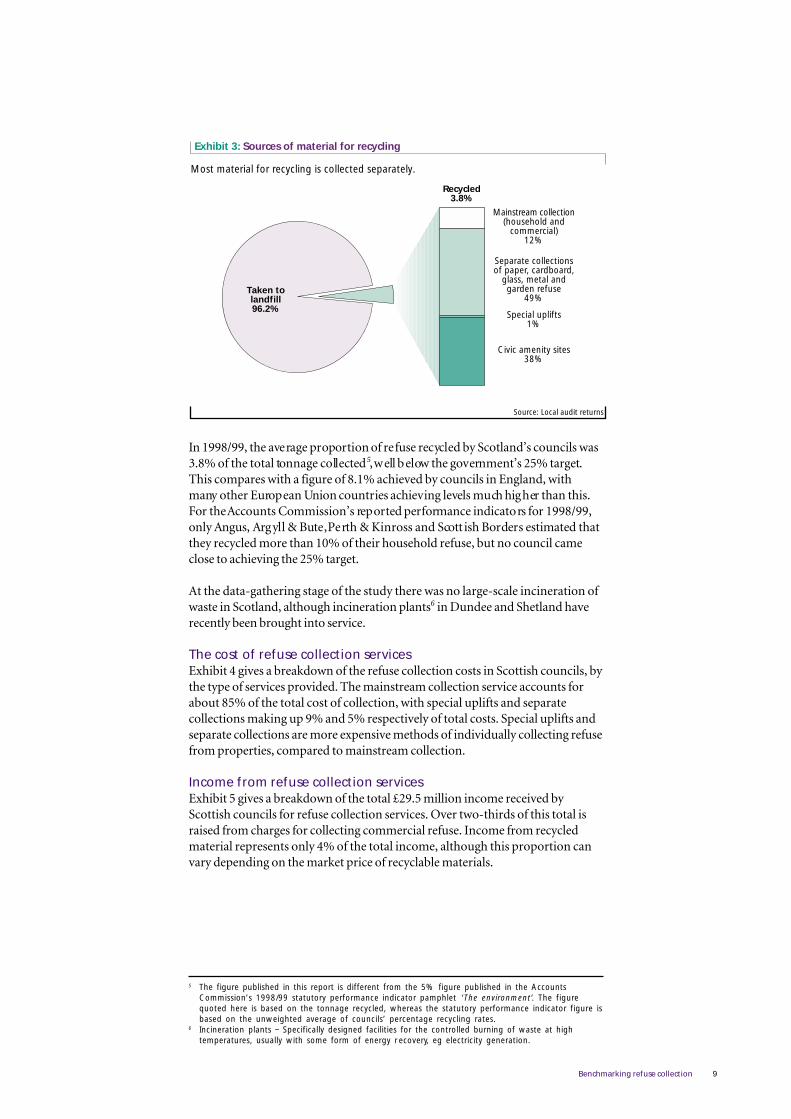
Exhibit 3 illustrates the proportion of refuse that is being recycled and thesource of that refuse. Although separate collections only account for 2% of thetotal refuse collected by councils, they account for over half the materialrecycled.
Benchmarking refuse collection 9
In 1998/99, the average proportion of refuse recycled by Scotland’s councils was3.8% of the total tonnage collected5, well below the government’s 25% target.This compares with a figure of 8.1% achieved by councils in England, withmany other European Union countries achieving levels much higher than this.For the Accounts Commission’s reported performance indicators for 1998/99,only Angus, Argyll & Bute, Perth & Kinross and Scott ish Borders estimated thatthey recycled more than 10% of their household refuse, but no council cameclose to achieving the 25% target.
At the data-gathering stage of the study there was no large-scale incineration ofwaste in Scotland, although incineration plants6 in Dundee and Shetland haverecently been brought into service.
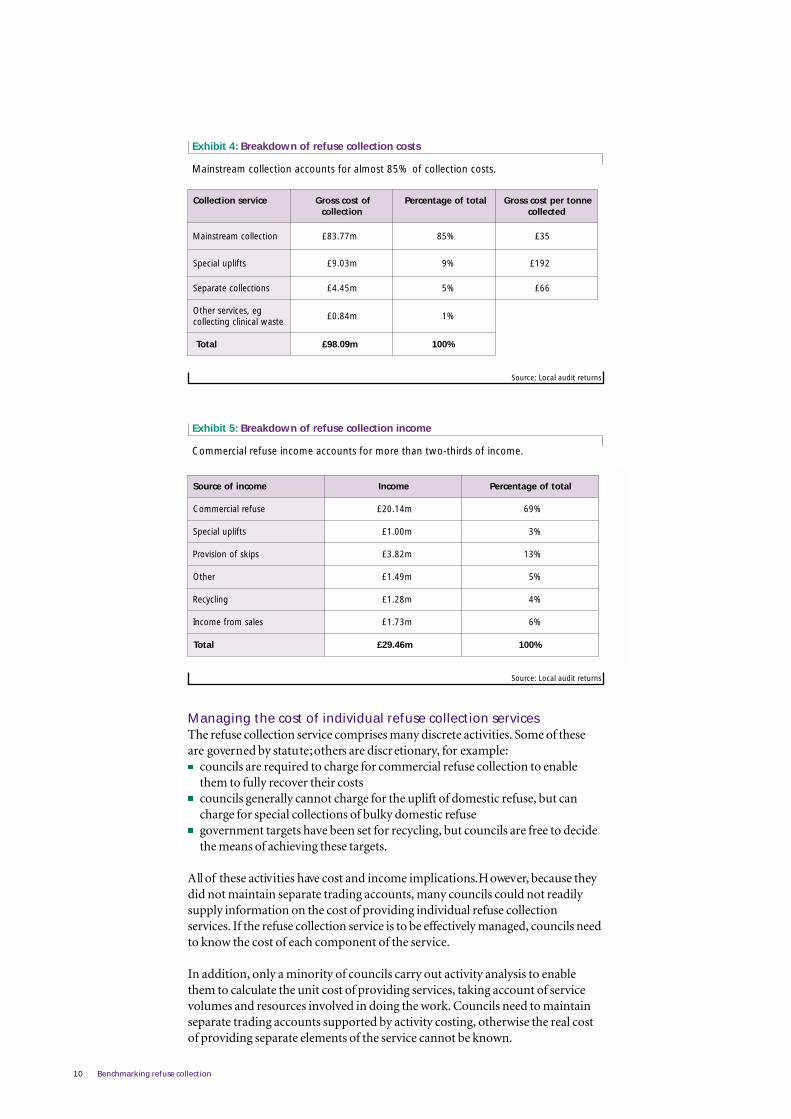
The cost of refuse collection servicesExhibit 4 gives a breakdown of the refuse collection costs in Scottish councils, bythe type of services provided. The mainstream collection service accounts forabout 85% of the total cost of collection, with special uplifts and separatecollections making up 9% and 5% respectively of total costs. Special uplifts andseparate collections are more expensive methods of individually collecting refusefrom properties, compared to mainstream collection.
Income from refuse collection servicesExhibit 5 gives a breakdown of the total £29.5 million income received byScottish councils for refuse collection services. Over two-thirds of this total israised from charges for collecting commercial refuse. Income from recycledmaterial represents only 4% of the total income, although this proportion canvary depending on the market price of recyclable materials.
5 The figure published in this report is different from the 5% figure published in the AccountsCommission’s 1998/99 statutory performance indicator pamphlet ‘The environment’. The figurequoted here is based on the tonnage recycled, whereas the statutory performance indicator figure isbased on the unweighted average of councils’ percentage recycling rates.
6 Incineration plants _ Specifically designed facilities for the controlled burning of waste at hightemperatures, usually with some form of energy r ecovery, eg electricity generation.
Exhibit 3: Sources of material for recycling
Most material for recycling is collected separately.
Source: Local audit returns
Mainstream collection(household and
commercial)12%
Separate collectionsof paper, cardboard,
glass, metal andgarden refuse
49%
Special uplifts1%
Civic amenity sites38%
Taken tolandfill96.2%
Recycled3.8%
Benchmarking refuse collection
Exhibit 5: Breakdown of refuse collection income
Commercial refuse income accounts for more than two-thirds of income.
ecivresnoitcelloC fotsocssorGnoitcelloc
latotfoegatnecreP ennotreptsocssorGdetcelloc
noitcellocmaertsniaM m77.38£ %58 3£ 5
stfilpulaicepS m30.9£ %9 291£
snoitcellocetarapeS m54.4£ %5 66£
ge,secivresrehtOetsawlacinilcgnitcelloc
m48.0£ %1
latoT m90.89£ %001
Source: Local audit returns
10
Managing the cost of individual refuse collection servicesThe refuse collection service comprises many discrete activities. Some of theseare governed by statute; others are discretionary, for example:n councils are required to charge for commercial refuse collection to enable
them to fully recover their costsn councils generally cannot charge for the uplift of domestic refuse, but can
charge for special collections of bulky domestic refusen government targets have been set for recycling, but councils are free to decide
the means of achieving these targets.
All of these activities have cost and income implications. However, because theydid not maintain separate trading accounts, many councils could not readilysupply information on the cost of providing individual refuse collectionservices. If the refuse collection service is to be effectively managed, councils needto know the cost of each component of the service.
In addition, only a minority of councils carry out activity analysis to enablethem to calculate the unit cost of providing services, taking account of servicevolumes and resources involved in doing the work. Councils need to maintainseparate trading accounts supported by activity costing, otherwise the real costof providing separate elements of the service cannot be known.
Exhibit 4: Breakdown of refuse collection costs
Mainstream collection accounts for almost 85% of collection costs.
Source: Local audit returns
ecivresnoitcelloC fotsocssorGnoitcelloc
latotfoegatnecreP ennotreptsocssorGdetcelloc
noitcellocmaertsniaM m77.38£ %58 3£ 5
stfilpulaicepS m30.9£ %9 291£
snoitcellocetarapeS m54.4£ %5 66£
ge,secivresrehtOetsawlacinilcgnitcelloc
m48.0£ %1
latoT m90.89£ %001
emocnifoecruoS emocnI latotfoegatnecreP
esuferlaicremmoC m41.02£ 96 %
stfilpulaicepS m00.1£ 3%
spiksfonoisivorP m28.3£ 31 %
rehtO m94.1£ 5%
gnilcyceR m82.1£ 4%
selasmorfemocnI m37.1£ 6%
latoT m64.92£ %001

Benchmarking refuse collection
Scotland-wide changes since the 1990 studySince 1990, there have been substantial productivity improvements in the refusecollection service provided by Scottish councils. The cost of refuse collection hasrisen from £90 million in 1990 to £98 million in 1998/99, a 9% increase, which isless than the rate of inflation. Over the same period, the tonnage of refusecollected increased by 14%, the number of employees fell by 44% from 4,800 to2,700, and the number of vehicles employed fell by 25%. Exhibit 6 highlightssome of the changes in the refuse collection service since 1990.
This improvement in productivity has been made by councils making moreefficient use of resources, principally employees and vehicles, by:n changing the collection method from backdoor collection (generally requiring
a driver plus three or four loaders) predominant in 1990, to the kerbsidewheeled bin system (generally requiring a driver plus two loaders) used bymost councils today7. Research has shown that the amount of refuse collectedtends to rise and the level of recycling tends to fall when the kerbside wheeledbin collection method is used8
n introducing new technology _ including bigger capacity, more manoeuvrablecollection vehicles
n extending the use of driver-only routes in sparsely populated areas.
11
Benchmarking refusecollection services
7 At the time of the study only Aber deen City, Scottish Borders, Orkney and Shetland did not makesubstantial use of the kerbside wheeled bin system.
8 ‘Waste Matters, Good practice in waste management’, Audit Commission, 1997.
Exhibit 6: Changes in the refuse collection service over the past ten years
There have been significant productivity improvements since 1990.
Sources: Local audit returns 1999, Accounts Commission report 1990
rotacidnI 0991 9991
detcellocesuferfosennoT noillim2.2 noillim5.2
noitcellocesuferfotsocssorG noillim09£ noillim89£
deyolpmesevitarepO 008,4 007,2
deyolpmeselciheV)selcihevevresergnidulcni(
002,1 009
dohtemnoitcellocniaM roodkcaB nibdeleehwedisbreK
keewrepstisivecivreS noillim6.3 noillim9.2
detcellocennotreptsocssorG 14£ 3£ 9
raeyrepelcihevrepdetcellocsennoT)selcihevevresergnidulcni(
008,1 008,2
raeyrepevitareporepdetcellocsennoT 064 529

Benchmarking refuse collection12
Comparing the cost of refuse collection among councilsIt is difficult to make like-for-like comparisons between councils at a wholeservice level because of the variation in the refuse collection services providedamong councils. While all councils provide a mainstream refuse collectionservice to all householders, the provision of special uplifts and separatecollection services varies among councils. All councils provide a commercialrefuse collection service but their market share varies. Meaningful comparisonscan, however, be made by breaking down the total refuse collection service intoits individual components, which is the approach adopted in this report.
The use of family groups of councils having similar circumstances can assist inmaking like-for-like comparisons. For the purposes of this study we havecreated family groups based mainly on the population dispersion9 and, to alesser extent, the number of properties served. Councils have been divided intothree groups, urban, mixed urban/rural and rural.
The level of refuse collection income raised by councils varies, and income maybe allocated by councils to refuse collection and/or refuse disposal. To ensurelike-for-like cost comparisons, the study uses the gross cost of collection tocompare councils.
Cost of mainstream refuse collectionThe study aimed to collect information on the cost of collecting domestic refuseseparate from the cost of collecting commercial refuse. However, as only a fewcouncils maintain separate trading accounts for these collection activities, thecost analyses have been carried out taking domestic and commercial refusecollection costs together.
Exhibit 7 compares the average annual gross cost of collecting mainstreamrefuse from domestic and commercial properties. Most councils fall in therange of £30-£40 per property per year. Nine councils have mainstream refusecollection costs of over £40 per year, including the three islands councils (wherecosts are over £50 per property per year). Mainland councils that have a highercost of mainstream collection than might be expected for their circumstancesare highlighted. While all councils should look to review their performance,these councils should conduct a local review to determine the reasons for theirhigher cost of collection, then take appropriate action.
Local factors may influence the cost of mainstream refuse collection; the mostsignificant of these is population dispersion. Councils with higher levels ofdispersion tend to have higher refuse collection costs10 because vehicles travellonger route distances. Other local factors include:n the variation in distance from the main population centres to landfill sitesn the type of property served _ collection of refuse from certain property types
such as tenements may be more time intensive and therefore more expensiven the local characteristics of the area: some councils have to transport refuse
collection vehicles on ferries, increasing time and costs.
In addition, local circumstances at the time of the study will also have had aneffect. For example, the City of Edinburgh Council was in the process ofchanging its collection method from kerbside sacks to kerbside wheeled bins.This transitional phase increased its 1998/99 collection costs.
9 Population dispersion measures the degree to which a population is spread across the council’sarea. The Scottish Executive Central Research Unit provided Dispersion data.
1 0 The study found a significant correlation between mainstream collection costs and populationdispersion, r2=0.66.

Benchmarking refuse collection 13
The study found that the cost of refuse collection in Scotland is broadly similarto that in England and Wales, when allowance is made for the increased sparcityof some Scott ish councils (information for councils in England and Wales wasprovided by the Association for Public Service Excellence).
To support benchmarking at a more detailed local level, information wascollected on all mainstream refuse collection routes in Scotland. The routeinformation allows all councils to make comparisons with other councils thatoperate similar types of routes. For example, urban routes in predominantlyrural councils can be compared with other, similar urban routes in all councils.Details of the methodology used and the family groups created for the routeinformation are included in Appendix 3.
Gross costs per property served (£)
0 10 20 30 40 50 60
Eilean Siar
Argyll & Bute
Orkney Islands
Highland
Shetland Islands
Dumfries & Galloway
Scottish Borders
Perth & Kinross
Aberdeenshire
Stirling
Moray
East Ayrshire
East Lothian
North Ayrshire
Fife
Angus
Clackmannanshire
South Ayrshire
South Lanarkshire
West Lothian
Inverclyde
Midlothian
East Renfrewshire
East Dunbartonshire
Falkirk
North Lanarkshire
Renfrewshire
Aberdeen City
Edinburgh, City of
West Dunbartonshire
Dundee City
Glasgow City
Exhibit 7: Annual gross cost of mainstream refuse collection per property served
The cost of collection tends to increase with population dispersion, although there isvariation among family groups.
Source: Local audit returns
Rural councils
Mixed councils
Urban councils
LEAST DISPERSED
MOST DISPERSED
Note: Mainland councils with higher than expected collection costs are highlighted.

Benchmarking refuse collection14
Income from commercial refuseThe charges made by councils for collecting commercial refuse vary, resulting indifferences in income raised for a similar level of collection activity. For councilsundertaking around 4,000 commercial uplifts a week, the amount of incomeraised in a year ranges from £220,000 to £640,000. While the cost of collectingcommercial refuse will vary among councils for the same level of activity, thedifference in income generated suggests that some councils are not chargingsufficient sums to recover the cost of collection and disposal.
The Scott ish Executive’s policy is for local authorities to recover all costsassociated with the collection and disposal of commercial waste. Its circular onThe Controlled Waste Regulations11 states that charges should be “realistic andshould have a direct relationship to the cost of providing the service. The overallaim should be to achieve full cost recovery”.
In order to establish whether councils were achieving full cost recovery in theoperation of their commercial refuse collection services, we asked councils tosupply information on the cost of collecting commercial refuse and the amountof commercial income received. While all 32 councils were able to provide detailsof their commercial refuse collection income, only 17 councils were able tosupply information on the cost of operating their commercial refuse service(these include those councils that maintain trading accounts and others thatprovided an estimate for the purposes of this study).
Because of the limited information available on commercial refuse collectioncosts, we compared the gross cost per tonne of collecting and disposing ofmainstream refuse collection with the income received per tonne, to assesswhether councils cover their costs in full. The box below explains ourcalculat ion. We estimate that there is an overall shortfall of £9.7 millioncompared to the amount of income that councils would need to raise to recovertheir costs in full.
1 1 Scottish Office Environment Department Circular 24/92, ‘The Environment Protection Act 1990_ Parts II and IV, The Controlled Waste Regulations 1992’, HMSO.
Comparing the amount of income raised with the total cost of collectingand disposing of commercial refuse.
Total income from commercial refuse services £20m (a)
Total tonnage of commercial r efuse collected 540,000 (b)
Average income per tonne collected (a / b) £37 per tonne (c)
Average cost of mainstream refuse collection £35 per tonne (d)
Average cost of waste disposal (including landfill tax) £20 per tonne (e)
Total cost of collection and disposal (d + e) £55 per tonne (f)
Average shortfall in income (f - c) £18 per tonne (g)
Estimated total shortfall in income across Scotland (g * b) £9.7m
Note: In using £35 per tonne we are assuming that the cost of commercial refuse collection per tonne is the same
as that for domestic refuse collection. However, an argument could be made that, in some cases, the
collection of commercial refuse is at marginal cost to mainstream domestic collection.
Source: Local audit returns

Benchmarking refuse collection 15
It is likely, therefore, that some councils are subsidising the cost of theircommercial refuse service from their council’s general funds. Exhibit 8 showsthe income per tonne for commercial refuse for each Scottish council. Mostcouncils having an income of less than £45 per tonne are probably notrecovering their cost of collecting and disposing of commercial refuse. Inaddition, a few councils having an income greater than £45 per tonne may notbe recovering their costs.
Income per tonne collected (£)
0 20 40 60 80 100 120
Exhibit 8: Income per tonne of commercial refuse collected
Most councils having an income of less than £45 per tonne are probably not recoveringtheir cost of collecting and disposing of commercial refuse.
Source: Local audit returns
Note: For four councils, Aberdeen City, Scottish Borders, Fife and Orkney the tonnage of commercial refuse was estimated.
Eilean Siar
East Renfrewshire
Clackmannanshire
Argyll & Bute
East Dunbartonshire
Falkirk
Shetland Islands
Inverclyde
Edinburgh, City of
Perth & Kinross
East Lothian
East Ayrshire
Glasgow City
Aberdeen City
Dumfries & Galloway
Aberdeenshire
West Lothian
Moray
South Lanarkshire
South Ayrshire
Renfrewshire
Midlothian
Angus
Dundee City
North Lanarkshire
West Dunbartonshire
North Ayrshire
Highland
Scottish Borders
Fife
Stirling
Orkney Islands
Benchmarking refuse collection16
Increasing the level of income, however, may not mean an increase in chargesmade for collecting commercial refuse. Glasgow City Council estimates thatover 20% of commercial premises in its area are not paying for collection (10%within the city centre and 50% elsewhere). A joint study undertaken betweenSEPA and the council found that 56 out of 121 premises outwith the city centrewere operating without a statutory duty of care notice 12. Glasgow City Councilis now acting to reduce the level of avoidance.
The special uplift service and links to civic amenity site provisionAll councils provide, on request, a special uplift service for the removal of bulkyitems such as furniture or domestic appliances. The proportion of specialuplifts carried out within five days of request is one of the Commission’sstatutory performance indicators. In Scottish councils, this varies from57% - 100% of uplifts (median 93%). The volume of special uplifts undertakenvaries between councils (eg, from 42,000 - 385,000 among urban councils).
The gross cost to councils of providing special uplift services is £9 million, whichrepresents about 9% of the total cost of refuse collection. The total amount ofincome raised through charges for this service is £1 million. The cost ofcollecting bulky uplifts is about £192 per tonne, over five times the cost ofmainstream refuse collection.
The average gross cost to a council of each special uplift is generally in the rangeof £5-£15 per uplift, although in some councils this will be offset by incomefrom charges. Twelve councils usually charge, while a further eight may make acharge if the number of items to be collected exceeds a specified total (eg, fivebulky items). The remaining 12 councils provide all special uplifts free of charge.Although no council recovers the total cost of the bulky uplift service throughcharges, four councils, Dundee City, Perth & Kinross, Clackmannanshire andDumfries & Galloway recover a significant proportion of their costs throughcharges.
Exhibit 9 shows the variation in take-up of the special uplift service amongcouncils and identifies separately the councils that charge and those thatnormally provide the service free of charge. Take-up var ies between 4 - 98 upliftsper hundred properties per year. Councils that charge for the service generallyhave lower take-up rates.
Two other factors were also found to have an effect on levels of take-up. Thesewere:n location _ take-up of the service is generally lower in rural areasn the level of public access to civic amenity sites (which provide householders
with an alternative free means of disposing of bulky items13).
The level of civic amenity site provision can be measured in terms of thenumber of sites provided and their hours of opening. The level of provision ofcivic amenity sites (both supervised and unsupervised) varies among councilsfrom 0.3 hours to 13 hours each week per thousand households. Access to thesesites will vary, depending on their location, opening hours and the level of carownership.
1 2 To comply with the Environmental Protection Act, traders are required to possess a duty of carenotice showing that they are disposing of their refuse to a licensed body, eg, a council or licensedprivate company.
1 3 The study found a significant correlation between the level of civic amenity site provision and thetake-up of the bulky uplift service (r2 = -0.36) and population dispersion (r2 = -0.38).

Benchmarking refuse collection 17
Council managers have reported that householders are increasingly using thespecial uplift service for the removal of building waste arising, for example,from the installation of new fitted kitchens. When such work is undertaken bycommercial contractors the council is, in effect, collecting commercial refusefrom domestic properties. The special uplift service is expensive to provide andcouncils may wish to consider their policies on the types of refuse to be collectedand review their charging policies for particular types of special uplift.
Uplifts per hundred properties
Exhibit 9: Uptake of the special uplift service
Councils that charge for the special uplift service usually have a lower uptake of the service.
Source: Local audit returns
Shetland Islands
Highland
Eilean Siar
Scottish Borders
Aberdeenshire
Orkney Islands
Perth & Kinross
Dumfries & Galloway
Argyll & Bute
East Dunbartonshire
East Lothian
West Lothian
North Ayrshire
East Ayrshire
South Lanarkshire
South Ayrshire
Midlothian
Fife
Clackmannanshire
Inverclyde
Moray
Stirling
East Renfrewshire
Angus
Glasgow City
North Lanarkshire
Falkirk
West Dunbartonshire
Renfrewshire
Edinburgh, City of
Aberdeen City
Dundee City
0 20 40 60 80 10010 30 50 70 90
Councils that charge Councils that don’t usually charge
Rural councils
Mixed councils
Urban councils
Note: Fife charges in one of its three areas.

Benchmarking refuse collection
Separate collection of recyclable materialsIn addition to its mainstream collection service, a council may also separatelycollect materials that can be recycled or reused. Separate collections increase thetotal cost of refuse collection because they usually require an additional visit(s)to properties over and above the mainstream collection visit(s). Theeffectiveness of separate collections depends on the support of householdersand businesses to separate materials such as paper, cardboard and g lass fromtheir general waste.
Not all councils undertake separate collections and, in those that do, the servicemay be limited to commercial properties or to particular households within thecouncil’s area. Exhibit 10 shows the number of councils that separately collectpaper, cardboard and glass for recycling together with the number of routesinvolved. Councils may also work in partnership with the private and voluntarysectors to collect material for recycling.
In the past, councils have been able to find ready markets for recyclablematerials. However, refuse collection managers have indicated that the currentlow market price for recycled materials is making separate collections difficult tojustify in cost terms.
Because it is no longer considered economic, several councils have withdrawn,or are considering withdrawing separate collections of waste paper andcardboard. A similar picture applies to glass _ green glass currently has nomarket value. However, councils that invest in separate collections have higheroverall recycling levels. Councils now face a real choice between the economiccost of collection and the environmental benefits of recycling.
In addition to separate collections, material for recycling may also be collectedat civic amenity sites. Taken together, they account for 87% of the householdand commercial waste recycled by councils (see Exhibit 3). Exhibit 11 gives abreakdown of the types of materials collected for recycling and the proportionof each material recycled. Almost all glass and metal are recycled; 87% of paperand cardboard are recycled, but only 38% of garden refuse is recycled.
18
Exhibit 10: Separate collections for recycling
Source: Local audit returns
repaP draobdraC ssalG
ecivresehtgnitareposlicnuocforebmuN 31 31 51
detareposetuorforebmunlatoT 46 03 72
Less than half of councils operate a separate collection service.
repaP draobdraC ssalG
ecivresehtgnitareposlicnuocforebmuN 31 31 51
detareposetuorforebmunlatoT 46 03 72

Benchmarking refuse collection 19
Service qualityBest Value emphasises the importance of ensuring that council services arefirmly focused on the needs of residents/citizens across all council services.Councils are already using a variety of approaches to establish what residentsexpect from services. The Commission’s report, ‘Can’t get no satisfaction? Usingthe gap approach to measure service quality’, provides guidance to councils onassessing service quality by comparing customer expectations of service withtheir perception of services actually delivered.
Customer surveysOne of the main methods that councils use to gather information on servicequality is through customer satisfaction surveys. This information can be usedto judge whether the service is meeting users’ expectations and where action maybe required to improve the quality of service provided. For commercialcustomers it can also be used to ascertain whether users believe that the servicerepresents value for money and to judge reaction to proposed changes incharging systems.
Just over half of councils (18) had carried out one or more refuse collectioncustomer survey(s) since reorganisation. The annual number of surveys hasincreased markedly from only four in 1997 to ten in 1998.
These surveys have gathered information on a number of issues, for example:n the overall level of satisfaction with the refuse collection servicen the level of satisfaction with particular service areas, eg, civic amenity site
location, opening hours and ease of accessn particular service issues that customers would like their council to address.
Surveys have consistently shown high degrees of customer satisfaction withover 90% of customers being satisfied with the refuse collection service theyreceive.
Analysis of service complaintsCustomer complaints are a valuable source of information in identifying areaswhere the service is not meeting customer expectations and needs to beimproved. For refuse collection the main causes of customer complaints are:
Exhibit 11: Recycling levels of paper, cardboard, glass, metal and garden refuse
Source: Local audit returns
Most paper, cardboard, glass and metal are recycled, but most garden refuse is takento landfill.
lairetamelbalcyceRegannotlatoT
llifdnalotnekategannotlatoT
delcycerdelcyceregatnecreP
repaP 016,4 618,92 %78
draobdraC 032,1 385,8 %78
ssalG 911 409,32 %001
lateM 341 579,9 %99
esufernedraG 778,03 741,91 %83
Note: This exhibit gives a breakdown of material collected via civic amenity sites and separate collections.
lairetamelbalcyceRegannotlatoT
llifdnalotnekategannotlatoT
delcycerdelcyceregatnecreP
repaP 016,4 618,92 %78
draobdraC 032,1 385,8 %78
ssalG 911 409,32 %99
lateM 341 579,9 %99
esufernedraG 778,03 741,91 %83

Benchmarking refuse collection
Complaints per thousand properties served
Exhibit 12: Complaints per thousand properties served
The number of complaints varies markedly between councils.
Source: Local audit returns
East Renfrewshire
Edinburgh, City of
Clackmannanshire
North Ayrshire
Glasgow, City of
Argyll & Bute
West Dunbartonshire
Renfrewshire
Fife
Highland
West Lothian
Dundee, City of
Falkirk
South Lanarkshire
Inverclyde
East Dunbartonshire
South Ayrshire
East Lothian
Midlothian
Angus
Aberdeen, City of
Dumfries & Galloway
Scottish Borders
East Ayrshire
Stirling
Shetland Islands
Perth & Kinross
Moray
Eilean Siar
Aberdeenshire
Orkney Islands
20
n bin not emptiedn excess refuse (side waste) not collectedn spillage not clearedn missed pull-out (assistance not given, as scheduled, to householders unable
to put their refuse out for collection).
Exhibit 12 shows the number of refuse collection service complaints received byScottish councils. The study found that the number of complaints received in ayear varies from about 1 to 55 complaints per thousand properties served. Butthese figures need to be treated with caution as the ease with which complaints canbe made to councils varies, enquiries are sometimes logged as complaints and, ofcourse, not all complaints may be justified. In addition, complaints invariablyarise when changes are made to the service, for example, the introduction of a newcollection method can lead to a temporary rise in complaints.
0 10 20 30 40 50 60

Benchmarking refuse collection
Assisted pull-out schemesThe wheeled bin system requires householders to move the bin from theirproperty to the kerbside for collection. Some householders may be unable to dothis because of illness or infirmity. In such cases a pull-out service may bearranged where the refuse collection loader collects, empties and returns the bin.The eligibility criteria for this service varies among councils. Some councilsprovide the service simply on request, others require a visit from a councilofficer, while some require a medical certificate. This leads to a significantvariation in the level of provision among councils (Exhibit 13).
�������������� ������������������������
� � � � � �� ��
��������������� �����������������������������������������������
���� ������������������������������ � ����������� �������������� �
���������������������
����!��"
#� ��$" ��
!���%������ ��
&��������% ��
������$" ��
$�"���'�(��
�������
)��* ��
+���'�,���
-���������
����������% ��
. �� ��/���� ��
#� �� ��/���� ��
$���
0��
#���/���1�!��"���
#� ��)��* ��
&����$" ��
#� ���������
��������2 ����
3�������
0��%�%
���� �'�4����*�"
. ���������
$/���!��"
-��"
������ ��(��
2����"�
4�� ��*�!��"
$/�� ��
#��������
5%�"�2 ����
�������� !"#�$!%�"�&'�
21

Benchmarking refuse collection
Eligibility criteria and hence likely take-up, need to be weighed against the costsof providing this service. Refuse collection managers have assessed that thisservice takes three times as long as a normal kerbside uplift. On this basis, a10% level of pull-outs will increase collection costs by 20%.
Although the level of requests for a pull-out service will vary according to theadopted policy of councils and the demographic profile of their area, mostrefuse collection managers would not expect the level of take-up to exceed 5% ofproperties served 14.
22
1 4 Source: Discussion with refuse collection managers during the course of the study.

Benchmarking refuse collection 23
Up-to-date performance information is essential if financial and operationalservice objectives are to be met. Managers need to be able to identify variationsfrom expected performance and to be able, where necessary, to act to remedypoor performance. Guidance on management information requirements forDLOs and DSOs is included in the Commission’s report, ‘Understanding ourbusiness’.
Using the COMPARE data to monitor performanceThe study benchmarking data, given to all refuse collection managers, providesdetailed cost and performance information across all important aspects of therefuse collection service. However, it is not possible nor practicable to includedetails of all of that information in this report. All councils are expected toreview the COMPARE data and make improvements in areas where theircouncil is not performing as well as others. A list of the indicators supplied tocouncils is included in Appendix 2.
The remainder of this section of the report provides information on the issuesthat most councils require to address. It concentrates on employee and vehicleresources because they make up over three-quarters of the cost of providingrefuse collection services. The remainder of total costs comprises _ client,central support and administration costs (15%), supplies and services (4%),capital charges (other than vehicles) (2%) and direct property costs (1%).Guidance on managing sickness absence and bonus schemes is included in theCommission’s report, ‘Rewarding work’.
Need to improve management of employee sickness absenceThe study found a large variation in sickness absence rates among councils,ranging from 2% - 16% (Exhibit 14). In most councils, the level of sicknessabsence for loaders (median 6.3 days) is higher than that for drivers (median5 days). The study did not find a link between the level of sickness absence andthe level of bonus or overtime. Excessive sickness levels add a significant on-costto the pay bill, and the causes of sickness absence should be identified andaddressed by council managers.
Councils with high levels of sickness absence should examine their proceduresfor managing absence, and set realistic targets. When assessing the level ofsickness absence, the impact of long-term sickness absence should berecognised. This is particularly relevant to smaller councils, whose percentageabsence can be distorted by long-term sickness of one or two employees. Allcouncils should aim to control sickness absence to the lower quartile level,ie, below 5% for loaders and 4% for drivers.
Monitoring and reviewingservice performance

Benchmarking refuse collection24
Need to review employee bonus schemesBonus schemes are a means by which management can motivate employees toimprove productivity. However, they cannot work successfully unless they arethe subject of regular review and take account of the changes in workloaddemands on collection crews. On reorganisation, unitary councils inherited anumber of different schemes from the former councils. However, the studyfound that about half of councils had not formally reviewed their bonusschemes since reorganisation. Some councils reported that the bonus scheme inoperation had not been formally reviewed within the last ten years.
Exhibit 14: Sickness absence rates for refuse collection employees
There is a large variation in sickness absence rates among councils.
Source: Local audit returns
Drivers Loaders
Percentage of days lost through sickness absence
0 2 4 6 8 10 12 14 16 18
Note: *These councils could only provide a combined figure for drivers and loaders.
Clackmannanshire
Aberdeen City
Eilean Siar
East Lothian
*Renfrewshire
Falkirk
East Ayrshire
*Dundee City
*Angus
*East Dunbartonshire
East Renfrewshire
Scottish Borders
Stirling
Edinburgh, City of
Highland
Aberdeenshire
West Lothian
Midlothian
Glasgow City
Shetland Islands
*South Ayrshire
*South Lanarkshire
Argyll & Bute
Inverclyde
Fife
North Ayrshire
North Lanarkshire
Dumfries & Galloway
*Orkney Islands
West Dunbartonshire
Perth & Kinross
Moray
Benchmarking refuse collection 25
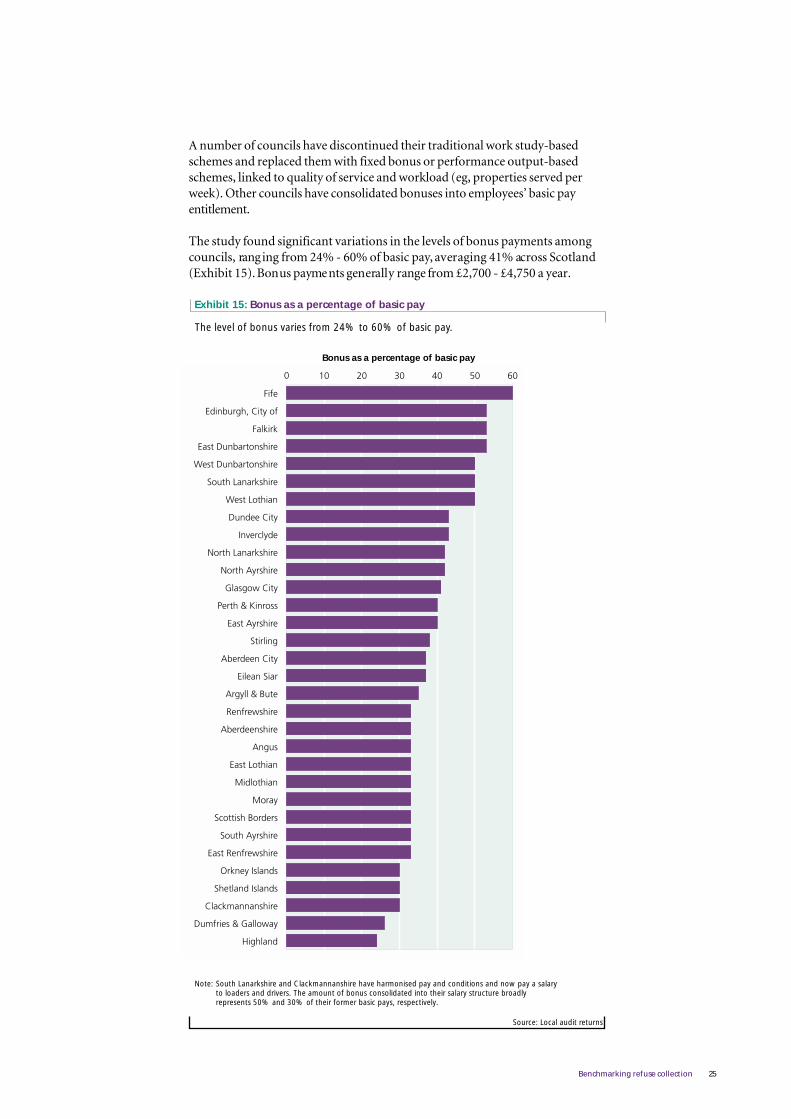
A number of councils have discontinued their traditional work study-basedschemes and replaced them with fixed bonus or performance output-basedschemes, linked to quality of service and workload (eg, properties served perweek). Other councils have consolidated bonuses into employees’ basic payentitlement.
The study found significant variations in the levels of bonus payments amongcouncils, ranging from 24% - 60% of basic pay, averaging 41% across Scotland(Exhibit 15). Bonus payments generally range from £2,700 - £4,750 a year.
Bonus as a percentage of basic pay
0 10 20 30 40 50 60
Exhibit 15: Bonus as a percentage of basic pay
The level of bonus varies from 24% to 60% of basic pay.
Source: Local audit returns
Fife
Edinburgh, City of
Falkirk
East Dunbartonshire
West Dunbartonshire
South Lanarkshire
West Lothian
Dundee City
Inverclyde
North Lanarkshire
North Ayrshire
Glasgow City
Perth & Kinross
East Ayrshire
Stirling
Aberdeen City
Eilean Siar
Argyll & Bute
Renfrewshire
Aberdeenshire
Angus
East Lothian
Midlothian
Moray
Scottish Borders
South Ayrshire
East Renfrewshire
Orkney Islands
Shetland Islands
Dumfries & Galloway
Highland
Clackmannanshire
Note: South Lanarkshire and Clackmannanshire have harmonised pay and conditions and now pay a salaryto loaders and drivers. The amount of bonus consolidated into their salary structure broadlyrepresents 50% and 30% of their former basic pays, respectively.
Benchmarking refuse collection26
Performance incentive payment schemes are only justified if they can bedemonstrated to provide improved value to the authority. The findings of thisstudy suggest that bonus schemes are worthy of review in a number of councils.There wil l also be an opportunity, in the near future, for councils to evaluate therole of incentive payments as part of their implementation of the single statusagreement for all council employees.
Need to review vehicle replacement programmesRefuse collection services in Scotland operate over 900 specialist refuse collectionvehicles. These vehicles are expensive. Specialist compaction vehicles, includinglifting mechanisms, currently cost £150,000. Therefore, councils need tooptimise their availability and productive use, at an economical cost. Councilsshould be looking to strike an appropriate balance between replacement andongoing maintenance cost, over the life of a vehicle.
Vehicle replacement requires careful financial planning to balance the increasedmaintenance and running costs and poorer reliability of older vehicles againstthe cost of replacement. However, the study found that only 38% of councilsconduct a cost/benefit analysis to help determine the optimum time to replace avehicle. About 40% of councils are behind in their vehicle replacementprogrammes, and may consequently be incurring higher vehicle costs.
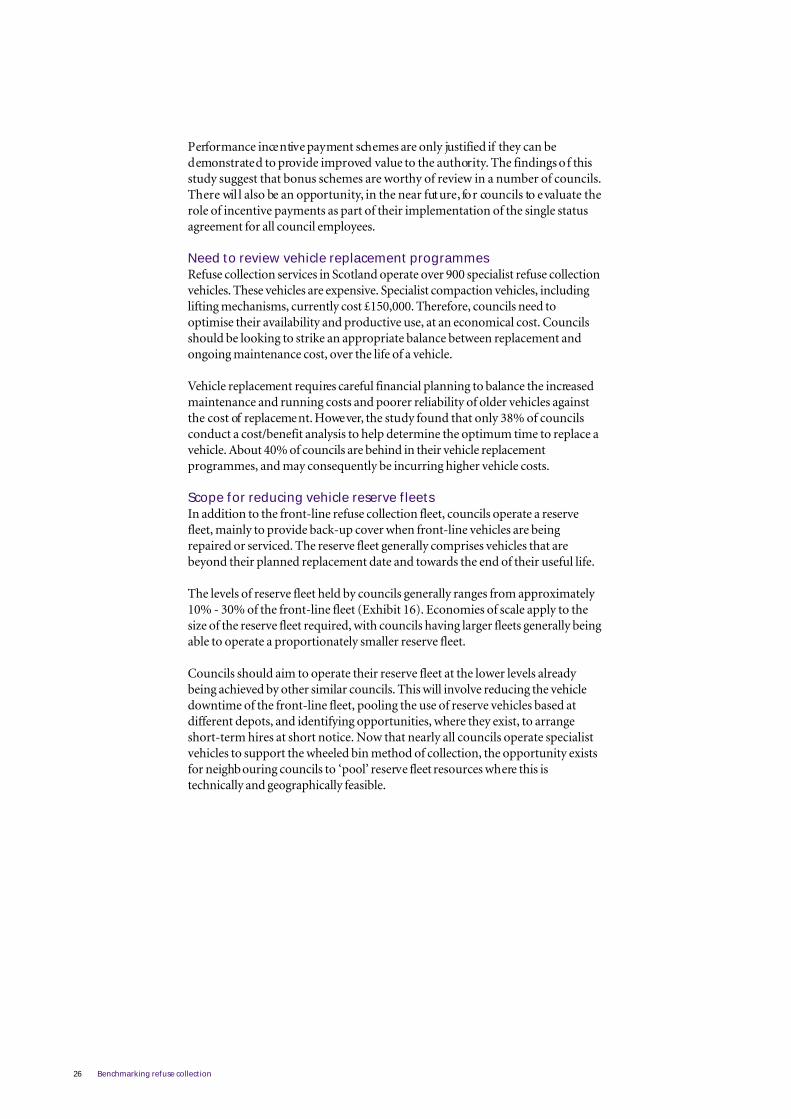
Scope for reducing vehicle reserve fleetsIn addition to the front-line refuse collection fleet, councils operate a reservefleet, mainly to provide back-up cover when front-line vehicles are beingrepaired or serviced. The reserve fleet generally comprises vehicles that arebeyond their planned replacement date and towards the end of their useful life.
The levels of reserve fleet held by councils generally ranges from approximately10% - 30% of the front-line fleet (Exhibit 16). Economies of scale apply to thesize of the reserve fleet required, with councils having larger fleets generally beingable to operate a proportionately smaller reserve fleet.
Councils should aim to operate their reserve fleet at the lower levels alreadybeing achieved by other similar councils. This will involve reducing the vehicledowntime of the front-line fleet, pooling the use of reserve vehicles based atdifferent depots, and identifying opportunities, where they exist, to arrangeshort-term hires at short notice. Now that nearly all councils operate specialistvehicles to support the wheeled bin method of collection, the opportunity existsfor neighbouring councils to ‘pool’ reserve fleet resources where this istechnically and geographically feasible.
Benchmarking refuse collection 27
Reserve fleet as a percentage of front-line fleet
Exhibit 16: Reserve fleet as a percentage of front-line fleet
There is scope in some councils to reduce the size of the reserve fleet.
Source: Local audit returns
INCREASINGFLEET SIZEOrkney Islands
Shetland Islands
Eilean Siar
Clackmannanshire
East Renfrewshire
Inverclyde
Midlothian
East Lothian
East Dunbartonshire
West Dunbartonshire
West Lothian
Moray
Angus
East Ayrshire
Perth & Kinross
South Ayrshire
Stirling
Argyll & Bute
Falkirk
Dundee City
Scottish Borders
Dumfries & Galloway
North Ayrshire
Renfrewshire
Aberdeen City
Aberdeenshire
South Lanarkshire
North Lanarkshire
Edinburgh, City of
Highland
Fife
Glasgow City
0 10 40 60 80 10020 30 50 70 90
1
1
2
0
1
2
3
3
1
3
3
4
5
4
1
3
3
7
5
5
1
4
7
3
3
7
8
9
12
16
11
Note: East Renfrewshire has no reserve vehicles. In the event of vehicle failure, replacement vehiclesare hired on short-term leases. Councils with higher than expected reserve fleets (above 25%)are highlighted.
1 Number of reserve vehicles
3
Vehicle communication systemsMost refuse collection vehicles work away from their depot for hours at a time.For operational purposes, it is important that refuse collection supervisorsmaintain communication links with each vehicle, for example, to arrangeassistance to cover for a vehicle breakdown. Radio communication is a cost-effective way of ensuring a quick response to such situations. However, thestudy found that eight councils do not have radio units in their refuse collectionvehicles.

Benchmarking refuse collection
Study recommendations andkey challenges for the future
28
Achieving further improvements in service efficiencyThis study has found that the performance of councils’ refuse collection serviceshas improved, both in terms of cost and service efficiency, since theCommission’s earlier 1990 study. However, it has identified that some scoperemains for further improvements.
Not all councils have taken steps to realise the opportunities provided by localgovernment reorganisation. Some unitary councils continue to operate theirrefuse collection service as separate operational units based on their formerdistrict council areas. This can have the effect of councils:n operating a larger vehicle reserve fleet than may be necessaryn providing varying standards of service across their areasn operating different employee conditions of service.
Recommendation
All councils should ensure that they take steps, where appropriate, to:
• manage resources on a service-wide basis rather than on a discrete area basis
• review the scope for rationalising, vehicles, depots and other resources
• standardise the different practices and procedures inherited through local
government reorganisation, including employee conditions of service and the level of
service provision across their area.
Councils need to know the real cost of providing individual refuse collectionservices. Otherwise, they cannot make informed policy decisions about levels ofservice and prioritise the allocation of council resources. There are clear benefitsto councils in maintaining separate trading accounts and using activity costinginformation, for example:n setting charges to recover an appropriate level of costs, for commercial and
other chargeable collection servicesn ensuring that their commercial refuse service breaks even, and is not
subsidised by councils’ general fundsn making a case to councillors for an appropriate amount of council subsidy to
support expensive, but environmentally desirable services, eg, the separatecollection of material for recycling and reuse
n preparing option appraisals on the use of employee and vehicle resources,ensuring the best configuration of routes to minimise the total cost of refusecollection.
Recommendation
All councils should maintain separate trading accounts for their commercial refuse
collection services to ensure that they meet the requirement of aiming to recover the
full cost of the service. In addition, councils should consider developing activity costing
systems to enable them to know the real cost of providing individual refuse collection
services _ most particularly, the cost of separately collecting waste for recycling and
reuse.

Benchmarking refuse collection 29
Councils are expected to recover the full cost of collecting and disposing ofcommercial refuse through charges. But, not all councils do so. Councils haveto meet the cost of uplifting refuse where commercial premises avoid paymentof collection charges. This study has estimated that across Scotland, councils aresubsidising commercial refuse collection to an amount totalling some £9.7m a year.
In addition to charging for the collection of commercial refuse, councils havediscretion to reduce their costs by charging for the special uplift of bulkydomestic items. There is a significant variation in the income raised by councilsfrom charges and the amount of income raised by councils undertaking around20,000 uplifts a year ranges from nil to £140,000. Twelve councils do not chargefor the separate uplift of bulky household refuse.
Recommendations
Councils should review their charging policies for the collection of commercial refuse
and for chargeable collection services, eg, bulky uplifts. This will require councils to
assess the impact of charges on take-up of the service, the levels of indiscriminate
dumping of refuse and the use of civic amenity sites.
Councils should take steps to reduce the avoidance of payment of charges for
collecting commercial refuse.
The study has identified a number of areas where cost reductions are possible.Employee and vehicle resources are the largest components of refuse collectioncosts, and specific areas that warrant attention include:n management of sickness absence _ to reduce the time lost due to sickness
absence to below 5% for loaders and 4% for driversn review of bonus schemes _ to ensure that they continue to provide incentives
for higher productivityn review of route collection performance _ refuse collection managers should
use the benchmarking information provided to focus their review of routeperformance (see Appendix 3)
n review of refuse collection reserve fleet _ to achieve an optimal level ofreserve vehicles consistent with having sufficient back-up to support thefront-line fleet.
Recommendation
Councils should use the benchmarking information provided to identify areas where
performance should be improved.
Many councils assist householders in moving their wheeled bin to the kerbsidefor collection, by providing an assisted pull-out scheme. In some councils, onein ten people receive the assisted pull-out service, adding significantly to the costof service provision. The box over leaf describes the approach adopted by onecouncil, which has enabled it to provide an acceptable standard of service atreduced cost.
Benchmarking refuse collection3 0
Good practice example
North Ayrshire Council has successfully introduced a scheme where, in mostinstances, pull-outs are conducted on a fortnightly basis, halving the cost of theservice. This is possible because households eligible to receive the pull-out serviceare generally single occupants or people who are incapacitated due to age orinfirmity. For such households, a standard (240 litre) wheeled bin has sufficientcapacity to hold two weeks’ refuse.
Recommendation
Councils should review their policy on assisted pull-outs, including the criteria to be used
to determine entitlement to receive the service. The cost of implementing the adopted
policy should be assessed and take-up of the service should be regularly reviewed.
In response to Best Value, councils are giving an increased customer focus totheir services. Eighteen councils have conducted refuse collection surveys sincereorganisation. If the Landfill Directive targets are to be achieved, theimportance of consulting with users will increase as councils will be relying onall producers of waste (both domestic and commercial) to generate less wasteand to support councils in their recycling initiatives.
Recommendation
Councils need to continue to maintain close consultation with householders and
businesses in their area, encouraging them to reduce waste and to support the local
council in its recycling initiatives. Councils should use the results of consultation processes
to inform the development of their waste management strategies and mount publicity
campaigns to encourage waste minimisation.
An objective of the study was to develop a national framework of keyoperational indicators that refuse collection managers could use to monitor andbenchmark the performance of their service in the future. We have developed adraft framework and held discussions with refuse collection managers.However, at the time of producing this report, the framework had not beenfinalised and agreed. The study team will continue to work with refuse collectionmanagers and aims to complete this work in the near future.
Meeting environmental targetsThe widespread adoption of the wheeled bin method of collection has led tosignificant improvements in the efficiency of the refuse collection service over thepast ten years. However, this has also had the effect of increasing the overallamount of refuse collected by councils. This makes it more difficult for councilsto achieve, by 2006, the European Commission’s Landfill Directive target(reducing the amount of biodegradable household waste going to landfill sitesto 75% of the 1995 level).
The failure of councils to meet the year 2000 recycling target set by thegovernment in 1992, suggests a major shift in attitude is required if the newtargets are to be met. To date, a number of reasons have been offered bycouncils for the lack of progress. In the main, lower recycling levels relate to thewithdrawal by councils of costly separate collections of waste material forrecycling.

Benchmarking refuse collection 31
While some councils have made better progress than others, there remains asignificant gap between current levels of recycling and the levels likely to beneeded to meet the National Waste Strategy targets. This study has identifiedareas where councils themselves can take steps to help achieve these targets. Wesuggest that:n councils should give waste management a higher profile _ if councils are to
meet recycling and landfill targets, they will have to give waste management ahigher priority. This will involve working in partnership with other councilsand agencies, and allocating sufficient funding to support more expensive, butenvironmentally desirable, collection and recycling activities
n councils should invest efficiency savings and additional income to help meet
environmental targets _ the study has shown that councils have already takensignificant steps to improve service efficiency. Nevertheless, scope remains tomake service improvements, most particularly in the areas of vehicle andemployee resources. However, the amount of money that could be saved forreinvestment in the service is unlikely to be more than 5% _ about £5 millionacross all councils in Scotland. Significant scope exists for councils to increasethe amount of income raised from charges, most particularly for thecollection of commercial refuse.
n councils should take the lead in promoting the minimisation of
environmental waste in their area _ the Waste Minimisation Act 1999confirmed council powers to expend money on waste minimisation activities.Ways in which this can be done include:_ ensuring waste minimisation in their own activities and by reusing waste_ conducting waste awareness campaigns, encouraging the public and
businesses to support waste minimisation and recycling initiatives in their area_ changing the culture and attitude of the public towards support for
recycling initiatives, through piloting and promoting innovative schemes.Public attitudes to waste minimisation and recycling also need to change.Only 15% of people in Scotland use recycling facilities at least once a week,but 43% of the population (43%) never do so15
_ providing the public with ready access to recycling facilities (eg, bottlebanks, civic amenity sites, etc)
_ participating in disposal schemes that add value by making use of wastebefore final disposal (eg, incineration with energy recovery through thegeneration of electricity)
_ encouraging householders to compost suitable household and gardenwaste. While most councils dispose of garden refuse in landfill sites, somecouncils have been able to remove garden refuse from the waste stream bycomposting. The box below describes one such scheme.
Good practice example
Perth & Kinross Council provides skips for green garden waste at its civic amenitysites. A private contractor then composts the waste. Some of this compost is thensold at civic amenity sites. To encourage recycling, members of the public receive afree ticket for a monthly prize draw for a mountain bike each time they bringgreen waste to the site. In 1998/99 over 4,000 tonnes of green garden wastewere collected. This initiative has saved the council £22,000 (avoided disposal costsand income from the sale of compost) and reduced the amount of biodegradablewaste going to landfill.
1 5 Scottish Household Survey, 1999.
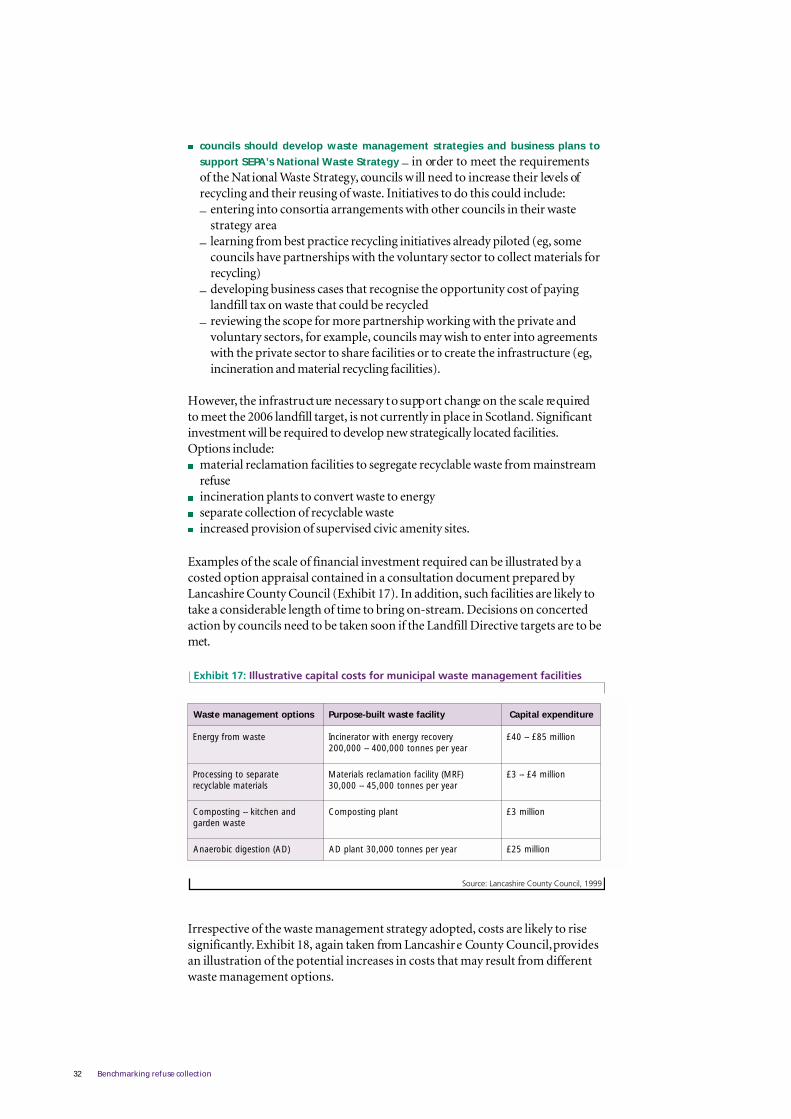
Benchmarking refuse collection
snoitpotnemeganametsaW ytilicafetsawtliubesopruP erutidnepxelatipaC
etsawmorfygrenE yrevocerygrenehtiwrotarenicnIraeyrepsennot000,004-000,002
noillim58£ot04£
etarapesotgnissecorPslairetamelbalcycer
)FRM(ytilicafnoitamalcerslairetaMraeyrepsennot000,54ot000,03
noillim4£ot3£
dnanehctik-gnitsopmoCetsawnedrag
tnalpgnitsopmoC noillim3£
)DA(noitsegidciboreanA raeyrepsennot000,03tnalpDA noillim52£
���������(��'����������� ���� ���������)��� ��������)���)����� �������
����������� ���!����"�!������1��666
n councils should develop waste management strategies and business plans to
support SEPA’s National Waste Strategy _ in order to meet the requirementsof the Nat ional Waste Strategy, councils will need to increase their levels ofrecycling and their reusing of waste. Initiatives to do this could include:_ entering into consortia arrangements with other councils in their waste
strategy area_ learning from best practice recycling initiatives already piloted (eg, some
councils have partnerships with the voluntary sector to collect materials forrecycling)
_ developing business cases that recognise the opportunity cost of payinglandfill tax on waste that could be recycled
_ reviewing the scope for more partnership working with the private andvoluntary sectors, for example, councils may wish to enter into agreementswith the private sector to share facilities or to create the infrastructure (eg,incineration and material recycling facilities).
However, the infrastructure necessary to support change on the scale requiredto meet the 2006 landfill target, is not currently in place in Scotland. Significantinvestment will be required to develop new strategically located facilities.Options include:n material reclamation facilities to segregate recyclable waste from mainstream
refusen incineration plants to convert waste to energyn separate collection of recyclable wasten increased provision of supervised civic amenity sites.
Examples of the scale of financial investment required can be illustrated by acosted option appraisal contained in a consultation document prepared byLancashire County Council (Exhibit 17). In addition, such facilities are likely totake a considerable length of time to bring on-stream. Decisions on concertedaction by councils need to be taken soon if the Landfill Directive targets are to bemet.
Irrespective of the waste management strategy adopted, costs are likely to risesignificantly. Exhibit 18, again taken from Lancashire County Council, providesan illustration of the potential increases in costs that may result from differentwaste management options.
32
snoitpotnemeganametsaW ytilicafetsawtliub-esopruP erutidnepxelatipaC
etsawmorfygrenE yrevocerygrenehtiwrotarenicnI000,002 -- raeyrepsennot000,004
04£ -- noillim58£
etarapesotgnissecorPslairetamelbalcycer
)FRM(ytilicafnoitamalcerslairetaM000,03 -- raeyrepsennot000,54
3£ -- noillim4£
gnitsopmoC -- dnanehctiketsawnedrag
tnalpgnitsopmoC noillim3£
)DA(noitsegidciboreanA raeyrepsennot000,03tnalpDA noillim52£
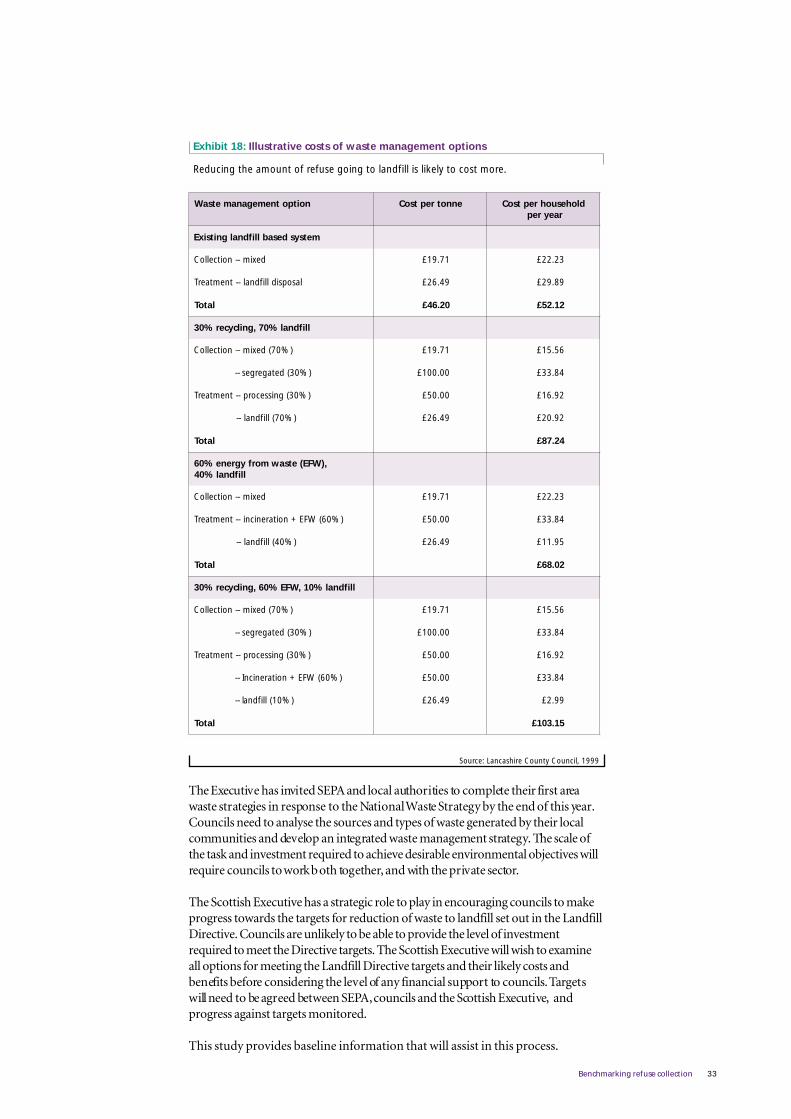
Benchmarking refuse collection
noitpotnemeganametsaW ennotrepecirP dlohesuohreptsoCraeyrep
metsysdesabllifdnalgnitsixE
noitcelloC -- dexim 17.91£ 32.22£
tnemtaerT -- lasopsidllifdnal 94.62£ 98.92£
latoT 02.64£ 21.25£
llifdnal%07,gnilcycer%03
noitcelloC -- %07dexim 17.91£ 65.51£
-- )%03(detagerges 00.001£ 48.33£
tnemtaerT -- %03gnissecorp 00.05£ 29.61£
-- %07llifdnal 94.62£ 29.02£
latoT 42.78£
,)WFE(etsawmorfygrene%06llifdnal%04
noitcelloC -- dexim 17.91£ 32.22£
tnemtaerT -- )%06(WFE+noitarenicni 00.05£ 48.33£
-- )%04(llifdnal 94.62£ 59.11£
latoT 20.86£
llifdnal%01,WFE06,gnilcycer%03
noitcelloC -- )%07(dexim 17.91£ 65.51£
-- )%03(detagerges 00.001£ 48.33£
tnemtaerT -- )%03(gnissecorp 00.05£ 29.61£
-- )%06(WFE+noitarenicnI 00.05£ 48.33£
l-- )%01(llifdna 94.62£ 99.2£
latoT 51.301£
Exhibit 18: Illustrative costs of waste management options
Source: Lancashire County Council, 1999
Reducing the amount of refuse going to landfill is likely to cost more.
The Executive has invited SEPA and local authorities to complete their first areawaste strategies in response to the National Waste Strategy by the end of this year.Councils need to analyse the sources and types of waste generated by their localcommunities and develop an integrated waste management strategy. The scale ofthe task and investment required to achieve desirable environmental objectives willrequire councils to work both together, and with the private sector.
The Scottish Executive has a strategic role to play in encouraging councils to makeprogress towards the targets for reduction of waste to landfill set out in the LandfillDirective. Councils are unlikely to be able to provide the level of investmentrequired to meet the Directive targets. The Scottish Executive will wish to examineall options for meeting the Landfill Directive targets and their likely costs andbenefits before considering the level of any financial support to councils. Targetswill need to be agreed between SEPA, councils and the Scottish Executive, andprogress against targets monitored.
This study provides baseline information that will assist in this process.
33
noitpotnemeganametsaW ennotreptsoC dlohesuohreptsoCraeyrep
metsysdesabllifdnalgnitsixE
noitcelloC -- dexim 17.91£ 32.22£
tnemtaerT -- lasopsidllifdnal 94.62£ 98.92£
latoT 02.64£ 21.25£
llifdnal%07,gnilcycer%03
noitcelloC -- )%07(dexim 17.91£ 65.51£
-- )%03(detagerges 00.001£ 48.33£
tnemtaerT -- )%03(gnissecorp 00.05£ 29.61£
-- )%07(llifdnal 94.62£ 29.02£
latoT 42.78£
,)WFE(etsawmorfygrene%06llifdnal%04
noitcelloC -- dexim 17.91£ 32.22£
tnemtaerT -- )%06(WFE+noitarenicni 00.05£ 48.33£
-- )%04(llifdnal 94.62£ 59.11£
latoT 20.86£
llifdnal%01,WFE%06,gnilcycer%03
noitcelloC -- )%07(dexim 17.91£ 65.51£
-- )%03(detagerges 00.001£ 48.33£
tnemtaerT -- )%03(gnissecorp 00.05£ 29.61£
-- )%06(WFE+noitarenicnI 00.05£ 48.33£
l-- )%01(llifdna 94.62£ 99.2£
latoT 51.301£

Appendix 1: Membership ofstudy advisory group
Karen Anderson, Contracts Manager, West Lothian Council
John Crawford, Head of Protective Services, East Ayrshire Council
Euan Dobson, Policy Officer, COSLA
David Dorward, Director of Finance, Dundee City Council
John Ferguson, Policy Advisor (Waste), SEPA
Robert O’Neill, Depute Director, Cleansing Services, Glasgow City Council
John Summers, Director, Keep Scotland Beautiful
Blair Thompson, Cleansing and Transport Manager, South Ayrshire Council
34 Benchmarking refuse collection
Benchmarking refuse collection
Appendix 2: The COMPAREsoftware and refuse collectionindicators
The COMPARE softwareCOMPARE is a software tool initial ly developed by the Audit Commission andused by Audit Scotland by agreement with the Audit Commission. Its purpose isto assist auditors and audited bodies to analyse benchmarking information.The following exhibits describe the refuse collection operational indicators madeavailable to each council.
35

Exhibit 1: The COMPARE indicator map for council refuse collection services
gnidaehpaM rotacidnI
stsoCssorG
maertsniaM tfilpurepnoitcellocesufermaertsniamfotsocssorG
detcellocennotrepnoitcellocesufermaertsniamfotsocssorG
devresytreporprepnoitcellocesufermaertsniamfotsocssorG
citsemoD detcellocennotrepnoitcellocesufercitsemodfotsocssorG
tfilpurepnoitcellocesufercitsemodfotsocssorG
devresytreporprepnoitcellocesufercitsemodfotsocssorG
citsemod-noN detcellocennotrepnoitcellocesufercitsemod-nonfotsocssorG
devresytreporprepnoitcellocesufercitsemod-nonfotsocssorG
snoitcellocetarapeSennotrepgnilcycerrofslairetamfonoitcellocetarapesfotsocssorG
detcelloc
devresytreporprepsnoitcellocetarapesfotsocssorG
stfilpulaicepS tfilpulaiceps/yklubreptsocssorG
stsocfonwodkaerB
llarevO otnistsocfonwodkaerB s stsocrehtodnaseilppus,selcihev,ffat
)sdaehrevo,segrahclatipac,ytreporp(stsocrehtofonwodkaerB
devresytreporpreplasopsiddnanoitcellocesuferfotsocssorG
ffatS detcellocennotreplasopsiddnaesuferfotsocssorG
noitcellocesuferfotsocssorgfoegatnecrepasatsocffatS
devresytreporpreptsocffatS
selciheV noitcellocesuferfotsocssorgfonoitroporpasastsocelciheV
devresytreporprepstsocelciheV
lanoitarepodnaecnanifdna,segrahcnaolgnidulcxe(tsocelciheVstsocelcihevfoegatnecrepasa)segrahcgnisael
sasegrahcgnisaellanoitarepodnaecnanifdna,segrahcecnanifelciheVegatnecrepa fo stsocelcihev
secivresdnaseilppuS noitcellocesuferfotsocssorgfoegatnecrepasasecivresdnaseilppuS
devresytreporpreptsocsecivresdnaseilppuS
sdaehrevO(sdaehrevO d lartnecdnastsoctneilc,sesnepxenoitartsinimdatceri
devresytreporprep)stsoctroppus
devresytreporpreptsoctroppuslartneC
emocnI emocnifosecruosniaM
esuferfotsocssorgfonoitroporpasadesserpxe(segrahcmorfemocnI)noitcelloc
fonoitroporpasaecivresnoitcellocesuferlaicremmocmorfemocnInoitcelloclaicremmocfotsoc
lasopsidesufer/noitcellocesuferotdetacollaemocnilatotfonoitroporP
derevoceresufercitsemodyklubgnitfilpufotsocssorgfonoitroporPsegrahchguorht
36 Benchmarking refuse collection

noitamrofniecivreS
ycneiciffeecivreS keewrepredaolrepstisivecivresegarevA
keewrepelcihevrepstisivecivresegarevA
munnarepelcihevrepstfilpuforebmunegarevA
dnamaertsniam(munnarepVCRrepdetcellocegannotegarevAteelfenil-tnorfrof)stfilpulaiceps.cnisnoitcellocetarapes
stisivecivreS seitreporpcitsemodrofkeewrepstisivecivresforebmunegarevA
seitreporpcitsemod-nonrofkeewrepstisivecivresforebmunegarevA
-snoitcellocetarapesrofkeewrepstisivecivresforebmunegarevAcitsemod
-snoitcellocetarapesrofkeewrepstisivecivresforebmunegarevAcitsemod-non
citsemod-stfilpulaicepsrofkeewrepstisivecivresforebmunegarevA
ytilauqecivreS emehcstuo-llupdetsissanoseitreporpcitsemodfoegatnecreP
noitalupop000,1rep,keewhcaenoisivorpytinemacivicfosruoH
seitreporpfonoitroporpasastnialpmocecivresforebmunlatoTdevres
devresseitreporpfonoitroporpasasllactaeperforebmunlatoT
tseuqerfosyad5nihtiwtuodeirracstfilpulaicepsfonoitroporP
yevrusremotsuctsalfoetaD
deganamegannoT munnarepdetcellocetsawlacinilcfoegannoT
munnarepdetcellocetsawsuodrazahfoegannoT
esuferfosecruosehtfonwodkaerB
esuferlatotfoegatnecrepasadesserpxeetsawrehtodnaetsawdaoRdeganam
delcyceresufermaertsniamfoegatnecreP
delcycernoitcellocetarapesfoegatnecreP
foegatnecreP c delcycersetisytinemacivi
noitamrofnigniffatS
gniwerCstnemegnarra
setuordenibmocdnalaicremmoc/citsemodrofstnemegnarragniwerCsredaol5ro4,3,2,1,0+revirD-)slatot(
ecnesbassenkciS )srevirD(yrujnilairtsudni/ssenkcisoteudtsolsyadfoegatnecreP
)sredaoL(yrujnilairtsudni/ssenkcisoteudtsolsyadfoegatnecreP
sunobdnaemitrevO yapcisabfonoitroporpasadiapsunobegarevA
)sruoh(keewgnikrowlamroN
)srevird(emitrevoegarevA
)sredaol(emitrevoegarevA
srebmunffatS ffatsfoepytybsrebmunffatsfonwodkaerB
noitamrofniteelfelciheV
selcihevfoepytybselcihevnoitcellocesuferfonwodkaerB
teelflatotfoegatnecrepasateelfevreseR
37Benchmarking refuse collection
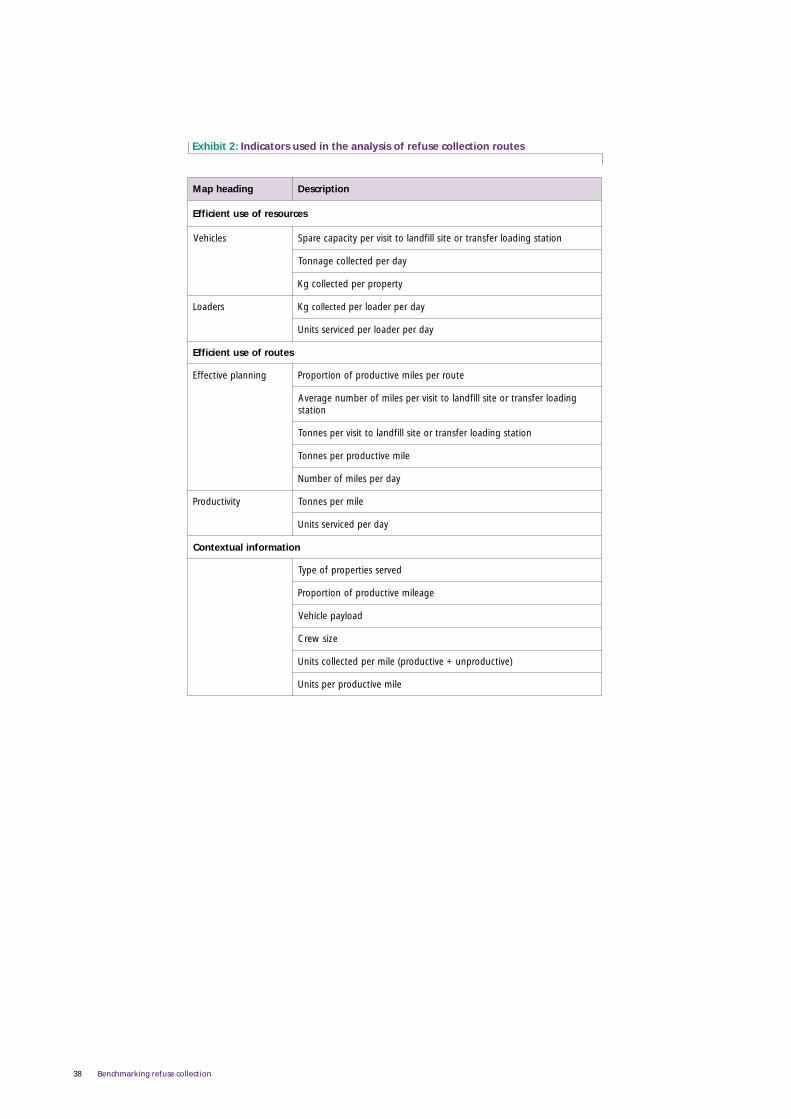
gnidaehpaM noitpircseD
secruoserfoesutneiciffE
selciheV noitatsgnidaolrefsnartroetisllifdnalottisivrepyticapacerapS
yadrepdetcellocegannoT
ytreporprepdetcellocgK
sredaoL gK detcelloc yadrepredaolrep
yadrepredaolrepdecivresstinU
setuorfoesutneiciffE
gninnalpevitceffE etuorrepselimevitcudorpfonoitroporP
gnidaolrefsnartroetisllifdnalottisivrepselimforebmunegarevAnoitats
noitatsgnidaolrefsnartroetisllifdnalottisivrepsennoT
elimevitcudorprepsennoT
yadrepselimforebmuN
ytivitcudorP elimrepsennoT
yadrepdecivresstinU
noitamrofnilautxetnoC
devresseitreporpfoepyT
egaelimevitcudorpfonoitroporP
daolyapelciheV
eziswerC
)evitcudorpnu+evitcudorp(elimrepdetcellocstinU
elimevitcudorprepstinU
Exhibit 2: Indicators used in the analysis of refuse collection routes
38 Benchmarking refuse collection

Benchmarking refuse collection
Council family groupsWhen benchmarking performance among councils, it is important that thecomparisons are made are on a like-for-like basis. The creation of familygroups of councils having similar circumstances can be very helpful in thisregard. Family groups may be used to make realistic estimates of theimprovements in performance that may be feasible. However, it must beemphasised that the family groups developed for this study are not intended tobe definitive. Councils may wish to derive other relevant groupings for theirown benchmarking purposes.
We have used two factors to create the family groups; they are based mainly onthe population dispersion and, to a lesser extent, the number of propertiesserved.n Population dispersion _ measures the degree to which a population is spread
across the council’s area. This is considered to be an important determinantin services that have a significant transport component, such as refusecollection. The Scottish Executive’s Central Research Unit provided thisinformation.
n Number of households _ measures the scale of the service provided. This isimportant where there may be economies of scale (as, for example, in the levelof refuse collection reserve fleets).
Appendix 3: Family groups
39

Benchmarking refuse collection
We created three main groups (Exhibit 3), numbered 1-3, each of which aresub-divided into two smaller groups (a and b). Users would normally use thelarger groups for initial comparisons, but may wish to use the smaller groupswhere more detailed analysis is required. Refuse collection managers haveaccepted these groupings as providing a reasonable basis for makingcomparisons.
Exhibit 3: Family Groups for refuse collection
Note: *Highland Council has a highly dispersed population and can reasonably be included in either group.
slicnuoclaruR1puorG slicnuoCdexiM2puorG slicnuocnabrU3puorG
yreV)aylhgih
desrepsid
ylhgiH)bdesrepsid
ylniaM)alarur
ylniaM)bnabru
ylthgilS)adesrepsid
ytiC)bslicnuoc ton(
)desrepsid
raiSnaeliEhsittocSsredroB
sugnAtsaE
erihswerfneRerihswerfneR needrebA
ytiC
yenkrOsdnalsI
&htrePssorniK
yaroM edylcrevnI kriklaFfoytiC
hgrubnidE
dnaltehSsdnalsI
erihsneedrebAhtuoSerihsryA
naihtoldiMtsaE
erihsnotrabnuDytiCeednuD
etuB&llygrA *dnalhgiHhtroNerihsryA
naihtoLtseWhtroN
erihskranaL ytiCwogsalG
*dnalhgiH&seirfmuDyawollaG
erihsryAtsaE efiFtseW
erihsnotrabnuD
naihtoLtsaEhtuoS
erihskranaL
gnilritS-nannamkcalC
erihs
Route performance family groupsIn addition to collecting information at a council level, benchmarking data hasalso been collected for core mainstream collection routes. Routes have beencategorised into 13 groups based on:n collection methodn ‘density’ of the location of properties served by each routen proportion of commercial, tenement and multi-storey properties included in
combined domestic/non-domestic collection routes.
The wheeled bin method of collection is the predominant method used bycouncils and this allowed the study team to develop performance benchmarksfor nine different groups of wheeled bin routes.
40

Benchmarking refuse collection
Because few councils supplied details of the productive route mileage (thedistance from the first collection point to the last collection point, excluding alltrips to interim or final disposal points and trips to the depot), the propertydensity is calculated using the total route mileage including trips to and fromthe depot and disposal points. The actual property density for each family group,therefore, will be considerably higher than that shown in the tables below.
a: Wheeled bin routes
41
b: Other collection method routes
Exhibit 4 shows the profile of high-, medium-, and low-property density routesacross councils. As would be expected, the proportion of each type of routereflects the sparsity of the council population, with most councils having amixture of route types. Councils can use this information to identify othercouncils that operate similar types of routes. For example, urban routes inpredominantly rural councils can be compared with other, similar urban routesin all councils.
seitreporpyerots-itlum&laicremmocfoegatnecreP
seitreporpcitsemoDelimetuorrep
woL)%9.0nahtssel(
muideM)%9.9-%9.0(
hgiH)%9.9nahterom(
)72revo(hgiH 1puorgylimaF 2puorgylimaF 3puorgylimaF
)72-5(muideM 4puorgylimaF 5puorgylimaF 6puorgylimaF
)5nahtssel(woL 7puorgylimaF 8puorgylimaF 9puorgylimaF
01puorgylimaF .ytisnedytreporphgih,)snibdnaskcas(noitcellocedisbreK
11puorgylimaF .ytisnedytreporpwol,)snibdnaskcas(noitcellocedisbreK
21puorgylimaFfonoitcellocetarapesei(setuoresuferlaicremmocylniaM
.)esuferedart/laicremmoc
31puorgylimaF .noitcellocrood-kcaB
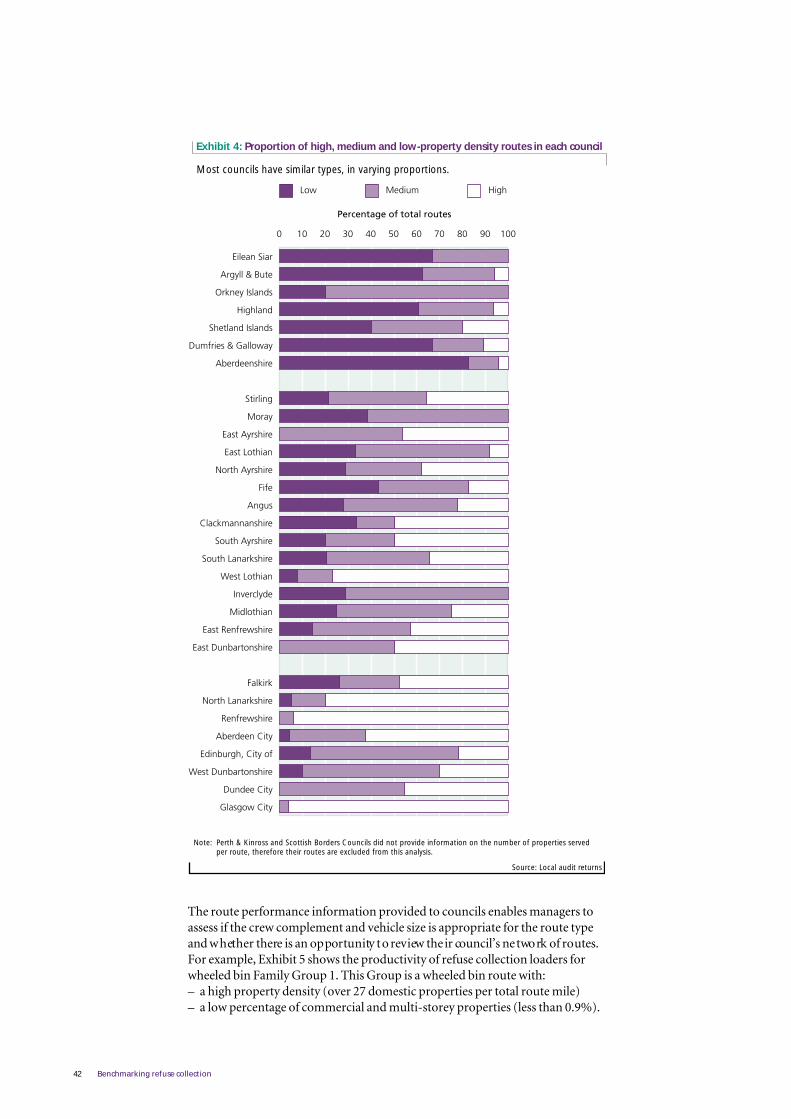
Benchmarking refuse collection
Source: Local audit returns
Note: Perth & Kinross and Scottish Borders Councils did not provide information on the number of properties servedper route, therefore their routes are excluded from this analysis.
Exhibit 4: Proportion of high, medium and low-property density routes in each council
Most councils have similar types, in varying proportions.
The route performance information provided to councils enables managers toassess if the crew complement and vehicle size is appropriate for the route typeand whether there is an opportunity to review their council’s network of routes.For example, Exhibit 5 shows the productivity of refuse collection loaders forwheeled bin Family Group 1. This Group is a wheeled bin route with:_ a high property density (over 27 domestic properties per total route mile)_ a low percentage of commercial and multi-storey properties (less than 0.9%).
42
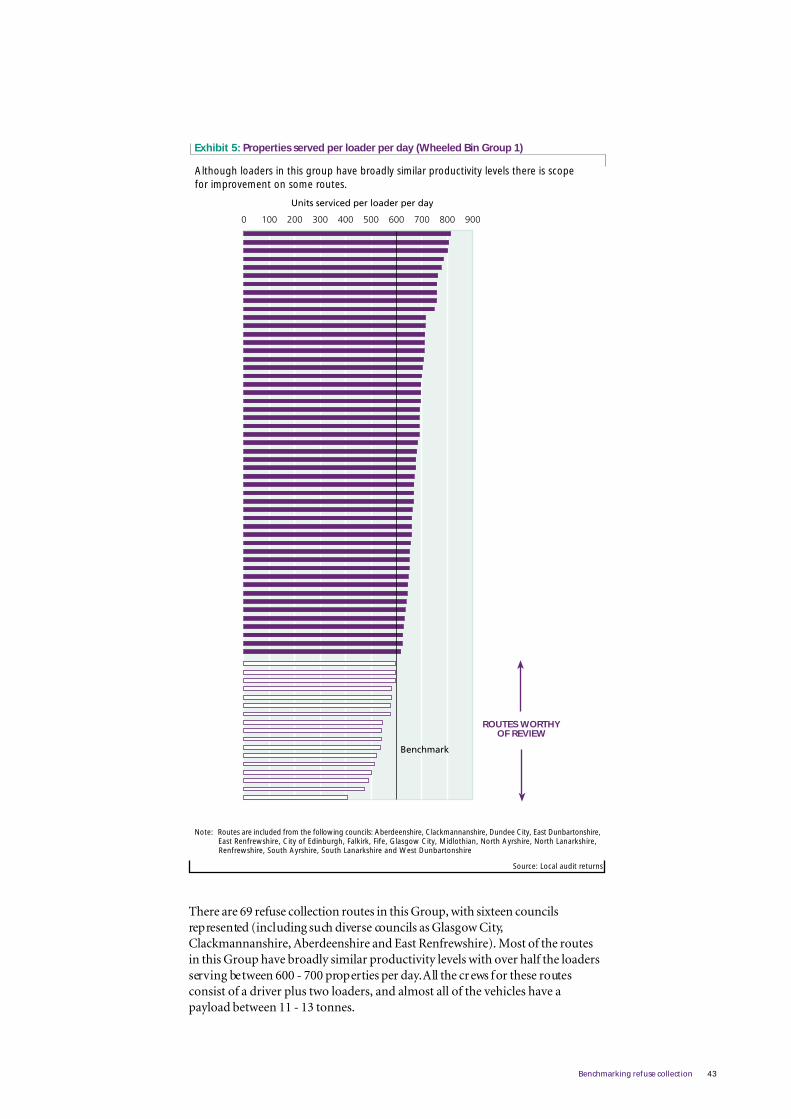
Benchmarking refuse collection
Source: Local audit returns
Note: Routes are included from the following councils: Aberdeenshire, Clackmannanshire, Dundee City, East Dunbartonshire,East Renfrewshire, City of Edinburgh, Falkirk, Fife, Glasgow City, Midlothian, North Ayrshire, North Lanarkshire, Renfrewshire, South Ayrshire, South Lanarkshire and West Dunbartonshire
Exhibit 5: Properties served per loader per day (Wheeled Bin Group 1)
Although loaders in this group have broadly similar productivity levels there is scopefor improvement on some routes.
There are 69 refuse collection routes in this Group, with sixteen councilsrepresented (including such diverse councils as Glasgow City,Clackmannanshire, Aberdeenshire and East Renfrewshire). Most of the routesin this Group have broadly similar productivity levels with over half the loadersserving between 600 - 700 properties per day. All the crews for these routesconsist of a driver plus two loaders, and almost all of the vehicles have apayload between 11 - 13 tonnes.
43
ROUTES WORTHYOF REVIEW


18 GEORGE STREET EDINBURGH EH2 2QU
T 0131 477 1234 F 0131 477 4567
www.audit-scotland.gov.uk
ISBN 1 903433 01 0


