42
BENCHMARKING RESOURCE PLAYS Implications for Exploitation & Development Mike Seifert, P. Geol. Canadian Discovery Ltd. February 15, 2012

BENCHMARKING RESOURCE PLAYSImplications for Exploitation & Development
Mike Seifert, P. Geol.Canadian Discovery Ltd.
February 15, 2012

AGENDA IntroductionWhat is a Resource PlayBenchmarking Process
Western Canada Overview Montney Slave Point Integrated Analysis: Carrot Creek and Rat Creek

WHAT IS A RESOURCE PLAY?“A 'play' is a family of pools and/or prospects that share a commonhistory of hydrocarbon generation, migration, reservoir developmentand trap configuration.
A RESOURCE PLAY is a special category of play which impliesthe use, or potential use, of advanced drilling and/or completiontechnology to make it economic.
Although specific wells may be exceptions, generally speaking aRESOURCE PLAY is deemed to be historically uneconomic on aregional basis without the use of advanced technology.”
Ed Fogg, Canadian Discovery Ltd.

RESOURCE PLAY DEFINITIONRequires Extensive Stimulation to
Produce Produces Little In-situ Water Does Not Exhibit an Obvious Seal or Trap Low Matrix Permeability (< 0.1 mD)
SPEE Monograph 3“Guidelines For The Practical Evaluation of Undeveloped Reserves in Resource Plays”

WHY BENCHMARK?
Internal AnalysisCompetitor AnalysisTechnologies and MethodologiesLogisticsAcquisition & DivestituresFinancial Metrics
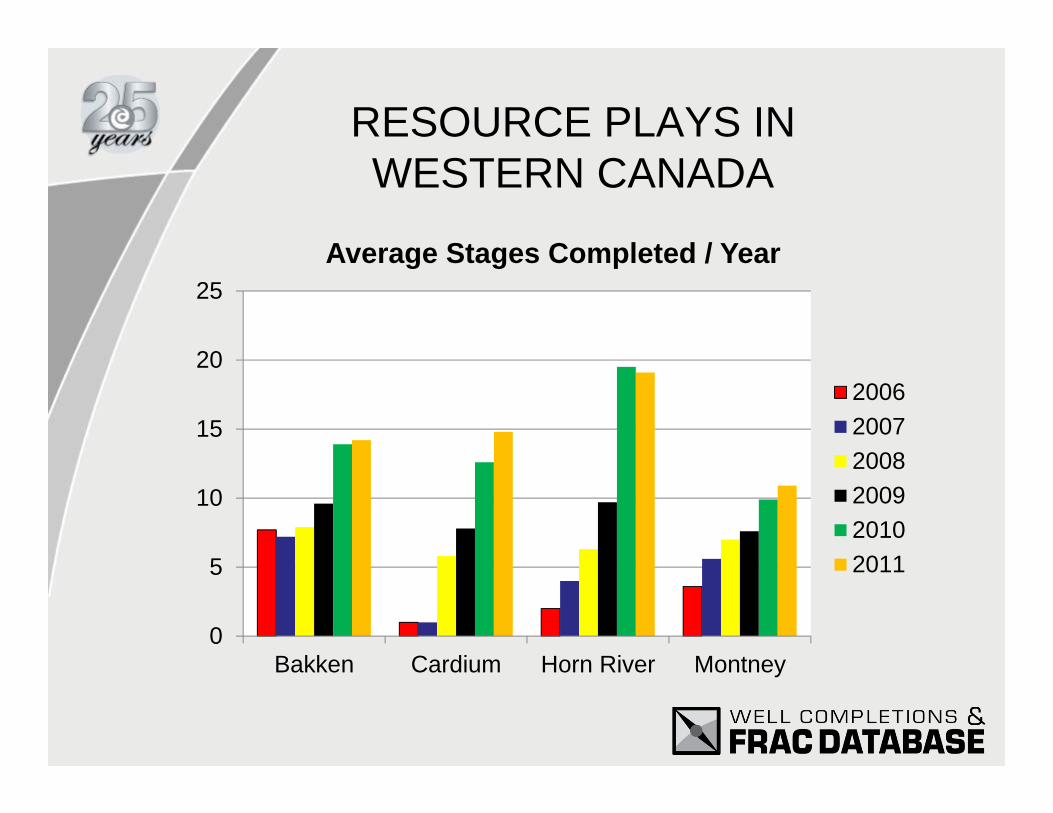
0
5
10
15
20
25
Bakken Cardium Horn River Montney
Average Stages Completed / Year
200620072008200920102011
RESOURCE PLAYS INWESTERN CANADA
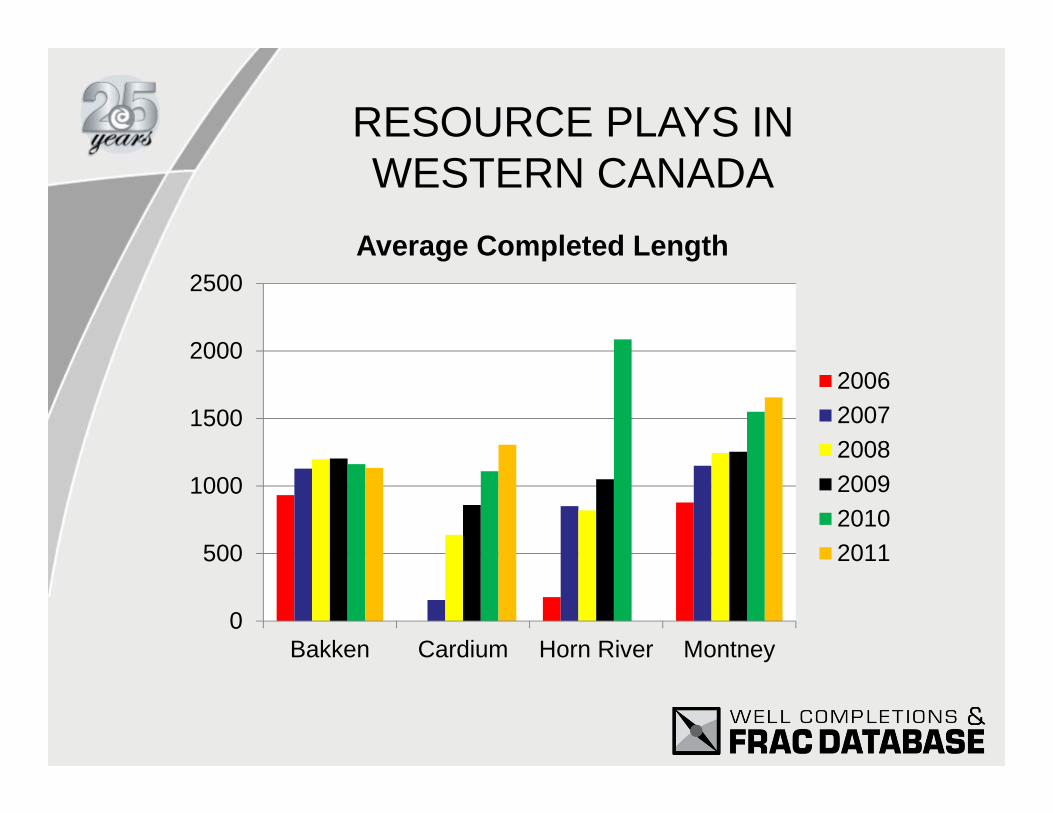
0
500
1000
1500
2000
2500
Bakken Cardium Horn River Montney
Average Completed Length
200620072008200920102011
RESOURCE PLAYS INWESTERN CANADA
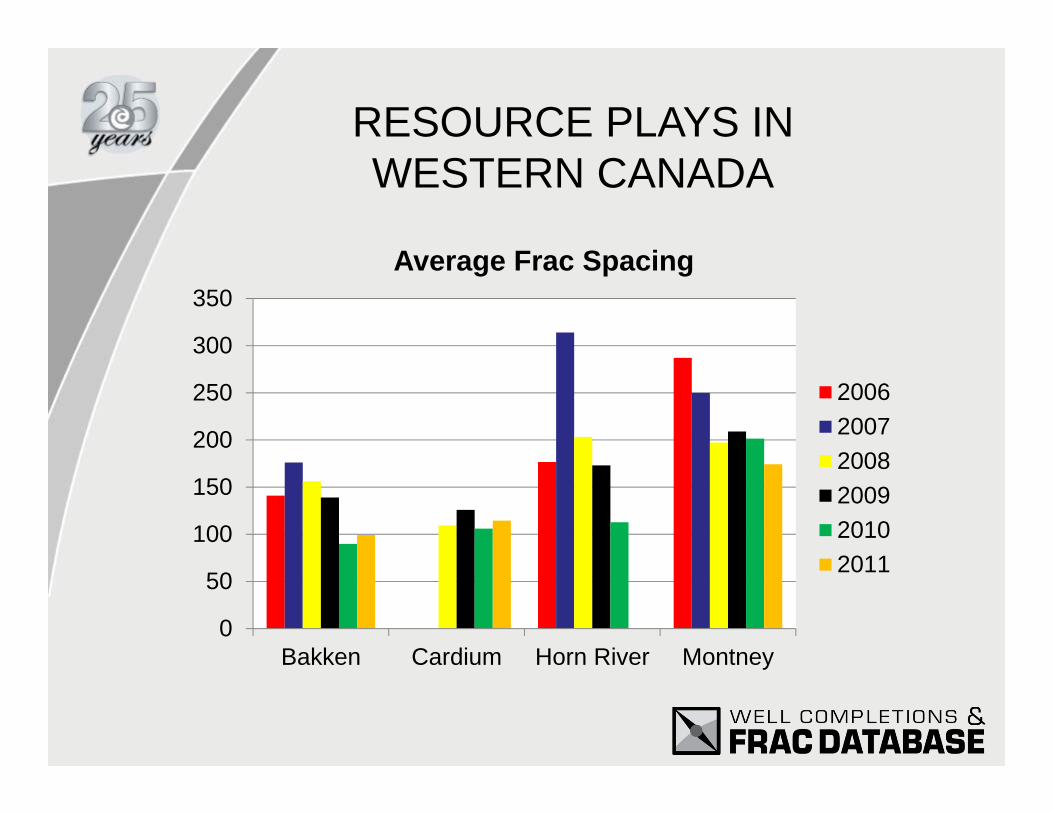
0
50
100
150
200
250
300
350
Bakken Cardium Horn River Montney
Average Frac Spacing
200620072008200920102011
RESOURCE PLAYS INWESTERN CANADA
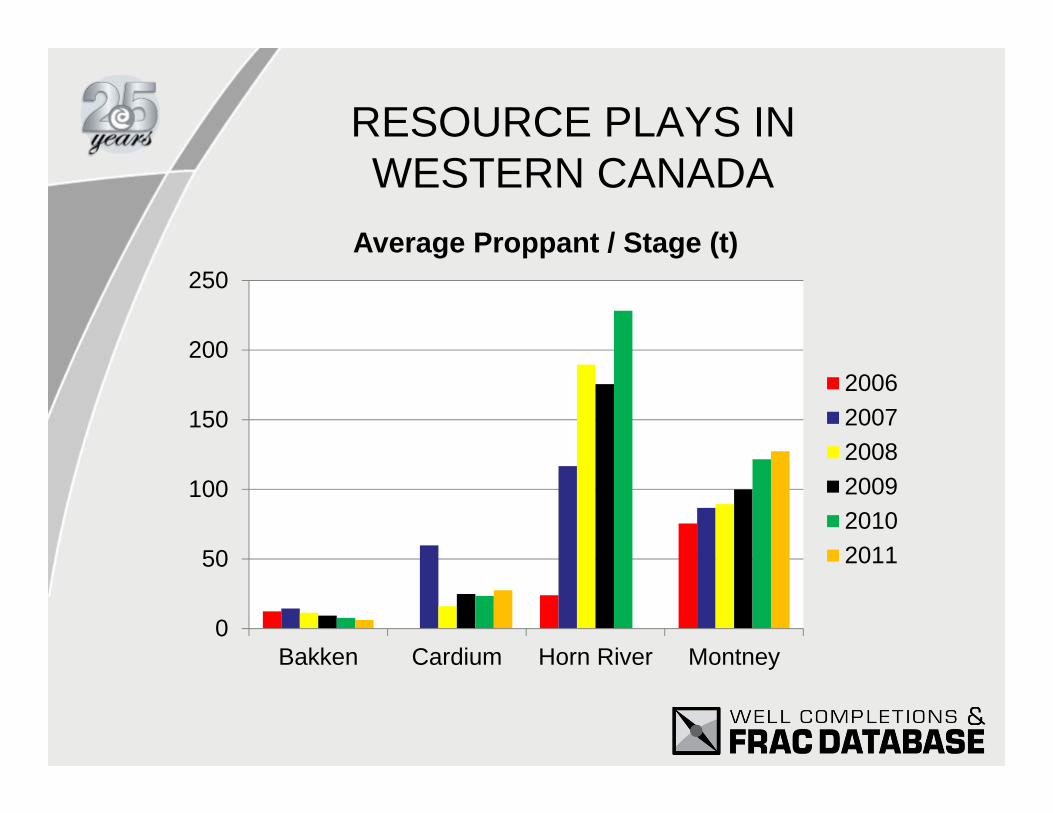
0
50
100
150
200
250
Bakken Cardium Horn River Montney
Average Proppant / Stage (t)
200620072008200920102011
RESOURCE PLAYS INWESTERN CANADA
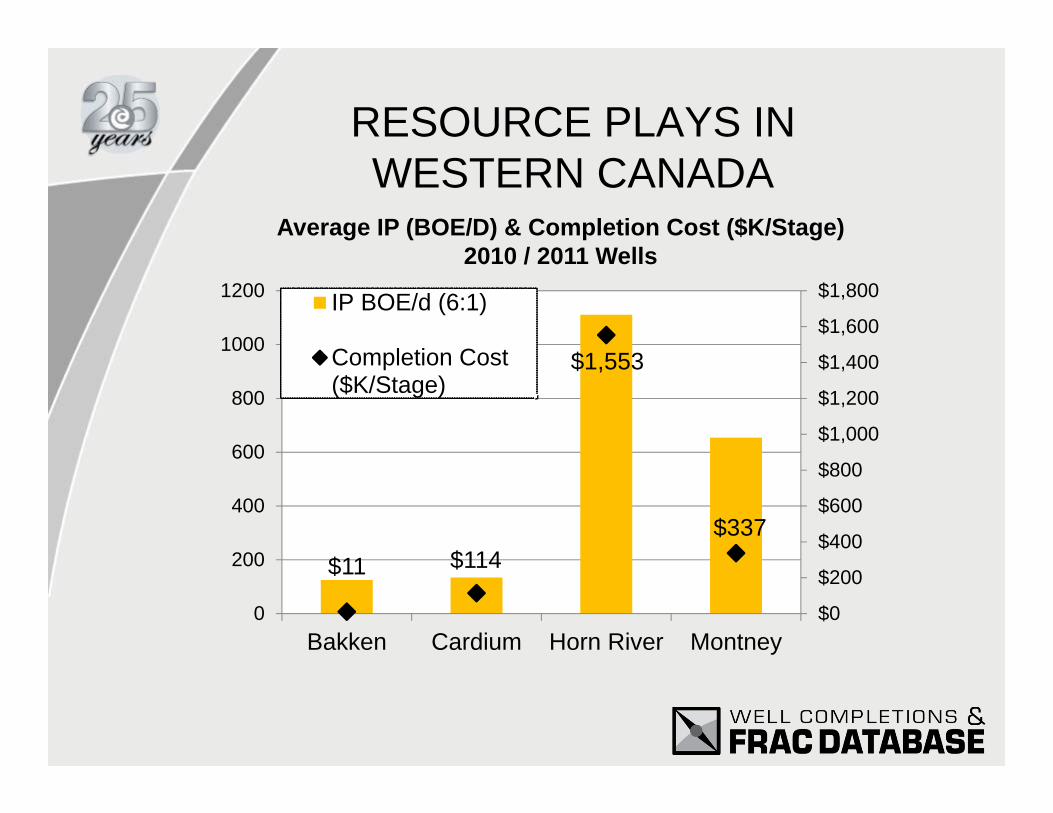
$11 $114
$1,553
$337
$0
$200
$400
$600
$800
$1,000
$1,200
$1,400
$1,600
$1,800
0
200
400
600
800
1000
1200
Bakken Cardium Horn River Montney
IP BOE/d (6:1)
Completion Cost($K/Stage)
Average IP (BOE/D) & Completion Cost ($K/Stage)2010 / 2011 Wells
RESOURCE PLAYS INWESTERN CANADA

0
1,000
2,000
3,000
4,000
5,000
6,000
2008 2009 2010 2011
Num
ber o
f Wells
Year
Horn River GasMontney/Doig GasMontney/Doig OilDeep Basin GasSlave Point/Swan Hills OilGlauconitic Hoadley GasCardium OilViking OilShaunavon OilBakken/Torquay OilSpearfish/Amaranth OilEmerging OilEmerging Gas
3,860
5,041
1,7531,922
Number of Wells by Resource Play Group
0
1,000
2,000
3,000
4,000
5,000
6,000
7,000
8,000
2008 2009 2010 2011
Completion Co
st (m
illion $)
Year
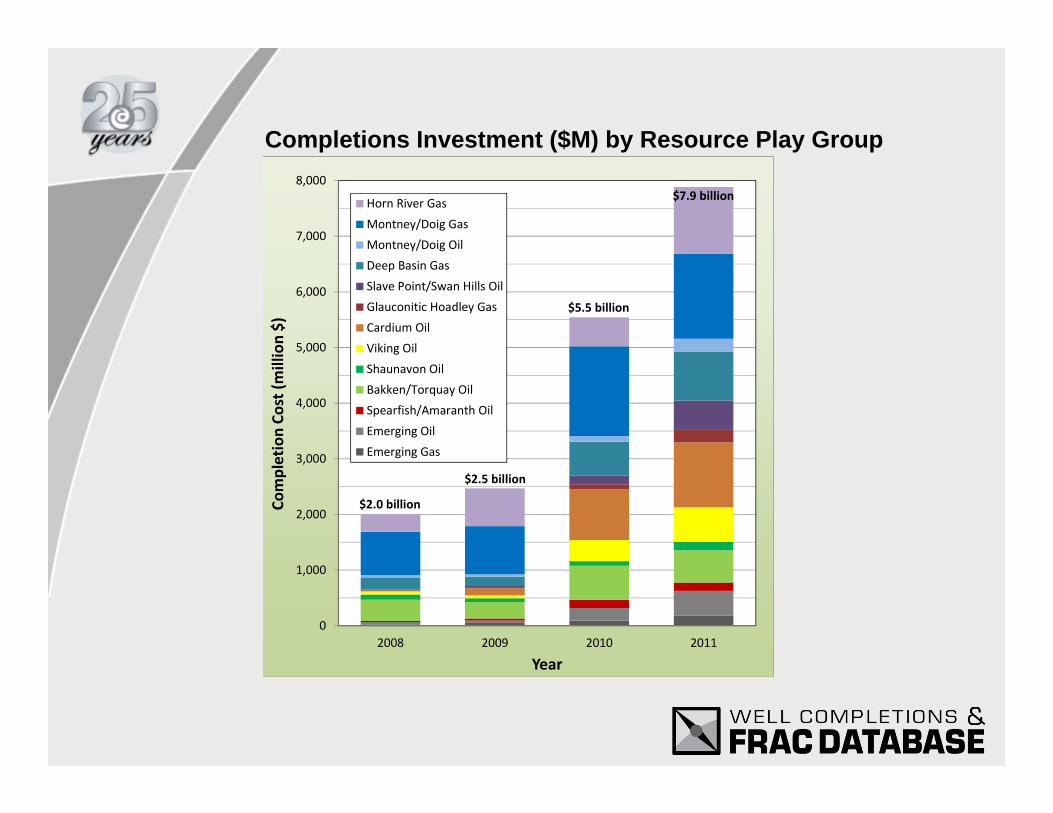
Horn River GasMontney/Doig GasMontney/Doig OilDeep Basin GasSlave Point/Swan Hills OilGlauconitic Hoadley GasCardium OilViking OilShaunavon OilBakken/Torquay OilSpearfish/Amaranth OilEmerging OilEmerging Gas
$5.5 billion
$7.9 billion
$2.5 billion
$2.0 billion
Completions Investment ($M) by Resource Play Group
Increasing StagesIncreasing Well LengthDecreasing Frac SpacingProppantBakken DecreasingMontney Increasing
RESOURCE PLAYS INWESTERN CANADA
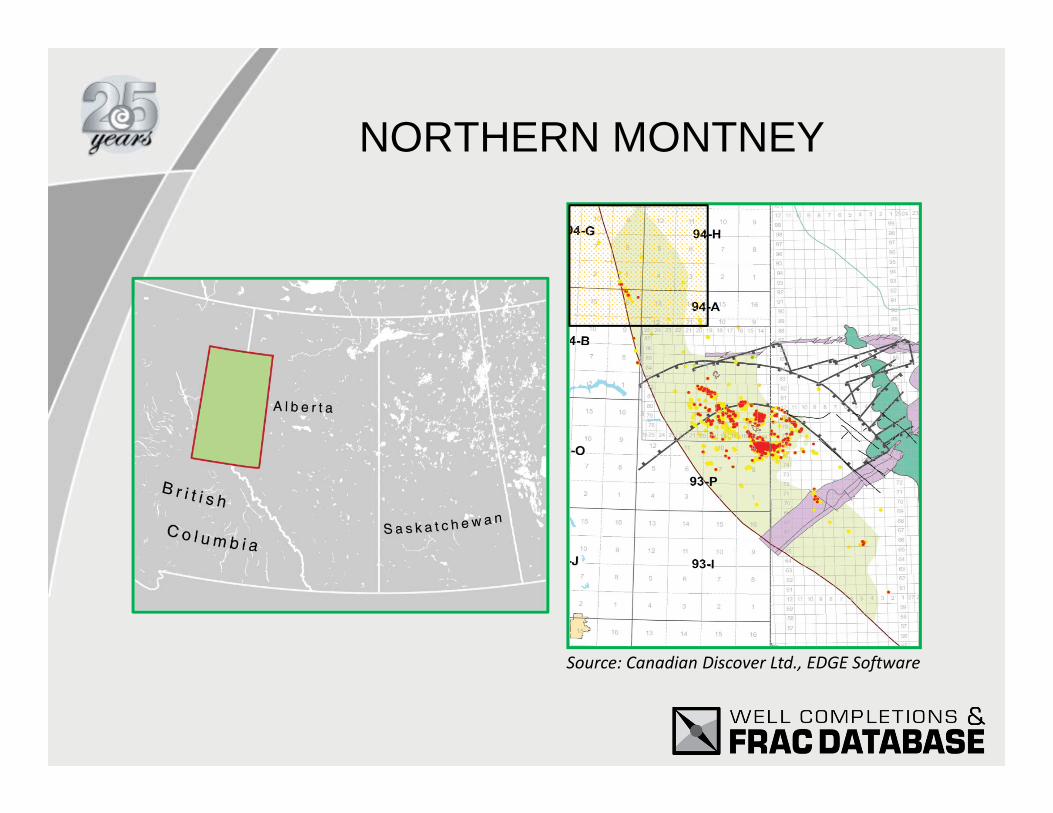
NORTHERN MONTNEY
Source: Canadian Discover Ltd., EDGE Software

0
2
4
6
8
10
12
14
16
01/06/2008 18/12/2008 06/07/2009 22/01/2010 10/08/2010 26/02/2011 14/09/2011 01/04/2012
Stages Completed
PROGRESS BONAVISTA CANBRIAN TALISMAN
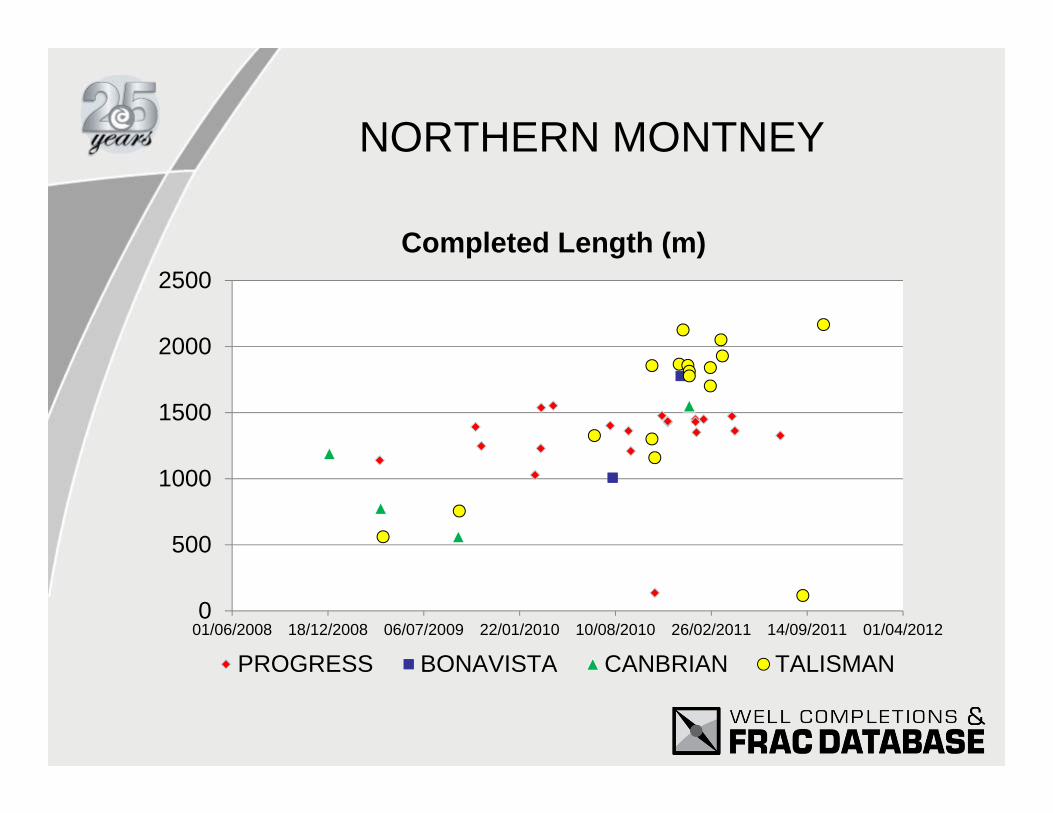
NORTHERN MONTNEY
0
500
1000
1500
2000
2500
01/06/2008 18/12/2008 06/07/2009 22/01/2010 10/08/2010 26/02/2011 14/09/2011 01/04/2012
Completed Length (m)
PROGRESS BONAVISTA CANBRIAN TALISMAN
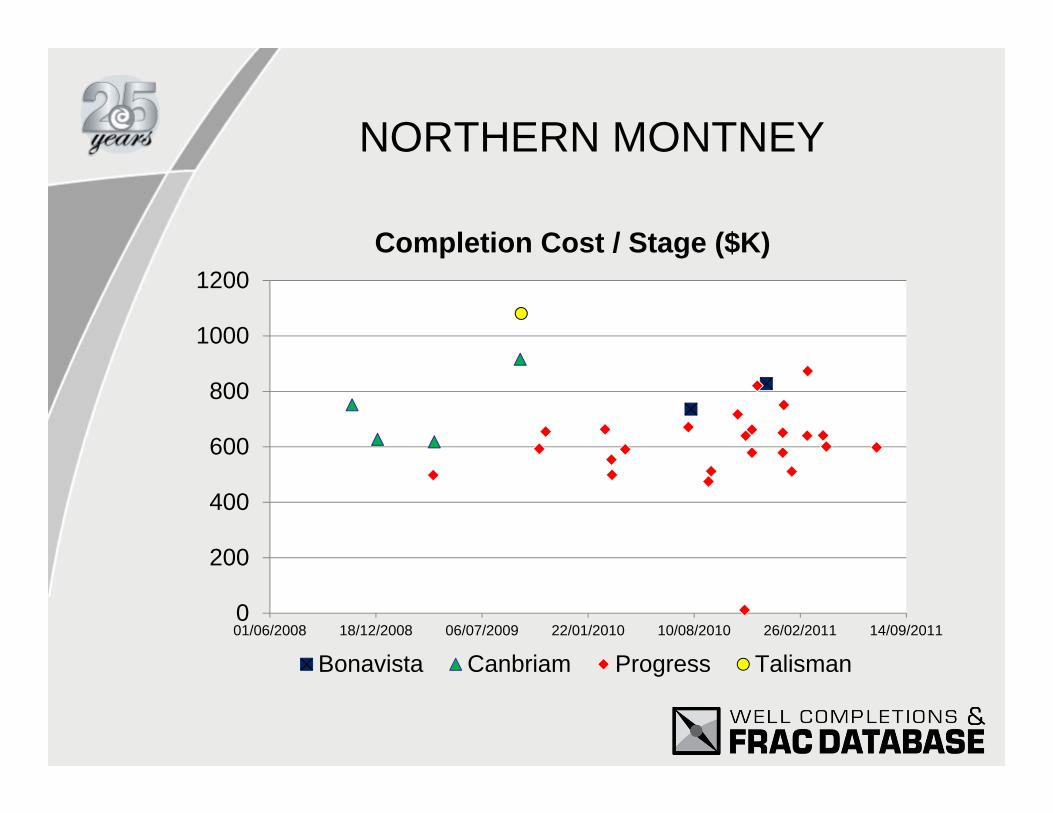
NORTHERN MONTNEY
0
200
400
600
800
1000
1200
01/06/2008 18/12/2008 06/07/2009 22/01/2010 10/08/2010 26/02/2011 14/09/2011
Completion Cost / Stage ($K)
Bonavista Canbriam Progress Talisman
NORTHERN MONTNEY

0
2000
4000
6000
8000
10000
12000
01/06/2008 18/12/2008 06/07/2009 22/01/2010 10/08/2010 26/02/2011 14/09/2011 01/04/2012
IP Gas (mcf/d)
PROGRESS BONAVISTA CANBRIAN TALISMAN
NORTHERN MONTNEY

0
200
400
600
800
1000
1200
09/09/200818/12/200828/03/200906/07/200914/10/200922/01/201002/05/201010/08/201018/11/201026/02/201106/06/2011
6 MO. Cal Gas Rate / Stage (mcf/d)
PROGRESS BONAVISTA CANBRIAN TALISMAN
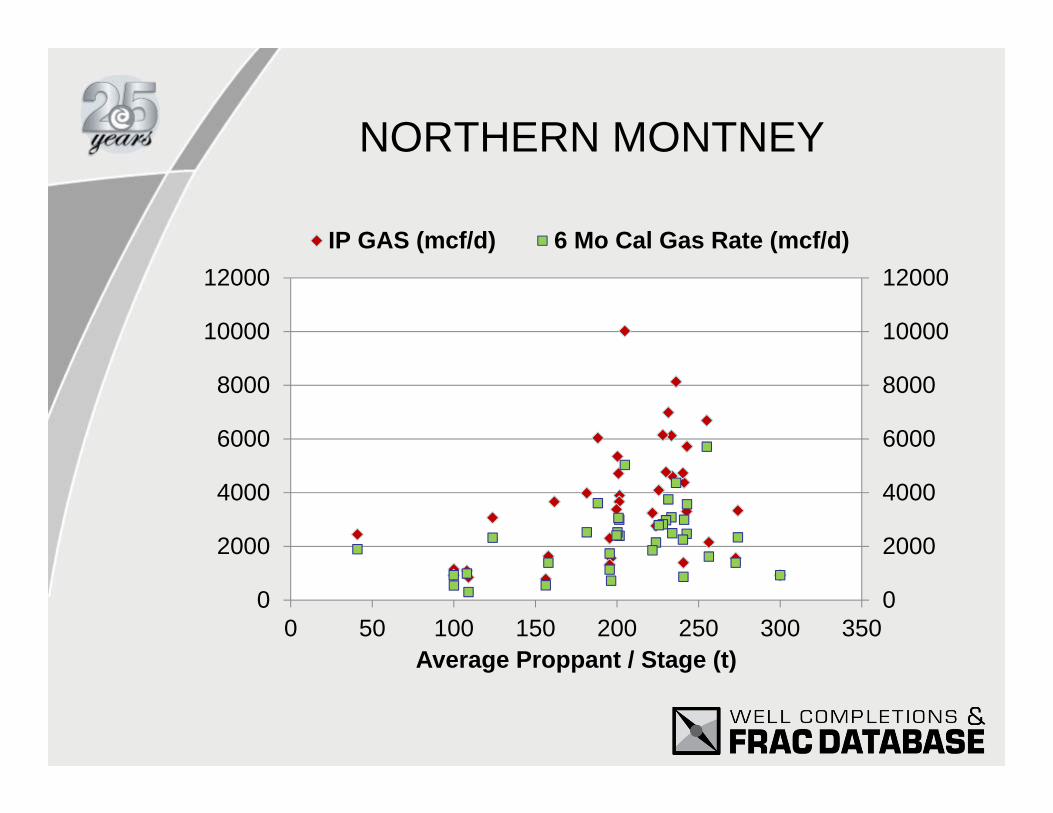
NORTHERN MONTNEY
0
2000
4000
6000
8000
10000
12000
0
2000
4000
6000
8000
10000
12000
0 50 100 150 200 250 300 350Average Proppant / Stage (t)
IP GAS (mcf/d) 6 Mo Cal Gas Rate (mcf/d)
NORTHERN MONTNEY

05000
100001500020000250003000035000400004500050000
0 50 100 150 200 250 300 350Average Proppant / Stage (t)
Total Fluid Pumped (m3)
NORTHERN MONTNEY
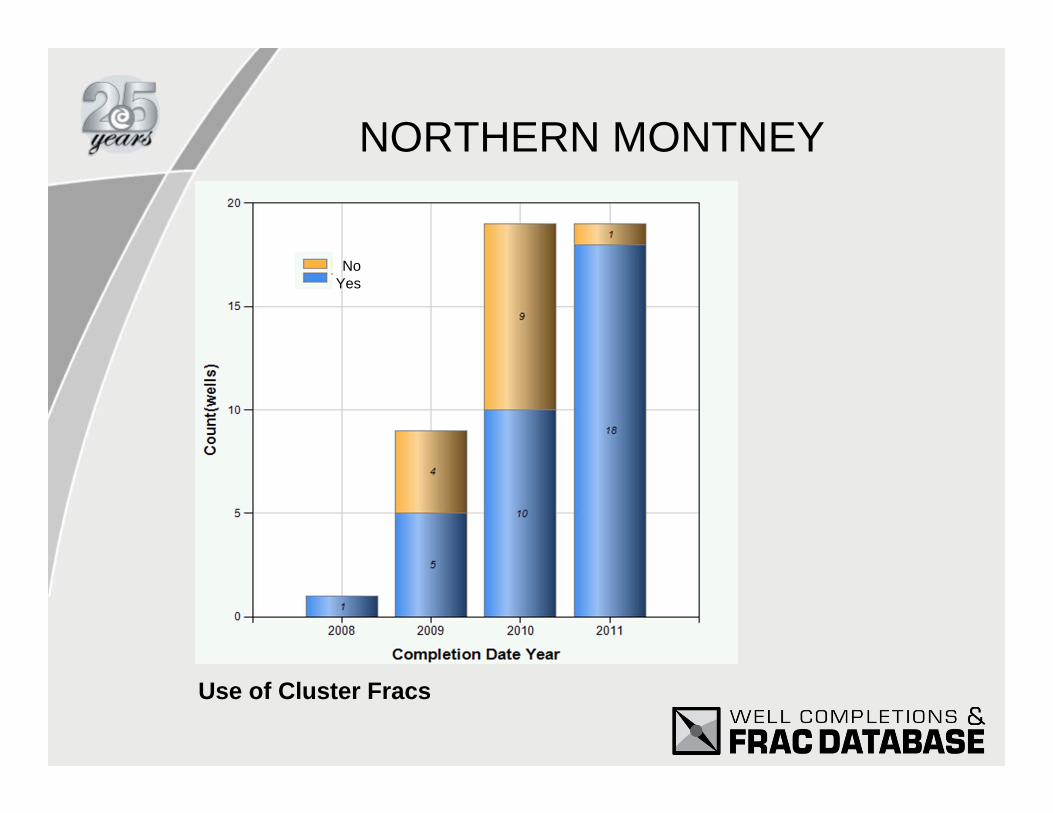
NoYes
Use of Cluster Fracs
NORTHERN MONTNEY

TALISMAN VS PROGRESSLonger Well LengthsMore Stages / WellGreater Cum Production
NORTHERN MONTNEY SUMMARY

Source: Canadian Discovery Ltd.
SLAVE POINT

0
5
10
15
20
25
30
35
10/10/2006 22/02/2008 06/07/2009 18/11/2010 01/04/2012
Stages Completed
EVI OTTERJUDY CR. ETHELSWAN HILLS SWAN HILLS SOUTH
SLAVE POINT

0200400600800
100012001400160018002000
06/07/2009 22/01/2010 10/08/2010 26/02/2011 14/09/2011 01/04/2012
Completed Length (m)
EVI OTTERJUDY CR. ETHELSWAN HILLS SWAN HILLS SOUTH
SLAVE POINT
0
100
200
300
400
500
600
10/10/2006 22/02/2008 06/07/2009 18/11/2010 01/04/2012
Completion Cost / Stage ($K)
EVI OTTERJUDY CR. ETHELSWAN HILLS SWAN HILLS SOUTH
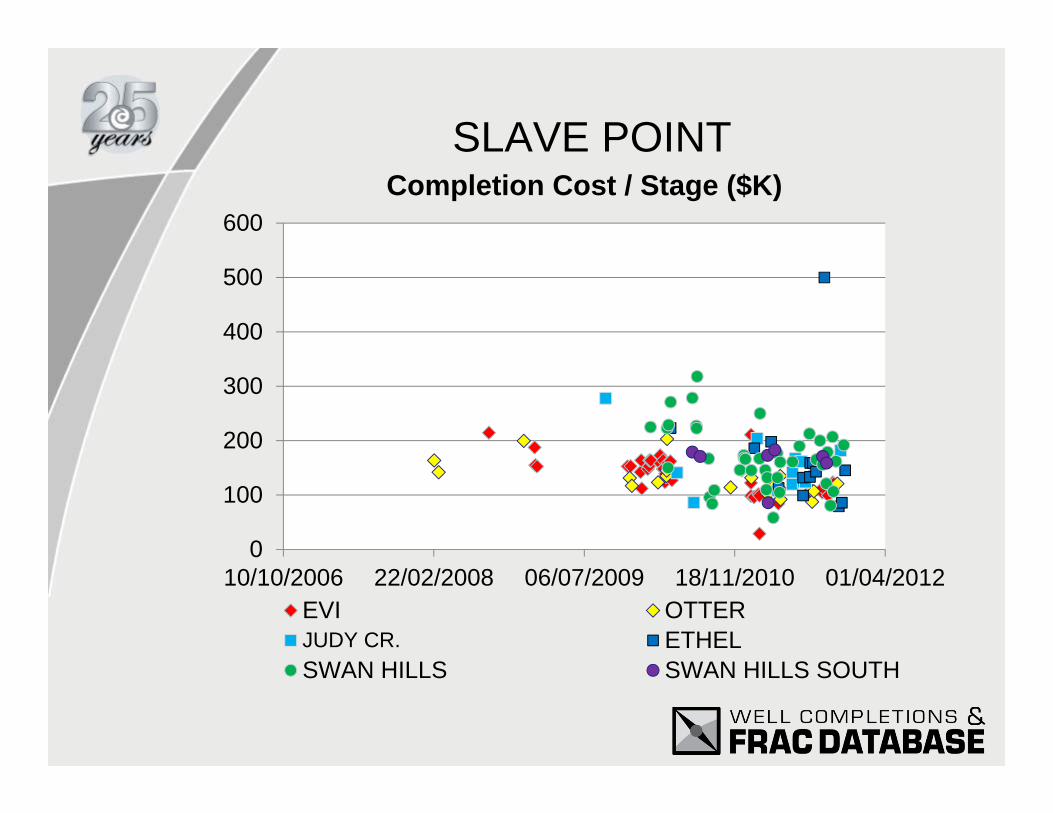
SLAVE POINT
0
100
200
300
400
500
600
06/07/2009 22/01/2010 10/08/2010 26/02/2011 14/09/2011
IP Oil (bop/d)
EVI OTTERJUDY CR. ETHELSWAN HILLS SWAN HILLS SOUTH
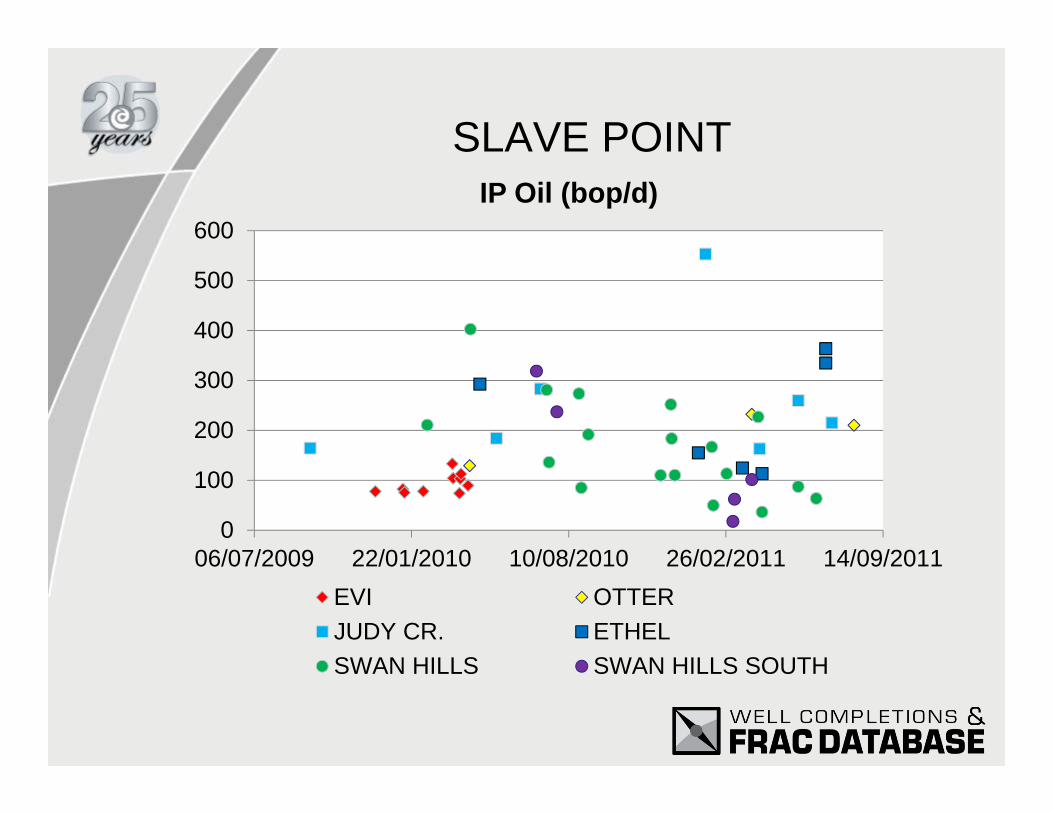
SLAVE POINT

0
50
100
150
200
250
0 10 20 30 40 50 60Average Proppant / Stage
OTTER IP (bopd) EVI IP (bopd)OTTER 6 Mo Rate (bopd) EVI 6 Mo Rate (bopd)
SLAVE POINT
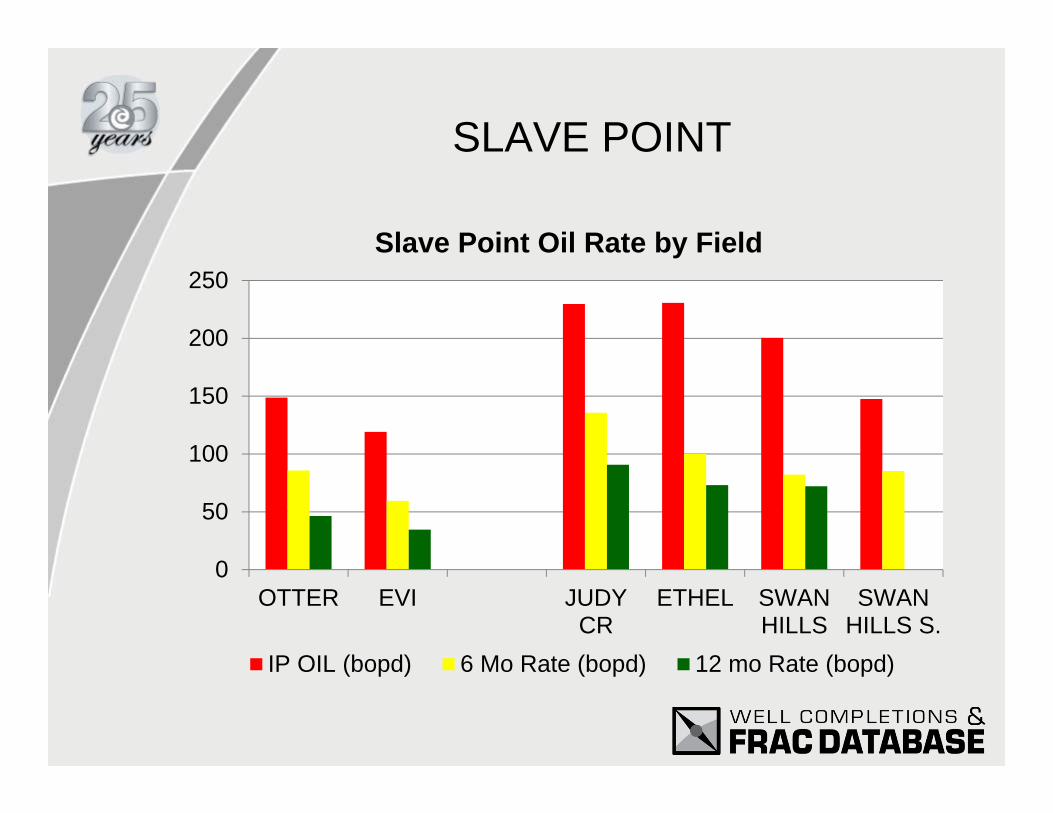
0
50
100
150
200
250
OTTER EVI JUDYCR
ETHEL SWANHILLS
SWANHILLS S.
Slave Point Oil Rate by Field
IP OIL (bopd) 6 Mo Rate (bopd) 12 mo Rate (bopd)
SLAVE POINT

010203040506070
OTTER EVI JUDYCR
ETHEL SWANHILLS
SWANHILLS S.
Slave Point Oil Cums by Field
6 Mo. CUM OIL (mbo) 12 Mo. CUM OIL (mbo)18 Mo. CUM OIL (mbo)
SLAVE POINT

EVI JUDY CREEK
Proppant No Proppant
~$125/stage ~$150/stage
12 stages 15 stages
400 – 500 m 1,000 m
GEOLOGY MATTERS
SLAVE POINT SUMMARY

Source: CDL Cardium Overview Study, 2010
CARDIUMRat Creek / Carrot Cr
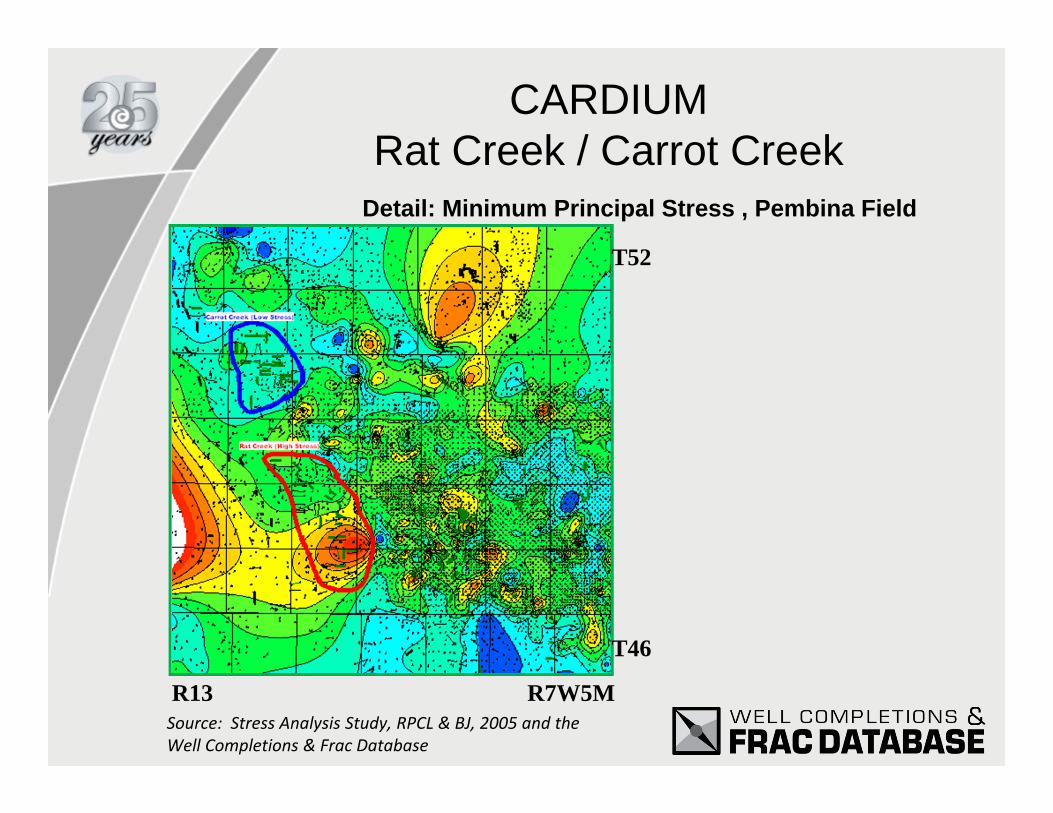
Detail: Minimum Principal Stress , Pembina Field
R7W5MR13
T46
T52
Source: Stress Analysis Study, RPCL & BJ, 2005 and the Well Completions & Frac Database
CARDIUMRat Creek / Carrot Creek
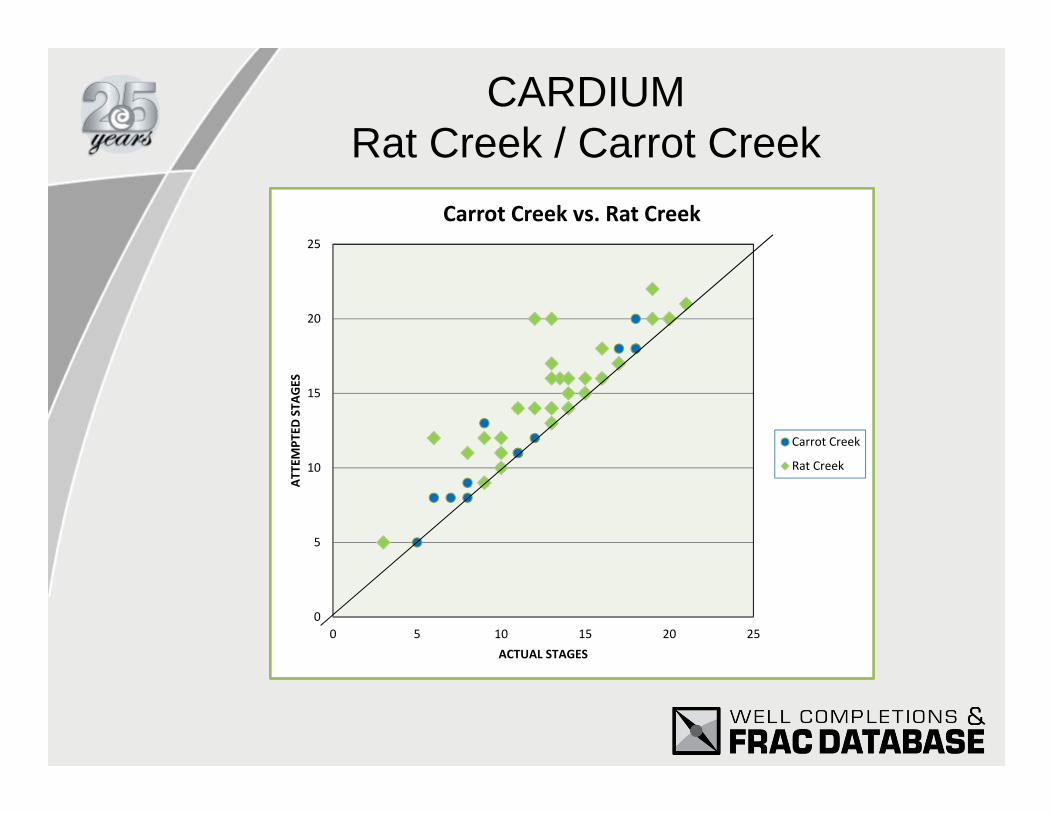
0
5
10
15
20
25
0 5 10 15 20 25
ATTEMPT
ED STA
GES
ACTUAL STAGES
Carrot Creek vs. Rat Creek
Carrot Creek
Rat Creek
CARDIUMRat Creek / Carrot Creek

24
9
5
1
23
14
6
3
0
5
10
15
20
25
30
<10% 10‐30% 30‐50% >50%
Num
ber o
f Wells
Estimated Completion Problem Time (%)
Well Count vs. Completion Problem Time
Carrot Creek
Rat Creek
CARDIUMRat Creek / Carrot Creek

0
50
100
150
200
250
Oil Slickwater Water
AVER
AGE IP (B
OPD
)
BASE FLUID
Initial Production vs. Base Fluid and Energizer
CARROT CREEK ‐ N2
CARROT CREEK ‐UNENERGIZED
RAT CREEK ‐ N2
RAT CREEK ‐ UNENERGIZED
12
14
3
44
12
14
15
213
CARDIUMRat Creek / Carrot Creek

Cardium Horizontal 3-Month Initial Production Rate Map
Base map generated with ArcMap ™

Carrot Creek vs. Rat Creek Hz Wells - type Prod decline curves
Data Source IHS Energy
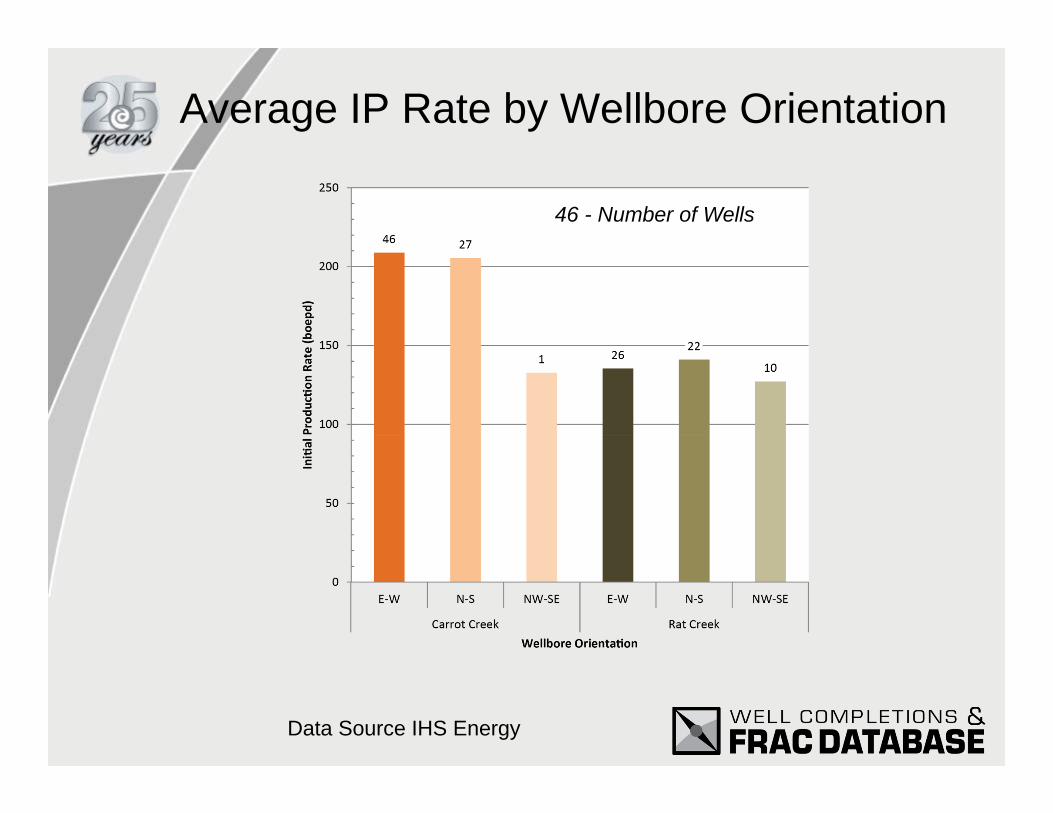
Average IP Rate by Wellbore Orientation
Data Source IHS Energy
46 - Number of Wells

Rat Creek Higher StressOperational FailuresBase Fluids & Energizers
CDD Article “Stressed Out in the Cardium”
CARDIUMRat Creek / Carrot Creek

ACKNOWLEDGMENTS
• Matt Baird• Razan Das, E.I.T.• Meridee Fockler, P.Geol.• Ally Masoud• Daniel LaPlante• Heather McCrank, MBA, CMA• Aliyyah Mohamed, B.A.• Kevin Rakhit, B. Sc.• Neil Watson, P.Geol.
• Jean Beriault, P.Eng.• Andrea Nawolsky, C.E.T.• John Siferd, R.E.T.• Peter Singbeil, P. Eng.• Don Waters, P.Eng.


