Page 1
Benefits of information visualization on electronic and paper-based Patient Care Records in the interpretation of
a patient’s medical narrative
Randy Chan University of Calgary
[email protected]
James Tam University of Calgary
[email protected]
1. ABSTRACT A Patient Care Record (PCR) is often used by Emergency
Medical Technicians (EMT) and paramedics to provide a
documented record of care provided to the patient, and serve as a
mean of communication among clinicians for pre-hospital and
future care. The electronic form of the PCR adopted by many
Emergency Medical Services (EMS) is the electronic Patient Care
Record (ePCR). Based on discussions with emergency room
physicians it was found that the information provided by ePCRs
and PCRs was helpful in providing an accurate record of the
patient’s condition throughout their pre-hospital care. It was noted
however that the way in which information was currently
represented sometimes overloaded physicians with too much
irrelevant data or was otherwise not presented in a usable fashion.
This project attempts to address some of the weaknesses of the
current ePCR systems using user-centered and task-centered
design [9] and the inclusion of several visualization techniques
and principles [10] in a prototype ePCR. . A usability study was
used to if the alternate representations of patient data implemented
in the prototype allows emergency physicians to be more aware of
a patient’s condition and allow them interpret a patient’s medical
narrative faster.
2. INTRODUCTION
2.1 Motivation A Patient Care Record is often used by Emergency Medical
Technicians (EMT) and paramedics to deliver a documented
record of care provided to the patient, and serve as a means of
communication among clinicians for pre-hospital and future care.
Typically, a PCR contains a collection of qualitative and
quantitative patient information such as: the date of birth, name,
address, medical history, vital signs, electrocardiogram
(ECG/EKG), treatment, reaction to treatment, et cetera. This
recorded patient information when analyzed, allows clinicians to
understand the conditions surround the patient’s medical narrative
(pre-hospital care information which allows clinicians to
understand the patient’s current condition) and continue with the
patient’s care after their arrival at the hospital. The electronic
Patient Care Record (ePCR) is the electronic form of the PCR and
has been adopted by many Emergency Medical Services (EMS)
personnel. Depending on the health setting (emergency ground
transport, emergency air transport, and so forth) the purpose of
ePCRs often vary in scope, but are commonly provide a more
accurate patient-care record management system, automate
redundant tasks, and improve clinical information acquisition [1].
ePCRs and PCRS have many unique users, and their use are
shown to be beneficial when considering the overall care of the
patient [2], however upon discussions with Emergency Physicians
throughout Alberta, it was found that the ePCR or PCRs generated
by the ePCR systems, was often deemed unhelpful, and at times
even detrimental in the task of addressing a patient’s emergency
medical condition upon their arrival to the emergency ward. In
one conversation with an emergency physician, the physician
recalled a situation where a patient with a medical emergency
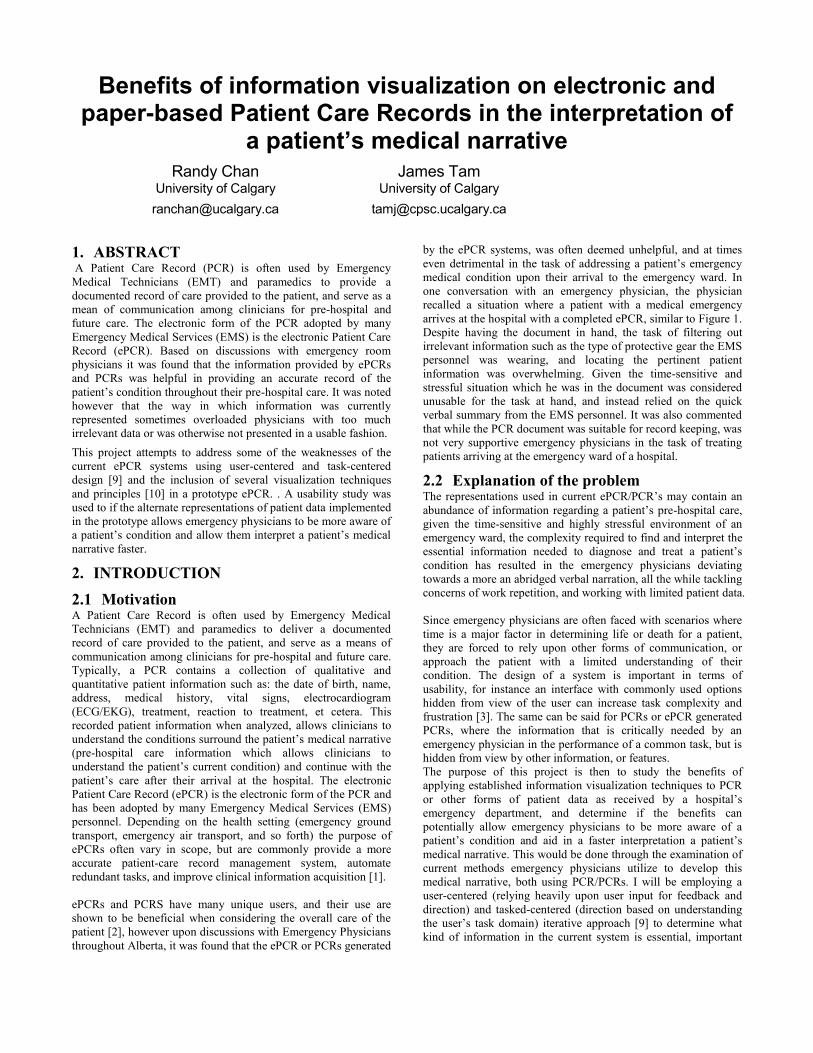
arrives at the hospital with a completed ePCR, similar to Figure 1.
Despite having the document in hand, the task of filtering out
irrelevant information such as the type of protective gear the EMS
personnel was wearing, and locating the pertinent patient
information was overwhelming. Given the time-sensitive and
stressful situation which he was in the document was considered
unusable for the task at hand, and instead relied on the quick
verbal summary from the EMS personnel. It was also commented
that while the PCR document was suitable for record keeping, was
not very supportive emergency physicians in the task of treating
patients arriving at the emergency ward of a hospital.
2.2 Explanation of the problem The representations used in current ePCR/PCR’s may contain an
abundance of information regarding a patient’s pre-hospital care,
given the time-sensitive and highly stressful environment of an
emergency ward, the complexity required to find and interpret the
essential information needed to diagnose and treat a patient’s
condition has resulted in the emergency physicians deviating
towards a more an abridged verbal narration, all the while tackling
concerns of work repetition, and working with limited patient data.
Since emergency physicians are often faced with scenarios where
time is a major factor in determining life or death for a patient,
they are forced to rely upon other forms of communication, or
approach the patient with a limited understanding of their
condition. The design of a system is important in terms of
usability, for instance an interface with commonly used options
hidden from view of the user can increase task complexity and
frustration [3]. The same can be said for PCRs or ePCR generated
PCRs, where the information that is critically needed by an
emergency physician in the performance of a common task, but is
hidden from view by other information, or features.
The purpose of this project is then to study the benefits of
applying established information visualization techniques to PCR
or other forms of patient data as received by a hospital’s
emergency department, and determine if the benefits can
potentially allow emergency physicians to be more aware of a
patient’s condition and aid in a faster interpretation a patient’s
medical narrative. This would be done through the examination of
current methods emergency physicians utilize to develop this
medical narrative, both using PCR/PCRs. I will be employing a
user-centered (relying heavily upon user input for feedback and
direction) and tasked-centered (direction based on understanding
the user’s task domain) iterative approach [9] to determine what
kind of information in the current system is essential, important
Page 2
and non-essential, and what should be implemented within the
system.
Figure 1. Screenshot of an Alberta Health Region PCR
In order to solve the questions proposed by this project, I
examined the weakness and strength of the current ePCR and
PCRs, and the process in which emergency physicians use them to
interpret the medical narrative of a patient. This was completed
by observing doctors while they used the current PCR or ePCRs,
and getting the user to vocalize his or her thoughts by “thinking
aloud” (vocalizing his or her thoughts) [5] while using the system.
Questionnaires and interviews were also used to determine the
system requirements. From the collective feedback provided, low-
fidelity prototypes were drafted up with pen and paper. This
process was repeated to create the medium fidelity prototype (an
interactive prototype containing partial or complete functionality),
and the proposed system prototype.
3. RELATED WORK At the present time, research on information visualization
techniques in the context of an emergency situation is sparse. A
number of ePCR systems exist, which provides different solutions
to address pre-hospital ePCR requirements.
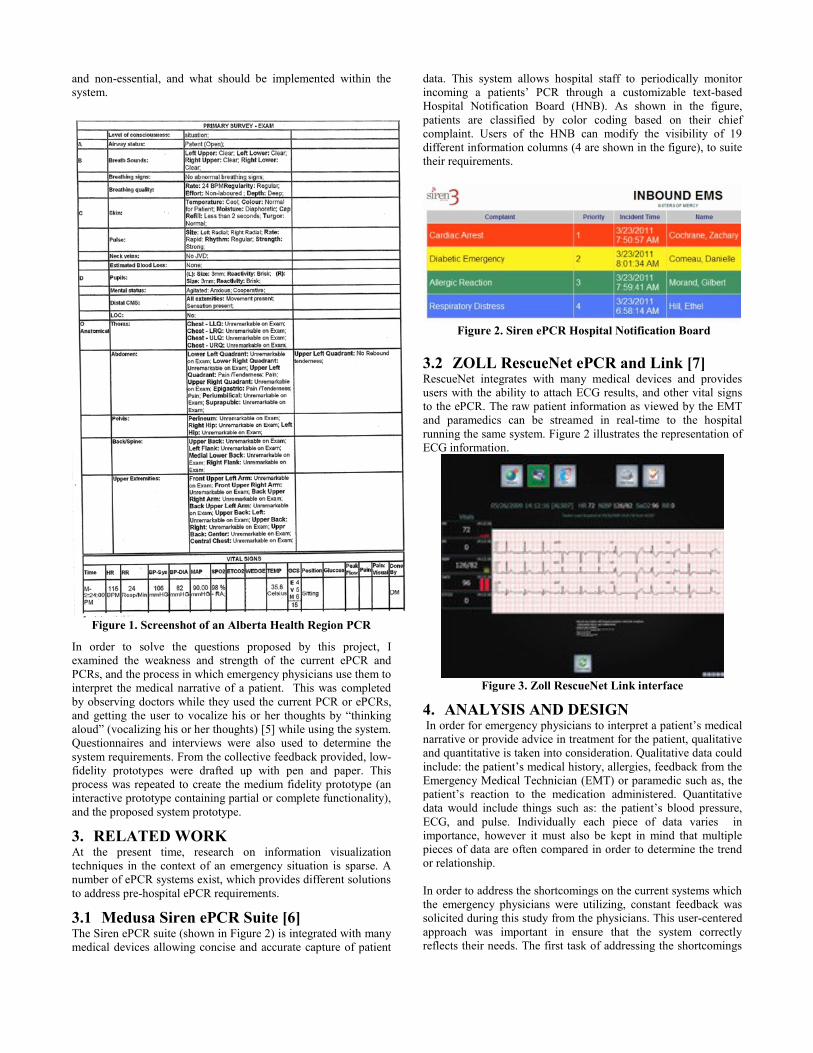
3.1 Medusa Siren ePCR Suite [6] The Siren ePCR suite (shown in Figure 2) is integrated with many
medical devices allowing concise and accurate capture of patient
data. This system allows hospital staff to periodically monitor
incoming a patients’ PCR through a customizable text-based
Hospital Notification Board (HNB). As shown in the figure,
patients are classified by color coding based on their chief
complaint. Users of the HNB can modify the visibility of 19
different information columns (4 are shown in the figure), to suite
their requirements.
Figure 2. Siren ePCR Hospital Notification Board
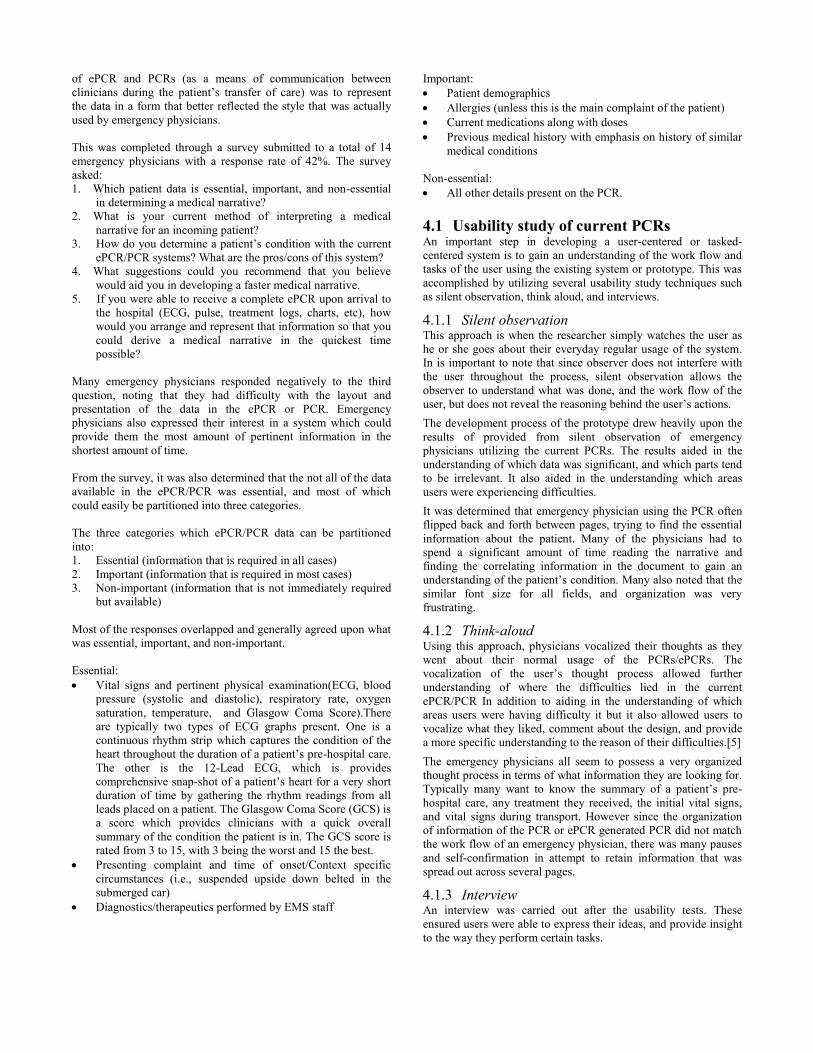
3.2 ZOLL RescueNet ePCR and Link [7] RescueNet integrates with many medical devices and provides
users with the ability to attach ECG results, and other vital signs
to the ePCR. The raw patient information as viewed by the EMT
and paramedics can be streamed in real-time to the hospital
running the same system. Figure 2 illustrates the representation of
ECG information.
Figure 3. Zoll RescueNet Link interface
4. ANALYSIS AND DESIGN In order for emergency physicians to interpret a patient’s medical
narrative or provide advice in treatment for the patient, qualitative
and quantitative is taken into consideration. Qualitative data could
include: the patient’s medical history, allergies, feedback from the
Emergency Medical Technician (EMT) or paramedic such as, the
patient’s reaction to the medication administered. Quantitative
data would include things such as: the patient’s blood pressure,
ECG, and pulse. Individually each piece of data varies in
importance, however it must also be kept in mind that multiple
pieces of data are often compared in order to determine the trend
or relationship.
In order to address the shortcomings on the current systems which
the emergency physicians were utilizing, constant feedback was
solicited during this study from the physicians. This user-centered
approach was important in ensure that the system correctly
reflects their needs. The first task of addressing the shortcomings
Page 3
of ePCR and PCRs (as a means of communication between
clinicians during the patient’s transfer of care) was to represent
the data in a form that better reflected the style that was actually
used by emergency physicians.
This was completed through a survey submitted to a total of 14
emergency physicians with a response rate of 42%. The survey
asked:
1. Which patient data is essential, important, and non-essential
in determining a medical narrative?
2. What is your current method of interpreting a medical
narrative for an incoming patient?
3. How do you determine a patient’s condition with the current
ePCR/PCR systems? What are the pros/cons of this system?
4. What suggestions could you recommend that you believe
would aid you in developing a faster medical narrative.
5. If you were able to receive a complete ePCR upon arrival to
the hospital (ECG, pulse, treatment logs, charts, etc), how
would you arrange and represent that information so that you
could derive a medical narrative in the quickest time
possible?
Many emergency physicians responded negatively to the third
question, noting that they had difficulty with the layout and
presentation of the data in the ePCR or PCR. Emergency
physicians also expressed their interest in a system which could
provide them the most amount of pertinent information in the
shortest amount of time.
From the survey, it was also determined that the not all of the data
available in the ePCR/PCR was essential, and most of which
could easily be partitioned into three categories.
The three categories which ePCR/PCR data can be partitioned
into:
1. Essential (information that is required in all cases)
2. Important (information that is required in most cases)
3. Non-important (information that is not immediately required
but available)
Most of the responses overlapped and generally agreed upon what
was essential, important, and non-important.
Essential:
Vital signs and pertinent physical examination(ECG, blood
pressure (systolic and diastolic), respiratory rate, oxygen
saturation, temperature, and Glasgow Coma Score).There
are typically two types of ECG graphs present. One is a
continuous rhythm strip which captures the condition of the
heart throughout the duration of a patient’s pre-hospital care.
The other is the 12-Lead ECG, which is provides
comprehensive snap-shot of a patient’s heart for a very short
duration of time by gathering the rhythm readings from all
leads placed on a patient. The Glasgow Coma Score (GCS) is
a score which provides clinicians with a quick overall
summary of the condition the patient is in. The GCS score is
rated from 3 to 15, with 3 being the worst and 15 the best.
Presenting complaint and time of onset/Context specific
circumstances (i.e., suspended upside down belted in the
submerged car)
Diagnostics/therapeutics performed by EMS staff
Important:
Patient demographics
Allergies (unless this is the main complaint of the patient)
Current medications along with doses
Previous medical history with emphasis on history of similar
medical conditions
Non-essential:
All other details present on the PCR.
4.1 Usability study of current PCRs An important step in developing a user-centered or tasked-
centered system is to gain an understanding of the work flow and
tasks of the user using the existing system or prototype. This was
accomplished by utilizing several usability study techniques such
as silent observation, think aloud, and interviews.
Silent observation 4.1.1This approach is when the researcher simply watches the user as
he or she goes about their everyday regular usage of the system.
In is important to note that since observer does not interfere with
the user throughout the process, silent observation allows the
observer to understand what was done, and the work flow of the
user, but does not reveal the reasoning behind the user’s actions.
The development process of the prototype drew heavily upon the
results of provided from silent observation of emergency
physicians utilizing the current PCRs. The results aided in the
understanding of which data was significant, and which parts tend
to be irrelevant. It also aided in the understanding which areas
users were experiencing difficulties.
It was determined that emergency physician using the PCR often
flipped back and forth between pages, trying to find the essential
information about the patient. Many of the physicians had to
spend a significant amount of time reading the narrative and
finding the correlating information in the document to gain an
understanding of the patient’s condition. Many also noted that the
similar font size for all fields, and organization was very
frustrating.
Think-aloud 4.1.2Using this approach, physicians vocalized their thoughts as they
went about their normal usage of the PCRs/ePCRs. The
vocalization of the user’s thought process allowed further
understanding of where the difficulties lied in the current
ePCR/PCR In addition to aiding in the understanding of which
areas users were having difficulty it but it also allowed users to
vocalize what they liked, comment about the design, and provide
a more specific understanding to the reason of their difficulties.[5]
The emergency physicians all seem to possess a very organized
thought process in terms of what information they are looking for.
Typically many want to know the summary of a patient’s pre-
hospital care, any treatment they received, the initial vital signs,
and vital signs during transport. However since the organization
of information of the PCR or ePCR generated PCR did not match
the work flow of an emergency physician, there was many pauses
and self-confirmation in attempt to retain information that was
spread out across several pages.
Interview 4.1.3An interview was carried out after the usability tests. These
ensured users were able to express their ideas, and provide insight
to the way they perform certain tasks.
Page 4
Emergency physicians again reinforce the fact that they don’t
utilize the PCR or ePCR very often. The time and effort that it
takes to “decipher” a PCR could be used instead to saving a
patient’s life. Instead physicians prefer the verbal narrative which
an EMT or paramedic provides upon transfer of care for the
majority of the information they need. This method can be
problematic as incomplete communication can easily lead to
repetition of work, and other similar problems.
4.2 PROTOTYPING
Low fidelity prototype 4.2.1The low fidelity prototypes were developed on pen and paper
from the feedback provided in the usability studies during the
analysis and requirements gathering of the system. Considering
the essential and important categories in which the ePCR/PCR
data can be organized, along with the results gathered in
preliminary studies using the simple observation and think aloud
techniques, a primary layout was created along with ideas on how
the essential and important data can be represented.
Feedback on low fidelity prototypes were obtained through
interviews with the emergency physicians to determine area of
improvement, comments and inclusion of suggested feature.
Iterative improvements that were included in the low-fidelity
prototype based on user feedback. Such changes (Figure 4)
included: the patient information box at the top, a table of vital
signs, and individual graphs representing the electrocardiogram
(ECG), the blood pressure, and pulse oximeter over time was
favorable.
Other concepts that was considered was the color coding of vital
signs to assist in visual identification of deviations from the norm
and interpretation, and semantic zooming on graphs for detailed
analysis.
Figure 4: Screenshot of the low-level prototype
4.2.1.1 Color coding of vital signs When a healthy patient’s vital signs fall within a range of values
as shown in Table 1.What is considered a vital sign can vary,
however there are a structured set of norms which hold true:
Table 1. Normal vital signs for average adult human [8]
Vital Sign Range
Pulse 60 to 100 beats per
minute (bpm)
Blood Pressure 90 systolic/60diastolic
to 120 systolic/80
diastolic millimeter of
mercury (mm Hg)
Temperature 37 degrees Celsius to
36.5 to 37.2 degrees
Celsius
Respiratory Rate 20-60 breaths per
minute
These ranges of normal values can be then used as a basis to
define anomalous cases and used to determine when to represent
these deviations from the norm. For example, if a patient’s
respiratory rate was to suddenly fall to 10 breaths per minute, a
digression from the range of normal respiratory rate of 20-60
breaths per minute, the proposed prototype will represent these
deviations by highlighting the area within a table or graph (Figure
4), to bring to an EMS clinician’s attention the change in a
patient’s condition.
4.2.1.2 Semantic zooming Differing from normal zooming in which changing the zoom level
only changes the size of the object, semantic zooming at different
zoom levels may change the representation of the same
information at each level so that it provides the most meaningful
presentation at each size [11].
This form of zooming was considered for all the graphs presented
in the low level prototype. When applied the electrocardiogram
(ECG) graph for example (Figure 5), the lowest level of zoom
presents the patient’s complete rhythm strip, with sections
highlighted to show points in time which the rhythm deviated
from the norm. In the each successive level of zoom, the
representation of the same information changes, to present
additional detail of the rhythm and additional details such as a
patient’s heart rate at the particular time
Figure 5: Low level prototype example of semantic zooming
Medium fidelity prototype 4.2.2The next step after low-fidelity prototypes was the transition to
medium fidelity prototypes after considering feedback from the
users. In this project the medium fidelity prototype was a series of
mockup screenshots that allowed users to visualize and provide
feedback. The progress to medium fidelity prototypes allowed a
better understanding of the layout, and simulation of different
Page 5
features for testing.. Moving from paper to screenshots allowed
for testing of each component in detail yet provided the freedom
to make changes quickly and inexpensively. It soon became
apparent became apparent that simple categorization of the
patient’s information from the PCR such as his or her narrative
(initial assessment, history, chief complain, cardiovascular system,
respiratory system, abdominal health, gastrointestinal,
genitourinary, skin and treatment) was hard to interpret and read.
Suggestions to reduce the clutter led to the implementation of
several ideas. An example experimentation included an
“accordion view” (opening a section collapse all others), or an
expandable list view (where all categories are expandable as
needed). In both case the accordion effect , and expandable view
was found to address the issue of information overload, but also
introduced another issue where the important information
becomes hidden as users have find the information through
scrolling , or repeatedly expanding sections to read and re-read a
section in the narrative.
After these preliminary studies a hybrid compromise approach
(“dynamic tabs”) was implemented and appears to strike a balance
between hiding the information and displaying the information.
This feature (shown in Figure 7) works by providing additional
details for each item in the list in the area immediately to the right
of the element.
Figure 6. Dynamic tabs: selecting an tab element in A, changes
the contents in B to reflect contents selected
Figure 7. Dynamic tabs with color coding
Another feature that was considered with was the use of different
shades of color as a method of distinguishing essential and non-
essential data throughout the system. As shown in Figure 7, the
addition of color to the tabs as an attempt to ensure to classify tabs
in order of importance. However, the implementation shown in
Figure 7 was left out of the final system, as it introduced problems
associate with color blindness, and added the extra complexity of
deciphering the meaning of the different shades of color.
Figure 8. Medium fidelity prototype of a graph with semantic
zooming capability.
The medium fidelity prototype retained the concept of semantic
zoom for graphs with slight modifications from the low-level
prototype. These changes are: the ability to select the level of
zoom by range using the sliders located in the graph over view
(B). The zoom is then reflected in the zoom window (A).
Deviations from the norm are also highlighted in the graph
overlay (B).
Medium fidelity prototype testing 4.2.3Medium fidelity prototypes were tested with the same procedure
as low-level fidelity prototypes. Users’ feedback was obtained
through interview and their suggested changes were incorporated
in the final implemented system.
5. PROPOSED SOLUTION
Screen layout 5.1.1From the feedback gathered from the prototypes, the layout of the
final system was designed with the concept of reducing
unnecessary information and providing emergency physicians
with the necessary information in the quickest way possible.
Compared with the medium fidelity prototypes, the cluttered
layout has been addressed. Each section was moveable and
collapsible, to take into account the different workflows of
different users in the system. With each data set differentiating
from the one another other (narrative, tables, charts) it was also
important to maintain a consistent look-and-feel to minimize the
learning curve when moving from one section to the next.
Figure 9. Overall layout of the final prototype
Page 6
Color 5.1.2Color was an important feature in the final implementation of the
system. Based on user studies the usage of color in the final
prototype allowed doctors to quickly note when vital signs that
deviating from what is considered normal for a patient type. In
Figure 10, patient vital information that fell out of what was
considered normal in any field was highlighted in red to bring to
attention users of the system.
Figure 10. Table of vital signs, with box showing highlighted
patient information that deviated from the norm
Semantic zooming 5.1.3The graph on the final prototype provided the user with the ability
to control the amount of information a user sees on each zoom
level. In addition to controlling the magnification of the graph,
Each successive level of zoom changed the view of the same
information, presenting additional details. For example, users are
able to move their mouse over each point in the graph to see the
patient’s rhythm, and heart rate, at that particular point in time. In
each chart in the final prototype, the user is able to control the
level of zoom, and how much of the chart they would like to see.
In addition
While the data in the graph was not an accurate portrayal of a
patient’s information (e.g. electrocardiogram (ECG)), it allowed
for a conceptual demonstration of how semantic zooming can be
applied to such a graph.
Figure 11. Semantic zooming for graphs in the final prototype
represented as ECG
Figure 12.Semantic zooming: Graph zoomed in with different
representation of the same information
6. FINAL PROTOTYPE EVALUATION
6.1 Evaluation Techniques The usability study was broken down into three steps.
The first step was the preliminary interview, where the users were
asked a series of questions, to determine their experience and
background in ePCR and PCRs. Next users were shown the
prototype, told to treat the PCR as if the patient was arriving
shortly, and to gather the necessary information required to
understand and treat the patient’s condition.
Due to the fact that the number of users involved in the study was
very low, and the demographics of the three users are very similar.
I could not determine if previous experience, age, or professional
experience played a role the outcome of the result. As a result the
information from the first step was largely unconsidered in the
analysis.
The emergency physicians were asked to use the think-aloud
method to express their ideas and thoughts while working through
the scenario.
It is important to note that the scenarios which the test took place
in does not reflect the real-life scenario of an emergency ward
(e.g., the test of the prototype was conducted as an emergency was
taking place with an actual patient).
Page 7
6.2 User Profile Although there are many different users of ePCR systems and
PCRs, this project focuses on the interaction of PCRs and PCRs
by emergency physicians. An emergency physician is someone
who specializes in the short-term care and treatment of patient
with illnesses or injuries which require immediate medical
attention. The targeted user should have experience with PCRs,
with varying degrees of familiarity in ePCRs.
For this project a total of six users participated throughout the
various stages of the project and were between the ages of 30 to
55. Most users had limited experiences with ePCRs and most of
the experience that they did have was with the Medusa Siren
ePCR and the STARS ePCR. Most emergency physicians relied
on the paper based PCR rather than ePCR as a source of patient
information. The six users who participated in parts of the study
were spread across Alberta, but were limited to the city of Calgary,
Edmonton and Grande Prairie. All users are emergency physicians
with designations of FRCP(EM) through the Royal College of
Physicians and Surgeons of Canada (Emergency Medicine Board
Certification-Emergency Medicine Consultant) or a CCFP(EM)
through the College of Family Physicians of Canada. Since the
final prototype was just a mockup running on Internet Explorer 8,
it was important to note that all users were familiar with the
browser. This removed the need to differentiate for the user which
interface was the prototype and what belonged of the browser. Of
the six users contacted, 2 were beginner users, and 4 were
intermediate users. Due to the time constraints, of the six
contacted, only three were available to participate in the testing of
the system; all three were intermediate users. The input of one of
the users was not used in the study, as his input was used to drive
the design of the prototype and ensure the validity of the testing
scenario.
6.3 RESULTS
Evaluation of screen layout 6.3.1Many of the users really liked the look and feel of the final system
design. The interface was commented on as being simple and
easily to use. During the user testing, users had little difficulty
locating the information that was required to interpret the patient’s
medical narrative. It was suggested by two of the three doctors
that the charts were a bit of a distraction at first, and would benefit
more if minimized initially. The ability to modify the workspace
was well, as different medical scenarios required varying focus on
different sets of data. For instance, if the patient was experiencing
and medical emergency on his or her foot, an emergency
physician might not want to see options for ECG, or ventilator
setting, instead opting to only monitor the blood pressure. Other
suggestion by users was the potential inclusion of icons in the
interface to make sections that were collapse more easily
differentiable, or modify the functionality of the search box to
include ranges.
Evaluation of color 6.3.2Color when used as a visual variable was considered extremely
helpful in the diagnostic of a patient’s narrative. It was noted that
many emergency physicians attempted to find trends in the vital
signs which can potentially result the correct diagnostics.
However it is important to note that the usage of color to highlight
deviations from the norm as shown in Figure 10, was found to not
benefit in anyway in comparison to viewing the charts without
color. The suggestion to how this could be address was if each
vital sign (pulse, blood pressure (systolic, diastolic), respiratory
rate, et cetera) was each independently colored by a gradient,
allowing for easy contrast of each vital sign with each other. For
instance, a patient had an elevated heart rate which decreased over
time, whereas the oxygen saturation increased over time, the chart
in the system could represent these changes with the column for
heart rate transitioning from green to red, and the column for
oxygen saturation transitioning from red to green. This
representation could allow physicians to interpret the two vital
signs together, and possibly identify a diagnostics which relates to
the correlation of the trends of both data.
Evaluation of semantic zooming 6.3.3The opinion received in regards to the ability to visualize the
patient’s vital signs was mixed. Although the emergency
physicians were supportive of the idea, two out of three expressed
concern that the section being very visual can be distracting from
the table of vital signs. If the charts were initially minimized and
accessible upon command, then it would address that issue.
Another suggestion provided was that instead of having three or
more charts, that there should be a timeline which supports
semantic zooming. Zooming into the timeline would display the
events that occurred during the pre-hospital care (patient picked
up, medication given, et cetera), with the ability to see the vital
signs and segment of the charts for each particular point in time.
This implementation would be very similar in context to that of a
jQuery widget called Timeglider JS, as shown in Figure 13.This
applet allows users to pan and zoom across the timeline. In
addition, each level of zoom changes the appearance the
information, to show more information otherwise hidden when
zoomed out, and offers the ability to select points on the timeline
for further details.
Figure 13. Sample timeline with semantic zooming [12]
7. CONCLUSION For this project it can be concluded that a system which combines
user-centered and item-centered iterative design, along with well-
established information visualization techniques and principles to
an ePCR or other forms of patient data will greatly benefit
emergency physicians, in the interpretation of a patient’s medical
narrative in a time-sensitive and stressful environment. Applying
information visualization techniques to a PCR or ePCR allows
emergency physicians to more quickly find the information they
need to understand a patient’s circumstance and potentially aid in
saving a patient’s life.
8. FUTURE TASKS Given the potential benefits of this research future work into this
might include the exploration of information visualization on
other patient data not explored in this project. For instance,
Page 8
patients may also have a 12-lead ECG reading, I would also like
to revise this research with potentially more emergency physicians,
or include additional user groups to determine if the benefits are
not limited to one user group. It would be beneficial to continue
developing the system, with the provided feedback given by the
emergency physicians and continue with the research as it can be
beneficial in how things are done in changing present or future in
terms of the care a patient receives upon their transfer from pre-
hospital care.
9. BIBLIOGRAPHY [1] Craig F. Feied, Jonathan A. Handler, Mark S. Smith, Michael
Gillam, Meera Kanhouwa, Todd Rothenhaus, Keith Conover,
Tony Shannon, Feied et al. (2004) Clinical Information
Systems, “Instant Ubiquitous Clinical Data for Error
Reduction and Improved Clinical Outcomes,”, ACAD
EMERG MED, November 2004, Vol 11, No 11 (2004)
p1162-1169
[2] Jha, Ashish K. and DesRoches, Catherine M. and Campbell,
Eric G. and Donelan, Karen and Rao, Sowmya R. and Ferris,
Timothy G. and Shields, Alexandra and Rosenbaum, Sara
and Blumenthal, David Use of Electronic Health Records
in U.S. Hospitals. 16, 2009, New England Journal of
Medicine, Vol. 360, pp. 1628-1638.
[3] Norman, Donald A. The Design of Everyday Things. New
York. Basic Books, 1998.
[4] Kevin Mullet, Darrell Sano. Designing Visual Interfaces:
Communication Oriented Techniques. Prentice Hall, 1995
pp. 89 - 129.
[5] Lewis, C. H. (1982). Using the "Thinking Aloud" Method
In Cognitive Interface Design (Technical report). IBM.
RC-9265.
[6] Medusa Medical Technologies Inc. (2011). Siren ePCR
Suite provides integrated health records and full ePCR
documentation [Website]:
http://www.medusamedical.com/SirenOverview/index.html
(accessed September 28, 2011).
[7] ZOLL Medical Corporation. (2011). RescueNet ePCR
NEMIS certified electronic patient care reporting
software [Website]: http://www.zolldata.com/rescuenet-epcr
(accessed September 28, 2011).
[8] Dugdale, Dr. David C. Vital Signs. MedlinePlus Trusted
Health Information for You - A service of the U.S. National
Library of Medicine. [Online] 2 20, 2011. [Cited: 09 28,
2011.]
http://www.nlm.nih.gov/medlineplus/ency/article/002341.ht
m.
[9] Lewis, Clayton. Rieman, John. Task-Centered User
Interface Design: A Practical Introduction. [Online] 1993,
1994. [Cited: November 23, 2011.] http://hcibib.org/tcuid/.
[10] Bertin, J. (1967) The Semiology of Graphics: Diagrams,
Networks, Maps. (Berg, W.J. Trans.), University of
Wisconsin Press, Translated version 1983.
[11] University of Illinois at Urbana-Champaign Digital Libraries
Initiative. Definition of semantic zooming.[Online] 1998,:
http://dli.grainger.uiuc.edu/glossary.htm (accessed November
23, 2011).
[12] Mnemograph LLC. Timeglider jQuery Widget/Plugin.
[Online] 2011: http://timeglider.com/jquery/ (accessed
November 25, 2011).


![Practice Teaching Assumptions on CNC Cutting by VB ...the visualization algorithm based on the control of visualization algorithm[6], In 2007, Liu Yong bo of Electronic Science and](https://static.documents.pub/doc/80x56/6104a68c4b3b8564874cde56/practice-teaching-assumptions-on-cnc-cutting-by-vb-the-visualization-algorithm.jpg)


