EQUITY MARKETS Small & mid caps Benelux Expectations of a mid-cycle dip offer opportunities at discounted valuations ◆ In the current context, we prefer defensive and structural growth. Avoid high cyclical and US exposure ◆ Dutch top picks: Aalberts, Arcadis, Boskalis, Fugro, Imtech and Wessanen ◆ Belgian top picks: Arseus, Colruyt, Kinepolis, Telenet, Transics and Umicore ◆ Benelux Small & Mid Cap Team Benelux small & mid caps Sailing in rough seas January 2008 SEE THE DISCLOSURES APPENDIX FOR IMPORTANT DISCLOSURES AND ANALYST CERTIFICATION
Transcript
il EQUITY MARKETS
Small & mid caps Benelux
Expectations of a mid-cycle dip offer opportunities at discountedvaluations ◆
In the current context, we prefer defensive and structural growth.Avoid high cyclical and US exposure ◆
Dutch top picks: Aalberts, Arcadis, Boskalis, Fugro, Imtech andWessanen ◆
Belgian top picks: Arseus, Colruyt, Kinepolis, Telenet, Transicsand Umicore ◆
Benelux Small & Mid Cap
Team
Benelux small & midcapsSailing in rough seas
January 2008
Ben
elu
x s
mall &
mid
cap
sJan
uary
2008
SEE THE DISCLOSURES APPENDIX FOR IMPORTANT DISCLOSURES AND ANALYST CERTIFICATION
Research offices: legal entity/address/primary securities regulator Almaty Representative office, ING Bank N.V. in Kazakhstan, 85a, Dostyk Avenue, Office 510, 050010, Almaty, Kazakhstan.
Agency of the Republic of Kazakhstan on Regulation and Supervision of Financial Market & Financial Organizations
Amsterdam ING Bank N.V., Foppingadreef 7, Amsterdam, Netherlands, 1102BD. Netherlands Authority for the Financial Markets
Bratislava ING Bank N.V., pobocka zahranicnej banky, Jesenskeho 4/C, 811 02 Bratislava, Slovak Republic. National Bank of Slovakia
Brussels ING Belgium S.A./N.V., Avenue Marnix 24, Brussels, Belgium, B-1000. Banking Finance and Insurance Commission
Bucharest ING Bank N.V. Bucharest Branch, 11-13 Kiseleff Avenue, Sector 1, Bucharest, Romania, 71268. Romanian National Securities and Exchange Commission
Budapest ING Bank Zrt, Dozsa Gyorgy ut 84\B, H - 1068 Budapest, Hungary. Hungarian Financial Supervisory Authority
Dubai ING Bank N.V. Dubai Branch, Level 2, Gate Village 05, Dubai International Financial Center (DIFC), PO Box 121208. Dubai Financial Services Authority
Edinburgh ING Bank N.V. London Branch (Edinburgh office), 2 Canning Street Lane, Edinburgh, United Kingdom, EH3 8ER. Financial Services Authority
Hong Kong ING Bank N.V. Hong Kong Branch, 39/F, One International Finance Centre, Central Hong Kong. Hong Kong Monetary Authority
Kiev ING Bank Ukraine JSC, 30-a, Spaska Street, Kiev, Ukraine, 04070 Ukrainian Securities and Stock Commission
London ING Bank N.V. London Branch, 60 London Wall, London EC2M 5TQ, United Kingdom. Financial Services Authority
Madrid ING Bank NV, Sucursal en Espana, C/Genova, 27. 4th Floor, Madrid, Spain, 28004. Comisión Nacional del Mercado de Valores
Manila ING Bank N.V. Manila Branch, 21/F Tower I, Ayala Avenue, 1226 Makati City, Philippines. Philippine Securities and Exchange Commission
Mexico City ING Grupo Financiero (Mexico) S.A. de C.V., Bosques de Alisos 45-B, Piso 4, Bosques de Las Lomas, 05120, Mexico City, Mexico. Comisión Nacional Bancaria y de Valores
Milan ING Bank N.V. Milano, Via Paleocapa, 5, Milano, Italy, 20121. Commissione Nazionale per le Società e la Borsa
Moscow ING Bank (Eurasia) ZAO, 36, Krasnoproletarskaya ulitsa, 127473 Moscow, Russia. Federal Financial Markets Service
Mumbai ING Vysya Bank Limited, A Wing, Shivsagar Estate, 2nd Floor, South Wing, Dr. Annie Besant Road, Worli, Mumbai, 400 018. India Securities and Exchange Board of India
New York ING Financial Markets LLC, 1325 Avenue of the Americas, New York, United States,10019. Securities and Exchange Commission
Paris ING Belgium S.A., Succursale en France, Coeur Défense, Tour A, La Défense 4, 110 Esplanade du Général de Gaulle, Paris La Défense Cedex, 92931. l’Autorité des Marchés Financiers
Prague ING Bank N.V. Prague Branch, Nadrazni 25, 150 00 Prague 5, Czech Republic. Czech National Bank
Sao Paulo ING Bank N.V. Sao Paulo, Av. Brigadeiro Faria Lima n. 3.400, 11th Floor, Sao Paulo, Brazil 04538-132. Securities and Exchange Commission of Brazil
Singapore ING Bank N.V. Singapore Branch, 19/F Republic Plaza, 9 Raffles Place, #19-02, Singapore, 048619. Monetary Authority of Singapore
Sofia ING Bank N.V. Sofia Branch, 12 Emil Bersinski Str, Ivan Vazov Region,1408 Sofia, Bulgaria. Bulgarian Central Bank and Financial Supervision Commission
Warsaw ING Securities S.A., Plac Trzech Krzyzy, 10/14, Warsaw, Poland, 00-499. Polish Financial Supervision Authority
Disclaimer This report has been prepared on behalf of ING (being for this purpose the wholesale and investment banking business of ING Bank NV and certain of its subsidiary companies) solely for the information of its clients. ING forms part of ING Group (being for this purpose ING Groep NV and its subsidiary and affiliated companies). It is not investment advice or an offer or solicitation for the purchase or sale of any financial instrument. While reasonable care has been taken to ensure that the information contained herein is not untrue or misleading at the time of publication, ING makes no representation that it is accurate or complete. The information contained herein is subject to change without notice. ING Group and any of its officers, employees, related and discretionary accounts may, to the extent not disclosed above and to the extent permitted by law, have long or short positions or may otherwise be interested in any transactions or investments (including derivatives) referred to in this report. In addition, ING Group may provide banking, insurance or asset management services for, or solicit such business from, any company referred to in this report. Neither ING Group nor any of its officers or employees accepts any liability for any direct or consequential loss arising from any use of this report or its contents. Copyright and database rights protection exists in this report and it may not be reproduced, distributed or published by any person for any purpose without the prior express consent of ING. All rights are reserved. Any investments referred to herein may involve significant risk, are not necessarily available in all jurisdictions, may be illiquid and may not be suitable for all investors. The value of, or income from, any investments referred to herein may fluctuate and/or be affected by changes in exchange rates. Past performance is not indicative of future results. Investors should make their own investigations and investment decisions without relying on this report. Only investors with sufficient knowledge and experience in financial matters to evaluate the merits and risks should consider an investment in any issuer or market discussed herein and other persons should not take any action on the basis of this report. This report is issued: 1) in the United Kingdom only to persons described in Articles 19, 47 and 49 of the Financial Services and Markets Act 2000 (Financial Promotion) Order 2005 and is not intended to be distributed, directly or indirectly, to any other class of persons (including private investors); 2) in Italy only to persons described in Article No. 31 of Consob Regulation No. 11522/98. Clients should contact analysts at, and execute transactions through, an ING entity in their home jurisdiction unless governing law permits otherwise. ING Bank N.V., London branch is authorised by the Dutch Central Bank and regulated by the Financial Services Authority for the conduct of UK business. It is incorporated in the Netherlands and its London branch is registered in the UK (number BR000341) at 60 London Wall, London EC2M 5TQ. ING Financial Markets LLC, which is a member of the NYSE, NASD and SIPC and part of ING, has accepted responsibility for the distribution of this report in the United States under applicable requirements. ING Vysya Bank Ltd is responsible for the distribution of this report in India. EQ Additional information is available on request
1
Benelux small & mid caps January 2008
Contents Index of companies 1
Index of companies by sector 2
Changes in target price 3
Summary 4
Top picks 12
Investment theme: Recession scenario analysis 20
Investment theme: Dutch share buybacks 35
Benelux SMC valuation 42 Small caps peaked in June 2007 ............................................................................43 Valuation of European small caps...........................................................................44 Valuation of Benelux small caps .............................................................................47
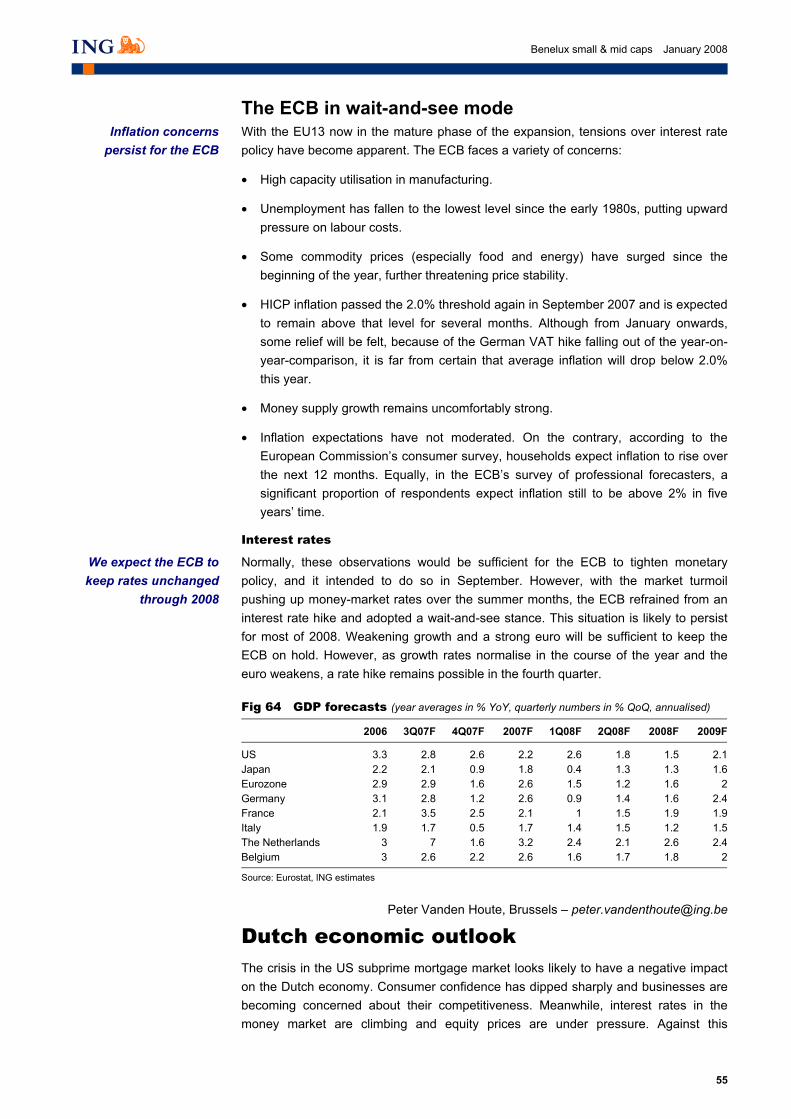
Eurozone: into a lower gear 52
Rankings 59
Companies 69
Disclosures Appendix 261
Cover photograph courtesy of Getty Images
Pricing date 2/1/08 unless stated otherwise
Publication date 9 January 2008
1
Benelux small & mid caps January 2008
Index of companies
Company Page Company Page
Aalberts 70 Kinepolis 166Ackermans & van Haaren 72 Leasinvest Real Estate 168Agfa 74 Macintosh 170Alfacam 76 Melexis 172AMG 78 Metris 174Arcadis 80 Mobistar 176Arseus 82 Montea 178ASM International 84 Nutreco 180Atenor 86 Nyrstar 182Ballast Nedam 88 Océ 184BAM 90 Omega Pharma 186Banimmo 92 OncoMethylome Sciences 188Barco 94 OPG 190Befimmo 96 Option 192Bekaert 98 Ordina 194BESI 100 Pinguin 196Beter Bed 102 Quest for Growth 198BinckBank 104 Randstad 200Boskalis 106 Recticel 202Brunel International 108 Resilux 204CFE 110 Roularta Media Group 206CMB 112 Royal TenCate 208Cofinimmo 114 Samas 210Colruyt 116 SBM Offshore 212Corporate Express 118 Sioen Industries 214CSM 120 Sligro 216Cumerio 122 Smit International 218Deceuninck 124 Super de Boer (Laurus) 220D'Ieteren 126 Telegraaf Media Group 222Draka 128 Telenet Group 224Duvel Moortgat 130 Tessenderlo 226Emakina 132 TiGenix 228Eriks 134 TKH Group 230Euronav 136 TomTom 232EVS 138 Transics 234Exact Holding 140 UCB 236Exmar 142 Umicore 238Fugro 144 Unit 4 Agresso 240Galapagos 146 USG People 242Gamma 148 Van de Velde 244Grontmij 150 Van Der Moolen 246Heijmans 152 Vopak 248Home Invest Belgium 154 Wavin 250Hunter Douglas 156 WDP 252IBA 158 Wereldhave Belgium 254ICOS Vision Systems 160 Wessanen 256Imtech 162 Wolters Kluwer 258Kendrion 164 _
2
Benelux small & mid caps January 2008
Index of companies by sector
Banks Food producers & processors Pharmaceuticals BinckBank 104 CSM 120 Galapagos 146 Nutreco 180 Omega Pharma 186 Beverages Pinguin 196 OncoMethylome Sciences 188 Duvel Moortgat 130 Wessanen 256 UCB 236 Chemicals General retailers Real estate Recticel 202 Beter Bed 102 Banimmo 92 Resilux 204 Macintosh 170 Befimmo 96 Tessenderlo 226 Cofinimmo 114 Umicore 238 Health Home Invest Belgium 154 Arseus 82 Leasinvest Real Estate 168 Construction & building materials IBA 158 Montea 178 Arcadis 80 OPG 190 WDP 252 Atenor 86 TiGenix 228 Wereldhave Belgium 254 Ballast Nedam 88 BAM 90 Household goods & textiles Software & computer services Boskalis 106 Hunter Douglas 156 Exact Holding 140 CFE 110 Sioen Industries 214 Ordina 194 Deceuninck 124 Van de Velde 244 Transics 234 Heijmans 152 Unit 4 Agresso 240 Wavin 250 Investment companies Ackermans & van Haaren 72 Specialty & other finance Distributors Quest for Growth 198 Van Der Moolen 246 Eriks 134 IT hardware Steel & other metals Diversified industrials ASM International 84 AMG 78 Gamma 148 BESI 100 Cumerio 122 Royal TenCate 208 ICOS Vision Systems 160 Nyrstar 182 Melexis 172 Electronic & electrical equipment Océ 184 Support services Barco 94 Option 192 Brunel International 108 Draka 128 Corporate Express 118 EVS 138 Leisure & hotels D'Ieteren 126 Metris 174 Kinepolis 166 Grontmij 150 TKH Group 230 Randstad 200 TomTom 232 Media & entertainment Samas 210 Agfa 74 USG People 242 Engineering & machinery Alfacam 76 Aalberts 70 Emakina 132 Telecommunication services Bekaert 98 Roularta Media Group 206 Mobistar 176 Imtech 162 Telegraaf Media Group 222 Telenet Group 224 Kendrion 164 Wolters Kluwer 258 Transport Food & drug retailers Oil & gas CMB 112 Colruyt 116 Fugro 144 Euronav 136 Sligro 216 SBM Offshore 212 Exmar 142 Super de Boer (Laurus) 220 Smit International 218 Vopak 248
_
3
Benelux small & mid caps January 2008
Changes in target price
Company Recommendation Target price Previous target price
Ackermans & van Haaren Buy 83.00 85.00ASM International Hold 17.00 19.00Ballast Nedam Hold 32.00 39.00BAM Buy 21.00 27.00Corporate Express Hold 5.50 8.00Deceuninck Hold 17.50 20.50Eriks Hold 49.00 62.00Grontmij Hold 27.00 32.00Home Invest Belgium Hold 53.00 60.00IBA Hold 21.00 22.00Océ Hold 12.50 13.50Recticel Hold 11.30 10.60Roularta Media Group Hold 56.00 58.00Royal TenCate Hold 22.00 27.00Umicore Buy 211.00 191.00Wavin Hold 9.50 10.80
Source: ING
_
4
Benelux small & mid caps January 2008
Summary
Benelux small and mid caps have been de-rated since mid-2007, like other European small and mid caps (SMCs), albeit to a lesser extent. Rising aversion to risk, fears of slowing growth and liquidity concerns are behind the SMC meltdown. Our base-case scenario is for a mid-cycle dip but no recession and, as such, we expect Benelux SMCs to deliver slowing, but still double-digit earnings growth, beating the European average in 2008F and matching it in 2009F.
The sell-off has led to more attractive valuations: Benelux SMCs now trade below their long-term average 12-month-forward PERs and at a discount to domestic large caps. In addition, Dutch SMCs trade at a discount to their European peers, while Belgian SMCs are now at a premium. Our preference in terms of investment opportunity is again for Dutch SMCs given their more attractive valuation and growth prospects. The Belgian SMC market is, however, more defensive and growth-oriented.
12 top picks. Although stock picking remains the name of the game among small and mid caps, our selection reflects a preference for the following criteria: (1) defensive profile; (2) earnings visibility; (3) structural versus cyclical growth; (4) strong value chain positioning; (5) limited exposure to the US economy and the US dollar; (6) strong balance sheet; and (7) liquidity.
Fig 1 ING Benelux small- and mid-cap top picks
Country Rec Mkt cap Price Target Upside PER (x) (€m) (€) price (€) (%) 2007F 2008F 2009F
Average 1,980 32.0 18.5 14.1 12.4 Benelux median 673 13.8 14.0 12.6 11.2
Source: ING estimates
_
Investment theme 1: recession impact analysis of Benelux SMCs
We explicitly expect a mid-cycle dip scenario and not the beginning of a recession in 2008. However, parts of the equity markets have had sharply negative reactions to the slowing trend in economic activity indicators in the US and Europe. We have conducted an analysis of what might happen in a recession scenario. Our main conclusions are as follows:
Benelux SMCs do NOT fully discount a recession; we expect 39% downside to current share prices in a recession scenario. All the stocks in our research universe would see downside, ranging from 6% to 90%. We calculate that downward earnings revisions account for 31% of the downside, while multiple contraction, from PER 12.5x to 10.5x, accounts for a further 13%.
5
Benelux small & mid caps January 2008
Summary (cont’d)
We would expect a further 40% downside for Dutch stocks and 30% for Belgian stocks. Earnings for Dutch stocks would go down 34% relative to our 2008F EPS. We find that the trough valuation would be at 9.5x PER (vs 11x currently). Earnings for our Belgian stocks would go down 30% relative to our 2008F EPS. Belgian SMCs would see a trough valuation at 12.5x PER (vs 14x currently).
Most attractive stocks in a market recovery: In the Netherlands, Randstad (Buy), USG People (Buy), Heijmans (Buy), Wavin (Hold), Brunel (Hold) and Aalberts (Buy). In Belgium, Kinepolis (Buy), Omega Pharma (Buy), Tessenderlo (Buy), Metris (Buy), CFE (Buy) and D’Ieteren (Buy), which all score highly on a combination of high share price decline from 2007 highs and a high score in a 50% recession risk/reward analysis
Stocks to avoid in a recession: Stocks with high downside risk in a recession scenario are typically companies with a low level of earnings in 2007, high net debt, cyclical earnings and no significant change in their structural outlook relative to history.
Fig 3 Benelux SMC stocks with high downside in a recession scenario
Netherlands Rec Downside (%)
Current price (€)
Recession price (€)
Belgium Rec Downside (%)
Current price (€)
Recession price (€)
Samas Hold -90 5 0.5 Emakina Hold -68 10.8 3.5Van Der Moolen Hold -79 3 0.6 CMB Buy -56 58.5 26BESI Hold -73 3.7 1 Pinguin Buy -55 16.2 7.2Ballast Nedam Hold -69 27.9 8.6 Agfa Sell -53 10.7 5Vopak Hold -66 38 13.1 Euronav Hold -51 24.3 12Unit 4 Agresso Buy -63 19.3 7.2 ICOS Vision Sys. Buy -48 31 16.1Smit International Hold -62 69 26.1 Barco Buy -46 51.9 28Beter Bed Buy -59 18.2 7.4 Exmar Hold -45 19.9 11Ordina Hold -59 12.2 5 Option Hold -44 5.7 3.2Corporate Express Hold -58 5.2 2.2 Sioen Industries Buy -41 9.8 5.8
The Dutch government has changed the law to allow more dividend-tax-exempt share buybacks as of 2008. As a result, Dutch listed companies’ calculated tax-free share buyback allowance doubles. Companies with strong recent share buyback activity (2004-07) see a significant increase in their available allowance for tax-free share buybacks. We expect a limited impact on small and mid caps (CSM and Wolters Kluwer benefit most) and a significant impact on large caps (particularly Philips, KPN, DSM and TNT).
Fig 2 Downside in recession scenario for Benelux small and mid caps
Median, in %
Recent decline from 12m
high*Expected downside
Expected decline from 12m high
Decline in previous bear market from high**
Dutch small and mid caps -28 -40 -60 -67Belgian small and mid caps -13 -30 -45 -56
Benelux small and mid caps -21 -39 -53 -65
* Recent decline based on the current price and the highest monthly share price in 2007. ** Actual decline in previous bear market measured excluding the lowest share price and the highest share price since 2000 on a monthly basis Source: ING estimates, Bloomberg
6
Benelux sm
all & m
id caps January 2008
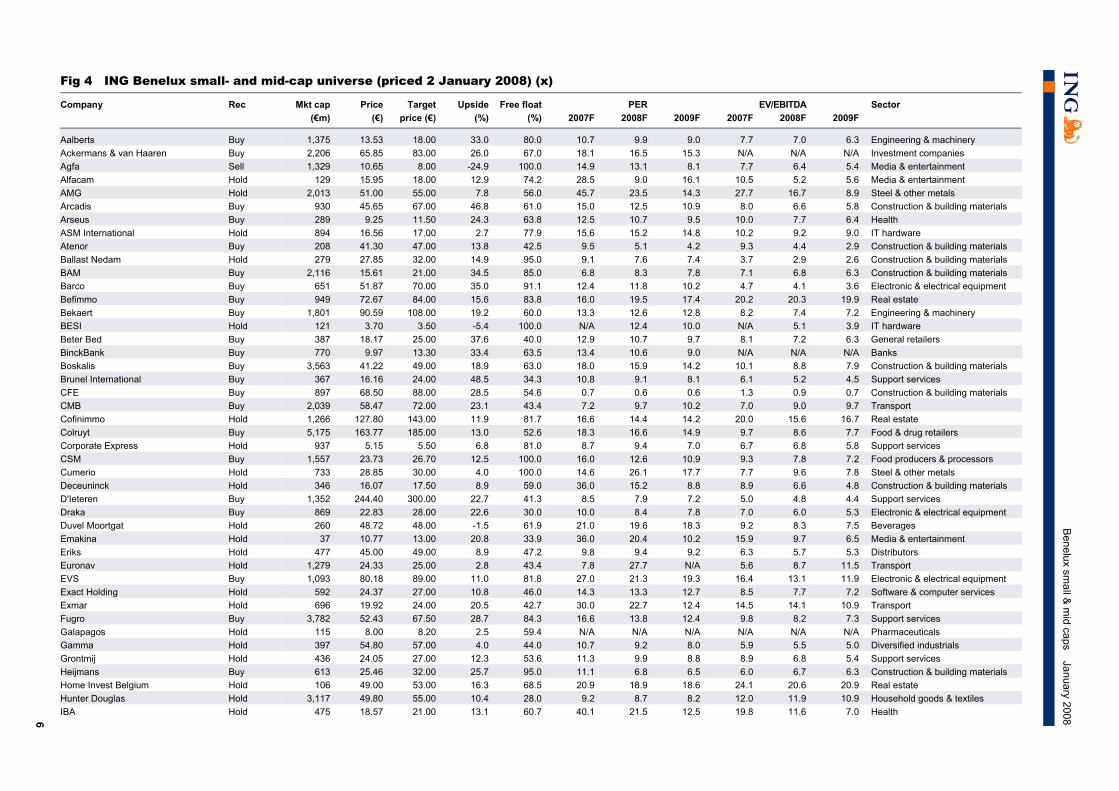
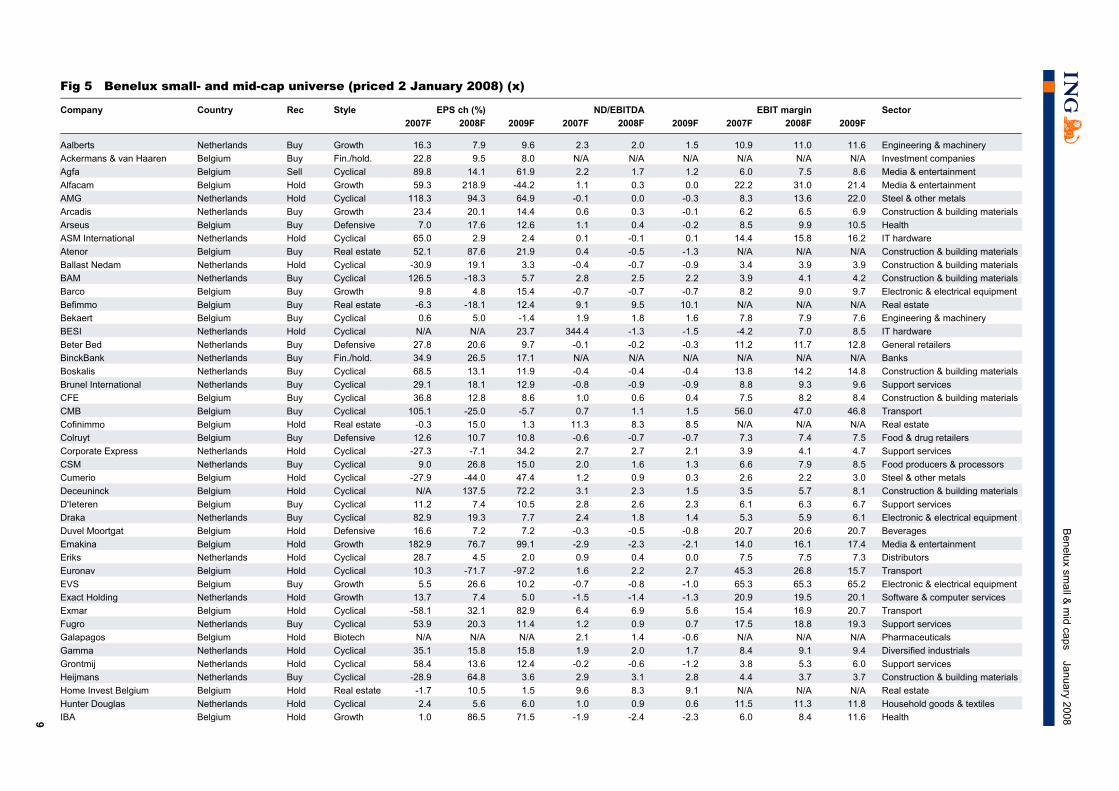
Fig 4 ING Benelux small- and mid-cap universe (priced 2 January 2008) (x)
Our small- and mid-cap universe includes all the Belgian and Dutch companies we cover with a market cap of up to €3bn, plus a few larger companies that we believe are perceived to be local Benelux companies.
The total number of companies covered in this report is 94, of which 45 are Dutch and 49 Belgian. Within our universe, we have selected 12 stocks as our top picks, which are summarised in the tables below. We provide the main points for our investment case over the following pages.
Average 1,980 32 18.5 14.1 12.4 9.2 7.8 6.8Benelux median 673 14 14.0 12.6 11.2 8.4 7.4 6.5
Source: ING estimates
_
As Figure 6 shows, the 32% average upside for our top picks is clearly superior to the average in our Benelux universe (14%). Valuation multiples are more demanding than the Benelux average, but the gap is limited.
As Figure 7 highlights, liquidity, as measured by average free float and market cap, is higher among our top picks than the rest of our SMR universe, and, interestingly, balance sheets are less highly leveraged than the average of our universe. In addition, the rate of de-gearing is stronger, which suggests superior cash generation.
Fig 7 Sector, liquidity, growth and balance sheet metrics
EPS growth (%) Net debt/EBITDA (x) Company Sector Free float (%) 2007F 2008F 2009F 2007F 2008F 2009F
Median 62.0 30.7 18.9 11.7 0.7 0.3 -0.2Benelux median 60.4 15.4 15.0 11.1 1.1 0.9 0.5
Source: ING estimates
_
Universe of 94 stocks
12 top picks
Attractive upside
Superior liquidity and balance sheet strength
13
Benelux small & mid caps January 2008
Aalberts: BUY, TP €18.00 (33% upside) Strong niche player. Aalberts has successfully carried out an impressive string of acquisitions, strengthening its market positions and offering ample room for cross-selling. In terms of its current business mix, Industrial Services generates 31% of turnover and 30% of EBIT, versus 69% and 70%, respectively, for Flow Control. Its leading positions in niche markets give Aalberts strong pricing power, while, on the supply side, its increased scale is very beneficial for its purchasing power, in our view.
Growth story to continue. Aalberts targets top-line growth of 20% pa through acquisitions (10-15%) and organically (5-10%). This has in the past resulted in healthy double-digit EPS growth (c20% on average) over the past ten years. Looking at acquisitions, we believe Aalberts’ war chest is well filled (€250-300m). If the company were to use it, we estimate that it could add 10-15% to EPS. In fact, Aalberts has made a good start to 2008 with an attractive acquisition in Industrial Services.
Sustainable profitability in a recession. The company is more recession-proof than it looks at first sight; history shows that profitability is sustainable in an economic downturn. During the previous recession, Aalberts managed to keep the top line up well (zero organic growth) and to maintain its EBITA margin at high levels (11%).
Valuation: recent share price drop overdone. After reaching a peak of close to €22 in the summer, the stock was hit strongly, declining to its current €13.5 level, implying a very attractive valuation, trading at a 2008F PER of 9.9x, well below its historical range of 12-14x. Taking into account its improved business mix but some slowdown in market conditions, we see a valuation in the middle of the range as justified, giving a target price of €18.00, which is supported by our DCF and SOTP valuations.
Arcadis: BUY, TP €67.00 (47% upside) Arcadis is an international engineering firm with worldwide operations and a bias towards the Netherlands and the US. Half of its €1.2bn revenue is from consultancy on infrastructural work, while c.40% is derived from environmental services. Its main financial objectives are 10% top-line growth (5% organic and 5% from acquisitions) and a 10% EBIT margin. As it is exceeding its EBITA margin target in 2007, we expect the company to raise its target to 11-12% soon.
A compelling story in the Benelux small- and mid-cap arena. Arcadis is firing on all cylinders, fuelled by sound organic sales growth (>10% in 2007F) thanks to favourable market conditions. Furthermore, active portfolio management involving acquisitions and divestments with a shift to higher added value is bearing fruit, together with organic growth, supporting Arcadis’s objective of reaching its margin target soon.
Arcadis is a major-league player in environmental services. Its environmental services business generates double-digit growth and margins. It is a top-five worldwide player in this field after the acquisition of US firm BBL (which added 15% to turnover), a more profitable organisational model in the US and significant synergies (cross-selling and expanding the product/service line with products such as GRiP).
We expect 20% EPS growth pa until 2009 despite very strong growth in the past (40%-plus). Arcadis is a rock-solid investment, supported by a strong balance sheet, a clear strategy and strong execution. At a 2008F EV/EBITDA of 6.6x, the stock trades at a 24% discount to its peer group, which we see as unjustified, particularly given its superior growth and leading position in environmental services. We believe the stock should trade at a 10% premium to the sector; hence our target price of €67.
14
Benelux small & mid caps January 2008
Arseus: BUY, TP €11.50 (24% upside) Arseus was Omega Pharma’s business-to-business (B2B) activity, providing products and services to European healthcare professionals and institutions, such as pharmaceutical compounding products and services, dental consumables and equipment, integrated medical IT solutions (hardware and software). It was spun off through an IPO in October 2007.
Arseus aims to become a pan-European market leader, through acquisitions of companies and selective greenfield operation start-ups. The company targets €500m in sales by 2010F from €300m in 2007F, driven almost equally by internal and external growth. The “Buy and Build” strategy is hence the cornerstone of its business model.
In view of the company’s still limited scale and its still highly Benelux-oriented geographical scope, the potential for expansion is substantial and should offer Arseus major opportunities to benefit from economies of scale, leading to earnings growth above our current forecasts as these are based purely on organic growth.
We rate Arseus a BUY as: (1) the 3Q07 trading update was reassuring; (2) the company’s valuation is low (a 2008F PER of 9.8x, a 2008F EV/EBIT of 8.6x, 37% below sector peers and 24% below the median for Belgian SMCs when comparing PER and EV/EBIT for 2008F and 2009F; our DCF value points to €13.50 per share); and (3) management has indicated that takeovers should come in the very short term. We consider this last point as the main trigger for Arseus’s shares as we believe the external growth should be earnings-accretive. Our €11.50 target price is set at a 15% discount to our estimated DCF value.
Boskalis: BUY, TP €49.00 (19% upside) Boskalis is the market leader in the international dredging market. Dominated by four players, the international dredging market forms a nice oligopoly. This power block operates a large, well diversified and highly efficient dredging fleet, which creates an impregnable barrier to market entry.
Industry book-to-bill at an unprecedented level. In the past two-and-a-half years, the dredging industry has been overwhelmed with orders. As a result, the sector has an average of three years of work, providing excellent visibility. Looking at the global project pipeline, we expect a continuation of large dredging and land reclamation project awards. In this scenario, we expect market demand to exceed current market capacity for a considerable time.
Project picking and bottleneck on supply side boosting prices. The supply side of the dredging market remains tight until end-2011. Project picking is the right strategy to follow in order to enhance operating margins further. In Boskalis’s case, we believe the two harbour-extension and three LNG-related projects won in 2007 will fuel higher operating margins going into 2008, particularly as these types of projects are of vital importance to its customers.
The quality of the 2007 margin improvement provides us with comfort that margins will expand further. The stock trades at a 2009F PER of 14.2x and an EV/EBITDA of 7.9x, the latter matching its previous peak multiple, although comparing the current market situation with previous upturns really understates present market dynamics. Hence, we feel comfortable with our €49 DCF-based target price, which suggests a 2009F target EV/EBITDA of 9.5x.
15
Benelux small & mid caps January 2008
Colruyt: BUY, TP €185.00 (13% upside) A high-growth and high-margin Belgian food retailer. Colruyt realises over 90% of its EBIT through its highly profitable Belgian Colruyt (21% market share) and Okay banners. Other activities include general retail operations under the Dreamland banner, French foodservice and some other smaller operations. Earnings growth is almost completely driven by the Colruyt banner. In case of a consumer spending slowdown, Colruyt is relatively well protected, being low-cost, selling at considerably lower prices than the competition, and having the highest sales densities and margins.
We are optimistic about the group’s sustainable sales growth potential. In the next few years, Colruyt aims to add 12,000m2 of new selling space per annum (+3.5% YoY). Together with estimated like-for-like sales growth of 3% for the Colruyt banner and faster growth at other operations, this should lead to a sustainable 7% organic sales growth rate at high incremental returns.
Highly cash-generative. With a group EBIT margin for 2007F of 7.3%, capex under control and high sales growth, the group should be able to increase free cash flow levels towards €250m per annum. To deal with an over €400m net cash position, Colruyt already bought back €170m worth of own shares in 2007.
Best-in-class player trading below par on 2008F EV/EBIT. We are BUYers of Colruyt as we foresee further high-single-digit organic sales growth in combination with a sustainable 10% net profit growth outlook and a valuation that does not reflect its sound growth profile. The shares currently trade at a 5% discount to peers on 2008F EV/EBIT (10.8x), which adds to the attractiveness of the stock as suggested by the 13% upside to our DCF-based €185 target price.
Fugro: BUY, TP €67.50 (29% upside) Dominant player in specific niches of the oil services industry. Fugro is a global engineering firm, with 71% of its €1.4bn revenues related to oil & gas, 21% to construction and 6% to mining. Fugro has leading (often dominant) global market positions in all of its three divisions: Geotechnical (on- and offshore); Survey (on- and offshore and positioning); and Geoscience (airborne, seismic and reservoir modelling).
Capex boom in oil & gas offers upbeat long-term prospects. Oil majors have underinvested for years, and are having difficulties maintaining reserves and output at adequate levels. As a result, the oil & gas industry is experiencing an unprecedented investment boom, leading to double-digit increases in capex. This structural boom could continue for as long as a decade. Note that we are particularly upbeat on Fugro’s seismic and survey activities over the next few years (together c.62% of sales).
We expect a 27% EPS 2006-09F CAGR, significantly higher than the 15% of its peers in the European oil services sector. This is on the back of: (1) double-digit organic revenue growth (2007F: 20%), mainly because Fugro’s late 2006 extra investments in equipment and ships were well received by clients who seem to have an insatiable demand for Fugro’s services in seismic and survey; and (2) small to medium-sized acquisitions that offer valuable add-on services in exchange for Fugro’s worldwide network considerably raising their productivity and earnings.
Our favourite in the sector and one of our favourites among Benelux small and mid caps. At a 2008F EV/EBITDA of 8.2x, Fugro is valued at a 15% discount to the European oil services sector. Given its strong outlook, dominant market positions and superior earnings growth, we believe Fugro should be valued in line with the sector.
16
Benelux small & mid caps January 2008
Imtech: BUY, TP €25.00 (51% upside) Dominant player in Benelux and German markets. Imtech derives c.32% of sales from the Benelux market and c.30% from Germany. Fortunately for the company, both markets happen to be in recovery mode. Imtech also operates very profitable branches in the UK and Spain (together c.12% of sales), and via its ICT & Technology division (26% of sales) it offers high-added-value technical services, ranging from mechanical engineering to IT services.
Our model assumes a 5.7% EBITA margin in 2008F. Although this is in line with management’s long-term margin target (6% before holding costs), the consensus is well below this number at c.5%. We strongly believe the market is underestimating the late-cyclical nature of the technical services business. Non-listed peer group analysis shows that industry margins bottomed in 2005-06. We therefore expect a strong rebound in profitability over the next two years.
Imtech’s vigorous acquisition path has repositioned the business model. Imtech has bought many companies over the past few years, not only strengthening its market positions, but, in our view, also enhancing its profitability footprint. These acquisitions are expected to surprise on the upside, and this could be a vital driver to the group reaching management’s margin targets, surprising consensus expectations.
Our favourite in Dutch construction. Based on our €25 target price, Imtech would trade at a 2009F EV/EBITDA of 8.4x. Our target price is backed by a DCF analysis, which uses an unleveraged balance sheet. Our model does not incorporate further acquisitions. The reality is likely to be different. Assuming a more leveraged balance sheet structure, our DCF valuation would easily exceed €30.
Kinepolis: BUY, TP €57.00 (71% upside) Kinepolis is a digital media group that operates 318 cinema screens, mainly in Belgium, France and Spain. In Belgium (51% of sales), it is the leading operator with 139 screens. The company owns 860,000m² of real estate assets.
We believe Kinepolis is a defensive stock, with good visibility on earnings growth. Top-line growth should come from: (1) higher ticket prices (digital projection, which should account for 100% of the showings by mid-2009, allows Kinepolis to increase ticket prices by close to 11%); and (2) increased spend by visitors through the remodelling of the theatres that will be rolled out internationally within the next three years. Based on Kinepolis’s pilot projects, we conservatively assume that food and beverage spending will increase by 30% internationally by 2010 (versus 1H07 figures).
There is also value in its real estate. We estimate the value of Kinepolis’s property portfolio (860,000m², made up of cinema theatres, concessions and parking spaces) at €353m, compared with a book value of €247m. We expect Kinepolis to split the company internally into two divisions: real estate and cinema. As such, the real estate division would rent out its theatres to the cinema division. We expect the real estate division to gradually develop its properties, and hence realise important capital gains.
We rate Kinepolis a BUY, with a target price of €57, based on a SOTP model in which we value the company’s real estate at €353m and its cinema activities at €190m, implying a very cautious 2008F EV/EBITDA of 7x ‘after real estate rent’. Kinepolis’s peers trade at 7.5-8.5x 2008F EV/EBITDA on average.
17
Benelux small & mid caps January 2008
Telenet: Buy, TP €23.50 (19% upside) Market leader in Flanders for broadband internet and TV business. Telenet is one of the most advanced cable operators in Europe. Its network is limited to Flanders, which makes its 33% broadband market share even more impressive, and it is the only company that has been able to rival Belgacom’s domination of Belgium.
At the end of 2007, Telenet announced a promising deal with Interkabel. The firm obtained an agreement in principle to acquire Interkabel’s 0.8m TV customers (vs 1.7m existing customers at Telenet) for 8x EV/EBITDA, which appears to us a fair price. We estimate that this should add approximately €1.5 of fair value per share (coming from cost synergies and incremental customer intakes) if it proceeds in the current framework. The closing of the transaction (to be approved by inter-municipalities), expected for early 2Q08, should act as a catalyst for the stock.
Telenet, engaged in the upgrade of its network (expected to increase its access speed significantly), released a good set of results last year, seeing its EBITDA margin gradually increase to 50% in 3Q07. Broadband internet and digital TV, its two most promising and revenue-generating products, show strong growth of 16% and 86%, respectively. Furthermore, unlike traditional telecom companies, Telenet’s cable network is not subject to any regulation.
A defensive stock with little downside risk. The stock trades at 7.8x EV/EBITDA, which compares with 7.3x for US peers and M&A transaction multiples of 9-10x. In our opinion, the market has not yet factored in the completion of the refinancing plan (expected to allow the transaction with Interkabel and a potential further capital reduction of €1 per share).
Transics: BUY, TP €24 (35% upside) Transics is the number-two player in Europe in the fleet management solutions (FMS) market, with a 7% market share. FMS is a complex information system that enables companies in the transport and logistics sector to manage all aspects relating to a fleet of vehicles with real-time information in order to increase efficiency, reduce costs and improve customer services. Offering exclusively high-end FMS to customers, Transics has a strong track record of growth and profitability, with 2004-06 organic revenue and EBITDA growth of 39% and 193%, respectively.
Transics is a pure growth company that should benefit from: (1) strong expected market growth; (2) market share gains; and (3) industry consolidation. The industry growth is driven by the increasing need for transport and logistics companies to increase efficiency, reduce costs and differentiate their offer as well as a favourable regulatory environment. Transics should, in our view, gain further market share thanks to a sound development strategy: a high-end product portfolio offer, rapid international expansion into Europe where the market is still under-equipped, and a strong and stable management team.
Attractive valuation. In terms of valuation, at the current share price, Transics trades at a 2007F EV/EBIT of 14.6x and an EV/EBITDA of 11.7x and at a 2008F EV/EBIT of 10.8x and EV/EBITDA of 8.8x. The average discount to peers is c.50%. We believe the discount is unjustified given the company’s strong growth prospects and strong cash generation (FCF yield of 5%).
18
Benelux small & mid caps January 2008
Umicore: BUY, TP €211 (25% upside) Umicore is a materials technology group with leading market shares in most of its activities, which range from automobile catalytic converters (close to number-one worldwide), to cobalt and germanium processing (worldwide leader) and precious metals recycling (worldwide leader). The company has transformed itself from a metals and mining firm into a company focused on high-value-added materials, providing Umicore with a more structural growth profile (not yet reflected in its valuation).
We see significant upside in valuation terms as the expected re-rating triggered by the Nyrstar (zinc smelting) disposal has been overshadowed by market turmoil. The valuation discount highlights Umicore’s speculative appeal with its 100% free float and its rising scarcity value via its exposure to the prized auto catalyst market. (Engelhard was taken out in 2006 by BASF at 10x EV/EBITDA, leaving Johnson Matthey (JM) and Umicore as sole sector plays.) Umicore is a clear takeover target.
Umicore is also proactively rewarding shareholders with: (1) a €400m share buyback programme (financed by the €700m net proceeds from the Nyrstar disposal); (2) a 1.2m share cancellation; and (3) a five-for-one stock split expected soon. The balance sheet should remain strong from €250m pa FCF generation expected, despite our forecast of a sharp fall in Hoboken’s contribution on lower precious metal prices.
Umicore’s growth and return profile should improve radically post the Nyrstar disposal. We expect enhanced returns, lower earnings volatility and a more attractive overall profile, which should fuel a re-rating towards peer multiples, from a 30% discount to JM currently. Our SOTP-derived TP is €211, at which level the stock would trade at an 11% discount to JM. The strength of precious metal prices could lead to earnings surprises. Finally, we see strong support from Umicore’s speculative appeal.
Wessanen: BUY, TP €13.00 (19% upside) Market leader in natural and organic food. Almost half of Wessanen’s 2008F sales are generated from natural and organic brands. The other half comes from its distribution arms in Europe and the US (TOL). Wessanen seems to have resolved the problems at TOL after two years of downturns. EBIT growth is expected to follow suit. In European branded, benefits from restructuring will kick in at Favory Frozen in 2008.
EBIT margins should accelerate. TOL has passed the inflection point, with positive sales revisions likely at the 2007 results. In 2008, Wessanen might consider disposing of TOL, which would be a major trigger. Furthermore, with the restructuring of Favory Frozen paid for in 2007 and cash flow set to increase quickly in 2008F, Wessanen might opt for a gradual reduction of its 60% stake, perhaps with an opportunity to deconsolidate in 2009. Finally, the European branded portfolio should not be held back by the loss of sole agency contracts and further support from step-up in A&P spending.
Further reduction in NWC. NWC should recover (from 3Q07) towards the year-end from a good sell-through. With net debt to EBITDA of c.1.2x for 2008F, Wessanen is well positioned to engage in further share buybacks or to consolidate on its number-one position in natural and organic European branded products.
Low valuation in a food & beverage context. Wessanen is currently at a 2009F PER of 12.1x, which represents more than a 40% discount to its large-cap peers. On a 2009F EV/EBITDA of 7.8x, the discount is 43%. Wessanen’s dividend yield of 5.9% should provide further support for the shares. The two ‘call options’ on a sale of TOL and deconsolidation of Favory Frozen are the potential icing on the cake.
19
Benelux small & mid caps January 2008
September 2007 top picks’ performance Fig 8 Share price performance of ING’s September 2007 top picks
While our two previous selections of top picks performed strongly (up 13% in our September 2007 review and 37% in our May 2007 review), the performance of the selection chosen in September 2007 has suffered dearly from a small- and mid-cap sell-off, particularly among our Belgian selection. Omega Pharma issued an unfortunate profits warning in mid-October, which sent the stock down, reaching a low of €38.76 on 21 November, followed by a recovery. Barco suffered from its US$ exposure, and Kinepolis reported weaker-than-expected ticket sales in mid-November.
On the Dutch side, Wavin was hit by its profits warning and its cyclical/construction exposure, while Boskalis continued to ride the dredging wave, which remains very strong. The performance of Vedior was boosted by Randstad’s bid on the stock in early December 2007.
Sharp underperformance from
the Belgian selection
20
Benelux small & mid caps January 2008
Investment theme: Recession scenario analysis
Conclusions In general, our bottom-up share price recommendations are based on a mid-cycle dip scenario, in line with the view of ING’s economists and strategists. However, parts of the equity markets have had sharply negative reactions to the slowing trend in economic activity indicators and lowered economic growth expectations in both the US and Europe. It seems that some parts of the equity markets are pricing in a high chance of recession. We believe it is time to ask the question: “Are equity markets pricing in a recession in Benelux SMCs, and even if not, what would the downside be?” We have carried out a bottom-up recession analysis of our Benelux SMC universe in an attempt to answer this question and include an impact analysis of a recession on share prices, earnings, balance sheets and valuation as well as a risk/reward analysis between a mid-cycle dip and a recession scenario at an individual stock level.
Our main conclusions are as follows:
• The share prices of Benelux SMCs do not fully discount a recession as we see a further 39% downside on top of the recent 21% since the highs in 2007. All the stocks in our universe would see downside in a recession, ranging from 6% to 90%.
• Downward earnings revisions account for 31% of the downside, while the de-rating from the current 12.5x PER to a 10.5x PER accounts for a further 13%.
• We would expect Dutch stocks to see 40% further downside in a recession. Earnings in our Dutch universe would go down 34% relative to our 2008F EPS. We find that the trough valuation would be at 9.5x PER (vs 11x currently).
• We would expect Belgian stocks to see 30% further downside. Earnings for our Belgian stocks would go down 30% relative to our 2008F EPS. Belgian SMCs would see a trough valuation at 12.5x PER (vs 14x currently).
• The total share price correction from 2007 highs to a recession low would be 53%, lower than the 65% decline seen in the 2001-03 bear market.
Fig 9 Downside in recession scenario for Benelux small and mid caps
Median (%) Recent decline from 12m high* Expected downsideExpected decline from 12m
highDecline in previous bear
market from high**
Dutch small and mid caps -28 -40 -60 -67Belgian small and mid caps -13 -30 -45 -56
Benelux small and mid caps -21 -39 -53 -65
* Recent decline based on the current price and the highest monthly share price in 2007 ** Actual decline in previous bear market measured taking the lowest share price and the highest share price since 2000 on a monthly basis Source: ING estimates, Bloomberg
_
Our recommendations are based on a mid-
cycle dip scenario…
… but what would the downside to share prices be should a
recession materialise?
9% downside potential with 6% to 90% range
Earnings are more at risk than multiple
contraction
Dutch SMCs to bottom at c.9.5x PER and
Belgians at c.12.5x
21
Benelux small & mid caps January 2008
Fig 10 Breakdown of downside risk by PER contraction and EPS decline
Median, in % Downside share price
(%) Decline in EPS from
2008FCurrent 12m forward
PER 2008F (x)Est. recession 12m
forward PER (x) Estimated de-rating in
12m forward PER (x)
Dutch small and mid caps -40 -34 10.9 9.5 -17Belgian small and mid caps -30 -30 14.1 12.5 -8Benelux small and mid caps -39 -32 12.5 10.5 -15
Source: ING estimates
_
Please find below a selection of Dutch and Belgian stocks that we would expect to see the highest and lowest downside, respectively, in a recession.
• Stocks with high downside risk in a recession scenario are typically companies with a low level of earnings in 2007, high net debt, cyclical earnings and no significant change in their structural outlook relative to history. We would advise investors fearing a recession to avoid these stocks.
• Stocks with the lowest downside risk have a more defensive growth profile, have seen a significant change in their structural outlook relative to their history and are lowly valued relative to their history.
• We have run a risk/reward analysis with a 50% probability of a recession and the stock performance since the high in 2007 and find that, among Dutch stocks, Randstad (Buy), USG People (Buy), Heijmans (Buy), Wavin (Hold) and Brunel (Buy) are most attractive if investors purely want to play a mid-cycle dip scenario, Omega Pharma (Buy), Tessenderlo (Buy), Metris (Buy), CFE (Buy) and D’Ieteren (Buy) are the most attractive Belgian stocks.
Fig 11 Benelux SMC stocks with high downside in a recession scenario
Netherlands Rec Downside
(%)Current
price (€)Recession
price (€) Belgium Rec Downside
(%)Current
price (€)Recession
price (€)
Samas Hold -90 5.0 0.5 Emakina Hold -68 10.8 3.5Van Der Moolen Hold -79 3.0 0.6 CMB Buy -56 58.5 26.0BESI Hold -73 3.7 1.0 Pinguin Buy -55 16.2 7.2Ballast Nedam Hold -69 27.9 8.6 Agfa Sell -53 10.7 5.0Vopak Hold -66 38.0 13.1 Euronav Hold -51 24.3 12.0Unit 4 Agresso Buy -63 19.3 7.2 ICOS Vision Systems Buy -48 31.0 16.1Smit International Hold -62 69.0 26.1 Barco Buy -46 51.9 28.0Beter Bed Buy -59 18.2 7.4 Exmar Hold -45 19.9 11.0Ordina Hold -59 12.2 5.0 Option Hold -44 5.7 3.2Corporate Express Hold -58 5.2 2.2 Sioen Industries Buy -41 9.8 5.8
Source: ING estimates _
Fig 12 Benelux SMC stocks with low downside in a recession scenario
Netherlands Rec Downside
(%)Current
price (€)Recession
price (€) Belgium Rec Downside
(%)Current
price (€)Recession
price (€)
OPG Hold -11 18.7 16.7 Mobistar Hold -6 61.5 57.8Wolters Kluwer Hold -13 22.1 19.2 Kinepolis Buy -10 33.3 30.0Kendrion Hold -13 17.3 15.0 Omega Pharma Buy -16 46.8 39.3Randstad Buy -24 27.6 21.0 CFE Buy -16 68.5 57.3SBM Offshore Hold -25 21.2 16.0 Telenet Group Buy -17 19.8 16.4Hunter Douglas Buy -25 49.8 37.2 Atenor Buy -19 41.3 33.5Wavin Hold -26 9.1 6.7 Alfacam Hold -20 16.0 12.7Sligro Hold -27 27.4 20.0 IBA Hold -21 18.6 14.8CSM Buy -29 23.7 16.9 Van de Velde Buy -21 37.5 29.4Heijmans Buy -29 25.5 18.0 Colruyt Buy -22 163.8 128.5
Source: ING estimates
_
Avoid high net debt, low level earnings, cyclical
earnings and lack of structural changes
Look for more defensive growth profile, low
valuation relative and structural change
Some cyclical stocks seen to discount a lot of
bad news
22
Benelux small & mid caps January 2008
Introduction Our current earnings forecasts, recommendations and target prices for Benelux small- and mid-cap companies are in general based on still benign economic growth in Europe and Asia and a slowdown in the US economy (but not a recession). This is in line with the view of ING’s economists and strategists. They have adjusted their forecasts for economic growth for Europe downward and are of the opinion that the slowdown in the US might actually feel like a recession. We think the market consensus is more positive on economic growth in Europe and the US.
The current forecast weakness (or slowdown) in economic growth in the US and Europe in 2008F should still be seen within the context of a mid-cycle dip scenario, and growth is expected to pick up in 2009F. Our view of a broad-based turning of the cycle and recession is still a couple years out.
However, we cannot ignore recent declines in some important economic indicators (such as the US ISM Manufacturing Index), continued weakness in the US housing market, a standstill in the financial sector and record oil prices, which might lead to a recession in the US and the chance that a US recession will spill over into Europe as happened with the recessions in the early 1980s, 1990s and 2000s.
Moreover, the recent heavy fall in (certain segments of) the equity markets might be taken as an indicator of lower future economic growth. The least we can say is that equity markets seem to be pricing in a higher chance of a broader-based economic slowdown. And while we are of the opinion that valuations among Benelux SMCs are attractive in light of recent historical levels and forecast earnings growth, we feel the uncertainty in the market with regards to the direction of the economy justifies an analysis of what could happen to the earnings, valuations, balance sheets and share prices of Benelux SMCs in case of a broad-based recession and an accompanying bear market in equities. This ultimately demands an assessment of the downside risk to current share prices should a recession materialise. We have carried out a bottom-up stock analysis to do so. A detailed discussion of the methodology used can be found later in this section.
Basic recession scenario assumptions Assessing the earnings potential of individual SMC stocks during a recession is a difficult exercise and we would not advise investors to see the outcome of our analysis as an absolute projection of where earnings will end up, as many factors play a role in the determination of such a forecast.
We have taken the following basic assumptions regarding a recession scenario:
• Economic growth to slow down severely in 2008-10, with the market realising peak earnings in 2007-08. This implies a recession environment in 2009-10 and earnings to reach a trough at the end of 2009 and early 2010. This scenario is similar to the last recession that hit Benelux SMCs in 2002-03, when earnings peaked in 2000/01 and economic growth slowed severely in 2001-03. Earnings forecasts troughed at the end of 2002 and the beginning of 2003.
• An assessment of the performance of companies and stocks in the previous recession period (2000-03) has been made based on organic sales growth, EBITA margin development and share prices.
Our forecasts are based on a mid-cycle dip
scenario, in line with ING economists’ view
2008F GDP for the US is weak; Europe and Asia
should be good…
… but markets seem to have priced in a higher
chance of a broader based slowdown...
… which justifies a recession impact
analysis for Benelux stocks
A bottom-up analysis of earnings, financial
positions, valuations and share prices
23
Benelux small & mid caps January 2008
• We have taken into account: changes in activities, segmental exposure and competitive positions; the outlook for the sector; geographical exposure; currency exposure; management; cost structure; debt positions; and other factors that could result in a deviation from the historical performance.
• Not taken into account are possible future events such as M&A, increased capital returns, restructurings in the broadest sense and management changes.
• Today’s currency spot rates have been taken as a proxy for future spot rates.
• We have used the Benelux SMCs currently under ING coverage, excluding stocks that are currently bid for, real estate, holdings and biotech stocks.
Earnings in a recession scenario Performance in the 2000-03 recession: strong decline in EBITA
We find that, in the previous recession period of 2001-03, Dutch companies experienced a 5% organic decline in sales and a 470bp decline in EBITA margin, from 8.7% (in peak year 2000) to 4.0% (through year 2003).
Belgian companies saw a less pronounced decline in organic sales of 2%, but a slightly higher decline in the EBITA margin of 510bp, from 10.3% (in peak year 2000) to 5.2% (through year 2002).
Fig 13 Operating performance of Benelux SMCs in previous recession, 2000-03
Median (%) Organic sales
change Peak EBITA
margin YearThrough EBITA
margin Year Change
(bp)
Dutch small and mid caps -5 8.7 2000 4.0 2003 -470Belgian small and mid caps -2 10.3 2000 5.2 2002 -510
Benelux small and mid caps -4 9.2 2000 4.1 2003 -512
Source: ING estimates
_
We have not calculated the net earnings and EPS declines in this period as such an analysis would be too distorted by changes in tax rates, minorities, associates, debt positions, interest rates and shares outstanding due to restructurings, profit-to-loss swings, acquisitions and divestitures, and return of capitals, among other things.
Expected performance in recession scenario: still severe impact on EPS
Fig 14 Operating performance of Benelux SMCs in our recession scenario
Median (%) Organic sales
change Peak EBITA
margin 2008F
Trough or recession low EBITA margin
Change 2008F - Trough (bps)
EPS change 2007F - recession
low
EPS change 2008F - recession
low
Dutch small and mid caps -4 8.0 6.0 -197 -25 -34Belgian small and mid caps -1 13.1 8.0 -507 -22 -30
Benelux small and mid caps -2 9.0 7.0 -198 -23 -32
Source: ING estimates
_
Our analysis of the operating performance of Benelux SMCs shows that the sales and margin declines in our recession scenario are estimated to be less severe than in the previous recession. However, the impact on earnings can still be called severe, with earnings down 32% from our current 2008F EPS.
24
Benelux small & mid caps January 2008
A number of factors are behind these less severe expected declines, including:
• The addition of new companies, of which two are in Netherlands (AMG and BinckBank) and nine are in Belgium (Alfacam, Emakina, Euronav, Exmar, IBA, Metris, Option, Telenet and Transics), as well as a better data set on some of the other companies in our analysis vs historical data.
• More critical mass and more diversification as most SMCs have grown considerably in 2003-07F in terms of both size and activities.
• Higher expectations of better cost management (flexibility), more professional management, a better starting point now than in 2000-01 (less acquisitions now) and a lower level of indebtedness.
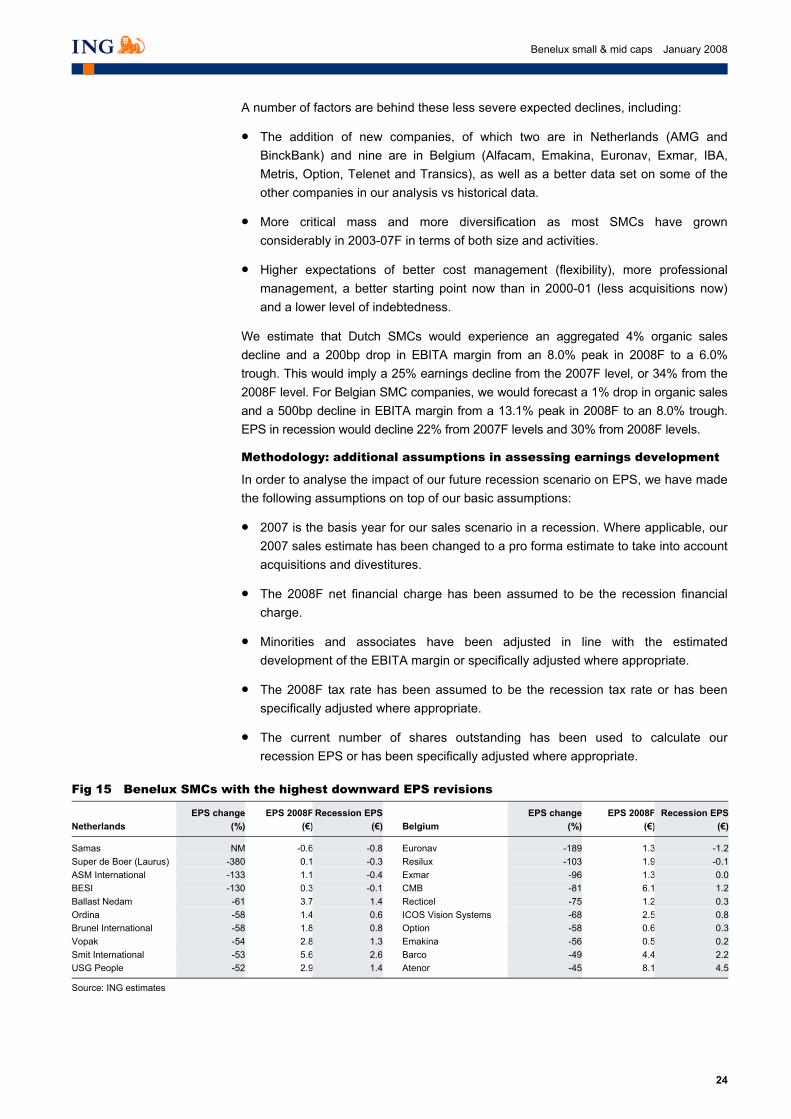
We estimate that Dutch SMCs would experience an aggregated 4% organic sales decline and a 200bp drop in EBITA margin from an 8.0% peak in 2008F to a 6.0% trough. This would imply a 25% earnings decline from the 2007F level, or 34% from the 2008F level. For Belgian SMC companies, we would forecast a 1% drop in organic sales and a 500bp decline in EBITA margin from a 13.1% peak in 2008F to an 8.0% trough. EPS in recession would decline 22% from 2007F levels and 30% from 2008F levels.
Methodology: additional assumptions in assessing earnings development
In order to analyse the impact of our future recession scenario on EPS, we have made the following assumptions on top of our basic assumptions:
• 2007 is the basis year for our sales scenario in a recession. Where applicable, our 2007 sales estimate has been changed to a pro forma estimate to take into account acquisitions and divestitures.
• The 2008F net financial charge has been assumed to be the recession financial charge.
• Minorities and associates have been adjusted in line with the estimated development of the EBITA margin or specifically adjusted where appropriate.
• The 2008F tax rate has been assumed to be the recession tax rate or has been specifically adjusted where appropriate.
• The current number of shares outstanding has been used to calculate our recession EPS or has been specifically adjusted where appropriate.
Fig 15 Benelux SMCs with the highest downward EPS revisions
Companies with the highest downward earnings revisions in a recession scenario are:
• Companies with a low earnings base turning into losses, such as Samas, Super de Boer, BESI in the Netherlands. ASM International, Euronav and Resilux are also expected to generate losses in a recession scenario.
• Cyclical companies in general, such as ASM International, Ballast Nedam, Ordina, Brunel, Vopak, Smit International, USG People in the Netherlands, and Euronav, Resilux, Exmar, CMB, Recticel, ICOS, Option, Emakina, Barco and Atenor in Belgium.
The latter category also includes companies that have seen exceptionally high earnings because of very favourable sector circumstances, which we do not expect to be sustainable in a two- to three-year recession period, including Vopak and Smit International in the Netherlands and Euronav, Exmar, CMB and Atenor in Belgium.
Fig 16 Benelux SMCs with the lowest downward EPS revisions
* Kendrion benefits from recent changes in its activity portfolio, lifting its margin profile ** TomTom based on a stand alone scenario, excluding the proposed takeover of Tele Atlas Source: ING estimates
_
We find that Benelux companies with expected low earnings revisions (some even managing to grow) are:
• Defensive (OPG, SBM Offshore, Wolters Kluwer, Sligro, CSM in the Netherlands; and Mobistar, Telenet, Duvel and Colruyt in Belgium).
• Experiencing a significant change in their activity portfolio due to a changed profile or sector outlook (Kendrion and Royal TenCate in the Netherlands; and Pinguin, CFE and Umicore in Belgium).
• Growth companies (TomTom in Netherlands; IBA, EVS in Belgium).
• Contrary to intuition, cyclical companies such as Aalberts, Océ, Melexis and Umicore.
Financial position in a recession scenario To assess the financial position of Benelux SMCs, we have used net debt to 2008F EBITDA as a proxy. We find that the overall financial position of both Dutch and Belgian SMCs is currently healthy (at 0.9x for 2008F), with a slightly higher ratio in the Netherlands (at 0.9x) than Belgium (at 0.7x). In a recession scenario, the ratio would be slightly higher, as shown in Figure 17.
26
Benelux small & mid caps January 2008
Fig 17 Current (2008F) and recession financial position of Benelux small and mid caps
Median (x) Net debt/EBITDA 2008FRecession net
debt/EBITDA Change
Dutch small and mid caps 0.9 1.0 0.1Belgian small and mid caps 0.7 0.9 0.2
Benelux small and mid caps 0.9 0.9 0.1
Source: ING estimates
_
Methodology: assumptions behind recession net debt/EBITDA
We have used the following additional assumptions behind our forecast net debt and EBITDA in a recession scenario:
• Recession EBITDA is analysed by taking the recession EBITA as forecast under the assumptions set in the earnings section above and adding our current 2008 estimate for depreciation.
• Recession net debt is forecast by taking our current 2008 net debt estimate as a proxy for net debt at the end of the recession. While this method has its limitations (as it might under- or overestimate actual net debt in a recession), it keeps the analysis simple.
Financial position: divergence in balance sheet strength
Fig 18 Benelux small and mid caps with high net debt to EBITDA in a recession scenario (x)
We would expect the market to dislike leveraged balance sheets in times of recession. While we consider a 3.0x net debt/EBITDA ratio to be safe for cyclical companies, we expect ratios over 2.0x to weigh on the equity value of leveraged companies.
The companies that score badly in the Netherlands on financial leverage are Samas and Super de Boer (Laurus), and we would expect financiers to aggressively push these companies to reduce debt and find additional cash (through disposals) and/or equity financing (debt for equity swap).
Our assessment of Heijmans and Corporate Express, which would have net debt/EBITDA ratios over 3.0x, is that their financial position would not become critical but that they could come under close monitoring by their financiers.
In Belgium, we find shipping companies Exmar, Euronav and CMB to have the highest net debt positions in a recession scenario. While their ratios are high, this should be seen within the context of how these companies operate and finance their fleets. With this in mind, we do not foresee many problems with financing, not least because these
27
Benelux small & mid caps January 2008
companies’ assets are liquid enough to be sold and could be used to generate cash to pay down debt.
Exmar’s current and recession net debt positions are inflated by the heavy external financing of LNG ships, which are backed by long-term (up to 20-year) non-recourse contracts. Taking LNG out of Exmar’s balance sheet would see ratios for the remainder of the company decline considerably to less than 2x for 2008F and to 4.7x in a recession, which would not be a problem as the LPG business has contracts for the mid segment of one to five years.
Euronav’s spot-driven business could lead to EBITDA pressure in a recession. However, on entering a recession, Euronav would be able to sell assets at market prices in order to generate cash. Although revenues from asset sales could disappoint in weak markets, we would expect banks to look beyond a downturn as Euronav has a relatively good balance sheet within the sector (and a young double-hull fleet).
CMB’s net debt to EBITDA could increase sharply in a recession, but fleet coverage of 100% for 2008 and 70% for 2009 implies limited risk of a downturn. For 2010, CMB indicates that it has covered 40% of its Capesizes; this means that only if bulk prices sink below US$17,000 per day (from US$160,000 now) would net debt to EBITDA reach 3.4x.
Recticel and Sioen could find themselves under close monitoring from their financiers, but their financial position would not come into critical territory.
Fig 19 Benelux small and mid caps with low net debt to EBITDA in a recession scenario
In Figure 19, we show the companies that would have the strongest financial positions in a recession scenario. Most companies are currently estimated to have net cash positions in 2008F, and most companies (with the exception of IBA) should see their net cash position improve due to continued cash flow generation. These companies should have the balance sheet strength to potentially return excess capital to shareholders to support the share price.
We have excluded TomTom and Randstad from the analysis above as their estimated net cash positions are likely to be converted to net debt positions if and when they finalise the acquisitions of Tele Atlas and Vedior, respectively. We have excluded BAM (3.3x) and SBMO (2.8x), where the net debt position reflects specific project financing and non-recourse debt, and Wolters Kluwer (2.7x), where earnings are defensive. We also excluded ASMI and BESI because of their expected generation of losses in a recession scenario, even though they would maintain their net cash position.
28
Benelux small & mid caps January 2008
We would expect Van der Moolen, Emakina and ICOS Vision Systems to maintain their net cash position and a rise in the net debt to EBITDA ratio, but the latter is solely due to a sharply lower EBITDA; as such, we have excluded them.
Valuation analysis in recession scenario Historical perspective: the Netherlands
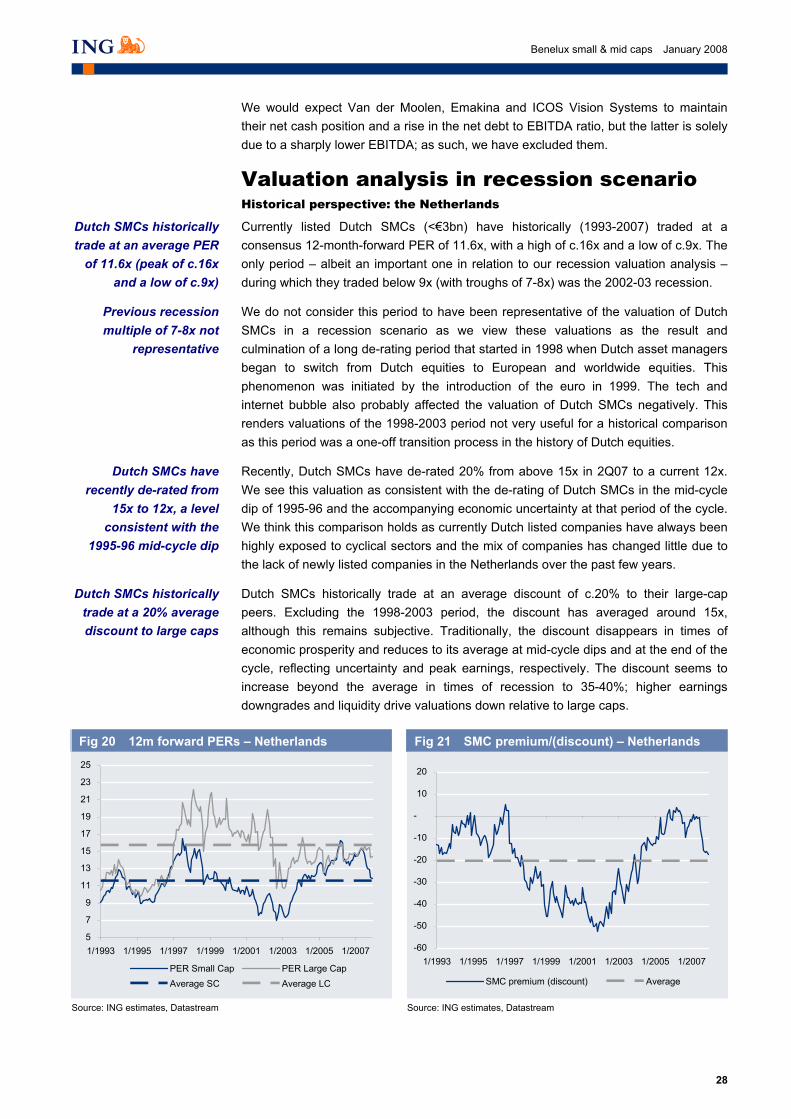
Currently listed Dutch SMCs (<€3bn) have historically (1993-2007) traded at a consensus 12-month-forward PER of 11.6x, with a high of c.16x and a low of c.9x. The only period – albeit an important one in relation to our recession valuation analysis – during which they traded below 9x (with troughs of 7-8x) was the 2002-03 recession.
We do not consider this period to have been representative of the valuation of Dutch SMCs in a recession scenario as we view these valuations as the result and culmination of a long de-rating period that started in 1998 when Dutch asset managers began to switch from Dutch equities to European and worldwide equities. This phenomenon was initiated by the introduction of the euro in 1999. The tech and internet bubble also probably affected the valuation of Dutch SMCs negatively. This renders valuations of the 1998-2003 period not very useful for a historical comparison as this period was a one-off transition process in the history of Dutch equities.
Recently, Dutch SMCs have de-rated 20% from above 15x in 2Q07 to a current 12x. We see this valuation as consistent with the de-rating of Dutch SMCs in the mid-cycle dip of 1995-96 and the accompanying economic uncertainty at that period of the cycle. We think this comparison holds as currently Dutch listed companies have always been highly exposed to cyclical sectors and the mix of companies has changed little due to the lack of newly listed companies in the Netherlands over the past few years.
Dutch SMCs historically trade at an average discount of c.20% to their large-cap peers. Excluding the 1998-2003 period, the discount has averaged around 15x, although this remains subjective. Traditionally, the discount disappears in times of economic prosperity and reduces to its average at mid-cycle dips and at the end of the cycle, reflecting uncertainty and peak earnings, respectively. The discount seems to increase beyond the average in times of recession to 35-40%; higher earnings downgrades and liquidity drive valuations down relative to large caps.
Source: ING estimates, Datastream Source: ING estimates, Datastream
Previous recession multiple of 7-8x not
representative
Dutch SMCs have recently de-rated from
15x to 12x, a level consistent with the
1995-96 mid-cycle dip
Dutch SMCs historically trade at a 20% average discount to large caps
Dutch SMCs historically trade at an average PER
of 11.6x (peak of c.16x and a low of c.9x)
29
Benelux small & mid caps January 2008
Historical perspective: Belgium
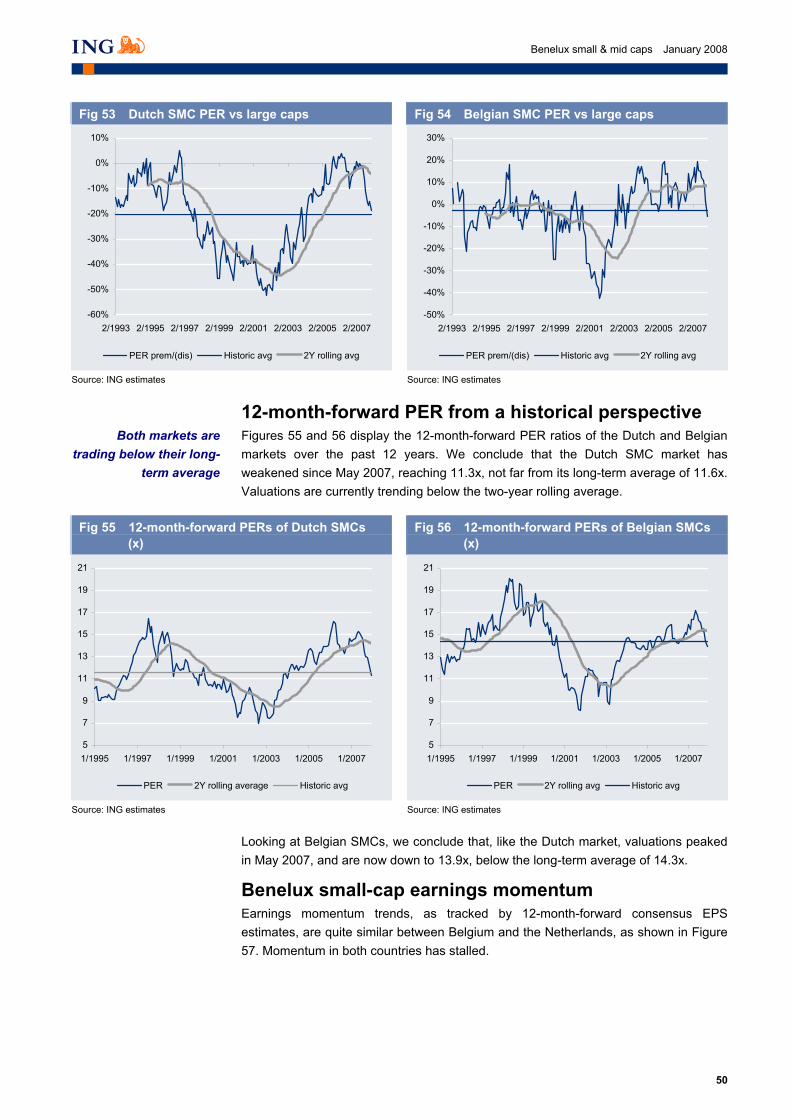
Currently listed Belgian small and mid caps (<€3bn) have historically (1993-2007) traded at a consensus 12-month-forward PER of 14.3x, with highs of 17-20x and lows of 11-12x.The only period – much like in The Netherlands – during which they traded below 11-12x (with troughs of 8-9x) was the 2001-03 recession.
Much like the valuation of Dutch SMCs, we do not view this period as representative of the valuation of Belgian SMCs in a recession scenario. Belgian equities have also been subject to domestic asset managers switching out of Belgian equities into European and worldwide equities. Although this process started earlier in the Netherlands, it seems to have had an equally negative effect in Belgium, topped off by the 2001-03 recession period. This renders valuations of the 1998-2003 period not very useful for a historical comparison.
Belgian SMCs have recently de-rated 17.5% from c.17x in 2Q07 to 14x. Although we view this de-rating as consistent with their Dutch SMC peers, an absolute valuation comparison with the previous mid-cycle dip of 1995-96 is more difficult due to the fact that many companies have seen a strong transformation and many new companies have entered the market since then, particularly in biotechnology and other growth-oriented sectors.
Belgian SMCs have historically traded at a very small average discount of 2-3% to their large-cap peers. Excluding the 2001-03 period, SMCs have probably traded at a small premium, although this correction remains subjective.
Like Dutch SMCs, the discount usually disappears and even shifts into a significant 20% premium in times of economic strength. It falls back to its average at mid-cycle dips and at the end of the cycle, reflecting uncertainty and peak earnings, respectively. The discount seems to increase above the average in times of recession to c.20%. Higher earnings downgrades and liquidity drive valuations down relative to large caps.
Fig 22 12m forward PERs – Belgium
Fig 23 SMC premium/(discount) – Belgium
5
7
9
11
13
15
17
19
21
23
25
1/1993 1/1995 1/1997 1/1999 1/2001 1/2003 1/2005 1/2007PER small cap PER large capAverage SC Average LC
Source: ING estimates, Datastream Source: ING estimates, Datastream
_
Benelux SMC valuations in a recession scenario Our bottom-up valuation analysis for Benelux SMCs finds an applicable PER of 10.5x, which implies a 16% de-rating from the current 12-month-forward PER (2008F). In the 2001-03 recession, we found that Benelux SMC stocks traded as low as 7.5x, meaning that on aggregate we have applied a 41% premium over the previous recession valuation. However, if we compare our bottom-up applicable PER of 10.5x with an
Belgian SMCs historically trade at
14.3x PER (peak of 17-20x and low 11-12x
Like in NL, previous recession valuations
not very useful
Belgian SMCs have recently de-rated from
17x to 14x
Belgian SMCs historically trade at a
small average discount to large caps
30
Benelux small & mid caps January 2008
(albeit arbitrary) adjusted PER of 9.5x, the implied premium to the previous recession scenario is only 10.5%. We think this is justified for reasons explained below.
Fig 24 Benelux valuations applicable in a recession scenario
Median (x)
Applied recession 12m
forward PER
Current 12m forward PER
(2008F)Change
(%)PER previous
recessionChange
(%)
Adjusted PER previous
recession Change
(%)
Dutch small and mid caps 9.5 10.9 -12 6.3 51 8.5 12Belgian small and mid caps 12.5 14.1 -12 9.1 37 11.5 9
Benelux small and mid caps 10.5 12.5 -16 7.5 41 9.5 11
Source: ING estimates
_
Methodology: additional assumptions to reach appropriate PER
To assess the valuation of Benelux small and mid caps in times of recession, we use historical 12-month-forward PERs when the share prices of individual companies were at their cycle lows in the 2000-04 period. We make adjustments for:
• The extremely low valuations seen in the 2001-03 previous recession period as we view these as an overreaction to a long de-rating process (see previous paragraphs) in combination with the recession itself.
• The current improved financial positions of many Benelux companies, which should lead to a higher valuation than previously.
• Changes in the structural position of the relevant company, or the sector in which it is active, particularly if these changes are seen as sustainable over a two- to three-year recession period.
• When PER-based valuations do not apply, we use appropriate other valuation methods, such as price to book, asset-based valuations, EV/sales and EV/EBIT.
Fig 25 Benelux high PER applied in recession scenario vs current PER
We have re-rated staffing companies to a significantly higher PER level than they currently trade at (which suggests that the market expects severe downgrades). We have also applied a relatively high recession multiple to other cyclical companies. This is also true for most Belgian cyclical companies as well as for some defensive stocks, such as Wolters Kluwer, OPG, Kinepolis and Omega Pharma.
For companies where we have applied a relatively low PER, this is due to low current earnings, a high current PER relative to history that we do not find to be structurally justified, and the lack of a market-based valuation history.
31
Benelux small & mid caps January 2008
Fig 26 Benelux low PER applied in recession scenario vs current PER
Risk/reward analysis We have carried out two risk/reward analyses on the basis of the outcome of our recession scenario downside to individual share prices.
A. Risk/reward analysis in the basis of a 50% chance of recession
We have run a risk/reward analysis on the basis of a 50% chance of a recession and a 50% chance of our mid-cycle dip scenario. We multiply these probabilities by the downside risk reached in a recession scenario and the current upside to our target price as a proxy for the upside in a mid-cycle dip scenario. Ranking the results shows the stocks with the highest return in this scenario.
Fig 27 Stocks with highest risk/reward at 50% chance of recession and 50% of mid-cycle dip
B. Risk/reward on the basis of a 50% chance of recession, coupled with the recent share price decline
We have also run a risk/reward analysis on the basis of a 50% chance of a recession and a 50% chance of a mid-cycle dip scenario. We multiply these probabilities by the downside risk that we find in a recession scenario and the current upside to our target price as a proxy of the upside in a mid-cycle dip scenario. We then subtract from the result the recent fall in the share price of the stock.
Ranking the result shows the stocks that show the highest potential upside in case of a mid-cycle dip scenario and an accompanying rally in the market, coupled with the best risk/rewards. In other words, a stock with a high risk/reward score and a high recent decline in share price should have a high ranking.
32
Benelux small & mid caps January 2008
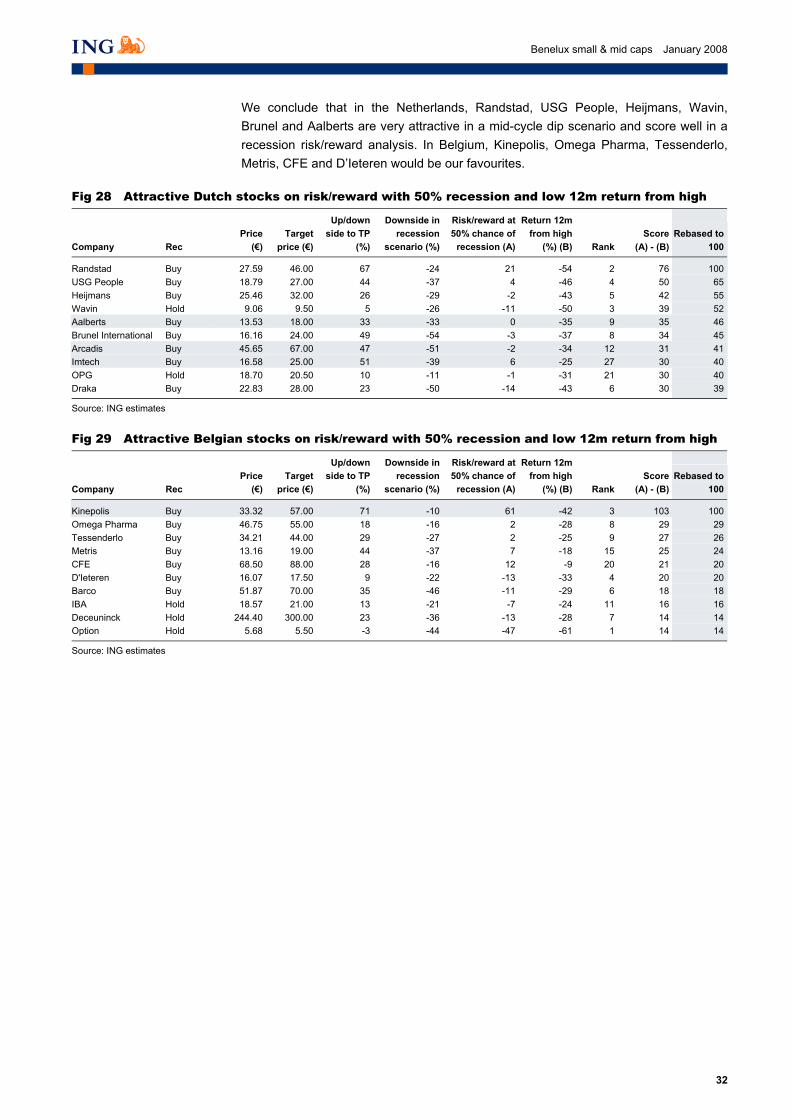
We conclude that in the Netherlands, Randstad, USG People, Heijmans, Wavin, Brunel and Aalberts are very attractive in a mid-cycle dip scenario and score well in a recession risk/reward analysis. In Belgium, Kinepolis, Omega Pharma, Tessenderlo, Metris, CFE and D’Ieteren would be our favourites.
Fig 28 Attractive Dutch stocks on risk/reward with 50% recession and low 12m return from high
At the end of December, the Dutch Senate approved a proposal to allow for more dividend-tax-exempt share buybacks, effective as of 2008. The changes made to the Dividend Tax Act 1965 imply a more than doubling in the potential value of tax-free share buybacks. This is important for shareholders in Dutch listed companies as they could potentially receive a higher tax-free capital return through share buybacks. This could create a positive reaction, particularly in the stocks of Dutch companies that were previously limited in their amount of tax-exempt share buybacks. Furthermore, companies considering share buybacks in the future now have more room to undertake them. An overview by company is included at the end of this section.
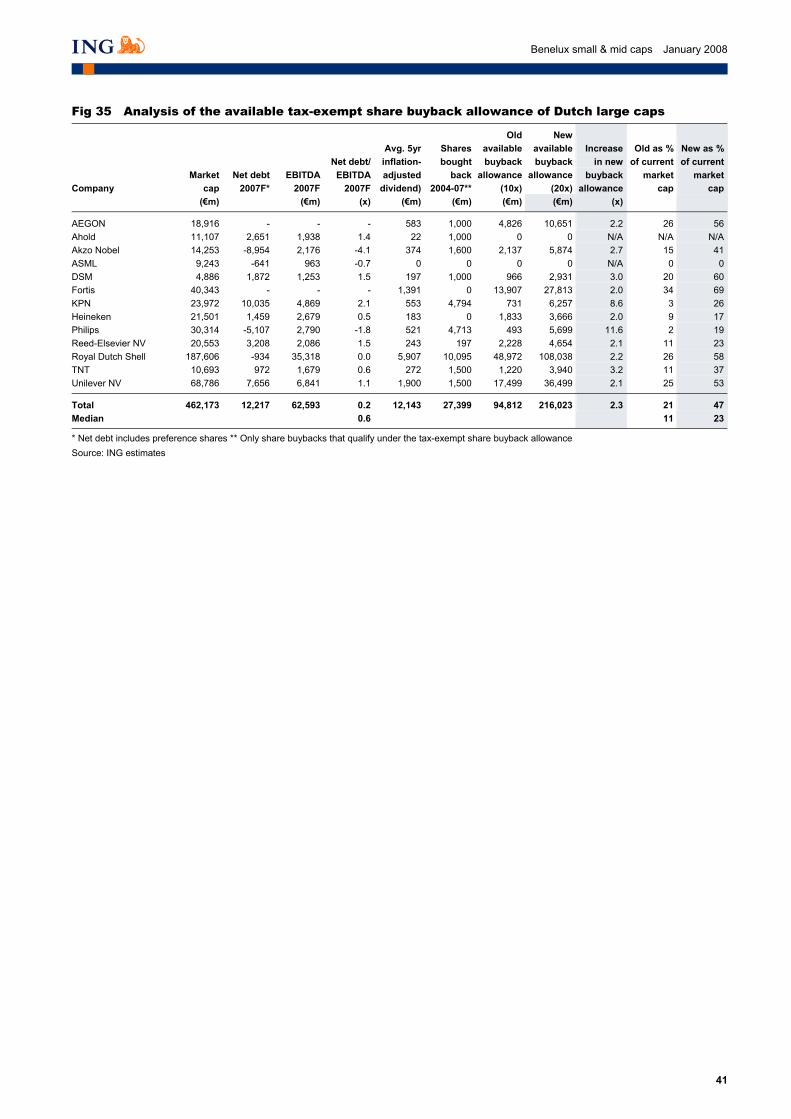
Limited impact on small and mid caps: CSM and Wolters Kluwer benefit most. We find that among the small and mid caps, the tax-exempt share buyback allowance doubles, but that the impact is only limited as most of the companies in our universe are currently not engaged in or planning on returning capital through share buybacks. Only seven of the 45 companies (16%) have made buybacks in the last four years, and these companies are the ones that see their allowances for tax-exempt share buybacks increase the most. The new regime is particularly favourable for CSM and Wolters Kluwer.
Significant impact on Dutch large caps, particularly Philips, KPN, DSM and TNT. Dutch large caps benefit much more significantly from the change in regulation as 75% of the (16) large-cap companies have been engaged in share buybacks over the last four years. We find that the change in regulation is highly favourable for Philips and KPN as they were very limited in their tax-exempt allowance under the previous regulation. DSM and TNT also benefit more than most.
Background to the Law: Article 4c (*1) of the Dividend Tax Act 1965 discusses tax-free share buybacks within the limits of the Dividend Tax Act. This article was set up to protect the income that the Dutch government receives in taxes on cash dividends as Dutch companies could potentially avoid paying dividend taxes by buying back shares. However, the law makes a specific exemption to allow for tax-exempt share buybacks and gives Dutch listed companies the opportunity to return capital to shareholders in a tax-efficient way. The law determines the maximum share buyback allowance based on a number of specifications.
Calculation of the allowance for tax-exempt share buybacks
The allowance for tax-exempt share buybacks is based on the average of cash dividends paid to ordinary shareholders (inflation-adjusted) over the last seven years, excluding the highest and lowest payments. Previously, the historical average dividend had to be multiplied by 10 to calculate the value of the allowance for tax-exempt share buybacks. The allowance is lowered by the amount of share buybacks over the past four years. However, the multiplier has been changed to 20 in the new regulation valid from 1 January 2008, meaning that a significantly higher amount can be returned to shareholders tax-free annually.
Changes in Dutch dividend tax allow for an
increase in share buybacks from 2008 for Dutch listed companies
Allowance increases from 10x the historical
average dividend to 20x
Impact limited for small and mid caps due to limited engagement (only 16%) in share
buybacks
Significant impact for large caps as 75% have been engaged in share
buybacks
36
Benelux small & mid caps January 2008
Some additional requirements apply, of which we list the most important below:
• The cash dividend paid is based on the cash dividend paid in the calendar year. This means, for example, that the cash dividend paid over 2007 is based on the final cash dividend on the 2006 results (for most companies paid in May/June 2007) and a potential interim cash dividend over 2007 (for most companies paid in September/October 2007).
• The cash dividends paid apply only to dividends to ordinary shareholders. This means that preference dividends paid are excluded in the calculation of the allowance.
• Only cash dividends are to be used in the calculation of the allowance. This excludes the take-up in shares when investors have had the choice between cash or shares.
• The cash dividend paid in the current (calendar) year needs to be at least equal to the average of the past seven (calendar) years (excluding the high and the low). This prevents companies replacing the cash dividend with share buybacks.
• The cash dividend paid in the past is allowed to be inflation-adjusted. This actually elevates the tax-exempt allowance.
• The Act only applies to listed companies, meaning the shares need to be listed on a regulated exchange.
• No new additional shares may have been issued in the past four years, unless the share issue was based on business-related arguments.
• Share buybacks made over the past four years without the intention of a capital return are excluded from the calculation. This applies, for example, to shares bought to cover share and share option plans.
Fig 32 Example of calculation of available tax-exempt allowance for company ABC (€m)
Year Total cash dividend Annual inflation factor Compounded inflation factor Cash dividend after inflation adj
a Seven-year total 2001-07 859b Lowest cash dividend 115c Highest cash dividend 132d Total inflation-adjusted dividend - high dividend - low dividend (a - b - c) 611e 5-year average inflation-adjusted cash dividend paid (d / 5) 122 g Maximum share buyback allowance new regulation (e * 20) 2,446h Amount of shares bought within the tax-exempt allowance 900i Available allowance for 2008F under new regulation (g - h) 1,546
j Maximum share buyback allowance – old regulation (e * 10) 1,223 k Available allowance for 2008F under old regulation (j - h) 323l Increase in available allowance due to new regulation (i - k) 1,223
Source: ING
_
37
Benelux small & mid caps January 2008
Share buybacks through the share premium reserve
Dutch companies can also return capital tax-free through the share premium reserve (the so-called agio reserve). This was allowed previously as it was seen as returning previously called-up capital, which is tax-exempt. This instrument has been used by Ahold, ASML and Philips in the past and will continue to be allowed under the new regulation. We have not taken this instrument into account in our company-specific calculations. However, it is clear that this instrument is capped to the amount of the share premium reserve.
Tax-exempt share buyback allowance for Dutch companies On the basis of the new regulation, we have estimated the tax-exempt share buyback allowance and available allowance for the Dutch companies in our small- and mid-cap universe. For information purposes, we have also included the data for the Dutch large caps covered by ING. An overview of this analysis by company is displayed at the end of this section.
Conclusions: limited impact on Dutch small and mid caps • The impact will be limited among Dutch small and mid caps if they do not intend to
buy back (more) shares. In the critical 2004-07 period, only 16% of the companies covered made share buybacks. Therefore, most companies see a doubling of their available tax-free share buyback allowance. The increase, however, is only valuable if they intend to use the share buyback instrument to return capital to shareholders. The available tax-exempt allowance among Dutch small and mid caps probably has less of an influence on a company’s decision to return cash to shareholders than factors such as its strategy, acquisition opportunities, financial target structure, absolute earnings level, position in the earnings cycle and share price level.
• Many Dutch small- and mid-cap companies under our coverage have not yet used the share buyback instrument to return capital to shareholders. In the 2004-07 period, critical in calculating the available allowance, we saw share buybacks at only seven of the 45 companies covered (16%) for an amount of €1,210m.
• Companies that have a history of share buybacks see the highest increase in their available tax-exempt share buyback allowance. Most companies see their available allowance double. The seven companies with a share buyback history see their allowance more than double.
• The maximum amount of available tax-exempt share buyback allowance increases 118% from €6.6bn to €14.5bn and from 11% of the market cap to 24%.
Small and mid caps: CSM and Wolters Kluwer benefit most • CSM (1820%) and Wolters Kluwer (400%) see the most significant increase in
their available tax-exempt share buyback allowance. Most other companies see their available allowance increase by 100%.
• Wolters Kluwer (€650m) and CSM (€340m) accounted for the lion’s share of share buybacks in the critical 2004-07 period. The other companies were Beter Bed
Share buybacks through share premium reserve
can still be used to return capital to
shareholders
During 2004-07, only 16% of SMCs returned capital through share
buybacks
Companies that have engaged in share buybacks see the
highest increase in allowance
38
Benelux small & mid caps January 2008
(€10m), Hunter Douglas (€50m), Nutreco (€50m), Telegraaf Media Group (€60m) and Wessanen (€50m).
• Wessanen (119%), Van der Moolen (104%), Océ (101%), Heijmans (95%), Gamma (72%) and Nutreco (70%) could theoretically buy back the highest amount as a percentage of their current market cap based on their available tax-exempt share buyback allowance.
• AMG, BESI, Kendrion, Super de Boer, Samas and TomTom have no available tax-exempt share buyback allowance, due to their lack of a cash dividend payment history.
Companies that could make share buybacks in a recession
We have analysed which companies would be financially well positioned in a recession (see previous section on recession analysis) to buy back shares, assuming that M&A activity would be modest in such a scenario. We have selected companies that would remain profitable, maintain a healthy financial position with net debt/EBITDA ratios below 1.0x (cyclicals) or 2.0x (defensives) and have an available tax-exempt share buyback allowance. In such a case, buying back shares could be very attractive and should support the share price. We find that the following 20 companies fit the profile.
Fig 33 Dutch companies that could make share buybacks in a recession
Company Rating Market cap(€m)
Recession net debt/EBITDA
(x)
Available buybackallowance (20x) (€m)
As % of current market cap
Arcadis Buy 930 0.4 220 24Ballast Nedam Hold 279 -1.1 141 51Beter Bed Buy 387 -0.3 136 35Boskalis Buy 3,563 -0.5 488 14Brunel International Buy 367 -1.9 63 17CSM Buy 1,557 2.0 380 24Eriks Hold 477 0.5 72 15Exact Holding Hold 592 -1.8 273 46Fugro Buy 3,782 1.2 318 8Grontmij Hold 436 -1.0 144 33Hunter Douglas Hold 3,117 1.0 1,179 38Imtech Buy 1,307 0.2 624 48Nutreco Buy 1,359 0.6 951 70Océ Hold 1,034 0.9 1,042 101OPG Hold 1,092 0.8 454 42Ordina Hold 506 0.4 103 20Sligro Hold 1,188 1.4 134 11Telegraaf Media Group Hold 1,222 -0.7 243 20Unit 4 Agresso Buy 510 -1.5 79 15Wessanen Buy 746 1.8 886 119
Source: ING estimates
_
We identify 20 companies that are well positioned to buy back
shares in a recession
39
Benelux small & mid caps January 2008
Conclusions: significant impact on Dutch large caps • The impact of the new tax-exempt regulation is much more significant for Dutch
large-cap companies than small- and mid-cap companies. This is because Dutch large caps are and have been more engaged in returning capital to shareholders through share buybacks.
• Of the 16 large-cap companies not covered in this book (13 of which are covered by ING’s sector analysts), we have found that 12 have bought back shares in 2004-07. Companies under our coverage bought back more than €27bn in shares in this period.
• Because of the high historical level of share buybacks, most large caps see their available tax-exempt share buyback allowance more than double. Large-cap companies therefore benefit more than small and mid caps from the change in the law.
• The maximum amount of available tax-exempt share buyback allowance among Dutch large caps increases 130% from €94.8bn to €216.0bn.
• The maximum amount of available tax-exempt share buyback allowance among Dutch large caps rises from 21% of the current market cap to 47%.
Large caps: Philips, KPN, DSM and TNT benefit most • Philips (1060%), KPN (760%), TNT (220%) and DSM (200%) see the most
significant increase in their available tax-exempt share buyback allowance. Most other companies see their available allowance increase by 100%. The increase is most significant for Philips and KPN as their potential for tax-exempt share buybacks was very limited under the old regulation.
• Royal Dutch Shell (€10.1bn), KPN (€4.8bn) and Philips (€4.7bn) accounted for the lion’s share of share buybacks in the critical 2004-2007 period.
• Fortis (69%), DSM (60%), Royal Dutch Shell (58%), AEGON (56%) and Unilever (53%) could theoretically buy back the highest amount as a percentage of their current market cap based on their available tax-exempt share buyback allowance.
• ASML and Ahold have no available tax-exempt share buyback allowance, due to their lack of a cash dividend payment history in combination with already completed share buyback programmes.
Significant impact for large caps as they are
and have been more engaged in share
buybacks
40
Benelux small & mid caps January 2008
Fig 34 Analysis of the available tax-exempt share buyback allowance of Dutch small and mid caps
* Scenario Randstad and TomTom on stand-alone basis, ie, excluding takeover of Vedior (Randstad) and Tele Atlas (TomTom) ** Net debt and EBITDA in US$m *** Net debt includes preference shares **** Only share buybacks that qualify under the tax-exempt share buyback allowance Source: ING estimates
_
41
Benelux small & mid caps January 2008
Fig 35 Analysis of the available tax-exempt share buyback allowance of Dutch large caps
* Net debt includes preference shares ** Only share buybacks that qualify under the tax-exempt share buyback allowance Source: ING estimates
_
42
Benelux small & mid caps January 2008
Benelux SMC valuation
Like other European small and mid caps (SMCs), Benelux SMCs have been de-rated since mid-2007, albeit to a lesser extent. Our base-case scenario is one of slowing growth but no recession and, as such, we expect Benelux SMCs to achieve double-digit earnings growth. This expected growth exceeds consensus forecasts for European SMCs. The sell-off has led to much more attractive valuations: Benelux SMCs now trade below their long term average PE and at a discount to domestic large caps. In addition, Dutch SMCs trade at a discount to European peers, albeit still above the long-term average, while Belgian SMCs are now at a premium. Our preference in terms of investment opportunity goes again to Dutch SMCs given their more attractive valuation and superior growth expectations, while the Belgian SMC market is more defensive, which may explain the premium valuation.
We prefer Dutch SMCs to their Belgian peers for three key reasons:
• Dutch SMCs trade at a 19% discount to large caps, whereas Belgian SMCs trade at a 5% discount, compared with European SMCs’ 12% discount to their large-cap peers.
• Focusing on the 12-month-forward PER ratio, the valuation of Dutch SMCs is at a 19% discount to Belgian and a 13% discount to European SMCs.
• We expect Dutch SMCs to deliver better earnings growth than domestic large caps and European and Belgian SMCs.
The only caveat we have identified and which would play in favour of the Belgian market is the superior (and even high) weighting of defensive stocks within our Belgian SMC universe. Indeed, we conclude that defensive stocks account for 26% of our Belgian SMC universe (with an additional 7% weighting for real estate stocks), compared with 9% for the Netherlands. Conversely, cyclical stocks, which are, by definition, more sensitive to economic growth, account for no less than 73% of our Dutch universe compared with 39% for Belgium. Hence, a recession would hit Dutch SMCs harder, which could to a certain extent explain the valuation discounts seen over the long term in the Netherlands.
Real estate Benelux 3,548.7 3.2Netherlands Belgium 3,548.7 3.2 7.4Source: ING
_
Small caps peaked in June 2007 Following four years of strong absolute performance, European SMCs ended 2007 down slightly. The yearly numbers, however, mask a sharp reversal in the trend in the second half of the year. The first half was relatively strong, although the first signs of relative weakness appeared in February with the impact of a short-lived sell-off in China. The markets promptly brushed the fears away and the stock markets rallied, reaching their highs in June and July.
By the end of July, the sub-prime debacle hit the markets, kicking small and mid caps down from their highs. The latter are down between 10% and 15% as investors have cut their exposure to SMCs, which are less liquid and more volatile than large caps and are hence more vulnerable to sell-offs.
Large caps suffered as well, but their performance was less dramatic, as shown in the table below (Euro Stoxx down 7% and AEX down 8% since their highs in July and May 2007, respectively), except in the case of the BEL20, which is heavily weighted towards financials, the sector most (directly) affected by the sub-prime crisis.
The end of a SMC bull market?
The downturn was felt from July
44
Benelux small & mid caps January 2008
Fig 38 Performance summary
Performance 2007 high Perf from 2006 2007 1H07 2H07 date high
Dutch and Belgian small and mid caps were not immune to the sell-off and actually underperformed their European peers over 2H07.
Fig 39 Small/mid-cap indices (since Jan 2007)
Fig 40 Small/mid-cap indices (since 1 Jun 2007)
90
95
100
105
110
115
1/07 3/07 5/07 7/07 9/07 11/07 1/08
Netherlands (AMX) Belgium (BELM) DJES mid caps
80
85
90
95
100
105
6/07 7/07 8/07 9/07 10/07 11/07 12/07 1/08
Netherlands (AMX) Belgium (BELM) DJES mid caps
Source: Bloomberg Source: Bloomberg
_
We attribute the relative weakness of Benelux SMCs to the following factors:
• The region had shown a strong outperformance ahead of the sell-off, which led to a sharper correction.
• A number of Belgian small and mid caps (Agfa, Option, Omega Pharma, etc) disappointed the markets with profit warnings or disappointing statements during 2H07, sending the stocks down in an already unfavourable context.
• The two markets, the Netherlands in particular, are quite heavily weighted towards cyclical stocks. Cyclicals represent an estimated 58% of the region’s market cap weighting (73% in the case of the Netherlands). Cyclicals were hit hardest by the sell-off given their exposure and sensitivity to the economy and fears of slowing economic growth.
Valuation of European small caps We value European SMCs using 12-month-forward (median) PER ratios sourced from Datastream (I/B/E/S). More specifically, we apply the unweighted average of small- and mid-cap valuations in Europe, consisting of companies with market caps below €3bn in the UK, Germany, France, Italy, Spain, Belgium and the Netherlands.
Europe (actual) Europe (2-years rolling average) Historic avg
Source: Datastream, ING estimates
_
As we highlighted in our May 2007 report, European small and mid caps peaked that month at a 12-month-forward PER of slightly above 17x. Since then, the sell-off, which sent the DJ Euro Stoxx mid-cap index down 11%, has caused a 24% PER de-rating of the wider European small- and mid-cap market. This compares with a 10% de-rating for European large caps and a DJ Euro Stoxx index down 7% since May.
Fig 42 European SMCs 12-month-forward EPS estimates
0.6
0.7
0.8
0.9
1.0
1.1
1.2
1/00 1/01 1/02 1/03 1/04 1/05 1/06 1/07
Source: Datastream
_
The sharp PER de-rating in European small and mid caps since May 2007 can be broken down into, on the one hand, the weak performance of the index and, on the other, consensus 12-month-forward EPS having risen no less than 18% over the same period. The upwards revision of EPS is highlighted in Figure 42. The downward revision that we spotted beginning in early May 2007 was short-lived.
Severe 24% de-rating of SMCs since May 2007…
… with earnings estimates up 18% over
the same period
46
Benelux small & mid caps January 2008
Fig 43 2008 consensus GDP forecasts (%)
Fig 44 2008 consensus GDP forecasts (%)
2.1 2.1 2.22.2
2.3 2.3 2.3
2.2
2.0 2.01.9
3.0 3.02.9
2.82.9 2.8
2.6
2.42.4
2.3
2.1
1.7
1.9
2.1
2.3
2.5
2.7
2.9
3.1
Jan07
Feb07
Mar07
Apr07
May07
Jun07
Jul07
Aug07
Sep07
Oct07
Nov07
Dec07
Europe USA
2.5 2.5 2.52.6 2.5 2.6
2.5 2.4
2.32.2
2.32.2 2.2 2.2 2.1 2.1
2.2 2.3 2.3
2.02.3
2.1
1.7
1.9
2.1
2.3
2.5
2.7
2.9
3.1
Jan07
Feb07
Mar07
Apr07
May07
Jun07
Jul07
Aug07
Sep07
Oct07
Nov07
Dec07
Netherlands Belgium
Source: Bloomberg Source: Bloomberg
_
This is an intriguing feature of the current market. As the economic outlook becomes cloudier, as reflected in falling consensus GDP growth in Figures 43 and 44, analysts have been revising up their earnings estimates, while investors have been shunning SMCs, sending share prices down in anticipation of a slowdown in earnings growth.
Abrupt end to European SMC premium
Fig 45 Europe 12-month-forward PER multiples
Fig 46 SMC premium/(discount) to large caps
8
10
12
14
16
18
20
1/00 1/01 1/02 1/03 1/04 1/05 1/06 1/07 1/08
Large Caps Small Caps
-30%
-20%
-10%
0%
10%
20%
1/00 1/01 1/02 1/03 1/04 1/05 1/06 1/07 1/08
Source: Datastream, ING estimates Source: Datastream, ING estimates
_
Another yardstick for assessing valuation is an analysis of the PER gap between large caps and SMCs.
Although European SMCs have almost consistently traded at a discount to large caps (9% on average since 1993), the trend was broken from October 2003 until September 2007, with an average premium of 5%.
Figure 47 highlights the valuation gap between European SMCs and large caps and shows the abrupt change in trend that has occurred since July 2007 (from a premium of 8% in July 2007 to a discount of 1% in September, falling to 12% currently).
The secret of the SMCs’ success in terms of premium valuation over the last couple of years was attributed to their superior and less cyclical earnings growth compared with large caps, certainly since 2005, as depicted in Figure 47.
A discount is the norm, despite the recent four-
year premium
SMCs now trade at a 12% discount to large
caps
47
Benelux small & mid caps January 2008
Average prospective EPS growth (2007F-09F) for SMCs (as per the DJ Euro Stoxx Small cap index) is expected to be 12%, up from 11% expected in May 2007, compared with 11% for large caps (as per the DJ Euro Stoxx 50 index), up from 9% expected in May 2007.
So, despite superior expected earnings growth for European SMCs than large caps and despite stronger earnings growth expected for both asset classes since May 2007, the markets have de-rated European SMC more aggressively. In an attempt to explain this discrepancy, we believe the following:
• Consensus crisis. In light of fears of a recession, investors provide little credence to consensus earnings estimates, which still foresee double-digit growth in earnings over the next two years with a very limited slowdown into 2009F. At ING, we expect 15% median EPS growth in 2008F for our Benelux SMC universe (vs a consensus forecast of 13% growth for European small caps and 11% for large caps), slowing to 11% in 2009F (vs a consensus forecast of 11% growth for European small caps and 11.5% for large caps).
• Small cap risks. Ahead of (what is expected to be) a bear market, investors tend to cut their exposure to: (1) stocks that are highly sensitive to economic growth (ie, cyclicals); and (2) stocks with limited liquidity for fear of being stuck with the investment in the midst of panic selling. European SMCs combine both these criteria and therefore would suffer the most in a bear market.
Valuation of Benelux small caps Analysing the valuation of Benelux small and mid caps, we focus on:
• Valuations compared with other Europe SMC markets.
• SMCs’ valuation gap versus large caps.
• Forward PER ratios from a historical perspective.
• Earnings momentum.
SMCs are still expected to beat large caps in
terms of growth
Why were SMCs de-rated?
48
Benelux small & mid caps January 2008
Valuation compared with other European SMC markets
Fig 48 12-month-forward PER (x)
11.3 11.7 12.3 12.8 13.0 13.7 13.915.4
13.9 14.1 14.3 14.3 14.7 14.2 14.7
17.7
0
2
4
6
8
10
12
14
16
18
20
Neth UK Germany France EU Italy Belgium Spain
Small caps Large caps
Source: ING estimates
__
Based on 12-month-forward PER, the Dutch market continues to be the cheapest in Europe. Applying consensus estimates, Dutch SMCs are currently trading at a 12-month-forward PER of 11.3x (from 15.2x in April 2007), or a 13% discount to the European average of 13x (from 17.1x in April 2007), while Belgian SMCs are valued at 13.9x (from 16.3x), implying a 7% premium. Benelux SMCs felt the weakest de-rating, as highlighted in Figure 49.
Fig 49 European SMC PER de-rating since April 2007
-2.4
-3.9
-4.0
-4.1
-4.3
-4.4
-4.5
-5.5
-6.0 -5.0 -4.0 -3.0 -2.0 -1.0 0.0
Belgium
Netherlands
France
EUROPE
Germany
UK
Spain
Italy
Source: Factset
Comparing the valuations of Benelux SMCs with their European peers, based on Figures 50 and 51, we conclude the following:
• The Netherlands. Dutch SMCs are trading at a 13% discount to European SMCs, compared with a long-term average discount of 18.7% (average discount of 20% since 2000), but down from a recent peak of a 6% discount reached in April 2006.
• Belgium. Belgian SMCs are trading at a 7% premium to European SMCs compared with a long-term average premium of 0.7% (average discount of 7% since 2000). Interestingly, the Belgian premium has been rising since October 2006. This is explained by a sharp downward revision in EPS (triggered by a
Despite the de-rating, the Dutch SMCs remain
the cheapest
49
Benelux small & mid caps January 2008
number of profit warnings among Belgian SMC in 2H07), offsetting the impact of lower prices.
As explained earlier, European SMCs are trading at a discount of close to 12% to their large-cap peers. This is a steeper discount than the long-term average of 9%.
Unlike for most of 2007, all European SMC markets are currently trading at a discount to large caps and the Benelux markets are no exception. Dutch SMCs are trading at a sizeable 18.7% discount to Dutch large caps (compared with a long-term average of 20%), while Belgian SMCs are trading at one of the lowest discounts to domestic large caps in Europe: a 5.4% discount (compared with a long-term average of 3%).
12-month-forward PER from a historical perspective Figures 55 and 56 display the 12-month-forward PER ratios of the Dutch and Belgian markets over the past 12 years. We conclude that the Dutch SMC market has weakened since May 2007, reaching 11.3x, not far from its long-term average of 11.6x. Valuations are currently trending below the two-year rolling average.
Fig 55 12-month-forward PERs of Dutch SMCs (x)
Fig 56 12-month-forward PERs of Belgian SMCs (x)
5
7
9
11
13
15
17
19
21
1/1995 1/1997 1/1999 1/2001 1/2003 1/2005 1/2007
PER 2Y rolling average Historic avg
5
7
9
11
13
15
17
19
21
1/1995 1/1997 1/1999 1/2001 1/2003 1/2005 1/2007
PER 2Y rolling avg Historic avg
Source: ING estimates Source: ING estimates
_
Looking at Belgian SMCs, we conclude that, like the Dutch market, valuations peaked in May 2007, and are now down to 13.9x, below the long-term average of 14.3x.
Benelux small-cap earnings momentum Earnings momentum trends, as tracked by 12-month-forward consensus EPS estimates, are quite similar between Belgium and the Netherlands, as shown in Figure 57. Momentum in both countries has stalled.
Earnings growth As explained earlier, European SMCs are expected to deliver better earnings growth than their large-cap peers, which explains the premium valuation that SMCs have been trading at compared with large-cap peers. Interestingly, the growth gap is still in favour of SMCs, but the market is no longer willing to pay a premium for this.
Although we do expect slowing growth, Dutch SMCs are expected to grow faster than their Belgian and even European peers. Belgian SMCs, on the other hand, are expected to deliver softer growth than European SMCs, while still beating their domestic large-cap peers in 2008F. In 2009F, the growth outperformance relative to large caps and to European SMCs should come to an end.
Both Dutch and Belgian large caps are expected to show slower earnings growth than European large caps.
Superior growth expectations for SMCs
Dutch SMC should deliver stronger growth
52
Benelux small & mid caps January 2008
Eurozone: into a lower gear
After a very strong 2006, the Eurozone looks to have put in a second consecutive year of above-potential growth. We pencil in 2.5% GDP growth for 2007 after the 2.9% expansion in 2006. However, the outlook for 2008 has become more uncertain, with US growth falling back below 2.0%.
Decoupling
We remain sceptical about the growth-decoupling story; that is, the possibility of European growth parting ways with the US. In the past, the EU13 has always followed the US growth direction with an average lag of three quarters. One could argue that the US has been hit by an asymmetrical shock, ie, the real-estate meltdown, which could leave the European economy unscathed. However, credit conditions have tightened in both regions in response to the subprime crisis.
House prices and confidence
Moreover, house prices in several European countries are at unsustainable levels. The possibility of a painful correction here is no longer a farfetched story, although wealth effects have historically been less pronounced in Europe.
That said, underlying fundamentals in the EU13 are not bad at all. Business and consumer confidence has softened since the second quarter, but still hovers above historical averages. The capacity utilisation rate in the industrial sector remains at an elevated level, compatible with robust business investment growth.
Capital expenditure
However, some deceleration in capital expenditure is likely in 2008. After years of exceptionally benign financing conditions, the financial turbulence over the summer months is likely to lead to more difficult access to funding. Eurozone banks, which have also been hurt by the fallout from the US subprime crisis, have already announced a tightening of credit standards for the coming quarters. This, in combination with an overall less favourable assessment of future economic conditions, might restrain business investment in the coming quarters.
Fig 59 Expected tightening in EU13 credit
Fig 60 EU13 growth shifting into lower gear
-20
-10
0
10
20
30
40
50
Q1 03
Q3 03
Q1 04
Q3 04
Q1 05
Q3 05
Q1 06
Q3 06
Q1 07
Q3 07
housing consumers enterprises
-1.5
-1
-0.5
0
0.5
1
1.5
2
Q1 02
Q3 02
Q1 03
Q3 03
Q1 04
Q3 04
Q1 05
Q3 05
Q1 06
Q3 06
Q1 07
Q3 07
0
0.5
1
1.5
2
2.5
3
3.5
EU13 business climate index EU13 GDP growth yoy % (rhs)
Source: Datastream Source: Datastream
_
Decoupling from the US unlikely
Housing risks
Tighter lending conditions may restrain
investment
53
Benelux small & mid caps January 2008
Construction
There is ample evidence that residential construction has peaked, with building permits declining and mortgage lending weakening in the first half of 2007. This deceleration is bound to continue in 2008. The protracted period of low interest rates in the Eurozone led to a boom in real estate, which is now showing bubble-like features in several countries (Spain, Ireland). Residential construction as a share of GDP is significantly above its long-term average in all EU13 countries, bar Germany and Austria.
Some return to normality therefore seems warranted. With house prices having started to decline in Ireland, Spain (in several big cities) and France, and stagnating in most other countries, there is every reason to believe that residential construction will be a drag on growth in 2008.
Fig 61 Correlation of real house prices & consumption
Fig 62 Inflation worries have not disappeared
0
0.1
0.2
0.3
0.4
0.5
0.6
0.7
0.8
0.9
UKSpa
in
Canad
aUSA
France
Netherl
ands
Austria
Belgium
German
yIta
ly
0
5
10
15
20
25
30
Jan-0
2Ju
l-02
Jan-0
3Ju
l-03
Jan-0
4Ju
l-04
Jan-0
5Ju
l-05
Jan-0
6Ju
l-06
Jan-0
7Ju
l-07
0
0.5
1
1.5
2
2.5
3
Survey on price expectations in the next 12 monthsEU13 inflation rate (rhs)
Source: Calza et al. (2006) Source: Datastream
_
In this regard, one might also fear a negative effect on consumption expenditure, as stagnating or declining housing wealth could incite households to become more cautious in opening their wallets. However, this effect is rather limited for the Eurozone as a whole, although it could be important for some individual member states. As such, the correlation between consumption and house prices is very important in Spain and to a lesser extent in France, but almost non-existent in Italy and Germany.
Consumption
Most growth hopes for the Eurozone are still pinned on the revival of consumption expenditure. Household consumption in Europe has been disappointing since the start of the monetary union, especially when compared with the US. Over the last ten years, consumption explained 51% of economic growth in the euro area, but this figure has fallen to 40% for the last three years. Over the same ten-year period, consumption explained 86.5% of US GDP growth, and a healthy 82% over the last three years.
Especially since 2005, the relative weakness of consumption has been a conundrum, given strong job creation and historically high levels of consumer confidence. One possible explanation for this consumer caution may be the nature of the employment creation. Between 2003 and 2006, the proportion of temporary jobs within total employment increased by about two percentage points. These jobs tend to be less secure than permanent jobs, which means that consumers may be less optimistic about their personal financial situation for any given level of income.
Housing-wealth effects vary significantly
across Europe
The Eurozone’s consumption conundrum…
… might be explained by the rise of temporary
employment
Residential construction appears to
have peaked
54
Benelux small & mid caps January 2008
This might be the explanation for the less buoyant consumption growth, despite the strong employment growth. Indeed, research from the ECB shows that the countries that have experienced the largest increase in temporary employment in recent years have also shown the biggest gap in confidence between the assessments of labour market developments and personal finances.
Fig 63 Accounting for EU13 FY08 real GDP growth (in % points)
07FY Euro strength
Stronger consumption
08FYWeaker global demand
Lagged impact higher rates
Credit crunch
07FY Euro strength
Stronger consumption
08FYWeaker global demand
Lagged impact higher rates
Credit crunch
2.5
0.4
2.9
1.8
0.25
0.25
0.35
0.25
07FY Euro strength
Stronger consumption
08FYWeaker global demand
Lagged impact higher rates
Credit crunch
07FY Euro strength
Stronger consumption
08FYWeaker global demand
Lagged impact higher rates
Credit crunch
2.5
0.4
2.9
1.8
0.25
0.25
0.35
0.25
Source: ING
_
Employment
The good news is that employment growth has become more balanced across contract types, with employment in permanent and full-time jobs having started to increase in the course of 2006, after years of decline. With the labour market becoming tighter, one can also expect a pick-up in employee compensation.
Fiscal policy
Moreover, with most EU13 governments having finalised their draft budgets for 2008, it seems that budgetary policy is likely to become more expansionist this year. The four largest countries within the Eurozone are expected to have a looser budgetary policy in 2008. One also has to take into account the fact that German consumer expenditure has been particularly weak in 2007 because of the VAT hike in January. With this impact gradually petering out, a return to normality is likely. Even then, there are downward risks. Apart from a correction on the housing market, tighter credit conditions for consumer credit could hurt consumption in 2008.
Euro strength and exports
The strong euro cannot remain without consequences for the European export sector. As such, the 1.40 level against the US dollar has been labelled as the pain threshold by Business Europe, the European employers’ federation. The recent appreciation is likely to shave off about 0.25 percentage points from growth in 2008. Even though we expect the euro to weaken somewhat in the course of next year, the growth contribution of net exports will be negative for most of the year.
GDP
Putting all this together, we expect EU13 GDP growth to come out at 1.8% in 2008, slightly below potential, with the second half of the year likely to be marginally stronger than the first.
Permanent employment is picking up…
…and fiscal policy is set to become more
expansive
Euro strength will be a drag on growth
We expect GDP growth of 1.8% for 2008
55
Benelux small & mid caps January 2008
The ECB in wait-and-see mode With the EU13 now in the mature phase of the expansion, tensions over interest rate policy have become apparent. The ECB faces a variety of concerns:
• High capacity utilisation in manufacturing.
• Unemployment has fallen to the lowest level since the early 1980s, putting upward pressure on labour costs.
• Some commodity prices (especially food and energy) have surged since the beginning of the year, further threatening price stability.
• HICP inflation passed the 2.0% threshold again in September 2007 and is expected to remain above that level for several months. Although from January onwards, some relief will be felt, because of the German VAT hike falling out of the year-on-year-comparison, it is far from certain that average inflation will drop below 2.0% this year.
• Inflation expectations have not moderated. On the contrary, according to the European Commission’s consumer survey, households expect inflation to rise over the next 12 months. Equally, in the ECB’s survey of professional forecasters, a significant proportion of respondents expect inflation still to be above 2% in five years’ time.
Interest rates
Normally, these observations would be sufficient for the ECB to tighten monetary policy, and it intended to do so in September. However, with the market turmoil pushing up money-market rates over the summer months, the ECB refrained from an interest rate hike and adopted a wait-and-see stance. This situation is likely to persist for most of 2008. Weakening growth and a strong euro will be sufficient to keep the ECB on hold. However, as growth rates normalise in the course of the year and the euro weakens, a rate hike remains possible in the fourth quarter.
Fig 64 GDP forecasts (year averages in % YoY, quarterly numbers in % QoQ, annualised)
Dutch economic outlook The crisis in the US subprime mortgage market looks likely to have a negative impact on the Dutch economy. Consumer confidence has dipped sharply and businesses are becoming concerned about their competitiveness. Meanwhile, interest rates in the money market are climbing and equity prices are under pressure. Against this
We expect the ECB to keep rates unchanged
through 2008
Inflation concerns persist for the ECB
56
Benelux small & mid caps January 2008
backdrop, the third quarter of 2007 might well turn out to have been the peak of the current economic cycle.
Fig 65 Assessment competitiveness
-10
-5
0
5
10
15
00 01 02 03 04 05 06 07
Index (%)
Dutch market Outside EU General producer confidence
+ = improvement, - = deterioration
Source: ING Forecasts
_
Private consumption slowing, downward risks Although employment prospects bode well for private consumption this year, limited gains in purchasing power due to higher taxes are expected to dampen overall growth of private consumption. It cannot be ruled out that private consumption will slow even more if stock markets continue to be upset by the possible consequences of the current crisis on credit markets. This is because (stock market) wealth has become an important driver behind household spending over the last couple of years.
Private investment to slow too, profits healthy The financial position of most companies in the Netherlands is generally sound. Against a backdrop of slowing demand and increasing wages and lending rates, profits may develop somewhat less favourably next year, albeit staying at historically high levels. This argues for lower private investment growth (in particular in cyclical sensitive areas such as machines, computers and equipment), particularly as banks seem to have tightened their lending standards.
Competitiveness being questioned Entrepreneurs are downscaling their assessment of their competitive position – a development that may be attributed to the ongoing appreciation of the euro and the expected slowdown of the global economy. As the fall-out of the credit crisis is likely to manifest itself in the non-financial sector in the course of 2008, in the form of slowing demand and higher borrowing costs, overall producer confidence can be expected to start deteriorating in 2008.
Yield curve outlook The three-month interest rate is expected to decrease from the current level of 4.87% to 4.3 % in 2Q08 as uncertainty over the possible consequences of the credit crisis is assumed to ebb away in due course. Thereafter the three-month rate is expected to increase to 4.4% by the end of 2008 on the back of expected ECB tightening in 2009. The 10-year Dutch benchmark government bond yield (current rate 4.1%) is expected to decrease to 4.0% in 1Q08 and increase thereafter to 4.4% by the end of the year. _
57
Benelux small & mid caps January 2008
Fig 66 Economic forecasts for Belgium and the Netherlands (in % YoY)
2006 2007F 2008F
Belgium GDP 2.9 2.6 1.8Private consumption 2.1 2.5 2.0Government consumption 0.0 1.6 2.2Gross fixed capital formation 4.2 4.6 2.3Net exports (%-contribution to growth) 0.2 0.1 -0.3
The Netherlands GDP 3.0 3.2 2.6Private consumption -0.8* 2.0 1.8Government consumption 9.4* 3.2 2.5Gross fixed capital formation 7.2 4.7 3.5Net exports (%-contribution to growth) -0.2 0.8 0.3
*The implementation of the new healthcare system has had a statistical effect on the composition of Dutch GDP figures. It has led to a statistical decline in private consumption of 3.6 percentage points as well as to a statistical rise in government consumption of 7.4 percentage points. Overall GDP growth has not been affected. Source: INR, Statistics Netherlands (CBS), ING
Growth in Belgium shifting to a lower gear Although annual GDP growth has been moderating in Belgium since the peak of 3% in the first quarter of 2007, it was still strong in the third quarter at 2.6%. Up to now, the economy has remained resilient to major global shocks, such as the appreciation of the euro, rising commodity prices and financial turmoil, mainly because domestic demand was supported by strong employment growth and rising profitability of firms. At the same time, the moderation of economic growth is expected to continue over the next few quarters, as domestic demand is likely to be hit by higher inflation and lower employment creation. This is also reflected in the downward trend in both the consumer and the business confidence indicators. For 2007, ING has kept its growth forecast broadly unchanged at 2.6%, while downgrading the growth forecast for 2008 to 1.8%. There are, however, downside risks to these growth outlooks, as the impact of the US economic slowdown and the financial turmoil could be larger than currently expected. In addition, exchange rate developments could weigh on growth.
Annual inflation in Belgium picked up sharply in the last quarter of 2007, to reach 2.8%, compared with only 1.3% in the third quarter. This sharp rise was mainly related to higher energy and processed-food prices. After a modest 1.8% inflation in 2007, our expected inflation rate for 2008 now stands at 2.4%, as a result of higher expected oil and food prices, as well as some specific shocks, such as the increase in the distribution tariffs for gas and electricity as of January 2008. At the same time, we believe wage increases should remain contained.
While negotiations to form a new federal government dragged along until late December, the previous government stayed on in a caretaker capacity, which implies that it could not take any additional measures to reduce the expected government deficit. We therefore expect the general government budget to show a slight deficit of 0.2% of GDP in 2007. A further widening of the deficit to 0.7% of GDP is expected in 2008, as the economic outlook should become less supportive. The debt ratio should continue to decline gradually and is expected to reach 83.7% of GDP at the end of 2007 and 80.8% at the end of 2008.
Aalberts is a strong niche player with an excellent acquisition strategy and earnings track record. We expect it to continue to leverage on its market positions, with ample room for cross-selling and more acquisitions to come. History shows that profitability is sustainable in an economic downturn. Buy.
Investment thesis
We believe Aalberts Industries has one of the best earnings and acquisition track records in our Dutch small- and mid-cap universe. In addition company is more recession proof than expected on first side.
(1) A well executed acquisition strategy and track record. Aalberts has successfully carried out an impressive string of acquisitions, strengthening its market positions and offering ample room for cross-selling. We believe its warchest is well filled (at least €250-300m, on our estimates). If the company were to use its entire warchest, we estimate that it could add 10-15% to EPS. (2) Aalberts’ target is to grow the top line by 20% on an annual basis through acquisitions (10-15%) and organic growth (5-10%). This hasresulted in healthy double-digit EPS growth (close to 20% on average over the past ten years). (3) Excellent market positions with numerous cross-selling opportunities. Its leading positions in niche markets give Aalberts strong pricing power while, on the supply side, its increased scale is very beneficial for its purchasing power, in our view. (4) Strong and focused management. Many investors are concerned about Jan Aalberts’ retirement plans. We believe these worries are overdone, as Aalberts is certainly not a one-man show, with much of its growth, innovations, efficiencies, cross-selling, etc, achieved through the management of its individual companies. (5) Sustainable profitability in recession. During the previous recession, Aalberts managed to keep the top line up well (zero organic growth). In terms of profitability, the company maintained its EBITA margin at a relatively high 11.2%.
Key newsflow
Focus is on the release of 2007 figures at the end of February. Aalberts expects EPS growth in line with the average of recent years (15-20%). Following the recent slowdown in construction markets, especially in the US, Spain and Germany, we have reduced our EPS forecasts from €1.31 to €1.27 for 2007 and from €1.47 to €1.37 for 2008. Our estimate for 2008 is based on organic growth of 2-3% and more or less stable EBIT margins.
Valuation
The stock trades at a 2008F PER of 9.9x, below its historical range of 12-14x. Taking into account Aalbert’s improved business mix with ample room for cross-selling, but some slowdown in market conditions, we believe a valuation in the middle of the range is justified, giving a target price of €18.00. Regarding the issue of potential fines (company was fined for €100m regarding cartel copper fittings involvement). Aalberts has lodged appeal but, in the most negative case (a fine of €100m), our target price would be lowered to around €17.2.
Main shareholders (%) Aalberts Beheer 13.8WAM 5.9
Share data No. of shares (m) 101.6Daily turnover (shares) 531,438Free float (%) 80.0Enterprise value (€m) 1,909.2Market cap (€m) 1,374.6
Newsflow
Date Description
28/02/2008 FY07 figures
Share price performance
1012141618202224
12/05 6/06 12/06 6/07 12/07PriceAEX All Share (rebased)
Company profile Overview Aalberts has two core activities: Industrial Services andFlow Control. Industrial Services generates 31% of turnover and 38% of EBIT, versus 69% and 70%,respectively, for Flow Control. Looking at geographicalspread, Germany is its main market (18% of sales),followed by the UK (15%), Benelux (14%), the US(12%) and France (12%). The company has an excellent track record in achievingearnings growth and making decent acquisitions. Since1985, it has achieved strong EPS growth (almost 20%pa on average).
Flow Control Flow Control focuses on the development, productionand sale of products and systems for connecting,distributing and regulating liquids and gases. These aresupplied worldwide to the wholesale trade, OEMs, gasproducers, utility corporations, laboratories and thebeer and soft drinks industries.
Industrial Services Industrial Services focuses on the development,production, processing and sale of complex parts forhigh-grade industrial end-products based on customerspecifications. The parts and services are supplied to alarge number of market segments, such as theprecision engineering, medical, automotive, electro-metallic, aircraft, defence, aluminium, telecoms andsemiconductor industries. In most of the markets in which it operates, Aalbertsholds a top-three position. Its long-term strategy is based on EPS growth, continuous turnover growth,balanced distribution of turnover, leading positions inniche markets and healthy balance sheet ratios. Thecompany has a well diversified portfolio, spread acrossvarious products, markets and regions. It claims that noindustry represents more than 15% of sales and nosingle client more than 2-3% of sales.
SWOT Strengths Strong market positions in niche markets Very strong earnings track record Excellent acquisition track record Strong purchasing power
Weaknesses Limited disclosure on a divisional basis or a quarterlybasis
Opportunities Ample room for cross-selling opportunities. High exposure to fast-growing markets in EasternEurope
Threats Volatile raw material prices Weakening of the economy EU fine of €100m
Ackermans & van Haaren (AvH) is invested in an attractive range of activities, from Belgian private banking to dredging. The stock should trade in line with its NAV (vs a current 21% discount), given: (1) its excellent track record; (2) potential hidden value; and (3) net cash at 16% of market value. BUY.
Investment thesis
AvH is invested in an attractive range of activities, from Belgian private and (niche) commercial banking to dredging, including a strengthening partnership with Albert Frère’s investment company, CNP. AvH offers exposure to a (mainly) Belgian portfolio of private equity stakes with a strong track record of value creation. The fundamentals of its investments remain strong, although current financial markets conditions are affecting the outlook and investor confidence in investment companies.
The most recent pillar, which is now a standalone business unit, is the sprawling (Belgian and Luxembourg) real estate and property development, which represents more than 11% of the group’s NAV (from less than 5% 24months ago). We value it at €330m, with potential upside from Extensa (valued at 15x prospective earnings). Extensa owns 1m m² of land, 0.6m m² of projects awaiting permits and 0.12m m² of projects with permits as well as property projects (50% of the 0.45m m² Tours & Taxis in Brussels and 25% of the 0.4m m² Cloche d’Or in Luxembourg). Management is guiding for recurring earnings of €20-30m, well above our forecasts.
Taking advantage of buoyant market conditions, AvH has disposed of various assets over the last few years (Solvus, Avia Partners, Quick), providing the company with a €360m cash pile (16% of market cap). At the same time, despite strong competition from international private equity groups, AvH has managed to invest in small, but attractive companies (Spano, Financière Duval, Distriplus, Manuchar, Iris and Capital & Financein 2007) at reasonable valuation multiples.
Key newsflow
Deal flow is to be expected within private equity and at DEME given the buoyancy of the dredging sector, which is experiencing an exceptionally strong cycle. Disposal candidates could include Van Laere (construction).
Valuation
Our new €83 target price (€85 previously) is in line with our estimated break-up value, based on peer multiples for DEME (8.0x 2008F EV/EBITDA) and financial services (12x 2008F PER vs 15x previously). The private equity arm is valued at 7.5x 2008F EV/EBITDA (8.0x previously). The stock is currently at a 21% discount to NAV. We believe it should trade in line with its NAV given: (1) AvH’s excellent track record; (2) potential hidden value within property development and dredging; and (3) net cash estimated at €360m.The company’s defensive profile and cash position do provide some protection against the current market turmoil. _
Main shareholders (%) Scaldis 33.0
Share data No. of shares (m) 33.5Daily turnover (shares) 18,940Free float (%) 67.0NAV (€m) 2,803.3Market cap (€m) 2,205.8
Newsflow
Date Description
7 Mar 2008 FY07 results 26 May 2008 AGM + 1Q08 update 28 Aug 2008 1H07 results 27 Nov 2008 3Q08 update
Company profile Overview Ackermans & van Haaren is an investment companywith controlling stakes mainly in non-listed companies (86% of NAV). Its roots are in dredging in Antwerp, which explains its 50% stake in DEME, a leadingdredging company. The group’s investment philosophyis based on long-term majority holdings in strategicstakes with a high growth profile. However, itsinvolvement is limited to the selection of management and specification of companies’ long-term strategy. It does not intervene in day-to-day management.
Contracting (34% of NAV) The contracting sector includes the 50% stake inDEME, a leading dredging company behind Boskalis,co-owned by CFE (50%), which also specialises in thetreatment of polluted soil and sludge. In addition, thecontracting division holds 100% of the contractingcompany, Van Laere, which specialises in infrastructureconstruction work in Benelux, and 75% of NMP, whichbuilds and operates 800km of gas and chemicalpipelines in Belgium.
Financial services (20% of NAV) Finaxis is the banking division, 75% owned by AvHsince February 2004 (60% previously). Finaxis consistsof Antwerp-based Bank Delen, a private bank focusedon asset management (€12bn), and Bank van Breda, ahigh-end retail bank.
Real estate (12% of NAV) AvH owns a stake in a listed Sicafi, Leasinvest RealEstate, and 100% of Extensa, a land (200ha) and realestate development company. AvH’s stake inLeasinvest Real Estate was diluted to 29% followingAxa’s capital injection (in kind).
Private equity (19% of NAV) This is the group’s capital development portfolio,through the 74%-owned Sofinim. The portfolio consistsof 15 unlisted stakes invested in Belgium in varioussectors, three listed stakes and GIB, the JV with CNP,which is invested in, among other businesses, GroupeFlo and Trasys. Sofinim’s most recent investment is a50% stake in Distriplus alongside CNP. Distriplus ownsthree Belgian non-food speciality retailers.
Risks The NAV and the discount to NAV are both highlygeared to the equity market performance; a downturnwould likely have a profound negative impact.
SWOT Strengths Well positioned assets with positive outlooks for mostcore activities. Good track record
Weaknesses Diversified assets with limited synergies. Focused onBelgium, where the pool of potential investments islimited. Cash is unlikely to be handed to investors otherthan through the regular dividend payout (c.30%)
Opportunities Cash pile invested (so far wisely) in companiespositioned in consolidating sectors with a clear exitstrategy. Potential gains from real estate activity (landand real estate development in particular)
Threats NAV and discount to NAV both highly geared to equity market performance; a downturn would likely have anegative impact on the stock
Agfa is in distress: fundamentals are deteriorating, there are management issues, and external factors (raw material prices and US$) are still weighing on margins. Our SELL is backed by downside risk from weak fundamentals, room fornegative newsflow and unjustified valuations.
Investment thesis
The recent share price performance overstates opportunities from the growing pressure from investors on management, requiring the latter to take swifter action to counter the company’s challenges (the declining analogue business, the high cost base, raw material prices and working capital, etc). Opportunities could also arise from M&A speculation, although this looks more than reflected in the share price (up 65% from its lows in November).
However, we see numerous risks, which preclude a more bullish view: (1) management has yet to provide revised guidance for FY08 (anything below consensus would put it under further pressure); (2) earnings estimates are still at risk (fundamentals are weak, working capital remains high, management warned that “operational issues” could take 12 months to fix, etc); (3) potentially mounting litigations and claims against Agfa relating to AgfaPhoto, which was sold in 2H04 and went bankrupt in May 2005; and (4) valuation risks as, the €7.5 per share book value, which appears to be a valuation floor, could be dented by potential goodwill impairment (Agfa’s balance sheet comprises €560m goodwill with €200m relating to GWI/Orbis, on equity of €930m).
Risks to an M&A scenario include: (1) Agfa is still in the midst of a €250m restructuring programme; (2) more restructuring is probably required (hence more costs and potential social unrest); and (3) ongoing management issues. We therefore believe a divisional carve-out scenario is likely (although not within six months) as it would better ring-fence the risks.
Key newsflow
The next milestones: (1) potentially early January: new FY08 guidance; (2) 27 February: FY07 results – management is guiding for flat FY07 sales and a 6% REBIT margin (for 4Q07: flat sales and margin for Graphics, a REBIT margin above 10% for Healthcare and a 12-15% REBIT margin for Materials); (3) 29 April: change of Chairman at AGM; (4) June 2008: Drupa, the four-yearly graphics trade fair; and (5) some time in 2H08: the effective split into three independently listed companies (Graphics, Healthcare and Materials).
Valuation
Our unchanged target price of €8 is based on a SOTP: 10.8x 2008F EV/EBIT for Healthcare (with 8x EV/EBIT for the Analogue business with a weight of 60% and 15x for Digital), 9x EV/EBIT for Graphics (based on a 10% discount to peers to account for the lower margins) and 9x EV/EBIT for Materials. The current share price can only be justified based on 2009 estimates, which we believe is unsafe given the lack of visibility. _
Main shareholders (%) Franklin Resources 11.5Nordea 5.9Treasury 3.2
Share data No. of shares (m) 124.8Daily turnover (shares) 1,455,280Free float (%) 100.0Enterprise value (€m) 2,647.3Market cap (€m) 1,329.0
Newsflow
Date Description
27 February 2008 4Q07 results 29 April 2008 AGM 29 May 2008 Drupa fair (to 11 June)
Company profile History Agfa was set up in 1867 as a dye maker and in 1964merged with Gevaert, a manufacturer of photographicfilm and paper. In 1981, Bayer took full control. Afterdiversifying into pre-press and radiography, Agfabecame a global player in the imaging industry,competing with Kodak and Fuji. Bayer sold 70% of its stake at the IPO in 1999 and theremaining 30% in 2002. KBC sold its 27% stake in2006, increasing the free float to 100%. Geographic exposure: 50% of its revenue in Europe,25% in the Americas and 20% in Asia.
Agfa Graphics (66% of sales, 29% of REBIT) Agfa Graphics supplies a wide range of photographicand electronic pre-press solutions for the graphicsindustry. Agfa is a world leader for pre-press systems;38% of the world’s printed media is produced usingAgfa products, which include printing film, plate andpaper, film and plate imaging equipment, processingand proofing equipment, professional scanners andpre-press software. Since 2004 Agfa has been involvedin the nascent industrial inkjet market, which accountsfor €230m in revenues or 7% of divisional sales.
Agfa Healthcare (29% of sales, 58% of REBIT) Healthcare still suffers from declining sales of analogueproducts, which account for 49% of its revenue (against51% for digital products). Analogue products includeclassic radiology systems (17% of healthcare sales –mid-single-digit EBIT margin), with declining sales, andhardcopy (32% of healthcare sales), mostly films, salesof which are in decline. Computed radiography onstandalone workstations accounts for 18% ofhealthcare sales but is barely profitable because ofloss-making hardware sales. The growth area forhealthcare is the market for digital solutions orhealthcare IT (33% of healthcare sales), whichcomprises PACS/RIS systems, departmental solutions(mostly radiology and cardiology but expansion towardsother departments) and hospital-wide IT solutions (Orbis). This market is growing by c.15% pa.
Agfa Materials (5% of sales, 15% of REBIT) Materials offers film-based consumables in the business-to-business market. It supplies products to themotion picture market (sound recording film and colourprint film) and the non-destructive testing market(microfilm and films) as well as solutions for aerialphotography, for thermal printing, for the production ofprinted circuit boards, security identification cards andpassports and for use in electroluminescent lamps,touch screens and displays. Agfa Healthcare and AgfaGraphics are major customers to the division.
SWOT Strengths Leading market position in pre-press and radiologysolutions. Good free cash flow generation
Weaknesses Slow transition to digital. High exposure to silver andaluminium prices. High level of working capital, whichweakens the balance sheet structure
Opportunities Expansion in digital printing market through inkjettechnology. Double-digit IT healthcare market growthwith digitalisation of hospitals, share of services toincrease
Threats High-margin hardcopy sales to decline, puttinghealthcare margins under pressure
Alfacam is the principal High Definition (HD) studio vanprovider to the 2008 Olympics and, as such, should enjoy significant growth. Limited visibility of the content activities and a full valuation of the van business underpin our HOLD recommendation.
Investment thesis
Alfacam is a Belgian TV facilities provider. Its core business lies in the building, renting and operation of Outside Broadcasting (OB) vans, for which it has, by far, the largest HD-equipped fleet in Europe with 17% market share. The company enjoys the following growth drivers: (1) its focus on the high-end of the market results in higher profitability; (2) Alfacam should benefit from the increasing adoption of HDTV; and (3) the current shortage of HD-capable OB capacity commands higher prices.
We believe Alfacam’s focus on the latest technology available has allowed it to become the OB van supplier to the high-end of the market (mainly the largest sport events) which offers more profitability and visibility. As a result, the company’s revenues are strongly exposed to major sport events and, we expect a major step-up of revenues ahead of the 2008 Olympics in Beijing. Alfacam is also set to benefit from the increasing penetration of HDTV which will generate higher demand for HD-equipped OB vans where Alfacam has the largest fleet in Europe. Datamonitor expects the HDTV penetration rate in Europe to increase at a 2006-10F CAGR of 112%.
• The current shortage of HD OB capacity should be beneficial for Alfacam which should be able to charge higher prices for its HD-equipped fleet. It recently ramped-up its OB vans production capacity from four to five pa.
In spite of the current strong momentum, we would not recommend buying Alfacam’s shares as (1) we expect the shortage of HD-equipped OB vans to be short-lived and (2) the current share price reflects a full valuation of the only businesses with visibility (OB vans and real estate) with potential upside stemming from the immature and low visibility content business.
Key newsflow
As Alfacam is strongly exposed to major sporting events, the announcementof events recording contracts can be expected at any time. We givepractically no value to the content activities due to limited visibility. Majorcontent deal announcements would, in our view, support the share price.
Valuation
We believe Alfacam has strong growth drivers and is well positioned to benefit from the increasing adoption of HDTV. However, at the current share price, the OB van, real estate and wireless businesses appear fully valued. At our €18 TP Alfacam would trade at 2007F multiples of 32.2x PER, 12.8x EV/EBITDA d 2008F lti l f 10 1 PER d 6 1 EV/EBITDA
Main shareholders (%) Sigmacam 64.2Go Capital 5.1
Share data No. of shares (m) 8.1Daily turnover (shares) 275.0Free float (%) 74.2Enterprise value (€m) 137.4Market cap (€m) 129.1
Company profile Alfacam is a Belgian TV facilities provider. Its corebusiness lies in the building, renting and operation ofoutside broadcasting (OB) vans for which it has, by far,the largest HD-equipped fleet in Europe (14 units). Thecompany recently entered three new complementarymarkets where it has a challenger or pioneer position:(1) the long-range terrestrial transmission of HD contentfor live productions; (2) HDTV broadcasting; and (3) therental of the largest TV production studio in Belgium.The company’s revenues are strongly exposed to majorsport events and, therefore, we expect a major step-up of revenues ahead of the 2008 Olympics in Beijing.
Outside broadcasting (76% of 2007F sales) The outside broadcasting segment includes twosources of revenues: (1) the rental/operation of OBvans and TV production equipment; and (2) the sale ofexisting or new OB vans to third parties. It is Alfacam’score business, positioned as a technological leaderthanks to having the largest HD-equipped fleet in Europe.
Wireless (5% of 2007F sales) Management spotted an attractive business opportunity in the terrestrial long-range transmission of digital HDcontent. It used to be covered by national publicbroadcasters, but they will probably not be able tofollow the required innovation pace. In our view,Alfacam can capitalise on its strong HD facilitiesreputation and client base to be successful in thismarket.
Real estate (5% of 2007F sales) Alfacam owns the Eurocam Media Centre which is astate-of-the-art TV production facility located nearAntwerp, Belgium. The company intends to capitaliseon its investment in real estate to generate rentalincome and create synergies with its other activities.
Content (14% of 2007F sales) Alfacam sells its HDTV channels on a full buyout basisto pay TV boutique or national public broadcasterslooking for an inexpensive entry into HDTV. Alfacam’slong-term ambition is to create a pan-European culture HDTV broadcaster adopting a multi-regional ‘Eurosport-like’ strategy. We believe it will offer the desired low-risk approach but it does not provide visibility on futurerevenues.
AMG’s share price has doubled since the IPO in July 2007 at €24. We believe that the current share price reflects the very promising future of the company, mainly in the solar silicon business. As such, we rate the share a HOLD. Both downside risk and upside potential are substantial.
Investment thesis
We believe that AMG has quite impressive growth prospects. We estimate 16% revenue CAGR from 2006 to 2009F, and an EBITDA margin improvement from 7.8% to 23.7%.The main profit drivers are: (1) the low cost entry in solar silicon via its daughter company Timminco, using proprietary know-how. AMG should ramp up a 3,600tpa facility by end 1Q08. We estimate sales prices for AMG’s solar silicon at US$40,000/t, versus US$2,000/t for regular silicon. Since AMG has already signed contracts to deliver 26,500t of solar silicon over the next five years, we expect AMG to further increase its production capacity. In light of the size of the recent capital increase of Timminco, we expect AMG to increase its solar silicon capacity to 7,500tpa by 2009. (2) The planned increase inproduction capacity for ferrovanadium (FeV) from 4.5mlb to 5.6mlb by 2010, while using a unique process utilising secondary raw materials. In addition, market fundamentals for FeV seem strong, as global demand for steel and the FeV content in steel increases and the industry consolidates. (3) The large order backlog of US$317m (on 30 September 2007) in the Engineering Systems division. (4) The possible upsurge in prices of the other metals, such as chromium and tantalum, which is only marginally reflected in our estimates.
AMG’s share price has doubled since the IPO in July 2007 at €24. We believe that the current share price reflects the very promising future of the company, mainly in the solar silicon business. As such, we rate the share a HOLD
Key newsflow
AMG should publish FY results for the first time at the end of March 2008. At around the same time, it should also become clear whether or not Timminco completed the ramping up of its solar silicon facility. Meanwhile, potential new contract announcements in solar silicon or the announcement that Timminco succeeded in improving the purity of its solar silicon to 99.9999% should be an important trigger for the share price.
Valuation
We value AMG at €55 per share, based on our SOTP valuation, in which we value the company’s three business units in line with its peer group 2009F EV/EBITDA multiples. As such, we value Advanced Materials excluding Timminco at 6.7x, Timminco at 10.6x, and Engineering Systems at 7.0x 2009F EV/EBITDA. _
Main shareholders (%) Safeguard International Fund 26.56Citadel Equity Fund Limited 5.18Oz Management LP 5.18Fidelity Fund Sicav 5.08
Share data No. of shares (m) 26.8Daily turnover (shares) 46,402Free float (%) 73.4Enterprise value (US$m) 3,182.6Market cap (US$m) 2,013.1
Newsflow
Date Description
March 2008 FY07 results 15 May 2008 1Q08 results 14 August 2008 2Q08 results 14 November 2008 3Q08 results
Company profile AMG, incorporated in the Netherlands, is a globalspecialty materials company, offering engineeredmetallurgical products and advanced vacuum furnacesystems to a wide variety of end-markets. Mostly, AMGuses its proprietary know-how to produce its metals andmaterials. The company is active in 12 countries on fivecontinents. In addition, AMG designs, engineers andproduces advanced vacuum furnace systems forgrowing industries globally. AMG’s metallurgicalexpertise has enabled it to obtain leading marketshares for many of its products and systems. Many ofAMG’s products and systems are important to theproduction of key components for the aerospace,energy (solar), construction and transportationindustries. AMG is organised into two business units: AdvancedMaterials and Engineering Systems.
Advanced Materials (76% of 2006 revenues) develops and produces niche specialty metals andcomplex metals products. AMG is one of a limitednumber of significant producers globally of nichespecialty metals, such as ferrovanadium, ferronickelmolybdenum, aluminium master alloys, silicon metal(including solar grade), chromium metal andmagnesium alloys, used by steel, aluminium, siliconand super-alloy producers for aerospace, energy, construction and transportation applications.
Engineering Systems (24% of 2006 revenues) designs, engineers and produces advanced vacuumfurnace systems and operates vacuum heat treatmentfacilities. AMG sells vacuum furnace systems tocustomers in the aerospace, energy (solar),transportation, super-alloy and specialty steelindustries.
SWOT Strengths Two complementary business units; Market leadership in specialty metals, using proprietary technology, andvacuum furnace systems, which provides early insight into supply side trends in the metals markets; Global presence; Strong customer base; Wide array of end-markets: largest product accounted for 11% of totalrevenues in 2006; Experienced management team.
Weaknesses No track record as a consolidated company; cyclicality,due to dependency on metal prices; absence ofdividend payments in the foreseeable future.
Opportunities Focus on growing industries, including solar energy,aerospace and infrastructure (steel); Capacityexpansion in ferrovanadium, solar silicon and tantalummining capacity; Favourable pricing environment inferrovanadium, chromium metal, tantalum andsilicon; Growing order backlog at Engineering Systems,Consolidation in metals industry.
Threats Technological risk: dependency on proprietary know-how; Substitution risk; Currency risk: US dollarweakness; Supply risk: a large supply contract forspent catalyst (used to produce ferrovanadium) is up forrenegotiation in 2008; Patent risk: the patent for AMG’slow-cost production of solar grade silicon metal is stillpending; Execution risk: in building the solar gradesilicon production lines; Economic risk: risk ofrecession in aerospace and infrastructure activities.
The 2007 performance (strong growth, a large acquisition, project awards) exceeded our expectations, and the outlook remains favourable, generating an EPS CAGR of 19% for the coming years. We believe Arcadis deserves to be valued at a 10% premium to its peers, implying a TP of €67.
Investment thesis
Arcadis’s share price has declined sharply since end-July owing mainly to investors’ fears over its high US and US$ exposure. However, thanks especially to its US business, organic growth should not fall below 10% in 2008/09. We still believe the Arcadis investment case is one of the most compelling stories among Benelux small and mid-caps, thanks to: (1) the favourable to excellent outlook for the relevant market segments; (2) focused management executing its strategy consistently as outlined; and (3) benefiting from add-on acquisitions both stand-alone and through cross-selling.
Most visible in its favourable outlook is environmental services, which already generates c.40% of EBITA in a segment that should post double-digit revenue growth and EBIT margins in the foreseeable future. Arcadis’s initiatives to build worldwide environmental services are consistent with its strategy of internationalisation and raising profitability. Approaching the €600m revenue mark, or 34% of the total in 2008, Arcadis is one of the largest environmental services firms worldwide with an especially strong position and an increasing market share in the US market, which is huge and growing by over 10% pa.
Arcadis’s other divisions are showing healthy growth too. The Infra division (40% of total) is growing sharply in Europe and the US, with Arcadis looking to strengthen its US infra position to a top ten level. We believe its war chest is large enough to fund a €250m acquisition. Meanwhile, its third leg, Buildings, is growing thanks to new large outsourcing contracts and it is benefiting from trends of complex building in urban areas, with interesting projects coming to the market (eg, 2012 Olympics). Architectural/project management firm RTKL, Arcadis’s most recent large acquisition, fits into this urban development work, raising the group’s profile while supporting EBIT margins at the group level.
Key newsflow
Interesting news can be expected with respect to large orders such as GRiP or project management. Another large acquisition would take time but is favoured by management. At the 2007 results, we expect Arcadis to raise its 2010 EBIT margin target from the current 10% to 11-12%.
Valuation
We rate Arcadis a BUY. It remains one of our favourite Benelux small and mid-cap stocks. It is in excellent condition to benefit from the opportunities the market offers, to continue its high growth path (2006-09F EPS CAGR of 19%), to make value-enhancing acquisitions and to raise margins by more cross-selling among business units. The valuation is attractive at a 2008F EV/EBITDA of 6.6x, 24% cheaper than its peer group. We believe Arcadis merits a 10% premium to the sector, implying a 2008F EV/EBITDA of 9.4x.
Main shareholders (%) Stichting Lovincklaan 20.8Fortis 6.1Reach Capital 5.8Delta Deelnemingen Fonds 5.3
Share data No. of shares (m) 20.4Daily turnover (shares) 44,234Free float (%) 61.0Enterprise value (€m) 990.1Market cap (€m) 929.6
Newsflow
Date Description
3 March 2008 FY07 results 7 May 2008 1Q08 results/AGM 7 August 2008 1H07 results 12 November 3Q07 results
Share price performance
20
30
40
50
60
70
80
12/05 6/06 12/06 6/07 12/07PriceAEX All Share (rebased)
Company profile Arcadis, formerly Heijdemij, is an engineeringconsultancy firm operating in over 100 countries with strongholds in the Netherlands (26% of 2006 revenues,21% of 2006 EBITA), Other Europe (23%, 25%), theUS (42%, 44%) and the Rest of the World (9%, 10%).Arcadis’s segmental breakdown is engineeringconsultancy in infrastructure, environmental and building (facility and project management).
Infrastructure (2006: 46% revenues, 43% EBIT) Arcadis’s infrastructure activities are related to roads,railways, waterways, energy and telecommunications.Revenues from these activities are mainly generated inthe Netherlands and the US, but other Europeanregions, such as Belgium and France, are becomingincreasingly important.
Buildings (2006: 17% revenues, 14% EBIT) Arcadis designs office buildings, distribution centres,and stadiums, etc. Operations are throughout Europe; the US is becoming less important especially since thedivestment of its engineering division for the automotiveindustry. Arcadis added facility management to itsportfolio with important customers such as Philips andDSM. However, project and programme managementis becoming more important with the acquisitions ofPRC (2003), AYH (May 2005) and RTKL (July 2007).
Risks Risks to our BUY rating relate to a general slowdown ora decline in environmental services in the US. Anotherrisk is the possibility that Arcadis will break its trackrecord by making an unwise acquisition in Europe orthe US.
SWOT Strengths Among the top ten engineering firms in the world Top five player worldwide in environmental services,representing 40% of EBITA in 2006F 50% of revenues stem from government Good management with active portfolio management Worldwide presence, bias towards the Netherlands andthe US
Weaknesses Organic growth not above 5% for many years Dependence on customers with monopolisticcharacteristics Not a strong defendable position in all countries orsegments
Opportunities Environmental services higher on company agendas Acquisition of BBL offers top-line growth Consolidating markets with opportunities worldwide Excellent product, such as GRiP, offers opportunities todevelop or export in other countries
Threats Slowdown of economic growth, hurting infra works Government austerity for large projects or total budgets More competitors, especially those with deep pockets,entering the attractive environmental services market Translation of US$ into euros
We consider Arseus an attractively valued company, active in a defensive, moderately growing sector. We expect major share price potential to be unlocked, once the newsflow (and the most likely positive impact on results) regarding takeovers starts to kick in.
Investment thesis
We believe Arseus is well positioned to capitalise on prevailing market trends (population ageing increasing the demand for healthcare products, increased attention to dental care and aesthetics), which should secure its top-line growth. Moreover, Arseus’s organic divisional business model captures solid, often mutually reinforcing growth drivers, such as: (1) the increasing demand for tailor-made compound medicines; (2) Dental’s high-precision component manufacturing activity; (3) the new uniform software for pharmacists and for dentists. Arseus also aims to move up the value chain by branding parts of its product range, eliminating barely profitable distribution contracts and concentrating more on (higher-margin and higher-growth) products and services.
Arseus’s ultimate goal is to become a pan-European market leader in its business, through both acquisitions of companies in this fragmented sector and selective greenfield operation start-ups. The company targets €500m in sales by 2010F, driven almost equally by internal and external growth. Therefore, Arseus’s ‘Buy and Build’ strategy is the most likely cornerstone of its business model. In view of the company’s still limited scale and its still highly Benelux-oriented geographical scope, the potential for expansion is substantial and should offer major opportunities to benefit from economies of scale, leading to earnings growth above our current forecasts as these are purely organically based.
Key newsflow
Arseus has been listed since 5 October 2007, following a c.2xoversubscribed IPO offering. Its share price has evolved nearly in line with the declining stock markets since then, to trade now 10% below the €10.25 IPO price. The market will be tracking acquisition-related news.
Valuation
We rate Arseus a BUY as: (1) the 3Q07 trading update was reassuring, (2) it is attractively valued (2008F PER of 10.7x, 2008F EV/EBIT of 9.4x, 31% below sector peers and 23% below the median for Belgian small & mid-caps, our DCF value points to €13.50 per share); (3) management has indicated that takeovers should come in the very short term. We see this last issue as an important trigger for the shares as we believe the external growth will be earnings-accretive. Our €11.50 TP is set at a 15% discount to Arseus’s estimated DCF value. _
Main shareholders (%) Omega Pharma 24Couckinvest 11.9
Share data No. of shares (m) 31.2Daily turnover (shares) 19,392Free float (%) 63.8Enterprise value (€m) 303.0Market cap (€m) 288.6
Newsflow
Date Description
17 Jan 2008 4Q07 trading update 13 Mar 2008 2H07 results
Company profile Arseus was Omega Pharma’s business-to-business (B2B) activity, providing products and services toEuropean healthcare professionals and institutions.Arseus has been spun off through its listing in October2007. Arseus is organised into four business divisions,with different customer group(s) and/or product types.
Fagron (35% of sales) Offers a one-stop shopping solution in pharmaceuticalcompounding products and services mainly topharmacies, but also to the pharmaceutical,nutraceutical, veterinary and cosmetic industries.
Arseus Dental (39% of sales) Mainly distributes dental consumables (eg, implants,bleaching products and artificial teeth) and dentalequipment (eg, dental chairs, 3D scanning equipmentand blasting units) to dentists or dental laboratories.
Arseus Medical (17% of sales) Supplies a wide variety of products and services(hospital disposables; surgical, diagnostic and wound-care products; hospital beds; wheelchairs; and eyecareequipment) to various healthcare customer groups(hospitals, elderly care homes, GPs, ophthalmologistsand opticians).
Corilus (9% of sales) Develops and provides integrated medical IT solutions(hardware and software) for healthcare professionals,such as pharmacists, dentists, GPs, veterinarians,ophthalmologists, specialist physicians, homecare providers, nursing homes and health centres. We estimate that more than half of Arseus’s activitiesare distribution-related. Arseus employs c.1,400 peopleand has operations in eight Western Europeancountries, but 76% of sales is still linked to the Beneluxmarket. Arseus’s activity base is therefore still at anearly phase of internationalisation. The ultimate goal forArseus is to become a pan-European market leader inthis business, through acquisitions of companies andselective greenfield operations start-ups. The company targets €500m in sales by 2010F, driven almost equallyby internal and external growth.
Risks Arseus’s takeover strategy has the inherent risk linkedto the integration process of takeovers. Moreover, thecompany is at an early stage of a turnaround.
SWOT Strengths Large sales focus and broad product range, whichshould enable a better market penetration and facilitateobtaining (cross-border) distribution contracts Expertise in acquiring companies Strong brands and market positions within Fagron andCorilus Arseus’ end markets grow, capitalising on the ageingpopulation and/or increased attention to aesthetics
Weaknesses Scope mainly limited to the Benelux Still in the early phase of a turnaround Competitive pricing environment in dental consumablesand medical disposals
Opportunities “Buy and Build” strategy , likely to be the cornerstone ofits business model Leverage on group’s scale Development of own-branded products
Threats Difficulties in integrating or streamlining takeovers Loss of distribution contracts
Despite renewed shareholder activism, we believe a break-up of ASM is unlikely in the short term while ASMP is exposed to back-end market weakness. Although front-end earnings improvements are encouraging, we are sceptical regarding the ultimate level of front-end profitability over the cycle.
Investment thesis
ASM has been posting mixed results, and its profitability levels have remained rather low. It entered 4Q07 with an order backlog of €187m, down 23% from the end-June level. Management expects front-end (FE) bookings to rebound, but 4Q07 sales are forecast to be down slightly sequentially. ASM reiterated its FE net profit target albeit excluding special items. FE saw its bookings drop in 3Q07, but these should be flat-to-higher in 4Q07; hence management has been cautiously optimistic on its FE business in 2008. For ASMP, ASM’s management expects strong sales and profitability in 4Q07,while ASMP itself says that a moderation of its results may occur in 2008. The latter confirms our expectation of a flat contribution from ASMP in 2008,and hence earnings growth next year will have to come entirely from an FE recovery.
Key newsflow
A return to FE profitability is important for management in its battle with activist shareholders. ASM’s management has been under shareholder pressure for some time with investor(s) targeting new management and a break-up of the company. They suggest a spin-off of the highly profitable back-end operations (ASMP) and a return of the proceeds to ASM shareholders. Management, conversely, want to maintain the status quo.
This shareholder pressure is not new as for several years management has been battling to transform the front-end unit into a profitable entity. Only ASMP’s dividend payments have enabled the beleaguered front-end unit to keep its head above water. However, ASM put an end to this subsidisation in 2007, and recent results suggest some improvement in the operating performance as shareholder pressure has led management to take more drastic measures.
Valuation
Following the 3Q07 results, we reduced our EPS estimates by an average of 4% to reflect lower-than-expected 4Q07 guidance and the deteriorating 2008 outlook. The continued FE lull does not make us any more optimistic regarding the long-term level of profitability that these operations may ever reach over the cycle. However, the modest improvement so far and the €0.10 dividend may help keep activist shareholders at bay for a while. Our sum-of-the-parts-derived TP is €17 (previously €19), which would value the group at a 2008F PER of c.15.6x. This assumes a value of -€2.0 for the FE activities and reflects the lower share price of ASMP. _
Main shareholders (%) Stichting Adm.kantoor 12.9Hermes 9.9Fursa 9.2Mellon 7.6
Share data No. of shares (m) 54.0Daily turnover (shares) 446,541Free float (%) 77.9Enterprise value (€m) 1,776.0Market cap (€m) 893.8
Company profile Overview ASM International (ASMI) was founded in 1968 as adesigner and manufacturer of front-end tools for the semiconductor market. The company added the back-end market to its focus by starting up the subsidiaryASM Pacific Technology (ASM PT); ASMI now owns c.54% of ASM PT after an IPO.
Front-end activities ASMI is a supplier of reactors used in the depositionprocess to lay thin films on a bare wafer. The companymanufactures batch and single-wafer machines forseveral processes, such as epitaxy, physical vapour deposition and chemical vapour deposition. Its latesttechnology is the introduction of Atomic LayerDeposition, whereby layers are grown at the atomiclevel. Front-end activities account for c.50% of ASMI'srevenues. Sales are divided between Europe, Japan,South-East Asia and the US. ASMI has front-end manufacturing sites in the Netherlands, Finland, Japan,Singapore and the US.
Back-end activities ASMI's Hong-Kong-based 54% subsidiary, ASM Pacific(ASMP), produces back-end equipment. It is active in the field of assembly (die and wire bonding) andpackaging (encapsulation, trim and form). ASMP alsosells materials and lead frames. It is able to integrateseveral back-end processes into one machine, a uniqueattribute that significantly reduces cycle time. Back-end sales account for c.50% of total sales and are mainlyconcentrated in Asia, as the majority of ASMP’scustomer base is located there. The three back-end facilities are located in Hong Kong, Singapore andChina.
Risk factors The main upside risk to our estimates and target priceis a faster-than-expected recovery in front-end results,while the main downside risk remains the chipequipment cycle.
SWOT Strengths Strong position of ASMP Quality product offering
Weaknesses Relatively small scale vis-à-vis competitors Lack of focus in the front end
Opportunities Turning the front end profitable Industry transition to 45-nm manufacturing
Atenor’s management succeeded in transforming the company from a holding, struggling with its private equity, to a successful real estate developer in only a few years. In the meantime, net profit has soared. If Atenor expands its pipeline further, we might see another strong re-rating BUY
Investment thesis
We recommend BUYing Atenor shares as we expect:
(1) Atenor’s EPS to triple in coming years (2008F EPS of €8.13), mainly on the back of the sale of the President project. This sale should provide Atenor with a minimum (tax free) capital gain of €80m in 2007-09F, and offers the company excellent earnings visibility. As such, Atenor currently trades at an extremely undemanding 2008F PER of 5.2x.
(2) A substantial increase in the dividend payout. If Atenor increases its 2007 dividend by 10%, the payout ratio will still ‘only’ amount to a forecast 32%, hence we believe a larger increase is on the cards.
(3) Further upside for Atenor, mainly through the potential for positive surprise on the capital gain on the President project and the Brussels Europe project (not discounted for in our valuation). For the latter, Atenor is lobbying with the local authorities to be allowed to build a landmark tower project in the Brussels European district. Upside may also come from expansion of the project pipeline, via retained earnings, into Eastern European real estate development projects.
For now, we have very conservative net profit estimates in our model for the period after 2010F (ie, a net profit of €10m annually). Once the company announces new projects, however, we believe that Atenor’s share price might see a strong re-rating.
Key newsflow
At the publication of 1H07 results on 31 August 2007, Atenor hinted at the announcement of several new real estate projects in its pipeline (perhaps in Romania and Hungary). We would therefore not be surprised to see new announcements in the coming months.
The company does not publish quarterly results, but should report FY07 results in March 2008.
Valuation
Atenor is trading at an extremely undemanding 2008F PER of 5.1x, certainly if one takes into account the company’s excellent earnings visibility. We value Atenor at €47 per share, based on our SOTP model. _
Main shareholders (%) Sofinim 12.09Alva 12.093D 10.09Luxempart 10.09
Share data No. of shares (m) 5.0Daily turnover (shares) 450.0Free float (%) 42.5Enterprise value (€m) 185.9Market cap (€m) 208.1
Company profile In 2007, Atenor should emerge as a pure propertydevelopment company, the area of business in which ithas built a strong track record in recent years. Atenor’sstrategy consists of investing, via SPVs, in primelocations in Brussels and Luxembourg, on which largeprojects (offices, residences and retail) are then built.Usually, before completion of a building (which takesthree to five years), the shares of the SPV are sold witha capital gain (exempt from taxation under Belgian law)and the proceeds reinvested in new projects.
Atenor’s project pipeline offers good earnings visibility,and we expect EPS to nearly triple by 2008. Currently, it has seven projects (185,000m²) under management,for a total estimated investment of €88m, on which weexpect it to realise €120.2m in capital gains. Thisseems plausible, as Atenor has a track record ofrealising capital gains of €750-800/m². Moreover, Atenor has already announced the sale of two of theseven projects currently under management: (1) ImmoSteichen (7,344m²) at an estimated capital gain ofabout €1,906/m²; and (2) the President project(30,000m²) at a minimum capital gain of €2,637/m². Atenor has, for strategic reasons, decided to move outof private equity, after its private equity stakes reporteddisappointing results in recent years. The company hasalready sold most of these stakes, and we expect it todispose of the remaining three (IMAG, D-Side andPublimail) this year at a current book value of €15.9m.
Risks Risks to our investment case include a weakeningrental market and increasing long-term interest rates (which could spark an increase in cap rates). Bothfactors would have a negative impact on the valuationof real estate assets and thus harm Atenor’s capacity togenerate future capital gains via the sale of its realestate projects. A third risk factor is the possibleintroduction of taxation of capital gains on shares in Belgium.
SWOT Strengths Management with a strong track record in real estatedevelopment. Good earnings visibility. Strong balance sheet
Weaknesses Strong exposure to Brussels and Luxembourgrealestate market.
Opportunities Expansion of operations into Eastern Europe. Possible tower project in the European districtofBrussels.
Threats Weakening rental market. Increase in long-term interest rates. Possible introduction of taxation of capital gains onshares in Belgium after formation of federal governmentin Belgium.
We fail to see a clear share price catalyst for Ballast in 2008. Operationally the infra and building divisions are experiencing an upturn in volume, but margins are squeezed by cost inflation. The key attraction for investors would be a takeover of the company, which is easier said then done.
Investment thesis
Our neutral stance on Ballast Nedam is merely due to a lack of potential share price triggers. Peaking into 2008 we expect more or less business as usual for Ballast Nedam. The Dutch construction market, where Ballast derives about 90% of its sales, is experiencing buoyant demand, which thus far has translated into attractive margins in property development for the housing market, but has not yet led to substantial margin improvement in general construction and infrastructure. Furthermore, Ballast’s heavy lift vessel has not been occupied during 2007 and so far no new orders to construct offshore windmill parks have been won. Ballast is participating in several tenders in the UK, Scandinavia and Germany. We expect revenues to increase by 4% in 2008F and expect the EBIT margin to improve by 45 bps to 3.9% on the back of slightly better margins in non-residential construction and property development. The speculative appeal of the stock, Ballast Nedam being a takeover candidate, has, in our view, diminished in light of the credit market turmoil. We also believe consolidation in the fragmented Dutch construction market would make sense, particularly in civil engineering as it would be a strategically sound move. Nonetheless, while it is easy for us to talk like this, in reality the number of potential acquirers in the Netherlands is limited and we have no clear signals that large European construction companies want to enter the highly mature Dutch market. Note that most European construction giants currently spend their money on infrastructure-related concessions around the globe. All in all we do not have enough ammunition to push the share solely on the takeover argument.
Key newsflow
Ballast could win one of the PFI tenders set out in the Dutch non-residential market (Barracks, prison, tax and administration offices). Regarding windmill tenders, an award would have a positive impact on the stock, but these projects depend heavily on public tender procedures which can take years.
Valuation
The stock trades at a 2008F PER of 7.6x (adjusted for the discounted value of the deferred tax assets the multiple drops to 7.0x). Ballast has a payout ratio of 50% providing a dividend yield of 5.5%. We regard these valuation multiples as undemanding, but given the weak construction sentiment and the lack of clear share price triggers we do not expect a re-rating other than a general revival of the European construction sector. In which case, other shares are likely to outperform Ballast. Following the sector’s de-rating we lower our TP from €39 to €32, which is based on a 25% discount to the broader EU peer group (target 2008F PER of 8.8x). _
Main shareholders (%) Navitas 11.3Aviva 6.8Delta Deelnemingen 5.8ING 5.6
Share data No. of shares (m) 10.0Daily turnover (shares) 43,632Free float (%) 95.0Enterprise value (€m) 226.6Market cap (€m) 278.5
Company profile Overview Ballast Nedam is the smallest Dutch-listed construction stock, boasting a No. 5 market position in theNetherlands. The company has undergone a majorrestructuring and has shifted its focus from traditionalconstruction activities to participation in the entireconstruction process at the earliest possible stage.
Strategy The policy is focused on the further consolidation ofexisting development activities (in the Dutch PFI utilitymarket) and close involvement in large-scale infrastructure projects. Additionally, the company hasdivested most of its international business, which wascharacterised by hit-and-run projects all around theglobe incorporating high political and payment risks.
Business units In 2006, Ballast Nedam generated turnover of €1.3bn (versus €1.2bn in 2005), and more than 90% of thiswas earned in the Netherlands. The group employed an average of around 4,000 people during the year. BallastNedam's activities are grouped into two clusters ofcompanies: (1) civil engineering (national andinternational) development, representing 50% of totalturnover and 31% of group EBIT; and (2) the development and construction of homes and otherbuildings, representing 46% of total sales and 69% ofgroup EBIT.
Risk factors Earnings forecasts depend heavily on the status of theDutch construction market. The new tender proceduresfor large and more complex build-and-design and PFIcontracts require high tender costs, which can have amaterial impact on the earnings of small- and medium-sized construction companies. In general, risks aremigrated to prime contractors.
SWOT Strengths Lean and mean organisation Land bank and experience in tunnel construction
Weaknesses Relative small size Limited economies of scale
Opportunities Consolidation in the sector Niche markets, near-shore, windmills, CNG stations, etc
Threats High tender costs for PFI/build-and-design contracts Ongoing severe cost inflation in Dutch market
We expect further strategic repositioning in 2008; moreprecisely, we would not be surprised if BAM were to divest its dredging stake and use the cash for acquisitions. By strengthening its EU footprint and expanding into high added-value activities, the shares should re-rate. BUY.
Investment thesis
Following the de-rating of the European construction sector (-22% in the past six months), we have adjusted our target 2008F PER multiple and take a more prudent view on the SOTP valuation multiple assumptions that support our €21 target price. Nonetheless, we strongly believe that the current 30% valuation discount to the European peer group does not reflect BAM’s position in the European construction markets, nor does it takes into account BAM’s opportunity, accelerated by divestments and acquisitions, tostrengthen its European footprint and profitability levels by increasing its exposure to high added-value construction services.
We reiterate our BUY recommendation on BAM for several reasons. We expect a strong operational performance in 2008F (we do not foresee a recession as the geographical and activity spread safeguards BAM from the current troubles in some EU residential markets). Management should therefore have the opportunity to focus on strategic execution. We expect BAM to divest the dredging interest and use the full proceeds (around €400m) on future acquisitions, triggering a further re-rating of the stock. In addition, both BAM Deutschland and the PFI unit could surprise on the upside in 2008F, providing an additional share price catalyst.
Key newsflow
We continue to believe that BAM is in the middle of a strategic transformation process. It successfully sold its US operation in 2007, and we expect its dredging stake to follow in 2008. Given its rich takeover history and successful integration track record, we expect the full proceeds to be applied to future acquisitions. By strengthening its EU home markets and continuing to expand the business in high value-added activities, BAM is structurally improving its profitability profile, which deserves a valuation re-rating and therefore we regard this as the most relevant newsflow.
Valuation
The stock currently trades at a 2008F PER of 8.3x, 30% below the adjusted sector average of 12.3x (excluding the peer group’s concession-exposed high-flyers). Our TP suggest a 2008F PER of 11.1x and a 2009F PER of 10.5x, a 10% discount to the sector. The stock has been very volatile in recent months, losing 39% from its July high to the low in November as construction sentiment worsened materially due to the credit crisis and negative news from the German, Spanish and Irish construction markets. The stock has been punished for its German and Irish exposure, which is not completely warranted, in our view, because German unit performed in line with previous guidance and BAM’s Irish unit is not residentially exposed.
Main shareholders (%) A van Herk 10.0Aviva 6.0ING 5.5Capital Research Management Comp 5.3
Share data No. of shares (m) 135.5Daily turnover (shares) 770,736Free float (%) 87.3Enterprise value (€m) 3,074.0Market cap (€m) 2,115.8
Company profile Overview BAM is the largest Dutch contractor and realised FY06net profit of €137m and turnover of €8.6bn, of whichc.46% was in the Netherlands, 30.5% in the UK andIreland, 8% in Germany, 6% in Belgium, 5.5% in the USand 4% in the rest of the world. The 2006 net profit wasseverely impacted by an operating loss of €113m fromthe German operations. Sales-wise, BAM is also a top-10 player in Europe and has experience in the private-public partnership market mainly due to its strong UKbranch.
Business units BAM unites operating companies active in constructionand property (51% of sales), civil engineering (44% ofsales), mechanical and electrical contracting (2% ofsales) and consultancy, and engineering (2% of sales)and PFI concessions (1% of sales). BAM also has aninterest (22%) in a leading non-listed dredgingcompany (Van Oord) with international operations. Theoperating companies initiate, develop, build andmaintain projects concerned with living, working,transport and recreation.
Strategy BAM's strategic orientation is undergoing a shift fromproduction to performance. Privatisation and partnering,coupled with the demand for better products at lowerlifetime costs, mean that BAM has to operate acrossthe entire value chain. The complexity of larger projectsis increasing, but in addition the clients for all projectsare rightly demanding that the services provided shouldgo further than implementing prepared designs. BAM'sfinancial targets boil down to: group sales of €10bn and a profit before tax and amortisation margin of 4%.
Risks BAM’s business model incorporates large multiple-year construction contracts; execution risk, as well aswrongly priced contacts, can have serious impacts onoverall group results, and therefore, on our earningsestimates. Examples are: design variations, materialsdelay, equipment problems and submerged obstacles,all of which could potentially lead to contract disputes.The status of the Dutch economy plays a vital role asaround half of BAM's business is derived from theNetherlands.
SWOT Strengths Market positions dominant in Benelux and strong in UK Acquisition track record and large land bank
Weaknesses Pure general construction remain c.80% of total sales History of German operations
Opportunities Moving up the value chain via acquisitions Successful turn around of BAM Deutschland
Threats Risks are increasingly transferred to contractors Downturn of the Dutch construction market
1H07 results were satisfactory, with adjusted EPS more than doubling YoY to €1.32. A third disposal in December should secure 2007 results ahead of expectations at the time of the IPO. At current levels, we believe the shares offer substantial upside potential combined with a moderate risk profile. BUY.
Investment thesis
Attractive and profitable business model: ‘Property redevelopment’, the company’s primary business, is both profitable (high development margins in Belgium, high entry barriers) and without the risks associated with pure property development. The long ‘rotation’ period versus pure developers allows Banimmo to optimise the timing of the eventual disposal of the asset and some recurring income from remaining tenants.
Low risk profile: Risk is further reduced by the diversification of the property portfolio and a growing weight of recurrent income, ie, rents, the group’s share in the conference centres business and fees (management of property joint ventures for third parties).
Key newsflow
The company has just announced a third disposal (Luxembourg), generating revenue for 2007 that should secure the 2007 results ahead of IPO projections. Hence, we do not expect more significant disposals in the near future, but the Atlantic House, earmarked initially for sale in 2007, is likely to be sold sometime in 2008 once its occupancy improves. Given its nature, Banimmo has a consistent pipeline of acquisitions under study and projects in progress. The latter includes the takeover bid for the North Plaza real estate certificate.
Although no additional large disposals are expected for 2007, the company hinted that more operations could be announced in the short term. Indeed, it announced the partial acquisition of the Unilever site together with Montea and the lease of the ‘Da Vinci’ project to Mobistar.
Valuation
Attractive valuation: Our DCF and SOTP valuation models suggest a target price of €25 per share. The attractive upside potential of the shares is supported by a strong dividend yield, comparable with SICAFIs but with much better growth (lower payout and consistent pipeline). _
Main shareholders (%) Affine 50.0Management 27.4Ethias group 6.3
Share data No. of shares (m) 11.4Daily turnover (shares) 20.0Free float (%) 0.0Enterprise value (€m) 246.4Market cap (€m) 232.8
Company profile Banimmo’s origins lie in the former Antwerp-based bankAn-Hyp (now AXA Bank following its purchase by theAXA group); after its spin-off from the latter. Bit by bit,Banimmo developed an expertise in so-called distressed property. Management has gradually built upan equity stake that now stands at 35%. The rest isowned by the French listed SIIC Affine, which acquired a majority stake in 2006. Banimmo is a property company with a specific focuson ‘exploiting the structural accelerated technical andeconomical obsolescence of buildings’ and the‘repositioning of undervalued assets’. Given the holdingperiod and intermediary risks (no pure development,some recurring revenues secured), the company issomewhere between a property developer and a long-term property investor such s a SICAFI. It is a ‘propertyredeveloper’. Acquisitions are either 100% funded by Banimmo or shared with financial partners if assets are (too) large,eg, the recent investment in Dolce conference centres.In addition to diversifying risk, JVs are expected tobecome a second source of recurrent income asmanager of the JV (asset management andredevelopment fees). Today Banimmo is active in Belgium, Luxembourg andFrance, and in three asset classes (offices, retail andconference centres). It operates through two businessunits (Brussels, Paris). The main area of activity consists of offices with a focus on the Brussels decentralised area as prices in the CBDare now very high. French activities are concentrated inthe Ile de France area but, for the same reasons as inBrussels, with no strong focus in the Paris CBD area.Retail assets are subject to an ‘active reach’ acrosslarge and medium-sized cities in France and Belgium.Still the share of retail in the company portfolio valueremains small at 14%. 2007 saw the acquisition of a conference centre inChantilly, not far from Paris, and the grand opening atend-January of Dolce La Hulpe in the BrusselsPeriphery. The latter site, a former IBM training centre,was acquired in 2005 and heavily upgraded before itsopening. The Chantilly conference centre has beenoperational for six years. Banimmo currently owns two conference centres, both managed by DolceInternational, a US conference centre operator foundedin 1981 and offering a complete ‘all-in’ solution forcompanies wanting to organise conferences/ seminars.
SWOT Strengths Strong and heavily ‘incentivised’ management team Strong ‘entry barriers’ of asset repositioning Long ‘rotation’ of assets and higher weight of recurringincome reduce risks vs. pure property developers
Weaknesses Lack of liquidity of the shares given the company’s lowmarket cap.
Opportunities Accelerating obsolescence of office premises Valuation gap between property purchased and sold Low risk and high yield offered by conference centres
Threats Lack of investment opportunities in a context of lowproperty yields, even for more ‘upstream’ properties Volatility of results still heavily reliant on capital gains from asset disposals. This should improve from FY08,when we expect growing recurrent revenues.
Despite strong US$ exposure, we see significant upside potential for Barco, backed by improving fundamentals, successful streamlining, external growth prospects and rising speculative appeal. The stock is trading at a significant discount to our DCF-derived target price and to Belgian SMCs.
Investment thesis
We remain positive on Barco, with expected triggers including balance sheet leveraging and further streamlining. We also believe the stock holds speculative appeal (backed by its 91% free float and streamlined profile). Barco is cheap, trading at a 2008F EV/EBIT of 7.5x and a 2008F PER of 11.8x, 39% and 17% below the respective Belgian SMC averages. The €70m payout due in mid-2008 provides obvious support as well.
Fundamentals remain strong: (1) 2Q07 and 3Q07 results were strong, although we did see some margin weakness in 3Q07, but this did not prevent management from raising its FY07 top-line guidance (7-9% growth) and setting its FY07 reported margin target at 9% (INGF pro forma 8.1%). (2) There have been successful product launches with more to come (high-res LED wall by year-end, outdoor LED walls, high- and low-res medical displays, etc) with a well-filled order book (up 18% in 3Q07). (3) Balance sheet leveraging will see cash returned to shareholders: a €70m capital reduction was announced in October (an exceptional payout of €5.58 per share, free of withholding tax) to take place by mid-2008, following closure of the €75m BarcoVision disposal and after all other legal hurdles.
Management is confident on the outlook. 4Q07 results are expected to be strong (backed by the order book, indicating top-line growth, and a fixed cost base, indicating higher margins). Security & Monitoring is expected to reach more than a 15% EBIT margin in 4Q07 (required to reach the FY07 target of a 9% EBIT margin) vs INGF 16%. Management is also confident on FY08, driven by the order book and market recovery in certain segments, helping top line and product mix. Management expects Media & Entertainment margins to improve by 2ppt in 2008F (INGF: 7.5% in 2007F to 8.5% in 2008F).
Key newsflow
Further balance sheet leveraging, new product roll-outs, peripheral asset disposals (avionics, simulation, etc), shareholder activism and US$ exposure are likely to be the main share price drivers going forward.
Valuation
Barco has been hit hard by the recent Belgian SMC sell-off. Unlike many Belgian SMCs, 3Q07 results did not disappoint, fundamentals are robust, and the balance sheet is strong with significant support from the €70m payout (11% yield). At 7.5x 2008F EV/EBIT (39% discount to Belgian small and mid-caps) and 11.82x 2008F PER, valuations appear undemanding, particularly given the pick-up in momentum and the streamlining that lie ahead. We maintain our DCF-derived price target of €70 and our BUY rating. _
Main shareholders (%) GIMV 8.9
Share data No. of shares (m) 12.5Daily turnover (shares) 21,094Free float (%) 91.1Enterprise value (€m) 538.7Market cap (€m) 650.6
Company profile Overview Barco began manufacturing radio broadcast receiversin 1934 before expanding into TV sets. During the 1970s, the company switched to high-end nicheindustrial applications on a worldwide basis. Barco isnow a world leader in professional visualisation anddisplay solutions for B2B, ranking first or second inevery niche in which it is active. Geographical split ofsales: EMEA 48%, Americas 34% and Asia 18%. In March 2007, Barco unveiled its new structure with areshuffle of existing activities into three core divisionsfocused on visualisation technology: (1) MedicalImaging (MI); (2) Media & Entertainment (M&E); and (3)Security & Monitoring (S&M). Barco estimates that its total addressable market isworth €2.8bn, expected to grow to €3.9bn by 2010 (an8.5% CAGR), with a market share of 20%. Barcoexpects the strongest growth in M&E (9-14% to 2010),followed by MI (7-10%) and S&M (5-7%).
Medical imaging (19% of 2006 sales) This division contains softcopy image display, whichconsists mainly of high-resolution screens for PACS,modality OEM solutions and advanced visualisation,which is mainly 3D image processing software. Growthdrivers include a shift to softcopy medical imaging andincreasing use of emerging technologies/software formedical diagnostics.
Security & monitoring (31% of sales) This division includes traffic & surveillance, defenceand process & network monitoring. Products are mainlynetwork-centric display walls and screens, with demanddriven by the rising need for security and monitoring.
Media & entertainment (32% of sales) This segment consists of digital cinema, events andmedia. Growth drivers include: (1) digital cinemapenetration (currently only 3%); (2) rising media/eventsbudgets; and (3) the transition to digital display inoutdoor advertising.
Others (18% of sales) Three smaller activities: simulation, corporate AV andavionics. We believe these are potential disposalcandidates if they lack scale/breakthrough within two tothree years, as they generate slower-than-expected growth (3-8%) and below-average profitability.
Risks Currency exposure (mainly US dollar: a US$0.01/€ change has a €1m impact on REBIT) and stiffcompetition from Asian manufacturers, which putspricing pressure on Barco.
SWOT Strengths World-leading position in various high-margin nichedisplay markets. In-depth technology know-how maintains competitive edge, enabling high-quality products to be sold at a premium
Weaknesses US$ exposure (45% of the business is in US$ for which there is a 70% natural hedge with costs in dollars). Complex structure with limited cross-unit synergies
Opportunities High growth potential in China in control rooms. Highgrowth potential for digital cinema unit. Strong growthexpected in medical, media and events units
Threats Increasing competition from Asian manufacturers invarious segments
Befimmo boasts an ultra-low risk profile (government-like tenants generate 64% of rents, high duration of leases,moderate and hedged indebtedness). Despite its relative outperformance YTD, Befimmo shows attractive multiples.
Investment thesis
FY06/07 results were solid with net current EPS at €4.68, ahead of market expectations and down a mere 1.9% despite the dilutive effect of the summer capital increase.
However, these figures are overshadowed by sharply lower earnings guidance with FY07/08 CFPS guidance (close to net current EPS figures) down to €3.79 vs €4.15 previously. The stock reacted negatively before recouping most losses.
These lower projections merely bring previously unrealistic guidance back to reality. The two main factors behind the lower company guidance (higher interest rates and Extension Justice renovation ahead of schedule) were already well known and duly integrated into our earnings scenario. There was no degradation of the underlying business whatsoever.
Hence, we recently slightly reduced our FY07/08F EPS (down 5 euro cents to €3.75) and marginally raised our FY08/09F and FY09/10F EPS to €4.25 (up 6 euro cents) and €4.37 (up 6 euro cents), respectively.
Key newsflow
Since the acquisition in December 2006 of Fedimmo and the capital increase last summer, we do not expect important events in the near future as we believe Befimmo will focus on unglamorous hard work such as current refurbishments, filling some vacant buildings and selling some non-strategic assets. The latter includes small semi-industrial properties and office premises in the beleaguered Brussels periphery. These disposals were close to completion, but the purchaser allegedly lost its financial backing.
Valuation
Despite very cautious assumptions (beta slightly up, market risk premium at 5.0%), our DCF-based target price stands at €84 per share. A comparison with Cofinimmo shows that, despite the consistent outperformance of Befimmo, both shares show similar multiples. Admittedly, the slightly higher (gross) dividend yield is obtained with a very high payout but despite the communications glitches, Befimmo retains a very low risk profile vs. the more dynamic Cofinimmo and most listed property shares across Europe.
In the current nervous market context, we like the ultra-low risk profile of Befimmo despite the recent communications problems. _
Main shareholders (%) Fortis group 16.2
Share data No. of shares (m) 13.1Daily turnover (shares) 10,827Free float (%) 83.8Enterprise value (€m) 1,843.0Market cap (€m) 949.0
Newsflow
Date Description
28 Feb 2008 1Q trading update 22 May 2008 1H results 28 August 2008 3Q trading update 18 Nov 2008 FY07/08 results
Company profile Listed in 1995, Befimmo was the first closed-end property investment company established under theSICAFI/V-BEVAK legislation (ex-ServiceFlats). Assetsconsisted mainly of properties formerly held byBernheim-Comofi (now part of Fortis), which, asstatutory manager, retains managing control ofBefimmo despite the dilution of its stake. In 2001, Befimmo merged with Cibix, resulting in furthermarginalisation of non-office assets and a higher weightof offices in central Brussels versus the Brusselsperiphery, not a bad thing as the latter continues tosuffer in the current economic context. Since theacquisition of the Poelaert building (December 2003), a14,000m2 office building fully leased to the Belgian statefor 18 years, no new acquisitions have taken place,reflecting the lack of investment opportunities. However,Befimmo has not been idle; several important issueswere addressed recently such as the disposal of non-strategic assets (Charleroi), the sale of the hugeBorschette conference centre and an agreement on theallegedly asbestos-plagued WTC building (the statetook over the Belgian Post’s lease and extended it untilend-2018). With a vacancy rate above 25%, the Shellbuilding remains the main challenge in the short term.
Strategy As a registered SICAFI, Befimmo’s sole activity is theactive management of a property portfolio. Its assets consist mainly of office premises located in/aroundBrussels. A main feature of the portfolio is its low riskprofile, epitomised by the high weight of government-like tenants (64% of rental income), the relatively lowcontribution of decentralised and periphery Brusselslocations and the high rental duration (total duration ofnine years). It also holds hi-tech and semi-industrial buildings in Brussels and other attractive areas(Brussels-Antwerp axis). Given the lack of suitableinvestment opportunities, the company recently hinted itmight expand abroad, albeit only for a small portion ofits portfolio.
Risks Market risk: Befimmo is mainly exposed to the Brusselsoffice market, but this risk is mitigated by long-term leases and top tenants. Interest rate risk: most of the financial debt is at floatingrates, but a sizeable part is hedged.
SWOT Strengths High quality & low risk portfolio. Including Fedimmo,close to 66% of rents come from public administrations Good liquidity given the larger market cap. & free float Attractive SICAFI regime offering tax transparency
Weaknesses Uninspiring conservatism vs buzzing Cofinimmo
Opportunities Investment potential from the higher indebtedness legal ceiling but there is a lack of investment opportunities Gradually improving Brussels office rental market Expansion in Luxembourg Efficiency gains from the Fedimmo acquisition
Threats Lack of suitable investment opportunities; the companyis not willing to diversify away from officesDiversification abroad is both risky and time-consuming Rising interest rates although mitigated by hedging
Bekaert’s capex plan confirms its commitment to its long-term strategy: focusing on its core activities in growth areas(eg, China, Latin America and India), while aiming for higher profitability and shareholder value (through share buybacks).
Investment thesis
We consider Bekaert a solid long-term investment, backed by its strategy to build, ahead of its competitors, a worldwide platform in (growth) areas such as China, Latin America, Central Europe, India and Russia. Besides this first-mover advantage, we believe Bekaert will remain a leading worldwide player thanks to its other fundamental strengths: strong worldwide market shares, leading technology, focus on quality and a geographically well balanced manufacturing platform. We rate Bekaert a BUY, with a €108 TP (backed by our DCF valuation pointing to €112).
Key newsflow
Bekaert will continue to invest in growth areas. In 2007F, it has invested c.€100m in China so as to keep pace with the (high) market growth (c.20%). By the end of 2007F, Bekaert’s steel cord capacity should reach 250,000 tonnes and, in our view, it will be increased further in 2008F.
In October, Bekaert ended its (slowly and difficultly evolving) takeover talks with Uralkord, the leading Russian steel cord manufacturer (c.25% market share). Bekaert will supply the Russian market via its Slovakian plant. We consider this the right choice: it will only delay growth into this market, which is much smaller and growing at a slower pace than the Chinese one anyway.
3Q07 sales and the outlook statement (management expects “to maintain its revenue growth in 2007” – which seems to us to mean that the current YTD growth of 5.6% will persist in 4Q07) were, in our view, reassuring. US market conditions remain challenging, notably in the automotive, building and agricultural sectors. In Latin America, the competitive environment should improve somewhat. We believe Bekaert should be able to slightly further strengthen its gross margin, basically as its geographical sales mix moves increasingly to growth (higher-margin) markets such as China and as the company proactively assesses the need for scaling down capacity in mature (lower-margin) markets such as the US and Western Europe. As such, Bekaert should also attain a more efficient usage of capacity.
Valuation
Bekaert’s shares trade at a c.15% discount to the median for Belgian small & mid-caps in terms of 2007-09F PER, adjusted EV/EBIT and adjusted EV/EBITDA (adjusted for the sizeable contribution of Latin American equity affiliates). A limited discount is understandable as Bekaert’s business is to a certain extent cyclical, but the company’s orientation to growth markets should be able to nearly outbalance this effect. As such, we see the current share price level as a buying opportunity. _
Main shareholders (%) Acting jointly St. Adm.kantoor Bekaert 46.3
Share data No. of shares (m) 19.9Daily turnover (shares) 41,685Free float (%) 53.7Enterprise value (€m) 2,382.6Market cap (€m) 1,800.6
Newsflow
Date Description
15 Feb 2008 4Q07 trading update 14 Mar 2008 2H07 results
Company profile Overview Bekaert produces and markets a range of products based on metal-forming and coating technologies.Incorporated in 1880, it has evolved from a smallmanufacturing and trading company into a globalgroup. Internationalisation began in the 1920s inWestern Europe, then in Latin America and, since the1970s, in North America and Asia. In January 2005, itdivested its European fencing systems operations.
Advanced wire products (83% of 2006 sales) This is the company’s main division, grouping togetherthe wire and steel cord activities. Bekaert producesmainly for the automotive and construction sectors. Itsproduct range includes industrial spring wire, flexiblehose reinforcement wire, plastic-coated specialities andchampagne cork wire. Bekaert’s steel cord activities aremainly linked to tyre reinforcement (tyre cord and beadwire).
Advanced materials (7%) This division is focused on specific innovative industrialproducts in less cyclical markets (fibre technologies andcombustion technologies).
Advanced coatings (6%) Bekaert is specialised in sputtering, a high-end processin which a coating is deposited on a substrate undervacuum. Applications include diamond-like coatings(eg, used in DVD production) and specialised windowfilms (for solar control and safety enhancement).
Geographical breakdown of combined sales (2006) Europe 32%, Latin America 35%, US 18%, Asia 13%,ROW 2%.
Risks Bekaert’s business model is sensitive to economiccycles (at a global level), to US$ weakness (comparedwith the euro) and could suffer from raw material (wirerod) price increases when the economic climateweakens, as this would lower the company’s pricingpower.
SWOT Strengths Strong worldwide market shares, eg, for steel cord used in tyre reinforcement Recent restructuring has produced a leaner, more profit-oriented company
Weaknesses Cyclical nature of the business Ongoing need to streamline its operations in maturemarkets High capex requirements, limiting free cash flowgeneration
Opportunities Investments in fast-growing markets such as China,Russia, bringing its sales exposure to BRIC countries atc.50%
Threats Margin pressure due to rising wire rod prices andenergy costs US dollar sensitivity
After a series of disappointing results and a simultaneousshare price decline, BESI trades close to our longstanding €3.50 target price. While we believe that earnings risksremain unabated, we recently upgraded our rating from Sellto HOLD as further downside risk looks relatively modest.
Investment thesis
In October, BESI reported a net loss for 3Q07 of €2.7m on the back of 12.9% sequentially lower sales of €35.9m. Excluding one-off charges, the gross margin was relatively steady at 36% and the bottom line would have been a net loss of €2.0m, a touch better than we expected after the 7 October revenue warning. However, more importantly, new order bookings were down 20.7% sequentially at €33.4m.
BESI expects revenues and orders in 4Q07 to increase by 10-15% sequentially, although the company says it is difficult to predict any general industry direction at present. Furthermore, BESI is guiding for a pro forma gross margin range of 35-37%, while pro forma opex is expected to increase by 3-4% from the 3Q07 level.
Key newsflow
Newsflow has usually centred on BESI’s quarterly earnings releases, and hence we do not expect any major material news until the publication of the 4Q07 results in February 2008.
Valuation
Following the 3Q07 results, we again decreased our EPS estimates. After a series of disappointing results – the company posted losses in the June and September quarters – and a simultaneous share price decline, our longstanding €3.50 target price has been reached. While we believe that earnings risks remain unabated, we are upgrading our rating on the stock from Sell to HOLD as further downside risk looks relatively modest. Our unchanged, DCF-based target price of €3.50 implies a fair value multiple of c.12x 2008F EV/EBIT.
We see few catalysts ahead for the share price, while we believe competition remains fierce in the back-end semiconductor equipment market. BESI competes with a number of competitors that have a lower (Asian-based) cost base. Hence, we fear that the company is unlikely to outperform. _
Main shareholders (%) Fidelity 9.9Schneider Capital 6.1Lindenbergh 5.7Darlin 5.6
Share data No. of shares (m) 32.6Daily turnover (shares) 48,944Free float (%) 100.0Enterprise value (€m) 96.8Market cap (€m) 120.7
Newsflow
Date Description
Feb 2008 4Q07 results Apr 2008 1Q08 results Jul 2008 2Q08 results Oct 2008 3Q08 results
Share price performance
3.0
3.5
4.0
4.5
5.0
5.5
6.0
12/05 6/06 12/06 6/07 12/07PriceAEX All Share (rebased)
Company profile Overview BESI is a manufacturer of semiconductor packaging,plating and die handling equipment for both lead-frame and array connect applications. The company designsand manufactures high-performance equipment andintegrated systems for the semiconductor industry’sassembly process operations. The equipment is used principally to producesemiconductor packages, which provide the electronicinterface and physical connection between the chip andother electronic components, and protect the chip fromthe external environment. BESI operates primarilythrough four wholly owned divisions. In 2004, BESIacquired Datacon, a global manufacturer of flip chipbonding, multi-chip die bonding and other relatedassembly equipment.
Products The moulding division provides Fico automatedmoulding systems. The trim and form division providesFico trim and form systems. The plating divisionprovides Meco plating and singulation systems. The diehandling division, combining the former RD automation and Laurier subsidiary, provides RDA flip chip dieattach systems and Laurier automated die sortingsystems.
Customers BESI’s customers are leading US, European and Asiansemiconductor manufacturers and assemblysubcontractors, and include Agere, Amkor, ASE,Conexant, IBM, Infineon, Intel, Lucent, Micron, Motorolaand NXP.
Risk factors The main risks to our estimates, TP and rating include apossible over- or underestimation of the strength of thesemiconductor equipment market in 2008F and thepossibility of BESI’s restructuring efforts coming throughworse or better than expected.
SWOT Strengths High quality product offering Strong Flip Chip position
Weaknesses Lack of scale Lagging competition in terms of cost-efficiency
Opportunities Cost reductions via Asian sourcing and assembly RFID product
With the recent financial markets turbulence, some cloudshave appeared over consumers. We therefore forecast just1% like-for-like growth for Beter Bed in 2008. Cash flowgenerative power is strong, offering room for rapid andprofitable expansion, a high dividend and share buybacks.
Investment thesis
We believe turbulence in the financial markets is having an impact on consumer confidence, leading to delays in sales of big-ticket items such as bedroom furniture. We therefore have only 1% like-for-like growth in our Beter Bed model for 2008, followed by 2% for 2009. In our opinion the weakening market conditions are already reflected in the share price and we believe the long-term story is still positive:
(1) Greatly reduced cost base: Since the last downturn in 2002, average costs per store have decreased by close to 20%. The company recently increased its two-year EBIT margin target from 10% to 12.5%. In our model, we have a 2009F EBIT margin of 12.8% as we see residual scope to improve profitability of various formats.
(2) Ample room for rapid and profitable expansion: We expect Beter Bed to continue to open 50-60 stores per year. Expansion is mainly focused on Matratzen Concord, as start-up costs are relatively low and stores contribute to profit almost immediately. The company also has ambitious growth plans for its activities in Spain with expansion into Madrid. New countries on the agenda include Belgium and Poland.
(3) Strong management team with a clear strategy: With extensive experience in non-food retailing, management is on top of operations.
(4) Healthy cash flow generative power: Beter Bed has a debt-free balance sheet with strong cash flow generative power (free cash flow yield of 10-12%). Therefore, along with a high dividend and share buybacks, we would not rule out an acquisition if the price is right.
Key newsflow
Focus is on the release of 2007 figures and outlook. Beter Bed has guided for 2007 net profit of €29m, implying flat results in 4Q07. Our estimates are slightly above company guidance at €30.2m. Considering the financial markets turbulence and consequent lower consumer confidence, we have reduced our EPS estimates from €1.46 to €1.41 for 2007 and from €1.87 to €1.70 for 2008 based on like-for-like growth of 1% that year.
Valuation
Our DCF valuation gives a fair value of close to €26.00. Based on our new estimates, we set our target price at €25.00, implying a 2008F PER of 15x, which is in line with the historical average and at a 15% discount to Beter Bed’s peer group of non-food retailers. In addition, the stock has an attractive dividend yield of 6.2%. _
Main shareholders (%) Breedinvest 13Delta Deelnemingen 12Kempen 11
Share data No. of shares (m) 21.3Daily turnover (shares) 24,672Free float (%) 40.0Enterprise value (€m) 377.5Market cap (€m) 386.7
Newsflow
Date Description
18 Jan 2008 Sales figures 2007 14 March 2008 FY07 figures
Share price performance
10
15
20
25
30
12/05 6/06 12/06 6/07 12/07PriceAEX All Share (rebased)
Company profile Beter Bed is active in the European market for bedroomfurniture and has market-leading positions in Germanyand the Netherlands. Its activities consist of a retail operation that has around900 stores across a number of chains: Beter Bed(active in the Netherlands with 81 stores), MatratzenConcord (in the Netherlands, Germany, Austria andSwitzerland with 743 stores) and Beddenreus (in theNetherlands with 28 stores). In addition, the companyhas 34 stores in Spain. Beter Bed is also active in thewholesale market for branded products in the bedroomsector in the Netherlands and Germany. Its strategy isbased on growth by international expansion, like-for-like growth, branding and possible acquisitions. Beter Bed’s objectives are to improve net profit under current adverse market conditions and position thecompany to benefit from a market recovery. Its policy isbased on: (1) increasing sales through promotions andnew products; (2) improving the gross margin; (3)reducing costs per store; and (4) maintaining profitable expansion.
Risks Risks to our investment case include a weakening ofthe economy and declining consumer confidence.
SWOT Strengths Market-leading positions in the Netherlands andGermany Very strong focused hands-on management team Strongly reduced cost levels and high operationalleverage Strong balance sheet
Weaknesses Increased competition in Germany
Opportunities As a result of difficult market conditions, the number ofcompetitors is declining Expansion of the store base in Germany and Spain
Threats Deterioration of retail climate in the Netherlands andGermany
Following the successful completion of the rights issue, wemaintain our BUY rating on BinckBank. Our ex-rights target price is €13.3 (€18.1 pre-rights). In our view, commercialmomentum remains strong as equity market volatility shouldresult in record transaction volumes.
Investment thesis
The acquisition of market leader Alex brings BinckBank an unparallel scale advantage in the Dutch online brokerage market. Both companies are pioneers in this market with impressive track records with respect to client growth and value creation. The acquisition brings BinckBank the unique opportunity and resources to transform itself from a single-product-focused company to a provider of financial services with ambitions on a European scale. Teaming up with Alex will provide the financial resources and product suite to accelerate the international growth strategy. The combined business activities are all about operating leverage. With a relatively fixed cost base, online brokerage is a platform business (high operating gearing). The increased scale from Alex results in substantial cost savings, boosting profit growth. Basically, each new client added to the platform immediately created value as the incremental revenues clearly exceed the (acquisition) costs. We forecast revenue growth to outpace cost growth by a wide margin over 2007-10 (9% vs 1.5%). The high operating leverage results in continued lower cost-to-income ratios. Without the Alex transaction, the C/I ratio would have been 900bp higher on average. We forecast CAGRs of 15.2% in pre-tax profit and 12.7% in adjusted EPS over 2007-10F (from a 2007 pro forma basis).
Key newsflow
BinckBank will publish its 4Q07 results on 3 March. As in 3Q07, we expect it to report a strong set of numbers, mainly driven by the positive impact of market volatility on transaction numbers (a record level in 3Q07). We do not believe the acquisition of Alex has hampered the commercial activities during 4Q07.
Valuation
We value BinckBank using a DCF methodology and reach a standalone fair value of €13.3 (ex-rights). Including Alex, BinckBank is trading at an undemanding 2008F PER of 10.6x and a PBT multiple of 9.0x, discounts of 39% and 26% respectively, to the peer group (weighted). Multiple comparison are of somewhat limited relevance in this relatively young industry, given companies’ different stages of development, distorting effects from tax-loss carry forwards and differences in business models (product offering). Nevertheless, the difference in multiples is striking when taking into account BinckBank’s net and pre-tax margins, which are among the highest in the industry and defendable. Following the acquisition, its pre-tax margin is in excess of 50%, 12ppt higher on average than those of its direct peers. _
Main shareholders (%) Friesland Bank 15Boron Investments 10J Kluft 6Robeco 2
Share data No. of shares (m) 77.2Daily turnover (shares) 213,731Free float (%) 63.5BVPS (€) 6.3Market cap (€m) 769.9
Newsflow
Date Description
3 March 2008 2007 results 6 May 2008 1Q08 results 6 May 2008 AGM 25 July 2008 1H08 results
Share price performance
6789
1011121314
12/05 6/06 12/06 6/07 12/07PriceAEX All Share (rebased)
BinckBank is primarily active as an internet broker forprivate investors. In 2006, it achieved €47.1m inrevenues (excluding the divested and to-be-divested trading activities), the bulk of which was generated inthe Netherlands. The company is also active in Belgiumand plans to start operating in France in mid-2008. It recently acquired the market leader in online brokeragein the Netherlands, Alex, for a cash consideration of€390m. This adds 100,000 retail clients. BinckBank'soperations are split into two business units.
Retail (FY06: 83% of sales, 90% of PBT) Within the retail business unit, BinckBank operates asan internet broker for private investors, via a websitethrough which clients can invest in all the major stockexchanges. At 9M07, retail boasted 66,900 accounts(2006: 48,700), of which 55,500 (2006: 43,500) were in the Netherlands. In addition, BinckBank launched in theBelgian market in March 2006, where it had 11,400clients at end-3Q07 (2006: 5,200).
Professional services (17% of sales, 10% of PBT) This business unit provides banking and securitiesorder execution services for professional clients (ie,independent asset managers and stockbrokers). Thisdivision is now also focusing on the completeoutsourcing of securities-related processes of smallbanks. At 9M07, professional services had 6,900 clients(2006: 5,400).
Risks (1) Potential launch of new competition in its homemarket, (2) Reversal of the positive stock marketclimate, (3) integration risk of Alex.
SWOT Strengths State-of-the-art website Efficient cost structure Clear market leader in the Netherlands
Weaknesses Limited experience outside its home market Need for more recurring income
Opportunities Expansion abroad (France in mid-2008) Exploiting Alex’s broader product offering MiFID might result in lower transaction costs Further sector consolidation
Threats Potential launch of new competition in its home market Reversal of the positive stock market climate Integration of Alex (seen low) Traditional banks improving product offering/pricing.
Financials
Yr to Dec 2006 2007F 2008F 2009F
Income statement (€m)
Net interest income 10.4 17.1 50.4 54.2Net fees and commissions 35.8 45.1 109.3 118.9Trading profit 0.0 0.0 0.0 0.0Insurance profit 0.0 0.0 0.0 0.0Other operating income 0.9 4.9 5.9 6.4Total income 47.1 67.1 165.6 179.5% of average total assets 0.1 0.0 0.1 0.1Total operating costs (18.9) (31.1) (79.9) (78.3)% of average total assets 0.0 0.0 0.0 0.0% of total income 0.4 0.5 0.5 0.4Net operating income 28.2 35.9 85.7 101.2Provisions 0.0 0.0 0.0 0.0Operating profit 28.2 35.9 85.7 101.2Associates 0.0 0.0 0.0 0.0Capital gains, etc 0.0 0.0 0.0 0.0Pre-tax profit 28.2 35.9 85.7 101.2Tax (4.9) (4.6) (13.0) (16.0)% tax rate 0.2 0.1 0.2 0.2Minorities 0.0 0.0 0.0 0.0Extraordinary & other items 0.0 0.0 0.0 0.0Earnings 23.3 31.3 72.7 85.2Amortisation of goodwill & other adj. 0.0 0.1 31.8 31.8Net income after amortisation of goodwill 23.3 31.2 40.9 53.3
Forecasts and ratios (€m)
Total income 47.1 67.1 165.6 179.5
Net operating income 28.2 35.9 85.7 101.2Net income 23.3 31.2 40.9 53.3Adj EPS (€) 0.55 0.74 0.94 1.10DPS (€) 0.29 0.37 0.40 0.44Adj PER (x) 18.1 13.4 10.6 9.0Dividend yield (%) 2.9 3.7 4.0 4.4P/BVPS (x) 5.9 1.6 1.6 1.5
Balance sheet (€m)
Total assets 620.3 3,128.10 3,276.10 3,433.70Customer loans 212.4 1,042.50 1,095.50 1,149.60% of total assets 34 33 33 33Other interest-earning assets 342.7 1,622.10 1,746.80 1,880.20Customer deposits 383.4 1,895.50 1,971.90 2,043.70% of total assets 62 61 60 60Other interest-bearing liabilities 164.7 749.6 749.6 749.6Shareholders’ funds 71.7 482.6 487.0 497.7
Source: Company data, ING estimates
106
Benelux small & mid caps January 2008
Maintained
Boskalis BuyConstruction & building materials Netherlands
Boskalis is in a first-rate position to benefit from the vast global demand for dredging projects, in a market where basically all dredging equipment is busy and based on the industry’s order book, is busy for the next three years. We believe this will result in further margin expansion, BUY.
Investment thesis
Boskalis offers an attractive investment opportunity because of the following: 1) Strong global demand for dredging equipment, driven by several LT growth drivers such as increased global sea trade, growing global energy consumption, increased tourism, high demand for raw materials and climate change. All of these drivers trigger investments in harbour facilities and maritime infrastructure. 2) The global dredging market is an oligopoly dominated by four Benelux companies, which we estimate has an order book of €17bn, covering an estimated 2007F sales level by c.2.8x, providing excellent visibility. 3) With fleet utilisation rates close to 100% we expect clients to pay higher rates for the next generation of dredging projects 4) On the supply side we see many fleet expansion programmes, but due to long lead times on critical parts only gradual capacity additions 5) Many more projects remain on the global agenda. Apart from these very attractive market characteristics, we would also stress that Boskalis won three LNG-related projects during 2007, projects for which we believe customers are willing to pay an extra petrol dollar in order to get the maritime infrastructure ready as soon as possible. Price increases are driven by the current favourable supply/demand relationship, expensive new equipment coming on steam and the vitality of many of these investments in trade and energy. Assuming flawless project execution we expect Boskalis to increase net profit by 25% in 2008F based on a clean comparison base(excluding positive one-offs reported in 2007) after net profit increased by 86% in 2006 and a likely increase of 70% in 2007F.
Key newsflow
Although forecasting timetables for tender procedures and actual awards of large dredging contracts is difficult, we expect ongoing news flow regarding new projects being undertaken around the world. Particularly adding to the positive sentiment are the investment plans of the oil & gas industry, as well as government spending on large trade-related projects.
Valuation The stock trades at 8.8x 2008F EV/EBITDA and 7.9x in 2009F, the latter matches with its previous peak multiple. Comparing the current market situation to previous upturns (Hong Kong airfield and Singapore land reclamation projects) understates the present market dynamics. Given the splendid visibility we feel comfortable with our €49 DCF-based TP which suggests a target 2009F EV/EBITDA of 9.5x Note Boskalis’ order book is likely to end close to €3.5bn at year-end (order book mid year was €2.7bn and the 2H07 order intake press release including Maasvlakte II already reached €1.35bn). We reiterate our BUY recommendation. _
Main shareholders (%) HAL Trust 31.7Aviva 6.6Sprucegrove IM 4.9
Share data No. of shares (m) 86.4Daily turnover (shares) 251,382Free float (%) 63.0Enterprise value (€m) 3,418.3Market cap (€m) 3,563.2
Newsflow
Date Description
Early January 2008 New Year Speech 19-03-2008 FY07F results 15-05-2008 AGM 21-08-2008 1H08F results
Share price performance
15
20
25
30
35
40
45
12/05 6/06 12/06 6/07 12/07PriceAEX All Share (rebased)
Company profile Overview Royal Boskalis Westminster is an international dredgingcompany active in maritime infrastructure in more than 50 countries across five continents. Its core activitiesinclude the construction and maintenance of harboursand waterways, the creation of land in water, andcoastal defence and riverbank protection. It alsooperates in numerous home markets in a range of related activities. Boskalis generated €1.3bn of sales in 2006 andreported net earnings of €128m. After a very difficult2004, the recovery of the demand side of theinternational dredging market finally arrived in 2005 andpushed ahead strongly during 2006 and 2007. Boskalis benefited from several long-term growth drivers such asincreasing world trade, growing world population,growth in tourism and the boom in global energymarkets. These developments supported a healthydemand for harbour extension, waterway deepening,land reclamation, beach replenishment and coastaldefence projects. After two years of buoyant market conditions Boskalisorder book is now well filled with healthy pricedcontracts and we expect the company to continue itsselective tendering approach which should pushmargins going forward. The market outlook has neverbeen as strong as it is today, we believe the number ofpending projects in the international hit-and-run marketprovides splendid visibility of at least five years ahead.Given the already high fleet utilisation rate, a capacityshortage could present itself once more large projectshit the marketplace. No longer the halted massive landreclamation projects in Singapore determines the stateof the market but numerous mammoth dredgingprojects all around the globe support strong growth.Particularly the Middle East area is expected to landmany large LNG and harbour expansion relatedprojects, but other examples are the extension of thePanama Canal. All this should be in favour of thedemand-supply relationship as fleet investmentprogrammes are adding capacity only moderately in ourview.
Risk factors Most relevant risk factors 1) Operational risks (projectbased business model) 2) Stability of certain areas(Middle East) 3) Geopolitical risks (Singapore versusMalaysia and Indonesia) 3) Oil price.
SWOT Strengths Large and versatile fleet Selective tender strategy
Weaknesses Fleet expansion delayed due to limited shipyard space Global GDP spending is a key driver of business model
Opportunities Pending investments in energy and trade related infra Local presence in the ME (Lamnalco and Archirodon)
Threats Operational risks increase as projects become bigger Oil price, stability of ME region, environmental issues
Brunel enjoys the most favourable mix in the sector, being a100% specialist firm with exposure to Germany and thebooming Energy sector. In our mid-cycle dip scenario and hence entering the late-cycle we prefer specialist staffers.Downside is protected by the possibility of a takeover; BUY
Investment thesis
We reiterate our BUY rating on Brunel as the growth it offers is among the highest in the sector due to its favourable geographical and segmental exposure. Brunel generates c.20% of sales from Germany and generates c.52% of its sales from the Energy sector, which is booming and showing significant demand for labour. Now, later in the cycle, specialist staffing is outperforming general staffing. Brunel, a 100% specialist, has therefore the best mix in the sector. Another argument in favour of Brunel is pricing and permanent placement. In particular the high-end professional segment offers strong pricing power now that scarcity is increasing to more critical levels from which we expect Brunel to benefit. Besides this, margins should be supported from permanent placement as seen already in 1H07. The risk is that scarcity gets to a level that pricing can no longer compensate for, which does not yet seem to be the case according to industry players.
Takeover/break-up value remains attractive. A couple of months ago we believed that the takeover argument was no longer valid due to the credit crunch and Jan Brand’s (63% shareholding) apparent unwillingness to sell. However, the latest consolidation in the sector may have re-opened this window, and Brand may view this as ‘now or never’ in this cycle. The rationale for a break-up/sale is clear, given the lack of synergies between the three main divisions (NL, Germany and Energy), and that there are many potentially interested buyers; as all staffers want to expand into specialist staffing. The main obstacle could be the price as we believe any takeover bid should be around €30 which is roughly a 60% premium (as seen at Vedior), but would imply a higher take-out multiple of 10-11x 2008F EV/EBITDA (c.8.3x for Vedior).
The FY07 guidance of an EBIT of €50m seems safe, having been raised three times (latest in Q3).
Return of cash to shareholders: we believe Brunel should start to return cash to shareholders as cash flow is improving due to better working-capital management. A special dividend has been discussed before and could become a reality. We think Brunel could easily return €25m or c.€1 p/s.
Valuation
Brunel valuation looks attractive trading at a c.5% discount to the sector at5.2x 2008F EV/EBITDA, particularly given Brunel’s favourable mix and raised takeover possibility. In addition, the sector looks cheap in our mid-cycle dip scenario and given our preference for specialist staffers Brunel offers good upward potential. Our TP is based on an 8.2x 2008F EV/EBITDA, ie, in line with the sector.
Main shareholders (%) Mr J Brand 63
Share data No. of shares (m) 22.7Daily turnover (shares) 45,273Free float (%) 34.3Enterprise value (€m) 315.0Market cap (€m) 367.4
Newsflow
Date Description
08 May 2007 Adecco 1Q07 results 15 May 2007 ABU figures period 4 24 May 2007 Brunel Q1 trading
update 12 June 2007 ABU figures period 5
Share price performance
10
15
20
25
30
35
12/05 6/06 12/06 6/07 12/07PriceAEX All Share (rebased)
Company profile History Brunel was founded in 1975. The company is a 100%specialist staffing company, specialised in engineering,ICT, finance, legal, insurance and banking. Brunel isactive in the Netherlands, Germany, Belgium, Canadaand worldwide in the energy sector. The free float iscurrently 39%, while founder, Mr Jan Brand, owns 63%.
Brunel Netherlands The Netherlands represents c.23% of revenues withc.50% from engineering, 20% from ICT, c.20% fromlegal and finance and 10% from, among others,insurance and banking.
Brunel Germany In Germany, Brunel has 38 branches and generates21% of sales, completely focused on the engineeringsegment.
Brunel energy This division represents 51% of revenues and providestemporary workers on a project base to companiesactive in the exploration of oil and gas (the oil majorslike Exxon Mobile). Brunel is the No.1 player worldwideand has a presence in, among others, Asia, Canada,Western Africa, Australia, Europe, Moscow, andKazakhstan.
Other activities Other activities comprises Belgium, which consists ofc.80% ICT and c.20% engineering, and the branches inCanada. In Canada, Brunel focuses on variousspecialities of which the automotive sector is the mostimportant.
Risks Economic slowdown in the Netherlands and Germany.Project risks and US dollar exchange rate in energy.Small management team.
SWOT Strengths 100% specialist staffing company 50% exposure to NL and Germany mainly inengineering and 50% exposure to booming Energysector Market leader in global Energy sector Highest margins in the sector
Weaknesses Depth of management Cash flow and working capital management Company has little diversification Margins and lack of bargaining power in Energy divisionvs large oil majors
Opportunities Should benefit from labour shortages in specialistfunctions and in Energy sector by raising prices Benefit from increased scarcity for professional labour Create value through break-up of the company
Threats Energy division dependent on large contracts with oilmajors Vulnerable in downturn for idle time due to largeproportion of fixed contracts Increasing competition in specialist staffing
CFE remains undervalued, at a deep discount to dredging andconstruction peers, despite good fundamentals and idealpositioning for the large Benelux PPP projects. We expect supportive newsflow in 2008 and its high earnings visibilityshould overshadow its cyclical nature. BUY.
Investment thesis
We expect strong upside in CFE, driven by the value of its stake in DEME as well as its core construction activities, which is at the outset of a Benelux infrastructure boom. Peak earnings in dredging should be reached beyond 2010. Margins are rising and visibility is strong as demand remains buoyant with multiple drivers: (1) global trade and raw material transport (deepening of harbours for container ships); (2) energy markets (LNG terminals); (3) tourism (artificial islands in the Middle East); and (4) climate changes (shore protection). Finally, unlike previous dredging cycles, capacity is constrainedby shipyards and a ship engine bottleneck. CFE is (1) cheaper than Boskalis (BUY, TP €49) and (2) the second most exposed investment vehicle in dredging behind Boskalis.
The Belgian construction market is moving into what could become a very strong infrastructure-driven cycle, buoyed by four Benelux PPP projects that should be awarded within the next 12 months (Diabolo, which was launched recently as well as Oosterweel, Liefkenshoek tunnel and Coentunnel) and more to come thereafter (Josaphat tunnel and renovation of Belgian schools and prisons). CFE (through its consortiums) has been awarded the €0.3bn Diabolo railway project and is the preferred bidder for (1) the Oosterweel (€1.9bn Antwerp ring road project with a 35-year concession) and (2) the Coentunnel (€0.5bn). None of these projects are reflected in our estimates.
Key newsflow
Newsflow in dredging will relate to order intake. DEME’s current order book amounts to more than €2bn (1.6x sales). We also expect important newsflow regarding tender offers for the large infrastructure projects: Coentunnel (financial close by 1Q08), Oosterweel (contract finalised by 3Q08) and Liefkenshoek (BAFO to be announced by early 2008). Liquidity should be improved by the 20-for-1 stock split effective as from 1 January 2008.
Valuation
CFE trades at a deep discount to its peers. Our target price of €88 is based on a SOTP, with DEME valued at 8x 2008F EV/EBITDA (16% discount to our 9.5x target multiple for Boskalis) or €66 per CFE share. DEME’s implied value (using 5.5x for Construction, a 7% discount to Dutch peers) is 6.1x, a 36% discount to our target multiple for Boskalis. Further upside would come from exposure to large Benelux PPP projects, to which CFE is well positioned, but which are not included in our estimates. _
Main shareholders (%) Vinci 47.0
Share data No. of shares (m) 13.1Daily turnover (shares) 2,376.0Free float (%) 54.6Enterprise value (€m) 1,017.3Market cap (€m) 896.8
Newsflow
Date Description
27 Feb 2008 FY07 results 30 Apr 2008 AGM 29 Aug 2008 1H08 results
Company profile Overview Compagnie d'Entreprises (CFE) is focused on theconstruction industry (contracting and civil engineering)in the Benelux and Central Europe. CFE also owns a50% stake in DEME, a leading dredging companybased in Belgium. DEME is jointly controlled byAckermans & van Haaren, a Belgian listed investmentcompany. The stake is proportionally accounted inCFE's P&L.
Construction (54% of sales, 41% of EBIT) Although turnover of the construction businessamounted to €625m in 2006, representing 54% of thegroup, its low profitability means that it accounted forjust 41% of group EBIT. In the construction activity, weinclude CFE's traditional construction businesses (90%of divisional sales) in the Benelux and Central Europe(3%), electrical contracting/multi-technics (8%) and realestate/property development (4%). Geographic split ofsales for traditional construction (1H07): Belgium 63%,Luxembourg 10%, the Netherlands 6% and EasternEurope 21%.
Dredging (46% of sales, 59% of EBIT) Exposure to the dredging business is through the 50%stake in DEME, which manages a balanced productportfolio consisting of capital dredging (estimated 30%),maintenance dredging (25%), environmental business(15%), oil & gas (5%), and civil engineering and others(5%). Geographic split of sales: Europe 46%, MiddleEast 29%, Africa 9%, N & S America 7%, Asia 5% andOthers 4%.
SWOT Strengths Leadership position in the Belgian civil engineering and construction market Excellent fleet expansion programme at DEME, in amarket currently short of dredging capacity
Weaknesses Weak margins due to sub-optimal product mix Poor liquidity and limited visibility of the shares in themarket
Opportunities Unique exposure, through DEME, to booming dredgingmarket. CFE is the purest dredging play in Europe, afterindustry leader Boskalis (listed in the Netherlands) Growth opportunities through consolidation of Belgianconstruction market and encouraging prospects in thefield of large infrastructure projects in the Benelux CFE could grow in the concessions market backed byVinci's expertise in this more profitable and less cyclicalbusiness
Threats With Vinci as a shareholder, expansion outside the Belgian market could be limited to smaller andpotentially less profitable projects The tender process for large infrastructure projectsbegan in 2006. Competition is stiff and, despite CFE’sand its partners’ strengths, it is too early to assess thecompany’s chances of winning the bids. An eventualfailure would obviously affect the attractiveness of CFE.However, we have not included any of these largeprojects in our forecasts
CMB is well managed, with good positions in bulktransport, benefiting from current high rates. It is valued ata 10% discount to peers on P/NAV. We see it as attractivewithin the sector, with a 32% expected 12-month return.
Investment thesis
CMB is a first-class bulk carrier focusing on transporting iron ore and coal. It operates a fleet less than three years old, has one of the largest Capesize fleets in the world, and has an excellent record in asset play (the sale and purchase of ships). CMB has a strong balance sheet and 70-80% of its fleet income is covered at the beginning of each year. Its strategy is that it wishes to grow in the dry bulk trade with a continued emphasis on large dry bulk carriers and to make a decent return on its assets.
Having grown by an average 5% pa over the last three years, the dry bulk market should grow by 4% pa, assuming a backdrop of small worldwide GDP growth. In the coming years, we expect capacity supply on average to grow 1% faster than demand. The order book for Capesizes has increased to around 60% of the current fleet, but this capacity will not enter the market until 2010. Also, congestion of export harbours cannot be solved within a few years (train capacity) and high iron ore demand from Chinese still supports prices and will continue to do so.
The 2007 outlook is good, with EPS estimated by us to increase 72% excluding book gains to €4.0. For 2008, CMB has probably covered 95% of its fleet income by time charters at good to extreme good rates (eg, in November 2007, two 12-month contracts were fixed at US$170,000 vs around US$50,000 in 2006, adding €1.5 per share in 2008). For 2009, we expect EBITDA ex book gains to continue its upward trend due to the length of the current spot rate boom with time charter in the slipstream, while CMB benefits from a favourable mismatch between TC-ins and TC-outs.
Key news flow
On 24 January, CMB will report 2007 results and, we expect, issue a bullish 2008 outlook. Recent new buildings with early delivery and two favourable contracts, one for five and one for 10 years, should support CMB’s outlook. We expect the stock market to react positively to CMB newsflow.
Valuation
Owing to a hesitation in the Baltic Freight Index, CMB has recently outperformed its peers, which are more spot-driven while CMB is more defensive. Its adjusted P/NAV is now at a 10% discount to its peers. Any discount is unjustified for several reasons, eg, the young fleet, quality of the company and CMB’s risk/reward ratio and 8%+ dividend yield. All these elements make CMB one of our favourite Benelux small and mid-cap stocks. Our TP is €72, based on a P/NAV in line with its peers.
Main shareholders (%) Saverco 45.0Victrix 15.2
Share data No. of shares (m) 34.9Daily turnover (shares) 64,850Free float (%) 43.4Enterprise value (€m) 2,319.2Market cap (€m) 2,038.8
Company profile History/profile Until mid-2003, CMB was an independent shipping firmlisted on Euronext with tanker, dry bulk and LPG/LNGtransport activities. In June 2003, Exmar, representingthe LPG/LNG activities, was spun off from CMB. InDecember 2004, Euronav, representing the oil tankerinterests, was also spun off. CMB is now a pure bulkshipping firm generating revenues of €403m and netprofit of €137m.
Bocimar (2005: 89% of revenues, 96% of EBIT) Bocimar is a relatively large player in the market for drybulk, operating a large fleet of different types of bulkcarriers: Capesize (13 owned, 4 under construction, 7 chartered in), Panamax (2, 3, 3) and Handymax (3, 3,0) under the Bocimar flag. Bocimar is active in buyingand selling assets (ships).
Other activities (11%, 4%) Other CMB activities are grouped under CMB Holding.The largest activity is Hessenatie Logistics, whichpossesses and operates warehouses in Boom,Kampenhout, Vilvoorde and Kortrijk, all in Belgium.Through its 100% subsidiary IBO, Hessenatie Logisticsalso operates an inland container terminal at Vilvoorde.CMB Holding also has financial investments in shipbroking firm Clarkson’s (with an 18.5% interest) andPacific Basin, an operator of Handysize vessels. Otheractivities include a 50% stake in Reslea, a real estatefirm with property in Antwerp and in other cities. Through ACL Aviation, ACL Leasing and ACL Air – all 50/50 joint ventures with South Africa’s Safair – CMB is active in the aviation business.
Risks The main risk to our recommendation is a sharp declinein rates for the transportation of bulk goods worldwidedue to extra supply or a sharp decline in demand as aresult of lower economic growth especially in Chinawhile congestion in Australia disappears.
SWOT Strengths Strong successful commitment to bulk carrier segment Fleet less than three years old High coverage due to quality time charter contracts Clever buying and selling ships
Weaknesses Modest position in Panamax and Handymax segments Low market concentration leading to heavy competition
Opportunities Worldwide demand for Capesize above average Further strengthening of balance sheet by divesting on-core activities enabling growth in shipping
Threats High dependence on Chinese iron ore demand as wellas coal transport Competitors with deep pockets active in more segmentsresulting in more stable results Order book small at 30% of fleet but excessive supplystill possible in coming years
Brussels offices still show slow growth and scarceinvestment opportunities. Cofinimmo’s response has been a tight control on costs and active expansion into new areas. A higher 2007 dividend anticipates an earnings revival as from 2008.
Investment thesis
9M07 figures slightly below expectations: Excluding IAS 39 non-cash losses, the shortfall is lower than suggested by headline figures, with net current cash EPS up 8.0% at €6.05 vs our €6.53 estimate. Despite a strong occupancy, rental income remains disappointing.
Higher company guidance: The company announces for FY07 net current EPS at ‘at least’ €9.00 vs previous guidance of €8.03. These figures (including North Galaxy non-cash revaluation) remain below our estimates, showing the very conservative stance of the company.
We have raised our 2007 and 2008 EPS estimates further following the consolidation of Immobrew two months earlier than expected to €7.72 (+0.26) and €8.87 (+0.04), respectively. When computed as Cofinimmo (ie, incl. North Galaxy revaluations), these figures stand at €9.59 and €9.96, respectively.
Key newsflow
The company has been acquiring ‘creative’ property steadily, ie, not the ‘classic’ office buildings leased on a long-term basis such as Private & Public Partnerships (PPP), senior housing, office premises to be refurbished, the Immobrew portfolio or La Rasante. We believe Cofinimmo will continue to announce such acquisitions regularly. One particular transaction is the so-called ‘Flemish Schools’ PPP, but details and schedule remain elusive.
Note that despite their ‘exoticism’ away from offices, most of these acquisitions provide both a decent yield for long periods and interesting value creation potential.
The publication of the full-year results should not bring any big surprises; the main figures are already well anticipated.
Valuation
Our DCF-based target price stands at €143 on the back of sizeable and profitable disposals in 2007. Portfolio results (realised and unrealised capital gains) are actually higher than recurrent earnings in 2007.
The stock now shows attractive upside potential, but at current market prices we still prefer its arch-rival, Befimmo. _
Main shareholders (%) Dexia 8.6Allianz Group 4.8Bois Sauvage 4.4
Share data No. of shares (m) 9.9Daily turnover (shares) 16,562Free float (%) 86.0Enterprise value (€m) 2,362.5Market cap (€m) 1,266.4
Newsflow
Date Description
14 Feb. 2008 FY07 results 25 April 2008 AGM 15 May 2008 1Q results 29 July 2008 1H results
Cofinimmo is Belgium’s largest real estate play. Itmainly invests in offices but is gradually diversifying intonew asset classes. Established in 1983 by institutionalinvestors eager to pool property assets, the companygrew mainly through capital increases againstcontributions in kind and large operations (Primaedis,North Galaxy). Listed at end-1994, Cofinimmo became a SICAFI in 1996 after bringing indebtedness below the legalceiling. North Galaxy is an office complex in theBrussels CBD and is fully leased to the Belgian statesince completion (April 2005) until 2022. The presentvalue of future rents was sold, and the residual value ofthe building is included in the balance sheet. Cofinimmoreckons the operation will be earnings-enhancing from2006, but most of the impact will be non-cash (gradual‘reconstruction’ of the asset’s value). The Egmontproject, acquired in 2004, is also fully leased to thestate on a long-term basis; the operation was partlyfinanced by the issue of preferred shares, which offer acapped dividend. 2005-06 saw further acquisitions inBrussels and elsewhere (Mechelen, Antwerp) and anew partnership with nursing homes & seniorresidences manager Restel; two small assets wereacquired from Restel, but further growth will be slow asthe latter does not own most assets it manages.Important disposals were also signed at the end of2006, but no obvious reinvestment opportunities areavailable after failing to win the Fedimmo auction.
Strategy All operations are aimed at securing long-term cashflows at reasonable yields. This results in a clear focuson complex operations (less tempting to foreigninvestors) and low risk. The former may includeacquisitions of neglected but well located buildings orbespoke premises, while the latter explains the heavypresence of the Belgian state as a tenant (NorthGalaxy, Egmont) and the high weight of the BrusselsCBD. Almost 40% of the portfolio is leased to Belgian &international public administrations, often on a long-term basis. Cofinimmo enhances its bottom line withsophisticated financial solutions such as a systematichedging against higher interest rates, alternativefunding and complex deal structures. However, this canreduce overall group transparency.
Risk factors Market risk: Cofinimmo is mainly exposed to theBrussels office market. Interest rate risk: financial debt is mainly at short-term rates but a substantial part is hedged. Lack of sufficient investment opportunities in the currentcontext of low property yields.
SWOT Strengths High quality portfolio with low risk. Close to 40% ofrents come from public administrations Attractive SICAFI regime offering tax transparency. Active and inventive expansion policy…
Weaknesses … but sometimes hindering the overall transparency ofthe company
Opportunities Investment potential from the higher indebtedness legalceiling but lack of investment opportunities Gradually improving Brussels office rental market
Threats Lack of suitable investments despite diversification Rising interest rates, but mitigated by hedging
We have a BUY rating on this best-in-class, high-growth, high-margin, high-ROACE Belgian food and general retail group.Including dividend yield, our €185 target price provides a 12-month forecast total return of 15%.
Investment thesis
Colruyt combines a set of unparalleled characteristics that distinguish it from its peers, including best-in-class sales growth, EBIT margins and ROACE. Its net profit CAGR has been 15.8% over the past 15 years, and it has achieved a 7ppt market-share gain over the past eight years.
We rate Colruyt a BUY, as we foresee further high-single-digit organic sales growth, in combination with a sustainable 10% net profit growth outlook and a valuation that does not reflect its sound growth profile and high ROACE. With net cash of €356m at the end of September 2007, further expected share buybacks of at least €75-100m pa (€170m in 2007F) and a higher dividend payout ratio forecast, Colruyt offers an unparalleled investment opportunity.
We do not share market concerns over a marked slowdown in sales growth from 2007 onwards. Lately, the share’s performance has been hampered by these concerns together with fears over price competition and a supposed consumer spending slowdown in Belgium. Implicitly, we believe the market is wrong in applying a 5% sales growth rate. We believe the group will be able to grow by 7% pa thanks to a three-tier growth strategy: same-store sales, store openings and store enlargements. Regarding the Belgian market, Colruyt’s 1H07 results once more underlined its strength, even in a tougher environment, gaining share and achieving higher profits. We believe the outlook for 2H07 is excellent. We forecast 16.7% net profit growth after 8.5% growth in 1H07. 2H07 should benefit from an easier comparison base, a positive calendar impact in contrast to a negative one in 1H07 and a more normal weather pattern than in 1H07.
Key newsflow
On 30 November 2007, Colruyt reported much better-than-expected 1H07 results with 8% net profit growth, whereas we had expected a slight decrease due to all the ‘horror’ stories about increased competition and weather-affected margins in Belgium. Colruyt slightly raised its FY07 net profit forecast from €274m to €276m, but this new forecast seems very conservative as it implies only 2.5% growth in 2H07. The 3Q07 trading statement is due on 30 January 2008.
Valuation
The share currently trades at a 2008/09F EV/EBIT of 10.8x. Compared with peers, this is a discount of 3%. We believe a premium of 10-20% is warranted. _
Main shareholders (%) Colruyt family 47Sofina 6
Share data No. of shares (m) 31.6Daily turnover (shares) 59,992Free float (%) 52.6Enterprise value (€m) 4,795.4Market cap (€m) 5,174.6
Newsflow
Date Description
30 Jan 2008 3Q07 trading update 23 June 2008 FY07 results 28 July 2008 1Q08 sales 17 September 2008 AGM/Trading update
Company profile Description Colruyt is a state-of-the-art Belgian food retailer with aunique full-range discount concept. Stores have a ‘no-frills’ layout, enabling customers to shop quickly and atthe lowest prices, but offer the complete product mixusually available in supermarkets. Colruyt has achievedimpressive sales growth and profitability over the pastdecade with one of Europe's highest operating margins and return on capital employed.
Retail activities Colruyt is the No.2/3 food retailer in Belgium with amarket share of 21% in 2007 for its flagship Colruytbanner. This banner consists of 207 stores. Colruyt alsooperates 47 OKay, smaller supermarket stores, fourBio-Planet and 32 non-food Dreamland stores inBelgium. Through the acquisition of Ripotot in the mid-1990s, Colruyt also operates 45 supermarkets inFrance.
Wholesale Colruyt has wholesale activities in Belgium and France,eg, through the Spar network in Belgium and variousregional companies that service foodservice clients inFrance.
Risks These include changes in consumption trends,competitor actions, management decisions, operationalexecution. The main risk on the downside to our targetprice comes from Belgian sales growth opportunities, ie,the ability to open new locations/add new squaremetres. Potential lower growth would result in lowervaluation multiples.
SWOT Strengths Popular supermarket formula with a guarantee for lowest prices. Highly cash generative. Strong, family-oriented management team with a focus on costcontrol.
Weaknesses Lack of success with its operations in France. A notoptimal balance sheet with over €300m in net cash.
Opportunities Further market share gains in Belgium with the potentialto become market leader in 5-10 years. Expansion intoLuxembourg and the Netherlands.
Threats Lack of new site locations in Belgium for its flagshipColruyt banner.
We have a HOLD rating as we believe CXP has an above average risk profile given the combination of high exposure to the US and ongoing restructuring and we still see earningsdowngrade potential. Takeover speculation seems to belosing traction and we see no trigger for the short term.
Investment thesis
Corporate Express (CXP) is a leading player in the worldwide B2B distribution of office products and generates c.50% of sales from the US. We have a HOLD rating as we believe risk (high exposure to the weak US and ongoing restructuring in combination with earnings downgrade potential) and potential reward (take-out, low valuation, margin recovery potential) on current visibility balance out. Also, we believe that the takeover speculation of Staples possibly making a bid is losing some traction in the short term.
The risk of earnings downgrades remains, given further softening of US. We note that consensus EPS08F is still c.10% above INGF. We assume a mid-cycle dip scenario, ie, 0% sales growth for US and 4% for Europe. On the positive side, it seems that the US is stabilising after the restructuring issues in 4Q06 and seems to be back on market growth but the market seems to slow further. Currently CXP seems to win more contracts in the US than it loses, and the previously poor sales morale has improved to its best in five years. Europe is still holding up well with little evidence of slowing growth.
The change of CEO position and outcome of the strategic review in October, which actually revealed little change apart from more focus and better execution, leads us to believe that it will take some time to see evidence that CXP is heading in the right direction. Besides that we believe that the FY10 sales growth targets ie CAGR sales growth of 6% in order to reach a 7% EBITDA margin is too ambitious in the current economic environment.
In our view significant restructuring remains to be done; this adds to the risk profile. IT systems are being upgraded in Benelux (2007 finished), UK and Ireland (2008), and beyond 2008 in Germany. Also warehouses will be integrated in Germany (from four to one), Sweden (four to one in next the 18 months), Norway (three to one, almost done) and Australia from six to one. This will take at least three years to complete.
A recession scenario (6% sales drop and margin trough of 3.0% (FY07F: 3.9%) vs previous trough of 3.1% vs peak of 4.8%) combined with high financial leverage (2007F net debt/EBITDA is 3.0x) means that there is still significant downside risk to €2.2 (8x trough PER multiple)
Valuation
Currently CXP trades on the low-end cycle range at a 2008F PER of 10x and we see no short-term re-rating potential given the increased risk profile and earnings downgrade potential given further economic weakening. As such we lower our TP from €8 to €5.5 based on a c.10x PER target multiple. This represents a 20% discount to cyclical peers, eg, the staffing sector due to CXP’s higher risk profile._
Main shareholders (%) ING 10-25Fortis 5-10Kempen 5-10
Share data No. of shares (m) 182.0Daily turnover (shares) 4,092,470Free float (%) 82.0Enterprise value (€m) 2,478.2Market cap (€m) 937.4
Newsflow
Date Description
Monthly US labour market data 22 February 2008 CXP 4Q07 results 26 February 2008 Office Depot 4Q07 4 March 2008 Staples 4Q07
Share price performance
468
1012141618
12/05 6/06 12/06 6/07 12/07PriceAEX All Share (rebased)
Company profile Overview Corporate Express is a leading player in the worldwideB2B distribution of office products. Pro formadivestment of ASAP software the company generatesc.50% of sales from the US, 24% from Europe, and15% from Australia. The office products divisionrepresents c.89% of sales and the printing systemsdivision 11%. 80% of sales come from large accountsand c.20% from SME.
Office products North America In the US, Corporate Express (CE) ranks as the No.1 player in B2B office supplies distribution. The divisionrepresents 50% of total sales and has some 180locations (including 38 distribution centres) andc.10,000 employees.
Corporate Express Europe In Europe, CE is a top-three player in the B2B office supplies business. The division represents 24% of totalsales active in 26 countries with around 130 locations(including 13 distribution centres) and 4,400employees. CE is predominantly active in Germany, theBenelux and the UK where it holds market leading positions. In addition, the division has office productoperations in Austria, France, Hungary, Ireland, Italy,Poland and Sweden.
Corporate Express Australia CE ranks as the No.1 B2B office supplies distributor.The division represents 15% of total sales. CE is one ofAustralia and New Zealand's leading suppliers of office,warehouse and factory essentials.
Printing systems After the ASAP sales in 2007 this is the only non-core division left within the group. The division represents11% of total sales and is active in Belgium, Greece,Italy, Luxembourg, the Netherlands and Spain. Thedivision is the largest independent distributor ofindustry-leading Heidelberg printing equipment andnow also includes the Veenman faxes and copiersbusiness (the Netherlands and Germany).
Risks Continued weakness in the US and the US dollar.Highly leveraged balance sheet.
SWOT Strengths World market leader in B2B distribution of officeproducts Logistic efficiency Disclosure
Weaknesses Profitability and market positions in Europe US SME segment Sales execution Geared balance sheet Low visibility
Opportunities US SME segment Margin recovery in Europe (cost-saving potential) Product line extensions Increase private brand penetration Takeover candidate
Threats Office products market’s structural decline US recession
CSM is expressing a determination to turn its two businessunits around. It expects to achieve its Bakery Ingredients targets in 2008 despite a difficult commodity environment.PURAC targets look within reach for 2009. The valuation isattractive at a 2009F PER of 10.9x.
Investment thesis
There are three reasons why we like CSM: (1) In bakery ingredients, it is moving towards the out-of-home market, which is higher growth and boasts higher margins. We believe CSM has the ability to be a consolidator in the industry. It has expressed optimism that its price increases (to offset the commodity impact of grain and edible oils mainly) are sticking and that the impact is fairly minimal for both 2H07 (at €5m) and 2008 (at €10m). (2) The underperforming PURAC division has a new management team and a new “from volume to value” strategy. PURAC’s new commitment and new factory in Thailand should lead to a sharp recovery in profitability by 2009. Furthermore, the potential for an announcement on polylactic acid (PLA) could prove another trigger for the shares. (3) Last but certainly not least is valuation. At a 2009F PER of 10.9x, CSM is trading at a substantial discount to its large-cap peers of around 45%.
Key newsflow
We expect the 2007F results to be overshadowed by the impact of the negative development of the US$. However, the underlying trend should be solid and 3S savings should be ahead of schedule. Pricing actions taken in both Bakery Ingredients and PURAC will be watched closely.
We expect Bakery Ingredients EBITA margins to expand further in 2008. However, EBITA margins in 2008 will be hit by sharply inflated sales growth and ‘stable’ EBITA development. This technicality will lead to ‘deflated’ margin progress (and a potential missing of ROS targets, ie, ROS of <8%).
Further scope for positive announcements on PLA? We expect CSM to announce a first contract to produce PLA in 1H08. Although we do not expect a contribution before 2010, the announcement of a contract would be viewed as positive by the market.
Further acquisitions on the horizon? With EBITDA set to exceed the €250m hurdle in 2008F, CSM still has plenty of scope for M&A. At a target net debt/EBITDA of 3x, CSM could borrow up to €750m (2007F net debt of €505m).
Valuation
CSM has a solid dividend yield of 3.6%, which should support the shares. At a 2009F PER of 10.9x, the shares trade at a massive 45% discount to large-cap peers. Could PURAC be spun off in a couple of years once its value is realised by CSM (ie, after PLA becomes a reality)? Further consolidation is on the horizon, in our view. BUY reiterated with a DCF-derived TP of €26.7. _
Main shareholders (%) Lansdowne 12.1ING IM 9.8Morgan Stanley 8.2Franklin Mutual 7.2
Share data No. of shares (m) 65.6Daily turnover (shares) 192,909Free float (%) 100.0Enterprise value (€m) 2,080.6Market cap (€m) 1,556.8
Newsflow
Date Description
27 Feb 08 FY07 results 1Q08F Start-up Thailand 1H08F Sign of PLA contract
Share price performance
20
22
24
26
28
30
32
12/05 6/06 12/06 6/07 12/07PriceAEX All Share (rebased)
Company profile History CSM was founded in 1919 and has gradually grownfrom being a local sugar producer into an internationalcompany in the area of food ingredients and bakerysupplies. It currently consists of four divisions: BakerySupplies Europe, Bakery Supplies North America, Sugar Processing and Biochemicals.
Bakery Supplies Europe Bakery Supplies Europe comprises c.20 companies andis operational in 16 European countries. The divisionspecialises in the development, production and sale ofbakery ingredients and products for professional bakersand bakers of par-baked products in Europe. With amarket share of 12%, Bakery Supplies Europe isconsidered the European market leader.
Bakery Supplies North America This division operates in the US and Canada andconsists of nine operating companies. It holds secondplace in the US market for bakery ingredients andproducts. The division markets its own products butalso distributes products from third parties. The sale ofits own products and the distribution of third-party products contribute about equally to the division’s totalturnover.
Sugar Processing This division produces sugar from beets and marketssugar and specialities for the industrial and consumermarkets. The bulk of the sugar is sold to industrialcustomers and consumers in the Netherlands. Thesugar not sold in the EU and the ‘C sugar’ are exportedto countries outside the European Union. CSM is thenumber-two producer in the Netherlands.
Biochemicals Biochemicals operates under the name PURAC and isthe world market leader in lactic acid (biochemicallyproduced via fermentation) and lactic acid derivatives.Production takes place at four sites in the Netherlands,Spain, Brazil and the US. Lactic acid and its derivativesare used in many different ways in the manufacture of, for example, pharmaceuticals, food and cosmetics.
Risks In our view, the biggest risk for CSM remains thepossibility of another price war for the Purac division.
SWOT Strengths Balance sheet is still under-leveraged More opportunity for SBB Committed management team
Weaknesses Bakery Ingredients market is lacklustre Part of PURAC commoditised (meat preservatives)
Opportunities Easing of commodity prices PLA materialising Thai factory becoming even more efficient
Threats Further commodity price increases Delay in Thai factory start-up Bakery Ingredients Europe Artisan submarket
Due to uncertainties surrounding the €30 cash bid on Cumerio by Norddeutsche Affinerie (NA), the stock has been trading ina €28-29.5 range for months. We recommend HOLDing the shares, and believe that Cumerio will be taken over at €30 by NA. If not, the downside risk is substantial.
Investment thesis
On 24 June 2007 Norddeutsche Affinerie (NA) launched a €30 cash bid on Cumerio, subject to acquiring of at least 80% of the shares and the approval of the competition authorities. Currently neither condition has been met.
First, the European Commission (EC) has launched an in-depth inquiry into the takeover. We understand that the EC is mostly looking into potential competition issues in the copper shapes market. We believe that if this proves to be a hurdle to clear, NA might decide to divest Cumerio’s copper shapes business, given it’s limited historical contribution to Cumerio’s EBIT (estimated around 2% in 2006).
Second, A-TEC Industries, an Austrian company managed by the controversial corporate raider Mr Kovats acquired a 25.1% stake in Cumerio, and can prevent NA from acquiring at least 80% of Cumerio’s shares. So far, it is unclear what the real intentions of A-TEC with Cumerio are, in spite of the fact that Mr Kovats has made several comments on the subject in the press. It seems to us that A-TEC is willing to sell its shares to NA at €30/share, but is demanding two seats on the NA Supervisory Board in return. To date this seems to be unacceptable to NA so far.
On the operational side, the 2008-09F outlook for copper smelters looks bearish. We expect Cumerio’s EBITDA down to €85.3m, from €112.6m in 2007, on the back of lower TC/RC’s and producer premia, coupled with a weaker US$. In the end, we believe that A-TEC has only two choices: (1) sell its shares to NA at €30/share without demanding two seat on the Board, or (2) make a bid on Cumerio themselves. If A-TEC simply blocks the takeover, Cumerio will be valued on its current operations, in which case we expect the share price to substantially drop.
Key newsflow
The EC should pronounce on the competition issues by 5 February 2008. Furthermore, Cumerio should present FY07 results on 15 February 2008. In the meantime, we do not exclude the possibility that NA and A-TEC could reach a mutual agreement.
Valuation
We have put our target price at €30/share, in line with NA’s bid price. Currently, Cumerio trades at 7.8x 2009F EV/EBITDA. In the NA bid fails, we believe the no other company will try to bid for Cumerio, given that NA and A-TEC together control more than 50% of it. As such, we see Cumerio’s valuation dropping to 4 to 5x 2009F EV/EBITDA, which corresponds to a share price range of €14.5 to €18.
Main shareholders (%) Norddeutsche Affinerie 25.1A-TEC Industries 25.1Lansdowne Partners 6.7
Share data No. of shares (m) 25.4Daily turnover (shares) 3,707.0Free float (%) 100.0Enterprise value (€m) 814.8Market cap (€m) 733.4
Company profile Background Cumerio is a leading European copper smelter andrefiner, and a leading European producer of wire rod,shapes and wire. The company’s activities are situatedin four locations: Olen (Belgium), Pirdop (Bulgaria),Avellino (Italy) and Yverdon-les-Bains (Switzerland).
Refining The copper refining business unit comprises the coppersmelting activities in Bulgaria (Pirdop) and the copperrefining activities in Bulgaria (Pirdop) and Belgium(Olen). Cumerio bought the Pirdop smelter in 1997 andhas invested US$150m in plant modernisation andexpansion over the years. Since the acquisition, anodeproduction has more than doubled to 240k tons in2006, and the workforce has been reduced by two-thirds. Moreover, the labour cost (US$/manhour) inBulgaria is about an eighth of Belgian (and German)labour costs, and the corporate tax rate stands at10.0%, whereas Belgium has a 33.99% corporate taxrate. As a result, the Pirdop smelter is ranked No.4worldwide and No.1 in Europe in terms of low-cost production. Cumerio is the third-largest copper refinerin Europe, and produced 408k tons in cathodes in2006. Cathode production amounted to 343k tons inOlen and 65k tons in Pirdop. Cumerio invested €80m in 2006-07 to build a new refinery in Pirdop, with acapacity of 180k tons. The new refinery should go intoproduction as of 1Q08. At the same time, the old plantshould be shut down. The new facility should rank No.3worldwide in terms of cost efficiency.
Products Cumerio’s copper products business unit hasproduction sites in Belgium (Olen), Italy (Avellino) andSwitzerland (Yverdon-les-Bains). The companyproduced 406k tons of wire and specialty rod in 2006and 85k ton of shapes.
Risks Cumerio’s earnings are subject to changes in TC/RCs,product premiums and US$ rates. Given the bearishoperational outlook, there would be substantialdownside risk to Cumerio’s share price should thetakeover by Norddeutsche Affinerie not take place.
SWOT Strengths Market leadership & cost leadership in South-East Europe Experienced management Strong balance sheet
Weaknesses High sensitivity to commercial terms in copper markets(TC/RC, cathode premium) and US$ Weak EBIT on copper products
Opportunities Consolidation in copper market Optimisation of NWC requirements Expansion of refining capacity in Bulgaria
Threats Unexpected increase in worldwide smelting and refiningcapacity Economic recession, which would hurt end demand incopper products
Deceuninck continues to face difficult market conditions,which resulted in restructuring at the Bogen plant. We reviseour forecasts and our TP (from €20.50 to €17.5), to align it tolowered sector valuation multiples. HOLD.
Investment thesis
In the short run, Deceuninck continues to face difficult market conditions and has to align its production facilities with the different growth dynamics in its markets and counter the structurally lower margins in its business. In our view, this might lead to a prolonged turnaround phase at Deceuninck. In the longer run, the company’s business model comprises several long-term earnings growth drivers: the expansion in wood composites (although the US activities are not progressing well), geographical expansion in Russiaand efficiency improvements stemming from the standardisation of window systems and plant optimisation.
Key newsflow
Deceuninck’s 3Q07 trading update disappointed as 3Q07 sales (€178.3m, -1.2% YoY) fell short of our expectations, due to a bigger decline in volumes sold (-3.2% YoY) and a much weaker-than-expected pricing component (+2.5% YoY). Whereas the Eastern European, Belgian and French markets performed well in 3Q07 and appear to pursue this trend, Deceuninck’s outlook statement became more cautious on markets such as Turkey and the UK, while difficult market conditions were already prevailing in the US and Germany. Deceuninck will shift production from its Bogen (Germany) plant to Russia and Poland, as these markets (as opposed to the stagnating German market) offer better growth prospects, and this would reduce transport and customs costs. Deceuninck will take provisions for the sizeable headcount reduction (c.€7m) in its FY07F accounts, we estimate the annual savings could amount to c.€4m. We believe that the full impact of this plan should start to filter through in Deceuninck’sresults from September 2008F.
Deceuninck will increase its supply to Atrya Group (Europe’s number-five player in joinery) with an additional volume of 3,000 tonnes of PVC window and door profiles from 2008F. We expect this contract to add c.€9m to annual sales.
We have revised our forecasts to account for the above elements, resulting in a decline in our 2007F EPS (from €0.68 to €0.45) and slight increases in our 2008F EPS (from €1.02 to €1.06) and 2009F EPS (from €1.72 to €1.83).
Valuation
Due to Deceuninck’s disappointing share price evolution, valuation multiples for 2008F and 2009F have fallen more sharply than its sector peers. We lower our TP from €20.50 to €17.50 to keep it in line with sector multiples for 2008F and 2009F (6.5x and 5.9x, respectively). In view of ING’s Underweight stance on the sector and the absence of short-term share price triggers, we maintain our HOLD recommendation. However, in case of further share price weakness, we would consider buying the shares on a long-term view.
Main shareholders (%) Sofina 17.50Desco 17.50First Eagle Fund 20.04
Share data No. of shares (m) 21.6Daily turnover (shares) 12,887Free float (%) 59.0Enterprise value (€m) 527.1Market cap (€m) 346.3
Company profile History Family-controlled Deceuninck is one of the world’slargest companies active in the PVC window and doorsystems market following the 2003 acquisition ofThyssen Polymer. Products are linked to the buildingand construction industry, with the main focus onwindow and door systems. Deceuninck’s businessmodel reveals various strengths, partly resulting from afocus on vertical integration and acquisitive strategy.
Window & Door Systems (c.89% of sales) Window & Door Systems is Deceuninck’s main divisionand has been the main growth driver over the pastdecade. The division designs, develops and marketsPVC profiles for the production and finishing ofwindows and doors. Europe is Deceuninck’s largestmarket.
Building profiles Building Profiles comprises products centred on interiordecoration (wall and ceiling panels, internal windowboards), external cladding (wall cladding, rooflinesystems) and multifunctional products (finishing anduniversal profiles). The drivers for these segments areconsumer purchasing power, market and fashiontrends, and availability of alternative products.
Geographical breakdown of 1H07 sales Western Europe: 44%; Eastern Europe 25%; Turkey16%; US 15%.
Risks DC's business model is vulnerable to PVC priceincreases (often difficult to recover in selling prices) andbuilding materials demand.
SWOT Strengths Focus on improving and differentiating product featuresto build even stronger market positions in higher added-value niches Several new areas to exploit (both geographically andproduct-linked) Focus on operational efficiency (eg, Zendowstandardisation, Synergybuild, plant optimisation)
Weaknesses Sensitivity to rising PVC resin prices (raw material forDeceuninck) Restructuring process started at the Bogen plant
Opportunities Expansion into non-fenestration activities (woodcomposites and noise walls) and geographical scope(Eastern Europe and Turkey)
Threats Construction spend dependent on consumer confidenceand interest rate evolution
Our bullish stance on the stock is backed by strong fundamentals (market revival at Avis Europe, a good outlookfor both car retail and Belron), which are not reflected in the stock’s valuation. The leveraged balance sheet seems to beholding the share back, unjustly in our view. BUY.
Investment thesis
We expect D’Ieteren to outperform based on a strong fundamentals in its three main activities: (1) Avis Europe (59.6% stake), which was holding back D’Ieteren’s performance over the last 18 months, is, at last, starting to benefit from improved pricing in its core car rental activity. Avis has gained more than 30% since its supportive trading statement on 13 December, with, intriguingly, no impact on D’Ieteren’s share price. (2) Belron (77.4% stake) is D’Ieteren’s growth engine. D’Ieteren gained €300m in market capitalisation soon after the announcement of the Safelite acquisition (to build a #1 position in the US market), which has evaporated since June 2007. (3) The car retail activity (fully-owned) has ended 2007 well, gaining market share ahead of some notorious product launches (mid-segment SUVs, Audi A4, etc.) and, importantly, ahead of the biennial Brussels Car Show in January.
The balance sheet is geared, with net debt at 162% of equity and slightly less than 3x EBITDA, which we view as reasonable. However, this does not provide much room for minority buyouts at Belron, but could be a trigger for a divestment of the stake in Avis Europe.
Key newsflow
Confirmation of Avis Europe’s turnaround in terms of pricing and a strong performance at the Brussels Car Show would help as a trigger for the share price. The market will be tracking climatic patterns in the US and Europe (Belron’s activities thrive in harsh weather). As for guidance, management is expecting ‘around’ 20% current pre-tax profit growth in 2007 (INGF 24%).
Valuation
Upside should stem from Avis Europe, which has gained 30% from its lows, ie, since the supportive year-end trading statement. Recovery to Avis Europe’s 52-week high of 90p, would lift our target price for D’Ieteren by €66 per share (22% above our current target price). A second source of upside lies within the Belron stake. We value the stake at an equity value of €1.2bnor 14x 2008F PER and 10.4x 2008F EV/EBIT, while the two US comparables that we have identified trade at an average 2008F PER of 16x. D’Ieteren is buying out minority stakes at low valuation multiples, which may be holding back the value of Belron applied by the market. However, minority buyout multiples probably reflect an illiquidity discount, while D’Ieteren’s majority stake should reflect a control premium.
Our €300 TP is SOTP-based valuing (1) the 59.6% Avis stake (LSE-listed) at its market value, (2) the 77.4% stake in Belron at 14x 2008F PER and (3) the car retail activity at a peer group multiple of 6.6x 2008F EV/EBITDA. _
Main shareholders (%) D’Ieteren family 50.4Cobepa 7.1
Share data No. of shares (m) 5.5Daily turnover (shares) 3,500.0Free float (%) 41.3Enterprise value (€m) 4,313.9Market cap (€m) 1,351.6
Newsflow
Date Description
14 Jan 2008 FY07 trading update 29 Feb 2008 FY07 results 29 May 2008 AGM 29 Aug 2008 1H08 results
Company profile Description Founded in Belgium in 1805, D’Ieteren is a familycompany focused on services to motorists. The groupmanages three automotive-related businesses withstrong brand names – exclusive car distribution inBelgium of several well-known brands, internationalshort-term car rental (Avis Europe) and automotiveglass replacement (Carglass/Autoglass).
Car distribution (36% of 2007F current pre-tax) D’Ieteren is the exclusive importer and distributor ofVW, Audi, Seat, Skoda, Bentley, Porsche andLamborghini cars in Belgium. It holds a 19% share in amarket of 526,000 new vehicles in 2006. D’Ieterensupplies about 300 independent dealers and operates10 own dealerships that account for 10% of thedivision’s turnover. It also develops peripheral servicesfor motorists such as financing, leasing, mobilityinformation on the internet and used-car retailing (My Way outlets). It is also a Yamaha distributor in Belgium.
Avis Europe (17%) D’Ieteren is active in short-term car rental through amajority stake in Avis Europe (59.6%), which is listedon the LSE. Avis is leader of the European car rentalmarket with 82% of revenues achieved in Western Europe. Avis is in the top three in all five markets. It isalso active in Africa, the Middle East and Asia, which isof particular importance for future development.
Belron/Carglass (47%) In line with its strategy to diversify in automotive-related services with growth potential, D’Ieteren added a thirdpillar at the end of 1999 with the acquisition of amajority stake in Belron/PGSI for €250m. Belron is aworldwide specialist in automotive glass repair andreplacement with a large international network and well-known brand names (Carglass and Autoglass). Thestake was increased to 77.4% in 2007. D’Ieteren aimsto consolidate this fragmented market and, by doing so,has recently announced the acquisition of Safelight, theUS market leader.
Risks D’Ieteren’s car retail could be affected by a decision by VW to close its Belgian plant. As Belron is aconsolidator in a fragmented market, its businessmodel is exposed to potential integration issues.D’Ieteren is leveraged to an economic downturn (Avisand car retail) and Avis could be affected by airlinetraffic weakness due to terrorist threats.
SWOT Strengths Good investment track record. Leading market positionsin the three activities.
Weaknesses Heavy reliance on third-party performance/execution(VW product launches). Obscure operational fitbetween the three activities. Listed stake in Avishampers D’Ieteren’s unique equity proposition.
Opportunities Geographical expansion potential at Belron. Replicationof the Belron model to other activities. Arbitrageopportunities between D’Ieteren and Avis. Expectationsof better market discipline in the car rental market withthe change in peer ownership (Hertz and Europcar).
Threats Highly leveraged to economic growth/downturn (Avisand car distribution). Could be affected by a decision by VW to close its Belgian plant.
The FY07 trading update showed no weakening in marketconditions, except for Spain. We are also positive on therecent transaction to secure full ownership of Comteq. In our opinion, the recent share price dip is overdone and wemaintain our BUY rating.
Investment thesis
We maintain our BUY rating, as Draka is seeing the benefits of restructuring and strategic reorientation in combination with favourable conditions in most of its markets. In addition, we are positive on the recent transaction to obtain full ownership of Comteq.
Cableteq: market conditions for Cableteq are particularly favourable in the high-margin specialty cable segment (eg, marine oil & gas, transport and rubber). However, the outlook for low voltage is also positive (with the exception of Spain), owing to its late-cycle nature. Draka has almost no exposure to the weak US and German building markets.
Comteq: we see the recent transaction to secure full ownership of Comteq as positive. The timing of the transaction is right, with market conditions finally improving in Europe owing to a release of pent-up demand, with all major telecom operators upgrading their networks. The price of €209m was at the high end of our range, but we believe it is more important that uncertainty regarding the potential transaction and financing is now out of the way. The transaction will be financed by debt, and Draka has recently closed a revolving credit facility of €625m for a period of five years. It will have a limited positive impact on 2008F EPS (we estimate in the range of €0.10-0.15). Current restructuring should produce cost savings of €7m in 2008 and merging the two head offices should yield savings of €3m in 2008. In addition, Comteq has considerable tax loss carry-forwards of €450m.
Key newsflow
All eyes are focused on the recovery of the optical fibre market. After some difficult years, it started to recover in 2006, with strong volume growth. However, there is still oversupply: we estimate actual demand is around 90m km, while we estimate capacity at 125m km. Assuming volume growth of 10% pa, demand should meet supply in 2010F. Regarding the FY07 figures to be released in March, we expect no surprises as Draka has reiterated its guidance of an EBIT of €145m for 2007.
Valuation
The FY07 trading update shows that there is no sign of a slowdown, with the exception of Spain. Therefore, we believe the recent dip in the share price is overdone, and offers a buying opportunity. Looking at valuation, the stock trades at a 2008F PER of 8.4x, and our €28 target price is based on a 2008F PER of 10.5x which is in line with its peer group. We expect medium-term newsflow to be positive, with potential projects in the European optical fibre market. _
Main shareholders (%) Flint Beheer 48Fidelity 5.2Reach Capital 5GO Capital 4.98ING 3.79
Share data No. of shares (m) 38.1Daily turnover (shares) 221,294Free float (%) 30.0Enterprise value (€m) 1,362.3Market cap (€m) 868.7
Company profile Activities Draka is one of the top ten players in the global cablemarket and the No.3 in Europe. Draka has a strongposition in communications cable and holds importantmarket shares in standard and special-purpose cables. Draka has grown significantly over the years, bothorganically and through acquisitions. Draka’s mission isto become one of the world’s leading cablemanufacturers, with a sound financial basis, a balancedgeographical spread and an extensive, technologicallyadvanced product portfolio. In the 1990s, the global cable market experiencedsome consolidation. However, the cable market is stilloverly fragmented as the ten biggest cable producerscurrently have a combined market share of just 25%.According to Draka, this fragmentation will inevitablylead to further consolidation, making it possible forcable manufacturers to operate at a healthy long-term level of profitability. In the European market, Drakaaims to achieve a market share of at least 20% in theproduct segments in which it is active (communicationcable and low-voltage and special-purpose cable). At present, it has a market share of approximately 15%.Outside Europe, Draka is aiming at further expansion ofthe communication cable and special-purpose cableactivities. Draka targets to increase revenues fromspecial purpose cable segments from 43% to 50% ofsales. The company can be divided into two divisions -Comteq and Cableteq.
Comteq This division consists of telecommunication cables,data communication cables and optical fibres. As aresult of its joint venture with Alcatel, Comteq is a top-three player in the optical fibre market. The divisiongenerates 23% of sales.
Cableteq Cableteq consists of low voltage cable, elevator cable,marine, oil & gas, mobile network cable, rubber cableand transport. Cableteq is profit-making and generated77% of sales.
Risks Risks to our investment case include a weakening ofthe economy, volatile raw materials prices andovercapacity in the optical fibre market.
Strengths Strong market-leading positions Active in some niche markets (eg, elevators, marine, oil& gas, etc) with attractive profitability levels
Weaknesses Uncertainties regarding the value of Alcatel put option Uncertainties regarding the increase in Draka’s stake inthe Chinese JV
Opportunities Good prospects for niche markets like marine, oil & gas,elevator cables, etc Some recovery on the demand side of the optical fibremarket (volume growth of 10-15%)
Threats Overcapacity in the optical fibre market (50%overcapacity) leads to volatile market conditions Rising raw materials prices
Thanks to its flagship Duvel brand, the company generatesmargins at the high end of the industry and achieves highsingle-digit organic growth. However, as a result of a 25% over the last 12 months, the company trades at an 8% premium to its peers. HOLD and €48 TP maintained.
Investment thesis
Attractive positioning: Duvel Moortgat enjoys the highest profitability in the sector with EBIT margins which we forecast to remain above 20% for the next two years. This is made possible by (1) the company’s position in the high-end beers segment; (2) the tremendous success of the highly priced Duvel brand; (3) strong revenue growth; and (4) controlled costs. Raw materials and energy costs have been on the rise for the last twelve months but the company successfully managed to maintain high margins as the premium status of its flagship Duvel brand allowed it to pass on the raw materials price increases to customers.
8.4% pa organic growth expected in the next three years: Duvel’s growth will be mostly driven by exceptional organic growth in export markets. While international sales currently represent only c.40% of turnover, the management’s excellent track record on export market strategy points towards further growth. Duvel’s growth will also be fuelled by non-organic elements such as the earning-enhancing acquisition of ‘Brasserie Achouffes’
Strong cash generation: Duvel’s 2007 cash flow yield is close to 5% and we expect it to keep on growing in future years. This strong cash generation is driven by a high net profit margin (14.1% of sales in 2007) and exceptional net profit growth at a 2006-09F CAGR of 13.6%.
Unwarranted speculation triggered our recent downgrade: Duvel’s share price gained 25% over the last 12 months and 15% since SAB Miller announced its intention to acquire the Dutch brewer Grolsch on 19 November 2007. We think it is too early to play M&A speculation on Duvel and, given the 8% premium to peers on 2008F multiples, we rate the stock a HOLD.
Key newsflow
Duvel publishes its results twice a year. Apart from the results publications, newsflow is usually very limited. The main surprises could come from new acquisitions, which, at first sight, we would consider positively given the company’s unnecessary net cash position.
Valuation
We maintain our HOLD rating on Duvel and maintain our €48 DCF-backed TP. The company trades at 2008F multiples of 8.3x EV/EBITDA and 19.6x PER; an 8% premium to its peers which, we believe, sufficiently reflects its superior organic growth and profitability profile. _
Main shareholders (%) Fibemi 64.1Veerle Bart 10.1
Share data No. of shares (m) 5.3Daily turnover (shares) 521.0Free float (%) 23.9Enterprise value (€m) 244.4Market cap (€m) 260.2
Company profile Background Duvel Moortgat is a family-controlled producer ofspeciality beers. Sound management and a focus onhigh-quality speciality beers have enabled it to generatemargins at the high end of the industry – above 20%EBIT margins. About two-thirds of revenues come from Belgium, itsdomestic market, where Duvel enjoys 80% share of thehigh-fermentation blonde beers. Duvel Moortgat’s mainexport markets are the Netherlands, France, the UKand the US. Export markets represent only 35% ofrevenues, and Duvel’s growth potential outside theBenelux is substantial. However, margins in exportmarkets are inferior to domestic levels due to a lack ofcritical mass. Duvel Moortgat’s marketing spend hovers around 15%of revenues, well below the beer industry average of25%. This low spend highlights the potential of theDuvel brand, which generates high organic revenuegrowth and margins relative to the industry, with a lowmarketing budget. The out-of-home channel represents around two-thirds of Duvel Moortgat’s volumes inBelgium. In the food channel (food & beverageretailers), Duvel Moortgat is present in all Belgian tierone supermarkets.
Duvel brand (63% of 2007F sales) The company produce its flagship brew, the Duvel beerin its brewery in Puurs, Belgium. Duvel is a high-fermentation blonde beer with an alcohol content of8.5°.
Czech specialty beers (7% of 2007F sales) Duvel Moortgat acquired 50% of Czech brewer Bernardin 2001. It produces premium lagers. While Bernard represents 18% of Duvel Moortgat’s volumes, itgenerates only 7% of its revenues.
Other specialty beers (30% of 2007F sales) These brands include, among others: (1) Bel Pils:luxury lager. (2) Maredsous: two blonde beers and onedark abbey beer (under licence from Fromagerie etBrasserie de Maredsous), alcohol content 6°, 8° and10° and (3) Vedett: luxury lager, targeted at the youthmarket
Geographical breakdown of sales (2007): Belgium: 60%; US: 10% and RoW: 30%
Risks Risks include (1) the rising energy and raw materialcosts and (2) a potentially intensifying competition inBelgium.
SWOT Strengths Among highest margins in the sector Duvel’s brand recognition
Weaknesses Limited liquidity (c.24% free float) Saturated home market
Opportunities Export market growth Net cash position
Threats Lack of critical mass Rising costs of energy and raw materials
The exciting growth prospects in online advertising arecurrently offset by high integration risks resulting from fiveconsecutive acquisitions. Trading at a 2008F PER of 38.5x, we see limited upside for Emakina. HOLD maintained.
Investment thesis
Emakina is the second-largest Belgian web agency. A web agency is much like a traditional advertising agency except that the only medium it uses to promote its clients is the internet. The company’s added value is to offer a combination of e-commerce and e-marketing services, as it can build both the websites and the web-based advertising campaigns of its clients. Emakina enjoys strong recognition across the industry in Belgium for both its technical and creative expertise. In addition and thanks to impressive client loyalty, Emakina’s business model provides the company with good visibility on its 12-month-forward revenue.
Fast growing industry: We expect industry growth to be the main driver of Emakina’s expansion. The Belgian online advertising industry is forecast to grow at a 22% CAGR over the next four years. The main growth drivers are:
• The expected convergence between the amount of online advertising expenditure and the internet’s media timeshare. As an example, in 2005, the internet accounted for 22% of media timeshare and €42m of ad spend, while television accounted for 33% of media timeshare and €982m of ad spend.
• Belgium is lagging behind its neighbours as internet advertising accounted for only 1.7% of total ad spend, while it represented 3.2% and 6.0% in Europe and the US, respectively.
High sales and profitability growth expected: Thanks to strong online advertising growth, Emakina should post a 2006-09F sales CAGR of 40%. The 2006-09F EPS CAGR is expected to come in at 95%. This profitability improvement should be driven by: (1) a solid increase in revenue; (2) a growing daily billing rate; and (3) a decreasing proportion of SG&A costs due to the large proportion of fixed costs within them.
Key newsflow
Emakina reports its results twice a year. Apart from these releases, newsflow is usually limited. Management is actively looking for further acquisitions, but we believe the short-term focus will be on integration.
Valuation
At our DCF-based €13 target price, Emakina would trade at a 2008F PER of 15.7x and a 2008F EV/EBIT of 8.2x, representing an average 5% discount to peer multiples. _
Main shareholders (%) Two4Two 29.7Denis Steisel 17.8Brice le Blévennec 17.8John Deprez 4.5
Share data No. of shares (m) 3.4Daily turnover (shares) 409Free float (%) 33.9Enterprise value (€m) 29.9Market cap (€m) 37.0
Newsflow
Date Description
31 Mar 2008 FY07 results 22 Apr 2008 AGM 29 Aug 2008 1H08 results
Company profile Emakina is the second-largest Belgian web agency. Aweb agency is very much comparable to a traditionaladvertising agency except that the only media it uses topromote its clients is the internet. The company’sadded value is to offer a combination of e-commerceand e-marketing services, as it can build both thewebsites and the web-based advertising campaigns ofits clients. Emakina enjoys strong recognition across the industryin Belgium for both its technical and creative expertise. In addition and thanks to impressive client loyalty,Emakina’s business model provides the company withgood visibility on its 12-month forward revenue. As a result of a mixture of company-related andindustry-related growth drivers, ING expects sales to rise sharply by a CAGR 2006-09F of 42%. Mostly dueto operational leverage and economies of scale, wealso expect EBIT margins to improve radically from10.2% in 2005 to an average of 15.8% for the nextthree years. As a result, net profit CAGR 2006-09F should come to 95%.
Geographical breakdown of sales (2007F) Belgium: 90%; Europe: 10%
SWOT Strengths Strong industry growth 12-month visibility on revenues
Weaknesses Limited track record High client concentration
Opportunities International expansion SMEs could become clients
Threats M&A execution risks Availability of qualified staff
Risks The main risks include: (1) high client concentrationmaking the company vulnerable to client losses; (2)M&A execution risks; (3) the limited track record; and(4) the high dependency on the e-economy.
We expect strong operational execution in Eriks’ keybusiness units and a further successful integration of Wykogoing forward. However, we are concerned about industrial activity in Eriks’ key end-markets this year and about the stillrelatively firm valuation levels, hence we maintain our HOLD.
Investment thesis
Eriks is a leading technical distribution company, supplying a wide range of products and services to all segments of the industry, fulfilling a twin role as specialist and total supplier. Eriks’ boasts market leading positions in the Benelux, UK and Germany. We expect FY07F to be a very strong year, seeing sales increase organically by c.10% and EPS including amortisation growing by around 18%. Despite clear operational excellence and an impeccable integration track record we believe a slowdown in industrial activity in 2008 will hamper upside potential. Eriks booked solid 3Q07 results and experienced no weakness in any of its markets, but seeing industrial confidence indicators already declining we expect that 2008F will be a year of slowing growth. Although we expect Eriks to be successful in integrating Wyko and improving the operating margin of its UK business further, we retain our Hold recommendation and lower our target price from €62 to €52, based on the recent de-rating of the sector. To recap, we like the following about Eriks: (1) strong and proven corporate strategy; (2) active consolidator in Western European markets; and (3) exceptionally strong operating performance (key business units reported peak margins in 2007F). Our concerns however are (1) industrial activity in Germany, Benelux and UK is likely to weaken during 2008, harming organic growth; (2) valuation levels despite the recent sell-off remain at the high end of Eriks’ historic average. All in all, we believe Eriks continues to outperform its peers, both in top-line growth, as well as EPS growth, but as we expect a slowdown in industrial activity next year we doubt whether we will see any multiple expansion.
Key newsflow
We would regard any announcement of a medium-sized acquisition in 2008 as a share price catalyst. Firstly, it would indicate that the integration of Wyko (Eriks’ largest-ever acquisition) is going as planned. Secondly, it would emphasise that Eriks continues to be an active consolidator in the Western European market. Furthermore key macro data releases on industrial activity in Eriks’ key markets determine sentiment for the industrial distributors.
Valuation
Eriks trades well above its historic average multiples, which we be believe is warranted as it has substantially fortified its market positions in Europe and has proven that its dual strategy is the right one as margins expanded right through the last economic downturn. However, from the current levels of 9.4x 2008F PER and 5.7x 2008F EV/EBITDA we see limited room for multiple expansion. We lower our DCF-based TP from €62 to €49, which implies a target 2008F PER and EV/EBITDA of 10.3x and 6.1x, respectively._
Main shareholders (%) ING Group 19.5Kempen 10.2TG Holding 8.2Delta Lloyd 7.5
Share data No. of shares (m) 10.6Daily turnover (shares) 50,687Free float (%) 46.8Enterprise value (€m) 515.2Market cap (€m) 477.2
Company profile Overview Eriks is a Dutch holding company of a group oftechnical distribution companies. Sales of €543m wereachieved in 2006 with an average workforce of 2,434people. The net result in 2006 amounted to €27.8m. Eriks made a number of major acquisitions during2H06; pro-forma sales of all the companies currently inthe group amounted to approximately €875m, and atthe end of the year the company had 4,358 full-time employees. Eriks procures, stores, processes, sells and distributesa wide range of high-quality mechanical engineering components and provides a highly developed range ofrelated technical and logistics services. Its operationsare based on a broad and deep know-how of marketdevelopments, product properties, product applications,product processing, logistics and a correspondingmodern infrastructure. Its ability to offer these six know-how domains means that Eriks is ideally positioned tomake a positive contribution to its customers’ businessoperations. Eriks has become a leading, innovativesupplier to defined segments of industry, fulfilling thetwin roles of specialist and total supplier. The companysupplies over 90,000 industrial customers (B2B),markets a range of over 600,000 articles, purchasesworldwide from over 1,000 qualified suppliers andmanufacturers, and sends out approximately 3mshipments every year. Eriks currently consists of over50 group companies with branches in 13 countries. Thegeographical focus of the group’s activities is inWestern and Central Europe, where 94% of its salesare achieved. Eriks also has branches in the US andAsia.
Business units Based on ING’s 2007F revenue estimates, Eriksderives c.24% of total sales from the Netherlands, 39%from the UK, 15% Belgium, 13% Germany, 4% US, 3%France, 1% South-east Asia and 1% Poland.
Goals Assuming normal growth in economic activity, Eriks’financial targets for the next three years are as follows.(1) Average sales growth of 10-15% (2006: 21%),broadly 5-7% organic growth and the remainder viaacquisitions. Assuming pro-forma sales of about €875m, sales in 2009 should exceed €1.1bn. (2) EBITAas a percentage of net capital invested, includinggoodwill, of at least 15% (2006: 23%). (3) Netdebt/EBITA ratio of <2.5x (2006: 3.1x). (4) Interestcoverage ratio of >6x. (5) Average rise in EPS of 5-10% (2006: 24%). (6) Dividend payout c.50%.
SWOT Strengths Diversified product offering Extensive knowledge of products adds value for clients
Weaknesses Lack of scale in France and to some extent Germany Business model (offering) not uniform across the board
Opportunities Plenty of consolidation opportunities in Europe Capitalise on ‘best practise’ of Dutch business model
Threats European industry is structurally shrinking Shortage of skilled staff
We rate Euronav a HOLD. It is a good-quality company, but the UN’s IMO 2010 decree to phase out single-hull tankers will create an oversupply of tankers in the coming years.Valued at around 15% below its NAV, Euronav looks cheap,but this is against a backdrop of considerable uncertainty.
Investment thesis
Euronav is a large independent tanker company with a young, high-quality fleet of VLCCs and Suezmax tankers. It is also part of the TI pool, the largest pool of independent tanker firms, which enables it to make higher returns.Being dependent on spot prices, its earnings can be volatile, but Euronavconforms to the highest standards, making relatively good returns.
The markets in which Euronav operates are favourable, with continuinggrowth in demand for oil transport due to the growing distance between oil-producing and consuming regions. However, the tanker industry is facing adifficult couple of years due to oversupply owing to IMO 2010, a UN decree requiring the switch from single- to double-hull tankers by 2010. 150 VLCCs,or one-third of the worldwide fleet, are single hull, and these ships have to betaken out by 2010. This has resulted in a transition period, with new doublehulls entering the market while single hulls have to be phased out. In thisperiod, single hulls may remain in the market, spoiling market conditions. Asa result, the 2008-09 market outlook is weak, but much will depend on oildemand growth related to GDP growth, combined with discipline among shippers to scrap single hulls as soon as possible in order to preventoversupply.
In our estimates, we assume that no serious scrapping takes place before2010, while demand grows as predicted by IEA, or at around 1.6m bpd pauntil 2011. Based on these assumptions, a sharp earnings decline can beexpected at Euronav in 2008, with a break-even level in 2009-10.
Key newsflow
The recent increase in spot rates to US$235,000 (vs US$35,000 in 2007 on average) raised speculation of a good 2007. We disagree, as we will have towait until at least 2008 before these higher prices will be able to filter through into Euronav’s results. High consensus at US$120m net for 2007 implies a risk of disappointment for the share price on the 22 January reporting date.
Valuation
We rate Euronav a HOLD, despite a 15% discount to NAV of €29 and it trading in line with a DCF of €24 on our basic estimate. We believeuncertainty over the behaviour of market participants with respect to takingsingle hulls off the market, and the consequent weak outlook for 2008-09F, may be offset by Euronav’s strong position thanks to its management andyoung, high-quality fleet. Our €25 TP reflects a mix between DCF and NAV.
Main shareholders (%) Saverco 27.96Victrix 10.12Tanklog 20.49
Share data No. of shares (m) 52.5Daily turnover (shares) 141,889Free float (%) 43.4Enterprise value (US$m) 2,526.5Market cap (US$m) 1,882.1
Newsflow
Date Description
22 January 2008 Prel. FY07 results 4 March 2008 Def. FY07 results 22 April 2008 1Q08 results 29 April 2008 AGM
Company profile History Euronav was split off from CMB at the end of 2004.Since the split, Euronav has expanded rapidly throughtwo large deals in 2005 for a total of more than US$1bn(around its own market cap). In 2006, the companyoptimised the fleet through a couple of transactions inorder to get a better balance between owning andchartering. Revenues that year came in at US$680mand net profit was US$218m. Euronav is a world-leading oil tanker firm, operatingVLCCs, Suezmaxes and Aframaxes, owned and hired.Part of the fleet is time-chartered for both shorter andlonger periods. As well as transporting crude and oilproducts, Euronav buys and sells ships from time totime.
Risks The main upside risk to our HOLD recommendation isa higher volume of OPEC crude, which should lead tohigher tariffs. The downside risk is related to theabsence of a serious winter.
SWOT Strengths Leading position as an independent tanker firm in theVLCC segment Good-quality fleet up to the highest standards Leading member of TI pool, the largest pool ofindependent tanker firms with a 10% market share.
Weaknesses Modest position in Aframax and Suezmax vessels Dependence on volatile spot rates for a large part of the results
Opportunities Transport of oil should grow faster than oil demand as aresult of the maturity of oil regions such as the NorthSea and the US, leading to longer distances andconsequently more transport Further growth in market share through the buyout ofsmaller competitors
Threats Weak markets expected due to excessive supply due toIMO 2010 at the cost of returns and cash flow Vulnerable to geopolitical developments such as supplyinterruption Competitors with deep pockets growing aggressively
EVS published strong 3Q07 results driven by resilient grossmargins in spite of a weak US$ and increasing sales tostudio. This indicates that profitability in the potentially tentimes’ larger studio market is in line with group’s exceptionalaverage. We maintain our BUY rating and €89 TP.
Investment thesis
EVS develops hardware equipment (servers) and software that enable thedigital recording of video onto hard disks. The company is, by far, the marketleader for servers to the niche Outside Broadcasting (OB) market with anestimated market share of 85%+ and 95%+ on new sales. In 2002, EVSstarted selling to the potentially ten times larger studio market in which it already gained an estimated 25% market share. Due to a lack of large sportsevents, 2007 was expected to be a transition year, but the structural long-term growth drivers are now taking the lead. As a result, 2007 is nowexpected by management to be a ‘positive consolidation year’. Followingthree strong quarters, we now expect EVS to post YoY sales growth ofabove 10% in 2007F as 2H07 should already start to reflect orders for the2008 Olympics and European football championship.
EVS benefits from numerous growth drivers: (1) the ongoing transition fromtape-based to tapeless recording; (2) the continuous transition from standarddefinition (SD) to high definition (HDTV) format; (3) the rising number oftelevision channels worldwide; (4) the increasing use of software applications such as speed-clipping, boosted by new applications (internet TV and mobile TV); (5) the pick-up in the near-live studio market; and (6) the increasing popularity of sports.
Key newsflow
EVS’s share price evolution is mostly dependent on the results. Except forthe quarterly publications, we do not expect newsflow to have a significantimpact on the share price. We would however pay attention to any sign ofmanagement willingness to increase the leverage, as EVS’s net cashposition is heavily weighing on its WACC.
Valuation
We are aware that by currently trading at 21.3x 2008F PER, its valuation does not leave room for operational mistakes, but we believe its multipleswill be supported by newsflow ahead of the Olympics in Beijing. We are also convinced that 2009 should be a strong year, supported by significantinvestments in HDTV and with studio sales compensating for any potentialdownturn in OB. At our DCF-backed TP of €89 EVS would trade at 2008F multiples of 23.6x PER and15.2x EV/EBIT. On 2007F numbers, EVS tradesat a c.15% premium to peers, which is largely justified by: (1) its high level ofprofitability; (2) its powerful growth drivers; (3) its focused business model; (4) its dominant share in its niche market; (5) the high dividend payout; and(6) its speculative appeal (80% freefloat). _
Main shareholders (%) DTV 13.2BIPInvestment Partners 7.4Michel Counson 6.8Powe Capital Management 6.1
Share data No. of shares (m) 13.6Daily turnover (shares) 25,577Free float (%) 81.8Enterprise value (€m) 1,027.6Market cap (€m) 1,092.9
Company profile Background Founded in 1994, EVS develops equipment for thebroadcasting industry that enables the digital recordingof video on hard disks. It designs, manufactures andmarkets digital equipment and automation software forradio and television broadcasters. These high-value-added products, manufactured in small batches,address niche markets where EVS holds strong shares. TV systems' roots lie in the sports TV business. TheLive Slow Motion (LSM) system revolutionised sportsbroadcasting in the early 1990s with its simultaneousrecord and replay capability. The technology wasfurther developed in multi-channels, multi-operatorsand networked (XT technology). Used at major sportingevents such as the UEFA World Cup and the Olympics,it has evolved into a global industry standard.
Outside Broadcasting (69% of 2007F sales) EVS holds a market share of over 85% in servers formobile production in trucks, a niche where the companygenerates 70% of its revenues. The mobile studioequipment market is worth €600m per annum, 10% ofwhich for servers.
Studio (31% of 2007F sales) The opportunity in the studio market is potentially tentimes larger than in OB, EVS is a challenger, with anestimated market share of 5%. EVS plans to capturemarket share by leveraging its OB know-how andattack market positions dominated by Avid, Omneon,Apple and Thomson, not only in the server segment,but also in applications (editing) and in a later phase inthe play-out (compression server).
Digital cinema XDC (47% affiliate) XDC, 47% owned by EVS (diluted from 60% in July2006), has a family of high-performance servers aimed at the digital cinema business. Specific configurationsare available for each step of the process: post-production, transmission and projection. XDC haslimited its market coverage to Europe. Its plan is basedon the lease of digital cinema equipment.
Risks Although we believe the barriers to entry are high inEVS’s niche markets, an announcement by a majorequipment manufacturer to enter the field could havean adverse effect on the share price. Also, visibility istraditionally low as the order book lead time is short.
SWOT Strengths Monopolistic position in niche market Highly profitable + strong FCF generation
Weaknesses OB market is limited in size Revenue diversification is low
Opportunities Studio market considerable enlarge addressable market Transition to HDTV should fuel growth for several years
In our view, positives from the 1H07 results include improvingclient retention rates in the Netherlands, a favourable outlookfor the full year and a 100% dividend payout. While cash flow generation and dividend yield remain good, we reiterate ourHOLD rating, as we see few further near-term triggers.
Investment thesis
1H07 results were largely in line with our expectations. Sales of €121m were slightly higher than 1H06 (€118m). Organic growth was 6% mainly due tolicence income up 7% YoY. Geographically, the Netherlands performedahead of expectations, led by licence growth at 10.5%. Thanks to furtheroperational leverage, the EBIT margin improved from 39.1% in 1H06 to 41.9%. The US was 4% better at constant FX rates, generating an EBITmargin of 15.2%, flat YoY. EMEA showed a significant improvement withorganic licence growth of 17%, while EBIT increased from €4.2m to €5.2m.
Positives from the results include: (1) improving client retention rates in theNetherlands; (2) the 2007 outlook of 6-8% organic licence sales growthholding firm; and (3) a continuing dividend payout of 100% of earnings.While we expect 6-7% licence sales and services sales growth in 2007-09F, maintenance revenue growth will likely be limited to 1-2%, leading to total sales growth of just 4%. For 2009F, we estimate EPS excluding amortisation of €1.93.
Maintenance contracts, which make up 51% of revenue, dampen the effectsof a potential economic slowdown, whereas 24% of sales are US$-related.
While we are positive on Exact’s good cash flow generation and theimproving outlook for 2008-09, organic sales growth in 2007-09F remains limited on relatively low client retention rates.
Key newsflow
The recent acquisition of Longview Solutions (US$29m in revenues, EBITDAmargins of 22.5%) expanded the company’s North American client base with 100 boardroom contacts and is accretive from day one, with an estimated contribution to EPS excluding amortisation of €0.07 pa (+4%). The issue here is that Longview’s CPM platform targets large Tier 1 customers,whereas Exact focuses on the mid-market. The balance sheet providessufficient room for additional takeovers or a special dividend.
Valuation
We believe further positive triggers for the share price are limited in the nearterm. We therefore reiterate our HOLD rating. Our €27.0 target price reflects a target 2008F EV/EBITDA multiple of 8.5x, backed by our €27.4 DCF analysis and adjusted for the impact on the EV of the 100% dividend payout._
Main shareholders (%) Mr A. van Nieuwland 15.7Mr E. Hagens 14.9Mr R. Dekker 13.9Aviva 7.5
Share data No. of shares (m) 24.3Daily turnover (shares) 25,352Free float (%) 46.0Enterprise value (€m) 502.7Market cap (€m) 591.5
Newsflow
Date Description
7 February 2008 FY07 results 24 April 2008 AGM 24 July 2008 1H08
Share price performance
22
24
26
28
30
32
12/05 6/06 12/06 6/07 12/07PriceAEX All Share (rebased)
Company profile Exact is a Dutch-based, international mid-market ERPsoftware vendor, which currently has 60 subsidiariesand 20 distributors in over 60 countries. The companyhas a stable and profitable installed base in theNetherlands among SMEs, which represented 44% of2005 sales and which it serves through an indirectchannel. Around 53% of sales are generated by highlyrecurrent maintenance revenues. Through the acquisitions of Macola (2001) and Kewill(2002), Exact entered the vast US mid-market, whichnow represents 24% of sales and where it hopes tobecome one of the top three vendors for manufacturingcompanies. Furthermore, Exact intends to be thepreferred second-tier supplier for multinationals.International sales account for 32% of revenues. Its main products include its major ERP product, ExactGlobe, and E-Synergy, its internet-focused ERPproduct, which is in general aimed at largerorganisations. In 1H06, Exact introduced an ASPversion of its product targeted at smaller SMEs in theNetherlands.
Risks Upside risks to our HOLD recommendation couldinclude a large successful acquisition that fits into itsclient profile and significantly adds to earnings.Downside risks could involve Exact suffering from SMEclients reducing their spending in software when adownturn arrives.
SWOT Strengths Strong installed base in the Dutch SME market withloyal dealer network Strong cash position and balance sheet Very flexible and state-of-the-art internet product calledE-Synergy, which is attractive to new and existingcustomers
Weaknesses Broad geographical spread of various operations andproducts Relatively small scale in R&D and support whencompared with larger competitors
Opportunities Proliferation of the E-Synergy product among Dutchand international clients Upgrade potential among existing Dutch installed baseonce economic conditions improve in the SME segment
Threats Potential competition from larger players such asMicrosoft, SAP, Sage and Oracle Continued high investments in R&D and sales &marketing in order to keep up with competition
We expect 4Q07 results to be good, but not strong enoughto compensate for a weak 9M07. Together withuncertainty on its prospects, we rate Exmar a HOLD despite it being valued at a 20% discount to NAV.
Investment thesis
Exmar is an interesting shipping play, transporting primarily LPG/NH3 with a strong position in the mid segment (MGC) and a smaller position in VLGCs. Exmar is growing fast in LNG, including exploring vessels with regasification units on board. Offshore represents Exmar’s offshore activities and develops the semisub OPTI-EX, a cheap solution for marginal deep water fields.
Exmar aims for controlled growth of its businesses and to concentrate on the development of specialised transport and related services in industrial niche markets, with a focus on the LPG and LNG sectors and the offshore industry. It aims to expand its LNG position from 10 vessels in 2010 to 18 in 2016 with an emphasis on LNGR vessels. In offshore, the development of the semisub is important. Management intended a separate listing of its Offshore division, but is no longer in any hurry, because it sees its balance sheet as strong enough to follow its growth ambitions. A separate listing should not be expected before the first contract for its OPTI-EX semisub is concluded.
Looking ahead, the weak 2007 does not bode well for 2008, mainly due to modest LPG prices, especially in the VLGC segment. More importantly, 2009 should show a hockey stick-shaped recovery pattern, thanks to the main three divisions but all divisions could suffer from postponements, eg, LPG import capacity, delivery of LNG vessels and no OPTI-EX contract. Therefore, there are risks regarding our earnings growth estimate for 2009, which we still see at 82%, leading to a 2006-09F EPS CAGR of 23%.
Key newsflow
We expect no news from Exmar before the preliminary 2007 results release on 31 January. However, there is a chance that RWE could acquire 50% of Excelerate Energy, a family-owned firm with wide interests in Exmar’s LNG business via long-term charter contracts and share-owned ships. This certainly would certainly lower Exmar’s risk profile.
Valuation
We rate Exmar a HOLD. The valuation relative to peers (-7%) and on adjusted NAV (-20%) is under pressure in spite of Exmar’s attractiveness as an energy firm in the long term. However, the 2007-09 earnings outlook isuncertain due to the trough in the LPG business and a possible delay in long-awaited 2009 deliveries. Our TP is €24, based on a NAV of €25.50 and a 2009 EV/EBITDA-based peer valuation of €22.60.
Main shareholders (%) Saverex 57.4
Share data No. of shares (m) 34.9Daily turnover (shares) 23,086Free float (%) 42.7Enterprise value (US$m) 1,989.2Market cap (US$m) 1,024.0
Newsflow
Date Description
31January 2008 Prel. figures 2007 20 March 2007 Final.FY07 results 29 April 2008 1Q08 trading update 20 May 2008 AGM
Company profile Exmar is a shipping firm that transports gas. It has onlya short history as an independent company as it was spun off from CMB in June 2003. It operates throughthree main divisions: LPG, LNG and Offshore.Transport accounts for the lion’s share of revenues andEBIT, but Services (non-transport activities) contributes10% and 4%, respectively. Plans to list Offshore havebeen postponed until a later date.
LPG transport (62% revenues, 59% of EBIT) This is Exmar's largest division, carrying LPG, ammoniaand other chemical gases. Exmar has a strong positionin the mid-segment transport of LPG/ammonia but is also building up a position in the largest segment. Ingeneral, this division is the cash cow for the growth ofthe LNG and Offshore division.
LNG transport (17% of revenues, 29% of EBIT) The LNG transportation division transports liquidnatural gas in general under long-term contracts for customers. Exmar distinguishes itself from othertransport firms through the so-called LNGRV vessel,which has a regasification unit on board to convertliquid gas back to natural gas. Exmar aims to growrapidly in the LNGRV business, doubling its number ofships to 18 by 2016.
Offshore (11% of revenues, 8% of EBIT) Exmar undertakes a couple of activities in its Offshoredivision. Most importantly, it has developed OPTI-EX, a semi-sub offering a cheap solution for marginaldeepwater fields. It also operates an FPSO togetherwith CMB. Finally, Exmar undertakes marine servicesfor the offshore industry.
Risks On the downside, if Exmar fails to get contracts for itsLNG business of OPTI-EX, profitability will be underpressure in 2009. Low demand for LPG due to weak oilprices and GDP growth is another risk. On the upside,Exmar could come up with interesting contracts on gas orit could get one or more bidders for its OPTI-EX platform.
SWOT Strengths Leading position in LPG midsize segment Leading in LNGRV, the small regasification unit, alreadyin operation Innovative solution with OPTI-EX for marginaldeepwater fields Relatively good balance sheet offering furtheropportunities
Weaknesses Modest position in VLGC within the LPG transportmarket Focus on midsize LPG segment implies higherdependence on slow, volatile ammonia trades High dependence on two customers: Excelerate Energyfor its LNG business and TOTAL for its Offshorebusiness.
Opportunities High growth of LPG and LNG worldwide LNGRV could become a standard for regasification Gail and the Belgian governments offer further growthfor LNG business OPTI-EX could pave the way to unlock high value in theOffshore business, enhancing growth in otherbusinesses after Offshore’s separate listing
Threats Aggressive growth of new competition in LPG/LNGsegment, lured by high returns No contract yet for two LNG deliveries in 2009 Deep pockets of competitors in LNG business
Steps taken in 2006-07 support management’s growthambitions. We forecast a 27% 2006-09F EPS CAGR despite Fugro’s low risk profile within the sector. It should thereforebe valued at no discount to the European oil services sector.Fugro remains one of our favourite Benelux stocks. BUY.
Investment thesis
According to oil & gas consultants, E&P spending will continue to increase at double-digit rates over the coming years. Seismic is one of the high-growth areas with higher day rates and full utilisation of equipment worldwide.Besides more demand for greenfields, the improvement of quality of datagathering and processing due to better ships and better informationtechnology supports growth as this quality jump enables oil companies tosave on drilling costs, still representing 50% of total exploration expenses.
It is important for Fugro that the boom in seismic, which started in 2004/05,should be followed by demand for Survey a year to 18 months later, of whichwe saw the first signs in 2006 and the follow-up in 2007. Finally, a large number of drilling units, semi subs, etc, are ready for delivery. These mean an extra workload for Fugro with positioning and related services.
Demand for Fugro’s services is buoyant and, to follow this growth, Fugroinvested as much as €315m in 2007 followed by at least €350m in 2008F,50% more than 2006’s €225m. This capex is mainly for Remote Operated Vehicle (ROVs) and vessels, seismic, survey and geotechnical. Fugro will see the impact of this new equipment in a strong market environment not only in 2007, but also in 2008-09, in our opinion. Importantly, the newequipment is more productive and able to perform at higher rates. Althoughdepreciation will go up, EBIT margins should be higher. Also, Fugro was able to increase its personnel by 12% in 2007, of which we estimate 8-10% was organic. Therefore, unlike the rest of the industry, it seems that Fugro suffers from a serious shortage of personnel.
Overall, we expect organic revenue growth to continue at double-digit rates (20% in 2007F) and margins should increase as well (net: 12% in 2007F12.9% in 2008F). As a result, we estimate a 2006-09F EPS CAGR of 27%.
Key newsflow
Before the 2007 results, Fugro may announce add-on acquisitions with revenues of €5-40m, supporting growth by adding specialisation to itsservices. We believe Fugro also aims for a larger acquisition in 2008.
Valuation
Based on a 2008F EV/EBITDA of 8.2x, Fugro trades at a 15% discount to a peer group of European oil services companies. Given the EPS CAGRcombined with the resilience to margin pressure – thanks to its dominant market positions – we do not believe it merits a discount. This leads to a2008F EV/EBITDA of 9.5x and a TP of €67.5. Given this excellent outlook,Fugro is one of our top picks among Benelux small and mid-caps. BUY.
Main shareholders (%) ING Vezekeringen 10.11WAM Acquisitions 7.26Ir. G-J. Kramer 7.13
Share data No. of shares (m) 72.1Daily turnover (shares) 239,011Free float (%) 84.3Enterprise value (€m) 4,274.7Market cap (€m) 3,781.7
Newsflow
Date Description
07 March 2008 FY07 figures 14 May 2008 Trading update/AGM 8 August 2008 1H08 results 20 November 2008 FY08 trading update
Share price performance
253035404550556065
12/05 6/06 12/06 6/07 12/07PriceAEX All Share (rebased)
Company profile History Engineering firm Fugro was founded in 1962. Shortlythereafter, it had branches abroad. Since its listing,Fugro has made more than 100 acquisitions, the mostimportant being TGS Geosolutions, its main competitorin offshore survey.
Activities Fugro collects, processes and interprets data andprovides advice related to the oil & gas, constructionand mining industries. It now comprises three mainactivities: geotechnical services, survey andgeoscience. Fugro operates in 50 countries with a biastowards the US and Europe. It aims to make an 8.0-8.5% net profit margin in the medium term (2006:9.8%), which equates to an EBITA margin of 12-13%. Moreover, management aims to keep a healthy balancesheet with solvency of 30-35%, EBIT/interest >5x, andaverage annual EPS and CFPS growth of 10%.
Geotechnical (26% of 2005 revenues, 19% of EBIT) Investigates and advises on physical characteristics ofsoils and rocks both onshore and offshore. Hasdominant positions in certain geographical offshoremarkets. Onshore faces more local competition.
Survey (49%, 53%) Mapping topography and geological composition of theearth's surface, offshore and onshore, but offshoredominates with leading market positions. It also doessatellite positioning. This division is most related to theoil & gas industry.
Geoscience (25%, 28%) Gathering and interpretation of data and reducing costsof oil field exploitation. Three subdivisions: seismicactivities, reservoir modelling (field characterisation)and airborne survey. Airborne survey collectsgeophysical data for the mining and oil & gasindustries.
Risks Fugro depends on the development of the oil price. Asubstantial lower oil price (<US$35/bbl) could lead to lower demand for oil services and hit Fugro’sprofitability. Fugro is also partially dependent ongeneral economic conditions affecting the constructionsector, oil demand and search for natural resources.
SWOT Strengths Dominant market share in most of its businesses Worldwide operations, good geographical spread butlocal presence Well-managed company
Weaknesses Powerful customers with deep pockets Seismic position not very strong
Opportunities Oil services in a position to benefit from capex due tohigh demand for oil & gas and oil reserve issues Many acquisition opportunities in expanding market More demand for quality service providers andcustomers more open to implementing new technology Added-value in service portfolio could attract moresophisticated demand
Threats Volatility of oil prices, hike in capex always possible Oil firms creating ‘their own Fugro’ Competitors with deep pockets
2007 was a mixed year for Galapagos with disappointing 1H results from its services business followed by news ofimportant R&D alliances with J&J, GSK and Eli Lilly. We view2008 as a crucial year for investor sentiment as the companyplans to enter its first compound(s) into phase I trials.
Investment thesis
Galapagos operates a dual business model in which it supplies drug-discovery services to pharma and biotech companies and conducts in-house R&D into bone and joint disease. Its services business, BioFocus DPI, hasbeen boosted by a series of acquisitions since the company’s 2005 IPO andnow enjoys a top five position in the US$4bn-plus outsourced drug-discovery market. Galapagos’s long-term value, however, will be largely determined bythe success or otherwise of its internal R&D programmes in bone and jointdisease (rheumatoid arthritis, osteoarthritis and osteoporosis). Its internal capabilities and its pipeline were bolstered at end-2006 by the acquisition (for up to €32m) of the French bone disease R&D unit, ProSkelia. The mainendorsement of Galapagos’s internal R&D capabilities until recently was thesigning in 2006 of a turnkey deal with GlaxoSmithKline for the company’sosteoarthritis programme, worth up to €186m plus royalties. This wasdwarfed in October 2007 by the signing of an R&D alliance in rheumatoidarthritis (RA) with Janssen Pharmaceutica (part of Johnson & Johnson), which could be worth up to €1bn plus royalties. The Janssen deal (plussubsequent R&D alliances with GSK in anti-infectives and Eli Lilly in osteoporosis that could be worth, respectively, €219m and €275m plus royalties) means that Galapagos – if not its share price – ended 2007 on a high. This follows a tougher period in which the company had focused onintegrating the previous year’s acquisitions and attempting to improve theperformance of BioFocus DPI (the latter produced disappointing sales growth in 1H07). Risks to Galapagos include R&D setbacks and anunexpected deterioration in the drug-discovery market.
Key newsflow
Key upcoming newsflow will be both results-related (the 2007 results shouldreveal whether management was successful in restoring growth and profitability in BioFocus DPI to targeted levels) and pipeline-related. In the latter case, we expect the company to enter at least one compound intophase I trials (the first for RA and a second, possibly, for osteoporosis).
Valuation
We use an EV/sales methodology for valuing Galapagos, based on drug-discovery services peers, which yields our target price of €8.2. We expect to move to a sum-of-the-parts valuation in 2008, which will include an explicitNPV for the R&D pipeline. While such an approach may imply greater shareprice upside, we do not expect investors to give credit to the pipeline until thefirst drugs have entered the clinic and their profiles have been disclosed. _
Main shareholders (%) Dorset 9.4Abingworth 7.5ProStrakan 6.6Apax 6.0
Share data No. of shares (m) 14.4Daily turnover (shares) 2,099.0Free float (%) 59.4Enterprise value (€m) 100.1Market cap (€m) 114.8
Newsflow
Date Description
Jan 2008 2007 update 7 Mar 2008 2007FY results 1H08 Further services deals 2H08 RA compound into phase I
Company profile Overview Galapagos is a genomics-based drug-discoverycompany with a dual business model: supplying drug-discovery services to pharmaceutical and biotechcompanies; and conducting proprietary R&D into boneand joint disease.
Top five in drug discovery but internal R&D is key Galapagos’s BioFocus DPI services business ranksamong the top five in outsourced drug discovery with2007F revenues of >€50m, boosted by severalacquisitions. The company’s long-term value, however,will be driven by the success or otherwise of its internal R&D. Until recently, the biggest endorsement of its R&Dcapabilities was the signing in 2006 of a turnkey dealwith GlaxoSmithKline in osteoarthritis, worth up to€186m plus royalties. This was dwarfed in October2007 by the signing of a global R&D alliance in rheumatoid arthritis (RA) with Janssen (part of J&J),which could be worth up to €1bn plus royalties. In theshort term, this provides Galapagos with €17m of initialpayments, boosting its cash position and its 2007financial guidance. Over the medium to long term, thedeal allows Galapagos to accelerate its R&D effortswith much of the extra spending funded by milestonepayments. It also allows the company to retain greatervalue for certain programmes into which Janssen mayopt at a later date. In the immediate aftermath of thisdeal, Galapagos announced further R&D alliances withGSK (in anti-infectives; worth up to €219m plusroyalties) and Lilly (osteoporosis; €275m plus royalties).
Valuation & risks We use an EV/sales methodology to value Galapagos, based on drug-discovery services peers, which gives atarget price of €8.2 per share. We expect to move to asum-of-the-parts valuation in 2008, including an NPVfor the R&D pipeline (as up to two compounds areexpected to enter Phase I). While such an approachmay imply greater share price upside, we do not expectinvestors to give credit to the pipeline until the firstdrugs have entered the clinic and their profiles havebeen disclosed. Risks include an unexpecteddeterioration in the drug-discovery market and R&Dsetbacks.
SWOT Strengths Novel R&D programmes in bone and joint diseases Top-five market position in drug-discovery services
Weaknesses R&D programmes still early-stage Lacking in clinical development capabilities
Opportunities Multi-US$bn potential market for bone and joint diseasedrugs Sustained growth predicted for the outsourced drug-discovery market
Threats High risk of failure inherent in early-stage compounds Success of recent acquisitions unclear
In its strategic update due at the end of January 2008, we expect Gamma to focus on growing its top line, increasing profitability and enhancing current market positions. We do not foresee any fireworks from the update and therefore maintain our HOLD recommendation and €57 TP.
Investment thesis
We have a HOLD rating on Gamma as we see limited short-term triggers for the stock. After reaching its targets for 2007, we believe the company will focus on top-line growth, further improvements in profitability andstrengthening market positions in certain areas.
Top-line growth should come from: 1) Building strong positions in emergingmarkets such Asia, CEE and South America. Current exposure to emergingmarkets is limited at 10-15% of sales. 2) Focus on growth segments with ahigher growth profile. 3) Product innovation in all product segments.However, we believe organic growth potential is limited to around 3% due toa large part of the portfolio being related to low-growth activities (c.40% of sales).
Profitability improvement: We believe Gamma will lift both of its divisions’EBIT margins by 1ppt, implying the following targets for 2010: Technologiesfrom 8% to 9% and Comfort & Style from 9% to 10%. In terms of ROCEtargets, we expect an increase from 15% to 18%. In order to achieve thesetargets, we expect the company to optimise its production by transferringproduction to low-wage countries and sharing production platforms.
Strengthening market positions: We estimate that the company has aremaining war chest in the range of €50-80m. We would welcome acquisitions in the anti-ballistics, belting and filtration sectors.
The acquisition of Danish company Uni-Chains in early December demonstrates that Gamma has made a start on its new strategy. Active inthe modular plastic conveyor belt market, Uni-Chains has been achieving annual sales growth of 10% compared with Gamma’s 3%. This acquisitionfocuses on growth, reinforces Gamma’s market positions in the beltingsector and could be a taste what lies in store in the strategic update.
Key newsflow
Gamma is due to issue its strategic update at the end of January 2008. In our view, this update will provide limited triggers for the share price, as the market is already anticipating positive news from it.
Valuation
Gamma has changed its portfolio considerably over the past few years, with more focus on growth and higher profitability. The stock is currently trading at a 2008F PER of 9.4x compared with a historical average of 7.8x. Our sum-of-the-parts valuation yields a value of €59, in line with our DCF (€58). We maintain our HOLD recommendation with a TP of €57. _
Main shareholders (%) ING Groep N.V. 26.49Kempen Capital Management N.V. 10.59Fortis Utrecht N.V. 8.12Aviva plc 5.49Allians SE 5.23
Share data No. of shares (m) 7.4Daily turnover (shares) 241.0Free float (%) 44Enterprise value (€m) 634.5Market cap (€m) 403.6
Newsflow
Date Description
31 January 2008 Strategic update 22 February 2008 FY07 figures 23 April 2008 1Q08 trading update 28 April 2008 Ex-dividend
Share price performance
30
40
50
60
70
80
12/05 6/06 12/06 6/07 12/07PriceAEX All Share (rebased)
Gamma Holding develops, manufactures and sellstextile-based products throughout the world. The groupcomprises two divisions, Technologies and Comfort &Style. The company is active in around 40 countriesand employs approximately 6,700 people. In 2003, itrefocused its strategy and divested a number ofactivities such as its curtain fabrics, wall decoration andcar fabrics businesses. The bulk of its sales aregenerated in Europe (48%), the US (25%) and Africa(14%). Gamma Holding is headquartered in Helmond.
Technologies (2006: 64% of sales, 54% of EBIT) Technologies consists of four companies: Belting,Filtration, Coating & Composites and Sailcloth. Beltingmanufactures process and conveyor belts and isnumber-two worldwide. Filtration produces anddistributes screen and filter products. Coating &Composites manufactures coated fabrics andcomposites such as roofing, tents and printable mediafabric. Sailcloth is active in the sailcloth technologyindustry and is the global market leader.
Comfort & Style (2006: 36% of sales, 46% of EBIT) Comfort & Style comprises two business units,Sleepcare and Exotic Fabrics. Sleepcare is engaged inthe production of mattress ticking, and is number-one in Europe and number-four in the US. Exotic Fabricsproduces colourful dyed and printed fabrics for theWest African market.
Risks Currency risk: Around 40% of Gamma Holding’s salesare euro-denominated. The other main currency is theUS dollar, at c.23%. From an operational perspective,at least two-thirds of cash flows are hedged at thegroup level; we estimate around a €20m US dollar cashflow is hedged over a six- to 12-month period. In addition, the company finances foreign operations,where possible, through local currencies. This isdemonstrated by the 40% debt level, denominated inUS dollars. Translation risks are not hedged. Political risk: The main political risk for the companyrelates to the Exotic Fabrics division, which operates in West Africa.
SWOT Strengths Restructuring of production capacity towards low-wage countries should pay off in the coming years. Strong position in the Sailcloth industry The Exotic Fabrics strategy is paying off
Weaknesses Sleepcare has demonstrated sluggish growth and anerosion of margins
Opportunities Divestments could reinforce divisions such as Coating& Composites
Threats Rising raw material prices High exposure to the US dollar
Although we expect Grontmij to turn the Carl Bro acquisitioninto a success given the many cross-selling opportunities, we believe the uninspiring 3Q07 results (which underlined the limited predictability of its earnings) and economicuncertainty will continue to weigh on valuation levels. HOLD
Investment thesis
We reiterate our HOLD recommendation on Grontmij and lower our targetprice from €32 to €27. Grontmij reported mixed 3Q07 results, which oncemore underlined that the quality of earnings is low due to the largecontribution of income from participations. The EBITA margin over the firstnine months came in at 6.7%, up 70bp versus 6% in 9M06. However, stripping out the income from participations, the margin drops to 3.5% (versus 5.1% in the comparable period in 2006). As Grontmij does notdistinguish between engineering work done for third parties and minorityprojects on the one hand and own projects on the other, the market has great difficulty in accurately forecasting the income from participations. Notethat revenues relating to the income from participations are not taken intoaccount, which makes margin comparisons and/or forecasting margin trendsfoolhardy. On the positive side, we like the Carl Bro acquisition, which hasnot only performed strongly so far during 2007, but, in our view, offers amplesynergies between the two companies. Although there are many possiblecounter-arguments against the potential success of top-line synergies, we strongly believe that engineers by nature like to share knowledge. Therefore, the workforce naturally supports Grontmij’s corporate strategy, which emphasises optimising these kinds of cross-selling opportunities. We expect Grontmij to start reaping the benefits as of 2008. Finally, the general market view remains positive. Grontmij’s current order portfolio supports bettermargins and utilisation rates. In most Western European markets, bothgovernments and private clients increasingly focus on design-build-maintain contracts, where clients offer engineering firms the opportunity to be involvedat an early stage, which should increase the added value delivered byengineering firms and push margins upwards.
Key newsflow
Grontmij is due to report FY07 results in March. We expect net profit toincrease by 56% YoY mainly due to the consolidation of Carl Bro. Moreimportantly, we expect a positive view on market conditions in 2008 and apotential reduction of its D&O division would be applauded by the market.
Valuation
Grontmij suffered badly from the recent equity market turmoil; the stock haslost 43% since its peak in August. In light of the general concerns regardingthe EU construction market, Grontmij’s valuation levels have returned to a historical sector discount of about 20%, trading at 6.8x 2008F EV/EBITDA.Given the economic uncertainty, we believe this discount is warranted asGrontmij is smaller, less diversified and less profitable than its peers. _
Main shareholders (%) Delta Deelnemingen 11.4ING Group 5.9Capital Research and Management C. 5.2Aviva 5.1
Share data No. of shares (m) 18.1Daily turnover (shares) 5,177.0Free float (%) 53.6Enterprise value (€m) 398.6Market cap (€m) 435.8
Company profile History Grontmij is an engineering firm comprising theConsultancy & Engineering (FY06: 90.5% of revenuesand 111% of EBITA) and Development and Operations(9.5-11%). 58% of Grontmij's FY06 revenues weregenerated in the Netherlands, 11% in Belgium, 10% inDenmark, 8% Sweden, 7% Germany, UK 5%. Theacquisition of Carl Bro was concluded in August 2006,increasing Grontmij's revenues by more than 70%.
Consultancy & engineering Consultancy & Engineering is the backbone ofGrontmij's consultancy services on infrastructure andconstruction works for national, regional and localgovernments and private companies. With Carl Broenergy, general building and water become moreimportant at Grontmij.
Development & Operations (almost sold) Development & Operations develops and realiseslandscaping, parking garages, distribution centres and residences on a small scale. Grontmij has almostdivested D&O business including real estate in theNetherlands, abroad and activities related to waste. Bythe end of FY06 €39m was the remaining part of D&Oon its balance sheet.
Risk factors Operating an engineering firm involves attracting andmaintaining skilled employees, which is a key challengein Western Europe where a shortage of labourdominates. The pricing environment is sensitive togeneral economic conditions in its relevant end-markets. A company-specific risk is the fact that giventhe size of the Carl Bro acquisition, we believe Grontmijis exposed to integration risks.
SWOT Strengths Strong market positions in Benelux and Scandinavia Around 35% of the business relates to public spending
Weaknesses Internationally a relative small engineering firm Financial disclosure
Opportunities Successful integration of Carl Bro LT growth trends in indfra and complexity of projects r
Threats Market recovery in volume not in pricing Integration failure with regard to Carl Bro acquisition
The triple profit warning triggered by the Building unit is anisolated now fully provisioned for, problem. In our view,marking down the remainder of Heijmans’ business is driven by emotions, not facts. Hence, we reiterate our BUYrecommendation and €32 target price.
Investment thesis
Our bullish view on Heijmans arises from the following: (1) the problems inthe Dutch Building division were an unpleasant combination of events. Contracts signed in 2005 did not anticipate sharp cost inflation goingforward, this, in our view, is an industry-wide problem. Simultaneously, the relationship between contractors and the government became moreprofessional as a direct result of the Dutch construction fraud investigations,which at the time were perceived as providing a market opportunity for largecontractors. Thus, Heijmans changed its Building division’s strategy,focusing it on large more complex contracts, rather than locally oriented ones. The impact of having insufficient management experience and/or theright risk management systems was devastating. However, we stronglybelieve the market has misinterpreted events: (1) the Dutch Building divisiongenerates annual revenues of c€800m, half of which relates to buildinghouses for the Property division, while another 10% relates to maintenancecontracts; meaning that only €300m is related to wrongly priced contracts inthe non-residential business. Heijmans total loss provision of c.€90m is sufficient to cover cost inflation; (2) although Heijmans’ communication doesnot deserve any applause, the argument that this could also happen in theInfra division is unwarranted. Infra is used to dealing with large complexcontracts and should be seen separately from the events in the Building unit(3) over the last three years the Property division has represented around50% of group EBIT, as Heijmans offers a one-stop-shop offering in the Dutch residential market this provides a clear floor in earnings generation.
Key newsflow
It is absolutely vital that Heijmans restores confidence to the market;essentially any statement and/or target management communicates to themarket should be conservative and thoroughly risk-assessed.
Valuation
Assuming a 2% sales decline and virtually no divisional marginimprovement, we see Heijmans reporting a 2008F net profit of €90.7m. Our earnings forecast translates to a 6.8x 2008F PER, 24% below its 15 yearaverage. Our SOTP and DCF-based €32 TP suggests a target 2008F PER of 8.5x (5% discount). Ignoring the development of Heijmans’ businessesover time and an appropriate re-rating, our TP expects valuation levels toinitially rebound towards the average of its Dutch peers. The historicpremium based on Heijmans PER multiples stands at 20%, validated by itsrelative high exposure to above average profitable residential propertydevelopment. Lastly, we like its attractive dividend yield of 5.7%. _
Main shareholders (%) A van Herk 12.1F van Lanschot 9.3Aviva 8.6Ducatus 6.5
Share data No. of shares (m) 24.1Daily turnover (shares) 47,069Free float (%) 95.0Enterprise value (€m) 1,150.3Market cap (€m) 612.9
Company profile History Heijmans is one of the Netherland's larger listedproperty development, construction and infrastructurecompanies. It also operates in Belgium, Germany & theUK. At end-2006, it had 9,189 staff, a turnover of€2.98bn and net earnings of €82.5m beforeextraordinaries.
Property (27% of sales) Property initiates, develops and realises homes &offices, industrial estates, retail premises, schools andhealthcare institutions. It also develops concepts forparticular market sectors, such as housing,penitentiary, education market, healthcare, and sport &leisure.
Infrastructure (25% of sales) Infrastructure is split into two divisions: infrastructure(road & pipeline construction), and concrete & hydraulicengineering. The state of the market is largelydependent on large projects. Projects such as HSL(high-speed train connection to France) and Betuwelijnare finalised and new projects should take over.Besides Heijmans dominates the Dutch asphaltproduction market.
Construction (26% of sales) Construction builds, renovates and maintains homesand non-residential buildings, such as retail premises,offices, schools, healthcare institutions, stations andairports. The organisation has a network of firmsproviding construction services for local and nationalclients across the Netherlands.
International (22% of sales) Heijmans Belgium is active in all market segments(property, building housing and non-residential, roads and pipeline construction. Heijmans Germany (rail)made up a fraction of foreign turnover last year butrecently added a substantial road builder to itsactivities. Heijmans UK is active via Leadbitter andDenne in social housing and healthcare.
Risk factors Heijmans’ earnings strongly depend on the Dutchresidential market, which is driven by LT interest rates,consumer confidence and demographic changes.Heijmans’ business model incorporates large multiple-year construction contracts, execution risk, as well aswrongly priced contacts, can have serious impacts onthe group’s overall results, and therefore on ourearnings estimates.
SWOT Strengths One-stop-shop offering in Dutch housing market Strong position in Dutch road building market
Weaknesses Slow transformation towards high added value business Balance sheet
Opportunities Fragmented Benelux construction markets Integration challenge of recent acquisitions
Threats Contract risks increasingly migrate to pure contractors Severe cost inflation in Benelux building markets
The 9M07 results were in line with expectations; 2007 haswitnessed important acquisitions. The share offers aninteresting revaluation potential and a low risk profile, but is vulnerable to higher interest rates given its intrinsically lowyield.
Investment thesis
Home Invest company guidance eyes flat 2007, 2008 and 2009 net current EPS at €2.38, €2.32 and €2.36, respectively, whereas our estimates (€2.35, €2.60 and €2.63) expect a small earnings rebound in 2008 on theback of new investments gaining momentum. The company also confirmedthat dividends would grow above inflation (€2.30, €2.36 and €2.42, our estimates at €2.29, €2.34 and €2.38), but on a consolidated basis this implies a high payout ratio. Actual payout is likely to be small, given the impact of realised and unrealised capital gains.
New acquisitions include the Immobilière Van Volxem (residential complexconsisting of 33 flats, small office premises and underground parkingfacilities), a residential portfolio in Liège (69 apartments) and a large portfolioin Brussels (three existing assets and a building to be completed in 2008) fora total consideration of c.€.51m (property portfolio as of end 2006 at €145m).No financial details have been disclosed on the latter, but all acquisitionsoffer satisfactory yields (4.9%, 8.0% and 5.8-6.0%).
The modest indebtedness (LTV as of end 2007F expected below 40%)allows a leveraged investment potential in excess of €100m.
Key newsflow
FY07 results as such should not bring major surprises. More interesting willbe the new earnings guidance of the company for 2008-09 following the above-mentioned acquisitions. More information on the large Brussels portfolio recently acquired will also be eagerly awaited.
Valuation
The shares offer an interesting revaluation potential and a very low riskprofile, but is vulnerable to higher interest rates given its intrinsic low yield.Our DCF-based target price is down to €53 (€60 previously) as a result of ahigher risk-free rate. _
Main shareholders (%) AXA group 20.2Arco group 4.7
Share data No. of shares (m) 2.2Daily turnover (shares) 300.0Free float (%) 68.5Enterprise value (€m) 175.9Market cap (€m) 106.2
Newsflow
Date Description
7 March 2008 FY results 7 May 2008 AGM 16 May 2008 Dividend payment
Company profile History Established and listed in 1999, Home Invest Belgiumprimarily invests in residential properties in Belgium andwas until the recent IPO of Aedifica, the sole BelgianSICAFI (REIT-like structure) entirely devoted toresidential property.
Property portfolio The property portfolio as of end-June 2006 consisted of69 buildings in 31 different sites across Belgium. Mostof the portfolio is located in the Brussels area (78.2%),but its weight is gradually diminishing thanks toselective acquisitions in Flanders (6.8%) and Wallonia(15.1%). Non-residential areas (17%) are mainly officeand retail areas integrated into residential buildings. Since 2005, the property portfolio has witnessed stronggrowth. The purchase of the important Giotto buildinginitially weighed on results given its low occupancy butit is now fully let. Overall average occupancy for 9M06was 96.2% and even above 97% in 3Q06. In otherwords, market conditions, said to be tougher, have notresulted in a higher vacancy. The company aims tofocus on buildings and tenants of higher-than-average quality, but without falling in the high-end segment.
Finance It recently announced a limited disposal programme(Liège) to regularly ‘materialise’ the sizeable non-cash capital gains it books on its investment portfolio.Decisions to invest and divest will be made on anopportunistic basis. The recent capital increase isaimed at sustaining current growth while limitingindebtedness under 50% (legal ceiling at 65%) as thecompany believes the property yield/financing costsdifferential is too small for residential property to justify a high indebtedness.
Risks New investments offer property yields only slightlyabove financing costs. The Belgian residential rental market is quite small andheavily dependent on Brussels as an attractiveinternational business location. The modest size of the company weighs on the liquidityof the share despite the recent capital increase.
SWOT Strengths High quality and well diversified portfolio despite itsmodest size Very low risk and good diversification
Weaknesses New investments offer property yields only slightlyabove financing costs Modest market cap despite the recent capital increase
Opportunities Growth opportunities in a sector with fragmentedownership Opportunistic disposal programme
Threats Belgian residential rental market small (78% ownership) and relying heavily on Brussels as an attractivebusiness location
Hunter Douglas is the market leader in window coverings anda major manufacturer of architectural products. Thanks to itsleading positions, pricing power is strong. Looking at growth, after the slowdown in the US, market conditions in Europeare also weakening; hence our cautious view on the stock.
Investment thesis
Hunter Douglas is highly sensitive to housing markets in both the US andEurope. Exposure to the US is high representing close to 50% of sales andin EBIT terms even more due to its relatively high profitability in the US.Looking at market conditions in the US, slowdown started in 3Q06 withnegative volume growth of 4%. We believe the situation has now started to stabilise, with negative growth of 2% in 3Q07.
Regarding Europe, the housing market slowdown and lower consumerconfidence have also started to have an impact, with volume growth slowingfrom 10% in 2Q07 to 2% in 3Q07. Looking further ahead we believe market conditions will remain weak in 2008. However, we expect Hunter Douglas tosurvive them relatively well due to its market-leading positions and attractiveacquisitions. Its market-leading positions offer the company room to increaseprices, and for 2008 we expect similar increases to those made in 2007.(Hunter Douglas increased its prices in Europe by around 4% at thebeginning of January 2007 and in the US by 3-4% in July 2007.) Regarding acquisitions, there is still plenty of room as the market is highly fragmented, and Hunter Douglas’s warchest is very well filled. Company is in fact debtfree taking into account its huge investment portfolio.
We do not expect any news on the shareholder structure in the short term.(CEO Ralph Sonnenberg has increased the family’s stake from 50% toaround 80%.)
Key newsflow
Focus will be on the release of the 2007 figures in March and news onhousing markets and consumer confidence in Hunter Douglas’s mainmarkets, the US and Europe. Following recent negative signals in both areas, we have reduced our EPS estimates from US$8.12 to US$8.00 for2007, from US$9.10 to US$8.45 for 2008 and from US$9.57 to US$8.95 for2009. Our estimates imply more or less flat EBIT levels for 4Q07 and arebased on volume growth of 1% for 2008.
Valuation
Although Hunter Douglas is one of the cheapest stocks in our universe,trading at a 2008F EV/EBITDA of 6.0x, we believe its risk profile is relativelyhigh given the current turmoil, particularly in the US. Risks to our investment case include a further slowdown in the US and Europe and losses on thecompany’s investment portfolio. _
Main shareholders (%) Sonnenberg family 80%
Share data No. of shares (m) 42.5Daily turnover (shares) 45,068Free float (%) 28.0Enterprise value (US$m) 2,514.2Market cap (US$m) 3,117.4
Newsflow
Date Description
10/03/2008 FY07 figures
Share price performance
404550556065707580
12/05 6/06 12/06 6/07 12/07PriceAEX All Share (rebased)
Hunter Douglas is the world market leader in windowcoverings and a major manufacturer of architectural products. The company comprises more than 157manufacturing and assembly plants, and marketingorganisations in more than 100 countries.
Strategy The company’s strategy is to grow the market and itsmarket share by continuing to introduce innovative,proprietary products and by expanding its presence inkey geographical areas. Add-on acquisitions are alsopart of its strategy. Focus is primarily on upscaleconsumers, and Hunter Douglas’s strength is incustomising each window covering to meet theindividual consumer’s specific needs.
Activity by sales Looking at geographical areas, Europe accounts for37% of sales, North America 49%, Latin America 5%,Asia 5% and Australia 4%. Looking at the product mix,window coverings generate 89% of sales andarchitectural products 11% of sales. In addition to theseactivities, Hunter Douglas has a well diversifiedinvestment portfolio of €575m at year-end 2004.
Risks Risks to our recommendation include a furtherslowdown in the US housing market and an economicslowdown in Europe. In addition, new competition fromlow-wage countries could be a risk.
SWOT Strengths The company has market-leading positions in Europeand the US. Operations are highly profitable (EBIT margin of closeto around 13%) and have highly cash-flow-generativepower. Strong balance sheet (after the deduction of theinvestment portfolio), debt free
Weaknesses Very limited free float (around 30%)
Opportunities Market is highly fragmented, offering room foracquisitions.
Threats Increasing competition from low-priced ready-made window coverings from Asia. Increasing number of imported low-cost assembledproducts from Eastern Europe. Slowdown in the US housing market. Declining consumer confidence.
Investments in R&D and marketing will weigh on IBA’smedium-term margins. We remain convinced by the soundrationale of investing in the promising proton therapy, but seeno trigger until 2H08, when concrete results may becomevisible.
Investment thesis
IBA is a healthcare equipment manufacturer focused on cancer treatmentand diagnosis with a leading position in the nascent proton therapy (PT),which is one of the most effective cancer treatment technologies. IBA is alsoamong the leaders in the distribution of Fluorodeoxyglucose (FDG), aradioisotope tracer used with PET scanners in cancer diagnostics. Expected top-line growth is underpinned by: (1) the increasing awareness of PT’medical benefits; (2) the growing installed base of PET scanners; and (3)governments tightening regulation regarding safety of radiotherapy usage.
The PT market amounts to 25 units, 14 of which are IBA’s, making it theclear market leader. We expect three centres will be sold annually at €40m each in future years, driven by a high-level of reimbursement policy and anincreasing standardisation of the treatment procedures. The EuropeanMolecular Imaging (FDG) business reached breakeven in 2007 thanks to theopening of many production centres. This will trigger a strong recovery ofprofitability of the whole FDG activities which is set to increase from anegative operational result to an 8% EBIT margin by 2008F.
In September 2007, IBA announced its intention to acquire CIS BIO for atotal consideration of c.€20m. Management seems confident it can close thetransaction before 6 March (FY07 results), indicating a 10 monthconsolidation. We believe the price paid is cheap in view of the amount ofstrategic importance of certain assets and the net cash position of the company but expect a negative impact in the short term as (1) our prudentestimates for CIS BIO reflect a -€1m contribution to the group’s FY08 EBITand (2) the deal will blur visibility and comparability of FY08 numbers.
Key newsflow
In the past, the key newsflow has been predominantly driven by PT contractannouncements. But now that we feel that the PT prospects are priced in,investors’ attention should focus on the profitability of the FDG activities.
Valuation
We have revised our 08F and 09F EPS estimates downwards by 17% and16% to reflect (1) a respective 5% and 6% lower EBIT due to the shortfall innumber of PT centres sold last year and (2) we switched from using thenumber of shares outstanding to the fully diluted number of shares as the vast majority of warrants are deep in the money. As a result, we revised ourDCF-based target price from €22 to €21 and maintain our HOLDrecommendation. At our TP, IBA trades at a 2008F fully diluted PER of 28.8x, and EV/EBITDA 08F of 14.4x – a c.15% premium to peers.
Main shareholders (%) Belgian Anchorage 31.4IRE 3.5Sopartec 2.5
Share data No. of shares (m) 28.3Daily turnover (shares) 30,080Free float (%) 60.7Enterprise value (€m) 431.0Market cap (€m) 525.1
Company profile A leader in the use of particle-accelerator technology,and advanced physics and chemistry for industrial andmedical markets, IBA uses its unique technologicalexpertise to deliver solutions in the field of cancerdiagnosis and therapy. This expertise has beenexpanded and consolidated through organic andacquisitive growth. As a result of high debt, IBA sold its major and only profitable division on an operational level, sterilisation &ionisation (65% of 2004 revenues). This considerablylowered the overall risk profile of the company. The company’s remaining two divisions reflect itsintention to focus on its core activities related to cancer.
Technology & equipment (46% of 2008F sales) IBA commercialises a wide choice of particleaccelerators with prices up to €50m. Protonaccelerators are used for cancer treatment (protontherapy) and radioisotope production. Electronaccelerators are used in sterilisation and ionisation(Rhodotron, Dynamitron and Betaline). IBA alsodevelops ancillary equipment called dosimetry unitswith a great deal of success.
Radioisotopes (30% of 2008F sales) Production and distribution of radioisotopes is a fast-growing, but low-margin, activity in IBA’s portfolio.Radioisotopes are used for one basic application –diagnostic imaging (PET).
CIS BIO (24% of 2008F sales) CIS BIO is a French company in the middle of aturnaround. CIS BIO has three activities complementary to IBA’s: (1) the production anddistribution of SPECT (48% of 2007F sales); (2)production centres located in France (20% of 2007Fsales) and (3) production of In Vitro diagnostics and InVitro drug pre-screening toolbox. IBA announced its intention to acquire the company; we expect CIS BIO tobe consolidated 10 months in 2008.
Risks Risks include: (1) increased execution risk following thestrong order intake in PT; (2) the entrance of newplayers in the PT business; and (3) earnings volatility,as sales are dependent on the amount of PT systemssold.
SWOT Strengths Technological leadership in particle accelerators Active on growing non-cyclical markets
Weaknesses Poor value creation track record Competing in a market of giants
Opportunities PT maintenance fees to rise New in line dosimetry equipment
Threats Further cuts in reimbursement policy in the US CIS Bio turnaround could take more time than expected
With the first signs of a recovery for the back-end, its wafer inspection sales set to pick up in 2008 and an ongoing sharebuyback, we would advise investors to use ICOS’s share price volatility to find an entry point to enjoy a strong 2008F. BUY.
Investment thesis
With over a 70% market share, ICOS is the world’s leading manufacturer ofvisual inspection equipment for the semiconductor packaging industry.
In 2004, ICOS entered several new market segments, which together morethan doubled its addressable market. The biggest one, the wafer inspectionequipment market, has recently been described by management as largerthan the component inspection equipment market, which ICOS dominates with a c.80% share. We believe that ICOS has expertise in componentinspection, which will enable it to gain at least 50% market share in waferinspection in the medium term. We expect its wafer inspection sales toaccelerate in 2H07, since it released an important new 2D-3D wafer inspection machine in July 2007, which we expect to be very successful.
In 2004, ICOS also entered two small high-volume, high-growth segments where visual inspection is still mainly done manually: solar cells (for solar panels) and flex tapes (for flat panel screens).
The new segment entered into in 2004 should contribute significantly to2007F revenues (we forecast c.50%) and future growth, while ICOS’s corecomponent inspection market should still grow in the high single-digits. As a result, we expect at least 20% pa organic revenue growth over the next fiveyears, assuming mid-cycle conditions.
ICOS enjoys one of the highest gross margins in the industry (c.55-60%). It has a very flexible operating model (very helpful in a highly cyclical industry),with a low fixed-cost base, mainly due to its Chinese assembly operations.As a result, ICOS’s operating margins typically vary between 10% and 35%throughout the semi cycles.
Key newsflow
Apart from results and quarterly guidance, newsflow is usually very limited.However, ICOS recently announced two large orders for solar cell inspectionequipment. As this business activity is expected to gain in size, we wouldexpect more announcements in the months to come.
Valuation
We rate ICOS a BUY with a DCF-based target price of €40 per share. At our target price, ICOS would trade at 2008F multiples of 16.3x PER, 10.9x EV/EBIT and 9.3x EV/EBITDA roughly a 10% premium to peers, which isjustified in view of ICOS’ dominant position in its niche market, above-average margins and the strong growth expected from WI machines.
Main shareholders (%) Verjans Joseph (founder) 14.1Smeyers August (founder) 6.0Deproft Anton 2.9Vervoort Guido 1.4
Share data No. of shares (m) 10.5Daily turnover (shares) 13,857Free float (%) 74.2Enterprise value (€m) 237.9Market cap (€m) 324.7
Newsflow
Date Description
21 Feb 2008 FY07 results 24 April 2008 1Q08 results 24 Jul 2008 2Q08 results 23 Oct 2008 3Q08 results
Company profile With a 60-70% market share, ICOS is the leadingmanufacturer of equipment to visually inspect chippackages. The main functions of a package are toprotect the chip, connect it to the outside world andhelp dissipate heat. ICOS’s machines check thatconnectors are correctly positioned, the correct size,and not bent or damaged; they can also check packagesurface and identification marks. Headquartered in Leuven (Belgium), ICOS wasfounded in 1982 as a spin-off from Leuven University’sImage Processing Lab. It launched an IPO in 1997, andits shares are listed on both NASDAQ and Euronext.While most of the manufacturing of high-value-added components is done in Belgium, component handlerand final assembly are carried out in China. R&Dcentres are located in Belgium, Germany and HongKong.
Systems (82% of 2007F sales) 70-80% of ICOS’s revenues come from the sale ofstandalone inspection systems, which includeinspection modules as well as mechanical handling,sorting and taping devices. Prices range from about€120,000 (tube-based inspection machine) to €800,000(wafer inspection system). ICOS sells them to leadingchipmakers, packaging subcontractors and flex tapemanufacturers.
Modules (18% of 2007F sales) Board-level modules (€4,000-10,000) only include thecore inspection engine (board containing imageprocessing algorithms). System-level modules (€15,000-100,000) include several board-level modules, as well as a PC with interfacing software,cameras and illumination devices. Equipment makersintegrate modules into their systems to pick and placecomponents.
Risks Risks include: the highly cyclical nature of the market;entry into new and more competitive markets, whichcould result in margin pressure; and scannertechnologies litigation.
SWOT Strengths High barriers to entry in core market Highly flexible business model
Weaknesses Sector cyclicality Currency exposure
Opportunities Entry into fast-growing niche markets Net cash position
Threats Margin erosion in Wafer Inspection Competing against large players in Wafer Inspection
We like Imtech for its combination of recovering end marketsand mix improvements accelerated by a methodical bolt-on acquisition strategy. Furthermore, we believe the business’s late-cyclical nature is underestimated by the market, with theshares trading at a humble 9.7x 2008F PER.
Investment thesis
Imtech is a large technical services company boasting market-leading positions in Germany, Belgium and the Netherlands. It also has very profitable niche operations in Spain and the UK. Earnings are currentlydriven by: (1) increased spending on buildings from both industry and thegovernment; (2) Imtech’s ICT division is profiting from growth in the costs ofimplementing IT solutions as a percentage of total building costs; and(3) Imtech’s impeccable bolt-on acquisition strategy provides additionalgrowth and, more importantly, mix improvements. For instance, last yearabout 15% of Imtech’s sales and 22% of EBITDA came from acquisitions. This year, Imtech added nine companies, or 9% to sales and approximately16% to EBITA. Management targets €5bn in sales in 2011F (vs the old €3bn target in 2008F) and a group EBITA margin of 6% to be reached whenmarket conditions are favourable (after holding costs, this translates to anEBITA margin of about 5.6%). We believe the late-cyclical nature of Imtech’s business is underestimated by the market, and we expect it to reach thetargeted EBITA margin in 2008F. Our 2008F EPS forecast is 11% aboveconsensus. Please note that our model excludes future acquisitions, but thereality will likely be different as the company has ample room for furthertakeovers (we estimate a war chest of c.€200m).
Key newsflow
Apart from press released orders, which have a limited impact on share priceperformance, we expect acquisition announcements, which should act as ashare price catalyst. Regarding general newsflow, we note that the shareshave fallen 28% in recent months on fears over Imtech’s German exposure(not warranted given its close relationship with large industrial players inGermany, making it less vulnerable to the general construction market).Negative newsflow from the Spanish and Irish construction markets has also added to the negative sentiment – also unwarranted as Imtech derives thelion’s share of its business in Spain from oil & gas clients, while its recentacquisition in Ireland involves exposure to the pharmaceutical industry.
Valuation
The stock trades at a 2008F PER of 9.7x and a 2008F EV/EBITDA of 6.2x.We regard these valuation levels as modest as our forecasts excludeacquisitions, while Imtech has the opportunity to take over companies indifferent geographical areas and in different activity clusters. We do not fear inflated M&A multiples as Imtech often acquires family-owned businesses or companies looking for a strategic partner to facilitate future growth. Wereiterate our BUY recommendation and €25 (DCF-based) target price. _
Main shareholders (%) ING Group 12.2Fortis 8.5Aviva 8.5Delta Deelnemingen 5.1
Share data No. of shares (m) 78.8Daily turnover (shares) 128,175Free float (%) 100.0Enterprise value (€m) 1,351.8Market cap (€m) 1,306.8
Newsflow
Date Description
Early January 2008 New Year speech 26/02/08 FY07F results 10/04/08 AGM 14/08/08 1H08F results
Share price performance
81012141618202224
12/05 6/06 12/06 6/07 12/07PriceAEX All Share (rebased)
Company profile Imtech, former Internatio Muller, is a holding firm with technical services for many industries, comprising fourclusters: Benelux; Germany; UK & Spain; and ICT &technology. Its serviced segments are commercialbuilding (15%), government building (18%), industry(28%), infra (12%), healthcare (12%), maritime (9%)and telecom (6%). Imtech aims to become a leading European servicescompany offering a complete services package with strongholds in selected European countries. It targets€3bn in revenues in 2008 (2006: €2.8bn) on the back oforganic growth and selective acquisitions. It alsotargets a group EBITA margin of 6% (before holdingcosts), with its four clusters at 5%, 5%, 5% and 8%,respectively.
Benelux (32% of revenues, 24% of EBITA) This cluster comprises Imtech’s electrical andmechanical engineering activities in the Benelux. Itholds a strong position in Belgium and a leadingposition in the Netherlands.
Germany (30% of revenues, 27% of EBITA) Imtech is one of the leading technical service providersin the very fragmented German market. It boasts astrong position with large industrial German companies,which also provides it with a stepping stone intoEastern Europe.
UK/ Spain (12% of 2006 revenues, 18% of EBITA) This cluster comprises Imtech’s electrical andmechanical engineering activities in the UK and Spain.Imtech is very successful in the greater London area,involved in several landmark projects. In Spain, the backbone of the business relates to high-margin maintenance, but Imtech is growing in morecommoditised projects.
ICT/technology (26% of sales, 32% of EBITA) This is a Europe-wide activity, with a large part of thebusiness coming from the Netherlands and Germany, comprising ICT, technology and telecom services.Imtech has recently derived roughly 11% of group salesfrom the international marine market (Radio Holland). Ingeneral, the activities involve full-service contracting,integral services and offering system technology.
Risk factors 1) If Imtech fails to achieve its long-term margin targetsin a favourable economic environment, this wouldtrigger a de-rating of the stock. 2) Integration risksrelating to its bolt-on acquisition strategy. 3) In general, the business is highly dependent on industrial andconstruction activity in Germany and the Benelux.
SWOT Strengths Market leader in Benelux and Germany Special know-how (marine, energy, healthcare, etc)
Weaknesses Basically a local-for-local business model Late-cyclical business strongly related to GDP growth
Opportunities Imtech is an active consolidator More integrated solutions (technical, mechanical & ICT)
Threats Competitors’ power (big construction & industrial firms) Finding skilled employees could be a growth constraint
We think Kendrion is taking the right strategic steps with therecent acquisition of Linning and the sale of Metal. From anoperational point of view, we believe the company remains vulnerable to disappointment, hence our HOLD rating. We feelKendrion needs more time to rebuild its track record.
Investment thesis
We have a mixed view on the stock, as we believe that from a strategic pointof view the company is taking the right steps, but recent figures show thatoperationally it is vulnerable to disappointment. Therefore, we believeKendrion needs more time to rebuild its track record.
Positive: setting the right strategic steps. In terms of its focused accelerationstrategy (reducing core activities from three to two), we believe Kendrion issetting the right strategic steps with the recent acquisition of Linning anddisposal of Metal. Linning is a worldwide participant in the market forelectromagnetic clutches for engine cooling and air conditioning in buses,especially in the luxury segment. The company has many long-term contracts and is highly efficient. In geographic terms, Linning also hasoperations in Mexico and the US, while Kendrion has a presence in China.Looking at the figures, Linning has a turnover level of €40m and is highly profitable. We estimate Linning has an EBIT margin in the range of 12-14% compared with around 9% for the Electromagnetics division at Kendrion. Notakeover price has been released, but we estimate a price at a level of closeto €50m, implying an EV/EBIT multiple in the range of 9-10x. The acquisition will be financed through cash as a result of the recent disposal ofMetal. Kendrion has enough financial room, so we see the acquisition from a product, geographical and financial point of view as a good fit.
Negative: operationally vulnerable to disappointment. Recent 3Q07 figuresshow that operationally Kendrion is still vulnerable to disappointment. Thistime it faced some unexpected disappointments at Metal, DistributionServices (some problems with a new IT system) and Servico (sharp declinein volumes due to model changes at Bosch).
Key newsflow
Apart from the release of the results, focus will be also on the EC fine (at end-2005 Kendrion was fined €34m for price fixing in the plastic industrial bagsmarket). Kendrion has appealed against the ruling, but normally it takesaround three years before judgement is pronounced.
Valuation
We maintain a Hold rating, because although we think it is taking the right strategic steps we believe Kendrion needs more time to rebuild its trackrecord. Looking at the valuation, our sum-of-the-parts methodology indicates a value of €20.80. We have a target price of €20.50, implying a 2008F PERof 11x, more or less in line with its historical average. _
Main shareholders (%) ING 13%Tettamanti 9%Aviva 8%
Share data No. of shares (m) 10.3Daily turnover (shares) 4,545.0Free float (%) 55.0Enterprise value (€m) 273.4Market cap (€m) 178.0
Company profile History Kendrion NV is an international company with c.2,800employees in 17 European countries and Hong Kong.The company targets niche market leadership in B2Bmarkets. Following a financial restructuring and the saleof some activities, activities are now organised into twodivisions: Kendrion Industrial Components (38% of2008F sales) and Kendrion Distribution Services (63% of 2008F sales).
Industrial Components This division focuses on the production of componentsfor the business-to-business industry. The number ofsuppliers in this specific niche market is limited.Kendrion Electronic Components is active in the field ofdrive technology, automotive technology andelectromagnetic systems in specific applications suchas elevators, doors, industrial robots, dialysisequipment and precision control technology. Itsproducts incorporate high-grade technology capable ofmeeting the highest standards of reliability andaccuracy.
Distribution Services Distribution Services focuses predominantly on tradingand distribution activities, with an emphasis on offeringsolutions through highly developed logistical servicesand knowledge of products and applications. Thedivision consists of two business areas, Vink and OtherDistribution (Servico). Vink is a trader in and distributorof plastic semi-manufactures in Europe. The rangeconsists of more than 20,000 articles, includingsynthetic sheets, high-quality foils and tapes, rod andpipe material, blocks, profiles, valves and fittings fromstock. Servico is specialised in the sale and distributionof heating equipment including boilers, which has astrong sales support department. The company is thesole agent for the Junkers and Radsons brands inBelgium. We consider these activities as non-core.
Risks Risks include a slowdown of the European economyand rising raw materials prices.
SWOT Strengths Strong positions in attractive niche markets. Improved balance sheet. Healthy cash flow-generative power. Long-term contracts in electromagnetics.
Weaknesses Vulnerable to operational disappointments. Vink’s market positions in Germany and France are toolimited.
Opportunities High growth potential at electromagnetics.
Threats Risk of rising raw material prices. Outcome of €34m EU fine uncertain, with the worst-case scenario leading to a potential €3.00 impact on our target price.
Kinepolis is a defensive stock, with a good visibility onearnings growth, a strong market position in Belgium and noUS$ sensitivity. In addition, we expect it to gradually develop its real estate portfolio, and hence realise important capitalgains. We recommend BUYing the shares.
Investment thesis
We believe Kinepolis is a defensive stock, with a good visibility on earningsgrowth. We expect Kinepolis to increase its 2008F EBITDA by 8.2% to €53.6m. The assumptions behind the expected increase are themaintenance of the status quo in ticket sales, but an increase in ticket prices,mainly in Belgium, and higher food & beverage spending per visitor. We assume that by the end-2007, 55% of all films will be digitally projected inBelgium (versus 35% at the end of 1H07), and assume that the percentageof digitally projected films should gradually increase to 100% by the end of1H09. Given the (effective) price increase of €1 for digitally projected films, we expect Belgian ticket prices to increase from €6.02 in 1H07 to €6.67 by 1H09. In addition, we understand from management that the remodelling ofthe theatres (ie, seat reservation, seat detection, open foyer and new shops)will be rolled out internationally within the next three years. From itsexperience with the ‘new model’ of theatres, Kinepolis has experienced anincrease in spending by 20-30% due the rollout of self services for food &beverages. Additionally, spending increased by 15-20% per visitor due to the fact that cinema visitors now leave the theatre through the open foyer. Wetherefore assume that food and beverage spending will increase by about30% internationally by 2010 (versus annualised 1H07 figures).
Our investment case is also built on the company’s strategy to createshareholder value through the valorisation of its real estate. We estimate thevalue of its property portfolio at €352.9m, compared with a book value of€247m. We expect Kinepolis to gradually develop its real estate, and hence realise important capital gains.
Key newsflow
Kinepolis is publishing 4Q07 ticket sales on 10 January 2008 and FY07results on 29 February 2008. In the meantime, the company is working (andcould comment) on the legal split between its real estate and cinemaoperations.
Valuation
We slightly lower our estimates for Kinepolis’s FY07 ticket sales from 22.6mto 22.4m, as we now no longer assume that the 4Q07 ticket sales willcompensate for lower sales in the previous quarters. As such, our FY07F EBITDA decreases from €50.3m to €49.5m. We maintain our target price of€57 per share, based on a SOTP model in which we value the company’sreal estate at €352.9m and its cinema activities at €190m (implying a verycautious 2008F EV/EBITDA of 7x ‘after real estate rent’). _
Main shareholders (%) Kinohold 34.5
Share data No. of shares (m) 6.9Daily turnover (shares) 1,186.0Free float (%) 65.5Enterprise value (€m) 364.9Market cap (€m) 230.9
Newsflow
Date Description
10 January 2008 4Q07 ticket sales 29 February 2008 FY07 results 11 April 2008 1Q08 ticket sales
Company profile History Kinepolis is a digital media group that operates 310cinema screens, mainly in Belgium, France and Spain.In Belgium (51% of sales), and it is the leading operatorwith 131 screens. The company owns 860,000m² ofreal estate assets. Kinepolis was founded in 1997, after the merger of thegroups Bert and Claeys. The company was first listedon the Belgian stock market in 1998. Since 1997,Kinepolis has become the cinema market leader inBelgium and a trendsetting operator in Europe, with1,911 employees. It operates 131 screens in Belgium,87 in France, 64 in Spain and 28 in Poland and Spain. The main revenue driver for Kinepolis is ticket sales, which account for 62% of total revenues. Food andbeverages account for 21% of total revenues. In termsof products, Kinepolis mainly sells soft drinks andsweets to its cinema visitors. Media and Entertainmentis the third source of revenues, at 13% of total revenues. This segment comprises revenues fromscreen advertising and (corporate) events. In terms of geographical spread, Belgium is the mostimportant country for the group, accounting for 51% ofrevenues in the first half of 2006. The two othersignificant markets are France and Spain, with 26%and 18% of total revenues, respectively.
Risks Possible risk factors for Kinepolis include: (1)technological risks (future product innovations couldhave a negative impact on cinema admissions); (2) thequality of the film offer; and (3) weather conditions. It isself-evident that Kinepolis cannot influence the lattertwo risks in particular.
SWOT Strengths Market leadership in Belgium (market share of 45%) Ownership of real estate property
Weaknesses Mature cinema market Dependence on quality of film offer and weatherconditions Low market share in France and Spain
Opportunities Value creation from real estate property Digitalisation of cinema theatres Remodelling of cinema theatres Digital television Opening of new cinema theatres
Threats Substitution from technological innovations (DVD, VOD)
Occupancy at a high 97% shows the excellent work of thecompany on its recently acquired Luxembourg portfolio. Webelieve Leasinvest still shows interesting potential which is being overlooked by the market.
Investment thesis
The FY06/07 results were satisfactory, with net current EPS up 29% at€4.27. This reflects good operating performances and the full impact of theDexia Immo Lux (DIL) and Extensa acquisitions completed last year.
Well managed company: The clever DIL acquisition has been followed byintensive work in Luxembourg with new leases and two importantrefurbishment and extension projects: one is fully pre-leased (CFM), while the other (Bian) was started on a speculative basis. Occupancy continues toimprove and now stands at a high 97%. Leasinvest is the only BelgianSICAFI with a significant presence in Luxembourg.
Key newsflow
The 1Q trading update (close 30 September) did not bring much news;these figures cannot be extrapolated for the full year as we expectrefurbishment in progress projects gradually to start generating rents (CFM)and additional rents from new leases. We expect the Bian building to start generating new rents as from January 2009 (we assume three months’vacancy after completion in an area were vacancies on new buildings areclose to zero).
Hence, in addition to possible new acquisitions, the reletting of Bian is themain item on the agenda of the company.
Valuation
Undemanding valuation: We believe the market still overlooks the potentialof the company and especially the impact of the two projects in the attractiveLuxembourg market. Our target price at €82 per share offers upside potentialof over 30%.
Risks to our investment case include the company’s exposure to theBrussels office market but rising diversification in Luxembourg. There is alsoan interest rate risk, although this is mitigated by an active hedging policy. Interms of liquidity risk, the market cap remains modest at c.€250m. _
Main shareholders (%) Ackermans & van Haaren group 30.0AXA group 29.0
Share data No. of shares (m) 4.0Daily turnover (shares) 838.0Free float (%) 41.8Enterprise value (€m) 448.9Market cap (€m) 254.9
Newsflow
Date Description
22 Feb 2008 1H results 16 May 2008 3Q trading update 22 Aug 2008 FY07/08 results 20 Oct 2008 AGM
Leasinvest Real Estate (LRE) was listed in June 99.The portfolio includes offices, semi-industrial premises and retail areas. The main asset remains the Brusselslocated Riverside Business, an attractive property (fully-owned, one of the few business parks in Brussels intramuros, close to the high-speed rail link, goodaccessibility & parking facilities) but still showing somevacancies. In the Brussels Periphery, LRE owns theBrixton Business Park (semi-industrial units + largeretail outlet); accessibility & location are excellent.Smaller assets include office premises in Antwerp but their weight in the portfolio is now very low given pastdisposals. In 2004, LRE confirmed old rumoursannouncing a strategic partnership with AXA Belgium;the latter being expected to subscribe to future capitalincreases via contributions in kind. Two acquisitions inthe Léopold District (Brussels CBD) followed end 2004,one paid cash and the other against new LRE shares.These operations are welcome given their low risk(modern buildings, fully leased, higher weight of theCBD) and the leverage effect (low cost of debt).Occupancy down since years finally rose in December2005 thanks to small improvements across the board(including at the Riverside); also worth mentioning is thesuccessful re-letting of the Extensa Square I after thedeparture of its previous tenant. On March 2006, LREacquired 51.1% of the listed Luxembourg SICAV DexiaImmo Lux (DIL) and launched a take-over bid on theremaining shares (currently more than 90% are now owned by LRE); the total cost of the operation (ca. € 177.3 m) was paid cash. LRE also announced thecontribution in kind of a property portfolio from AXABelgium against new shares for a total consideration of€ 47.7m. As a result, AXA and AvH now own theplanned 29% each of LRE. Although no direct impact is expected on the liquidity ofthe share (100% cash), the DIL operation is mostwelcome given the nature of the assets (very close toLRE’s own portfolio, similar yield despite suboptimaloccupancy & management), its scope for improvementand the overall expected relative effect. Thesubsequent AXA Belgium deal is the perfect matchgiven the conservative assets involved (all fully let on along term basis) and the financial rationale(indebtedness back to desired levels, eventualimprovement of the share’s liquidity). This is all themore positive as since years LRE had to cope with alack of investment opportunities and disappointingresults.
SWOT Strengths Impressive record both in terms of portfolio management and external growth Good diversification of the company both inwarehouses and retail premises and in geographicterms; 30% of the portfolio value is now located inLuxembourg
Weaknesses The market cap of LRE remains substantially smallerthan those of its mains peers. The DIL transaction doesnot have a direct effect on liquidity
Opportunities Further expansion in Luxembourg
Threats LRE finances itself with short-term borrowings buthedges a substantial part of its debt with collars andIRS over periods from 3-7 years Important refurbishmetnt (Bian) started on a speculativebasis
We believe Macintosh is taking the right strategic steps (eg,selling its furniture activities and acquiring Brantano). Interms of cyclicality, the business mix is well spread, withFashion early, Living late and Telecom having its own cycle.Valuation suggests room for upside. BUY.
Investment thesis
We believe Macintosh has been taking the right strategic steps with recentdisposals and acquisitions. Its business mix is well spread in terms ofcyclicality, making it less vulnerable to the economic cycle.
Fashion: focus on the Brantano acquisition. Following the acquisition ofScapino in early 2006, Macintosh set a second step at the end of Octoberwith the acquisition of Brantano. As a result Macintosh has become thedominant market leader in the Benelux (In the Netherlands 17% market share and 14% in Belgium). In addition company has now also a presence inthe UK being the largest out-of-town shoe retailer with a market share ofclose to 2%. Looking at the figures Brantano has had some difficult yearsleading to an EBIT margin of 3.3% in 2006. However, Macintosh believesthere is room to lift profitability to a realistic level of 6% for Brantano.Acquisition will have a neutral impact on EPS in 2008, limited impact in 2009and substantial contribution in 2010.
Living: late-cyclical and benefiting from restructuring. EBIT margins at Livinghave been strongly hit in past years, due to weak market conditions.Macintosh has restructured the Living activities and sold its underperformingfurniture activities. The focus is on improving profitability in France andBelgium.
Automotive & Telecom: We are positive on Halfords, as we believe it canstructurally increase its market share at the expense of the specialisedbicycle retailers that control 80% of the Dutch bicycle market. Small specialist retailers have problems of succession (most being over 57 yearsold), and Halfords would like to speed up openings and increase its marketshare from 10% to 15%. Furthermore, Halfords has finally secured access toa respectable A-brand (Union), meaning it now also has access to therelatively fast-growing high end of the market. Lastly, we would note thatHalfords’ sales should also be fuelled by its strong position in navigationproducts such as those of TomTom (€34.5, HOLD, TP: €33). For Belcompany, we see growth potential as relatively limited, as the mobiletelecom market is mature.
Valuation
In our view, Macintosh is taking the right steps with its well spread businessportfolio with leading market positions. We believe its valuation is undemanding, trading at a 2008 PER of 8.9x. We maintain our sum-of-the-parts-based €32.00 target price, which implies a 2008F PER of 12.4x.
Main shareholders (%) Breedinvest 17.7Delta Deelnemingen 11.2Aviva 7.7Kempen 7.2
Share data No. of shares (m) 21.8Daily turnover (shares) 3,107.0Free float (%) 73.0Enterprise value (€m) 723.5Market cap (€m) 499.9
Newsflow
Date Description
17/01/2008 Trading update FY07
Share price performance
10
15
20
25
30
35
40
12/05 6/06 12/06 6/07 12/07PriceAEX All Share (rebased)
Company profile Overview Macintosh is the third-largest player in the Dutch non-food retail market, specialising in the Living, Fashionand Automotive & Telecom sectors in the Benelux. Ithas around 965 stores in the Netherlands, Belgium andFrance. Around 85% of sales are generated in theDutch market. Macintosh constantly reviews its portfolio againstprofitability standards and growth opportunities, andeach subsidiary must meet individual ROCE standards.The ROCE target for the group is 12%. Activities notexpected to meet these standards within a reasonabletimeframe are generally divested, with timing partlydependent on market conditions. Living accounts for34% of sales, Fashion 32%, and Automotive & Telecom34%.
Living Living consists of Living Deco (Kwantum and GPDecors). Kwantum offers the best deals in home furnishing/home decoration with 91 stores in theNetherlands and 15 in Belgium. It is the largest homedecoration discounter in the Netherlands. GP Decorshas 54 stores in France specialising in home decorationat attractive prices.
Fashion After the disposal of Supersonfex and the recentacquisitions of Scapino and Brantano, Macintosh hasbecome the leader in the Benelux market (with a 17%market share in the Netherlands and 14% in Belgium).
Automative & Telecom Automative & Telecom consists of BelCompany and Halfords. BelCompany is the largest supplier of mobiletelecom products/services in the Netherlands (138stores) and one of the largest independent telecomretailers in Belgium (40 stores as of end 2005). It offersa wide range of products, including all brands of mobilephones, subscriptions, prepaid products, data products,ADSL and internet services. Halfords is a specialistretailer of bicycles and car & bicycle accessories, with140 stores in the Netherlands and nine stores inBelgium. It is one of the largest bicycle retailers in theNetherlands, and its portfolio consists of A-brands andown-brand products.
SWOT Strengths Strong market-leading positions Healthy cash flow generative power
Weaknesses Diversified range of products
Opportunities Opportunities for expansion at some formats Solid balance sheet offer room for acquisitions
Threats Weakening of consumer climate Possible overpayment for acquisitions
As 2008 appears to be a transition year for Melexis, we believe its shares will lack positive triggers in terms ofnewsflow and might suffer from valuation multiplecontraction due to a (temporary) loss of growth prospects.Hence, we rate Melexis a HOLD.
Investment thesis
Melexis’ 3Q07 operational results fell short of our expectations, due to weaker top-line growth and a slight decrease in gross margins. The main disappointing element in the 3Q07 results, however, was the uninspiringoutlook statement for FY08F, where management guides for ‘only’ 5% YoYsales growth. As 2008F is likely to become the third consecutive year withoutsizeable earnings growth, we do not expect Melexis to outperform in the short run. Absence of positive newsflow and a temporary loss of thecompany’s double-digit growth profile might even lead to valuation multiplecontraction. In the longer run, however, we remain convinced of Melexis’potential, as the company should capitalise on the trend of increasedelectronic content within cars, thereby making its revenues relativelyunexposed to the cyclicality of car unit sales. Moreover, as Melexis’automotive sales (c.70% of the group total) are linked to the (long) product life cycle of a car model, it: (1) enjoys high visibility on requested volumes; (2) has a favourable view on the evolution of its selling prices; (3) benefitsfrom high entry barriers to the semiconductor market due to therequirements of car manufacturers.
Key newsflow
The reasons for management’s downbeat FY08 guidance are the following: (1) /the USD weakening in 2007F, which should still wipe out c.2% of the 2008Fsales growth; (2) within Automotive applications (72% of sales), growth is toremain at c.7% (in local currency) as the ramp-up of new applications is slower than expected. As such, the increased effort in beefing up worldwide sales teamsin 2007F is only to pay off later (2009F or 2010F); (3) within consumerapplications, a c.9% sales growth should be seen in 2008F (in local currency),aided by new infrared remote control (by mid-2008F) and mainly by the ramp-up of HD-DVD applications, where Melexis faces a slowly developing end market. Inour view, the latter application and a possible rebound of the consumer applications market (after the weak 2007F) could be the main swing factors inMelexis’ 2008F top line. Management feels confident that, after the 2008Ftransition year, the YoY sales growth should return above 10% to 2010F.According to the CEO, a 2010F sales level of €280m should be within reach.
Valuation
Melexis shares trade at a c.7% premium to the median for Belgian small and mid-caps in terms of PER and EV/EBIT for 2007F-09F. We believe such a premium as warranted in view of its solid record, its high net margins or pre-tax ROCEs and its generous dividend yield (5.2% gross). We have a €12.50 target price on Melexis, in line with a 10% discount to our DCF valuation. _
Main shareholders (%) Xtrion 50.0
Share data No. of shares (m) 42.8Daily turnover (shares) 22,473Free float (%) 49.9Enterprise value (€m) 512.7Market cap (€m) 491.2
Company profile Melexis is a Belgian fabless semiconductormanufacturer that develops, tests and markets a wide range of integrated semiconductors for the automotiveand consumer electronics industries. It sells itsproducts to OEMs. Production is mainly outsourced toX-Fab, a German foundry. Melexis is not a large playerin the global automotive semiconductor market. Thecompany's revenues should place it in the top 20. Thebiggest players in this market are Freescale, Infineonand STMicroelectronics. However, Melexis claims aleading position in Hall and Pressure sensors, and anumber-three position in acceleration sensors. Melexishas more than 680 employees, 50% of whom areinvolved in R&D. The company's headquarters are inBelgium; other offices are located in the US, Germany,Switzerland, Ukraine, Bulgaria and the Netherlands.
Automotive Applications (70% of 2006 sales) Melexis’ main focus is on the design and developmentof automotive electronics systems. Nearly allautomobile brands worldwide integrate Melexis’ ICs.The growth in the electronic content of automobilesworldwide continues to demand increasingly capableICs and IC sensors. Hall effect devices are used inmovement and position sensing. Pressure andacceleration sensors are used in various automotivesafety applications such as airbags. Another importantproduct line for Melexis is systems-on-a-chip, which areused for window lifters and navigation systems.
Consumer Applications (30% of 2006 sales) Melexis also develops chips for other sectors. Typicalend-products that utilise Melexis’ components areinfrared thermometers, computer game consoles, entertainment systems, cell phones, handheld remotecontrols, battery charging controllers.
Geographical breakdown of 2006 sales Europe 42%, Asia 39%, US 16%, ROW 3%.
Risks Melexis has only a limited number of customers: its topten clients (OEMs) account for 62% of sales, althoughits chips can be found in nearly every car. Melexis’results are sensitive to the sharp fluctuations in demandfor chips in consumer applications.
SWOT Strengths Broad product range, designed for upmarket car models(leaving potential for medium-sized and smaller cars). High standards in the automotive sector (eg, reliability)create high entry barriers to this market. Excellent financial record, steady earnings growth, strong balancesheet, high ROACEs. Full resilience on declining unitcar sales in the past. High visibility on volumes andselling prices due to its automotive profile
Weaknesses Limited customer numbers. Related party transactions:although Melexis is fully transparent on these mainlyclient-supplier relationships, criticism on this or apotential conflict of interest cannot be fully ruled out.
Opportunities Organically growing end-market: Revenues are set tocapitalise on the increasing content of semiconductorswithin cars. We expect the sensor segment to grow 20% pa in the next ten years
Threats The big semiconductor companies could enter orpenetrate automotives further, to post steadier growthrates, which might increase Melexis’ competitiveenvironment
Investments in opex and an unfavourable product mix slowedmargin growth in 1H07. With seasonality skewed towards 2Hfor higher-margin non-contact measurement devices, we expect a strong end to the year. BUY.
Investment thesis
Metris designs, develops and markets a unique range of 3D hardware andsoftware inspection systems for the automotive and aerospace sectors.These are mission-critical tools to ensure that components conform to the specifications of product design. The company is a challenger in its marketwith a market share that we estimate at 3.1% by end-2007 (up from 2.5% in 2006).
Metris is a leader in an area of technology that we see as the primarysubstitute for contact measurement tools, as we believe this technology isimproving manufacturers’ ROIC given its higher speed of measurement. The company’s product portfolio should benefit from: (1) manufacturers’increasing quality control requirements; and (2) the ongoing transition fromcontact to laser metrology solutions. We expect 2006-09F sales and EPS CAGRs of 33% and 57%, respectively.
The depressed 2006 operating margin of 9.1% (down from 13.7% YoY)reflects Metris’ strategy to gain a customer base as the acquisition of low margin LK depressed the overall margin, but gave an interesting distributionchannel to push through its innovative products. As we expect Metris’soptical technologies to grow faster than LK’s traditional contactmeasurement tools, the product mix should gradually improve towardshigher-margin products. As a result, we expect the EBIT margin to improvefrom 9.1% in 2006 to 14.3% in 2009F.
Key newsflow
Metris reports its results on a bi-annual basis. Apart from the results, Metris newsflow is set to be dominated by announcements of further acquisitions as(1) Metris announced that it had secured €65m of financing and (2) acquisitions are part of its core strategy. In addition, management do notexclude the possibility of a major acquisition (€50m+ of sales).
Valuation
We rate Metris a BUY and maintain our DCF-based target price of €19. Currently, Metris trades at multiples of 16.5x 2008F PER, 7.5x 2008F EV/EBITDA, 11.8x 2009F PER and 5.5x 2009F EV/EBITDA. The discount topeers is 5% on 2008F numbers and 25% on our 2009F estimates. _
Main shareholders (%) Bart Van Coppenolle 7.3GIMV 4.6
Share data No. of shares (m) 12.3Daily turnover (shares) 8,457.0Free float (%) 67.0Enterprise value (€m) 184.7Market cap (€m) 161.8
Newsflow
Date Description
19 Mar 2008 FY07 results 06 Jun 2008 AGM 28 Aug 2008 1H08 results
Company profile Metris designs, develops and markets a unique rangeof 3D hardware and software inspection systems for theautomotive and aerospace sectors. The company is achallenger in its market with a market share estimatedat 3.1% by the end of 2007 (up from 2.5% in 2006). Metris started in 1995 as a spin-off from the Universityof Leuven in Belgium originally as a software developer for the micro metrology industry. Through organic andacquisitive growth, Metris now offers a full range ofsolutions to fulfil client needs.
Optical measurement (47% of 2007F sales) Metris Is exposed to fastest growing segments of themicro metrology market thanks to a product portfoliofocused on innovation in laser/optical segments(opposed to the contact segment). Metris intends tobenefit from the transition from contact to non-contact metrology solutions and should see its top-line growthoutperforming the market. Metris’ non-contact measurement tools include laser scanning, laser radar,iGPS and Optical CMM. We expect these products toaccount for 47.7% of 2007F sales and grow to reach61% of the product mix by 2010F.
Fixed CMM & services (53% of 2007F sales) To push through its innovations to end customers,Metris purchased a customer base with the acquisitionof LK (a CMM manufacturer and reputed after-sales service). This is an important strategic move as Metris’key innovative products were previously distributed indirectly via competitors’ CMM. While the acquisitionhas a negative impact on margins, we believe thatbeing directly in touch with customers is key for Metristo speed up the adoption rate of its new technologies.Fixed CMM and services are expected to account for52.3% of 2007F sales.
Risks In our view, the two biggest risks are; (1) M&Aintegration as Metris has acquired many companiesand is expected to continue to do so, (2) theemergence of a serious competitor in the laserscanning segment.
SWOT Strengths Active in fastest growing industry segments Successful acquisition and integration track record
Weaknesses Limited recurrence of sales Very small market share
Opportunities Low penetration of optical metrology solutions Further acquisitions could create shareholders value
Threats Huge acquisition integration risk Potential serious competition in laser scanning business
In 2007 Mobistar announced its repositioning as a mobile-centric operator. It is facing aggressive regulation and amaturing Belgian mobile market, although it continues toshow strong operationals. We think that shareholderremuneration is its strong point. HOLD maintained.
Investment thesis
In 2007, Mobistar announced that it would reposition itself as a mobile-centric operator, focusing on fixed-to-mobile substitution on the residentialmarket and fixed-mobile convergence on the business market. Following theacquisition of Luxembourg mobile operator Voxmobile, Mobistar confirmedits -2-4% revenue growth guidance for 2007.
As a pure mobile player, Mobistar is going through a difficult time as it isfacing aggressive regulation. Mobile termination rates have been cut twice inthe past two months and should be cut twice again over the coming year ifthe Belgian regulator (IBPT) carries its plan forward. Taking into account thereduction in roaming fees, the regulation should reduce Mobistar’s revenuesby 8% in 2007. This trend is likely to be continued in 2008, although the nextMTR cuts may be delayed by IBPT and will be lighter (21.7% vs 35.7% forMobistar).
We find Mobistar’s remuneration policy attractive. With a 95% payout ratio, Mobistar offered a 7.3% dividend yield in 2006, and we expect it to be 6.4%in 2007. Due to limited acquisition opportunities in Belgium, Mobistar plans toreleverage its balance sheet in 2008. This would be achieved through a mixof capital reductions, dividends and share buybacks that may amount to€550m. This still needs to be approved by an EGM on 4 February 2008.
Key newsflow
Early February 2008 will be a milestone for Mobistar as it will table balancesheet releveraging proposals to the Board. FY07 results will be published thenext day.
Many investors expect a major movement in Mobistar’s shareholdingstructure which could see France Telecom buying out minorities. We thinkthis scenario is unlikely in the short term. It makes more sense for the French incumbent (whose debt is scrutinized) to allocate its capital to emergingmarkets, where there is growth to be found.
Valuation
Based on our DCF-based target price of €63, the stock trades at 6.7xEV/EBITDA 2008F and 13.9x PER 2008F which is in line with otherEuropean telecom operators.
Risks include a possible growing demand for convergent offers that Mobistarwould have difficulties to answer given its recent repositioning. _
Main shareholders (%) France Telecom 50.2
Share data No. of shares (m) 63.3Daily turnover (shares) 226,367Free float (%) 49.6Enterprise value (€m) 3,783.8Market cap (€m) 3,890.7
Newsflow
Date Description
04 Feb 2008 EGM 05 Feb 2008 FY07 results 15 Apr 2008 1Q08 KPIs 07 May 2008 AGM
Company profile History Mobistar offers fixed and mobile telephony services inBelgium and is majority owned by Orange, FranceTelecom's mobile telephony division. Mobistar launchedits Belgian mobile telephony service in August 1996. In1998 it launched its fixed telephony service and in1999 started its corporate solutions business. Mobistarwas listed on the Belgian stock exchange in October1998.
Mobile telephony services Mobile telephony services provided over its GSMnetwork form the bulk of the Mobistar Group'soperations. In a market where over 70% of the Belgianpopulation uses a mobile phone, Mobistar commands astrong number two position behind market leaderProximus, 75% owned by the fixed-line incumbentBelgacom. Mobile data services using GPRStechnology was launched in May 2001. Phaseddeployment of its 3G network over the next few yearsshould provide extra service capabilities and highercapacity. Recent regulatory changes include theintroduction of mobile number portability to the Belgianmarket on 1 October 2002. Further regulatory changes,following the implementation of new European telecomsregulation from July 2003, are expected.
Fixed telephony services Mobistar's fixed telecoms business is a small but fast-growing part of the group's business. Mobistar firstentered the Belgian fixed telephony market in 1998 withits 1595 service. Mobistar launched its corporatesolutions business in 1999, a subsidiary that offersintegrated telecoms services to business customers.Offering both fixed and mobile telecoms services hashelped Mobistar gain market share in the corporate telephony segment.
SWOT Strengths High proportion of contract customers. Good shareholder remuneration.
Weaknesses Limited position in convergent products . Lack of growth opportunities.
Opportunities Further potential in fixed mobile substitution. Balance sheet releveraging.
Threats Hostile regulation with cuts in roaming fees and MTR. Intensifying price competition from Base and Proximus.
Montea invests solely in logistics property in Belgium andFrance which offer surprisingly high yields, reasonable rents and superb locations close to large consumer outlets. FY07 results should be well ahead of IPO forecasts on the back ofexcellent operating performances and recent acquisitions.
Investment thesis
Since its September 2006 listing, Montea has acquired property worth c.€21m (including renovation works), ie, 20% of the portfolio value at IPO. Since June,it has bought properties in the Belgian ‘Golden Triangle’ (Mechelen and Aalst)and northern France (Amiens). These acquisitions (c.45,000 m² GLA) havebeen made at expected gross property yields above 8%. Montea claims to be considering an additional pipeline of 120,000m² (built), of which 47,000m²(c.€26m) could be completed by March 2008, bringing the portfolio value to€165m (+46% since the IPO).
These acquisitions boast such a high yield because some sites were empty when acquired and/or in need of renovation. Assets acquired are fully leasedmere weeks after being signed. Total occupancy (% of est. rental value) nowstands at 97.5% (95.1% at the IPO). The sites acquired include c.35,000m² ofland for further expansion.
Given their high yield and full occupancy, recent acquisitions should have apositive impact on FY07 (15 months) and FY08 earnings. Results for the first 12 months (Oct 2006-Sept 2007) of the 15-month FY06/07 year show operating performances well ahead of IPO projections, even considering thatrecent acquisitions will only have a material impact on results from October.The first 12 months show net current EPS (excl. IAS 39) at €2.18 vs IPO projections for the full year (15 months) of €2.49. IPO projections were computed as a worst-case scenario (unchanged portfolio, expiring leasesassumed NOT extended at first break, ie, rental income is cut by 5% agencycosts for reletting). Higher interest rates only have a limited impact as 75% ofthe original financial debt is financed by a fixed rate bullet loan. Hence, our2007-09F net current EPS are €2.69 (€2.15 annualised), €2.46 and €2.51(€2.52, €2.22 and €2.30 previously). Our 2008F and 2009F net current EPS have been further amended to €2.27 and 2.39 owing to the part acquisition of the Unilever site to be financed by new shares.
Key newsflow
Results ahead of IPO projections are now well anticipated. Futureacquisitions and possible capital increases are eagerly expected byinvestors discouraged by the still modest size of the company.
Valuation
DCF-based €36.50 TP: Higher earnings estimates were partly compensatedfor by a higher, conservative risk-free rate (4.5%) and beta (0.85). We likeMontea and the share’s undemanding ratios, but at current levels we preferits larger peer WDP whose shares look oversold in recent months. _
Main shareholders (%) Pierre de Pauw family 31.7Affine 25.3
Share data No. of shares (m) 3.6Daily turnover (shares) 238.0Free float (%) 37.4Enterprise value (€m) 158.3Market cap (€m) 114.8
Company profile The main sponsor of Montea is the Pierre De Pauwfamily, which has been active for decades in thelogistics sector. Selling shareholders remain committedto the company, with a total stake of 62.6%, as theyhave all expressed their intention to retain their stakesin the SICAFI (save Bolckmans). The shares publiclyoffered (37%) are close to the minimum 30% legalrequirement. This shareholder commitment is obviouslypositive but also limits the free float and hence theliquidity of Montea shares. As a registered SICAFI (Belgian REIT-like regime),Montea’s main activity consists of the management of aproperty portfolio. The entire logistics and semi-industrial portfolio of the De Pauw family has beencontributed to Montea. Several third parties, includingthe French Affine group, also contributed assets toMontea. Montea intends to have a limited (up to 10% ofthe total portfolio value) property development activity,ie, to develop new assets that will then be kept in theportfolio. Other benefits are retention of developmentmargin within the company (typically above 10%) andthe possibility of consolidating relationships withcustomers seeking tailored solutions. This strategy hasbeen implemented for years by WDP and, in a contextof scarce investment opportunities at acceptable yields,is now more common. The property portfolio, worth €113m at the IPO, isexpected to grow rapidly thanks to several extensionsand investments planned at existing sites (c.€1.6m, €0.6m already completed; in Nivelles & Puurs, Monteaowns adjacent land for further extensions), acquisitionsfrom Affine and purchases initiated by Affine itself. Aportfolio value at over €165m by mid-2008 looksrealistic. With gross indebtedness at a mere 32.4% oftotal assets at the IPO, the legal ceiling (65%) allowsnew acquisitions to be fully financed by debt, ie, with noneed to tap equity markets, worth c.€105m. Montea focuses on logistic premises in Belgium/France offeringsurprisingly high yields, even vs CEE countries,reasonable rents and superb locations (160mconsumers in a 500km radius around Brussels). Assetsconsidered include large platforms but also smallerassets offering higher yields and a welcomediversification vs large logistic players. Montea is apartnership by shares; the listed company is controlledby a general partner hence reduced appeal as atakeover target.
Risk factors Higher interest rates However, c.75% of financial debtconsists of a 5Y fixed bullet loan. Potential conflicts of interest as some shareholders(potential contributors) are active in property. Lack ofsuitable investment opportunities.
SWOT Strengths Low risk and high quality portfolio Experienced management
Weaknesses Small size and limited liquidity of the share.
Opportunities Good prospects for logistic property. Expansion in France helped by Affine.
Threats Higher interest rates However, c.75% of financial debtconsists of a bullet loan with a fixed rate for five years. Some shareholders and potential contributors are alsoactive in property (potential conflicts of interest).
The recent share price decline has made Nutreco a valueplay. Although the company has not increased its emerging-market profile, EPS growth should be healthy in 2007-09F. This should create time to generate synergies and build aplatform for future growth.
Investment thesis
We recently became more positive on Nutreco due to its low valuation. Theshare price had declined because of weak salmon prices, weak Provimiresults and rising grain prices. As salmon farmers still have healthy cashflows and we expect rising salmon prices in 2008, there should be nonegative impact on fish feed supplier Nutreco. On Provimi, we see almost noread-across to Nutreco from the weak Polish and pet food results. Finally,rising grain prices are being absorbed by price-basket contracts. Nutreco is able to handle these problems and has good prospects for profit growth in2007-09F. Through a €25m procurement programme (2008-09), and the acquisitions of the Maple Leaf feed business (MLCanada, €30m EBIT) and the BASF pre-mix business (potential €10m EBIT), Nutreco should showrising profits. Through this, it is buying time to generate synergies from theCanadian acquisition and accelerate fish feed growth. In this context, newacquisitions in North America should adopt MLCanada’s model and fishfeed’s organic growth should accelerate through more exposure to Asia andthe introduction of premium products.
Key newsflow
Upcoming newsflow could include further acquisitions in the animal feed andfish feed markets, as well as the extension of the fish feed contract withMarine Harvest (MH). Nutreco’s balance sheet still allows for more than €200m in acquisitions, which are normally EPS enhancing. The analysts’tour of Canada gave us confidence that Nutreco can make acquisitions atlow multiples and that synergies can be larger than expected. Concerningfish feed, we think Nutreco is interested in smaller targets in Asia or in co-operation with MH (whereby MH acquires the farms and Nutreco becomesits preferred feed supplier). The extension of the fish feed contract with MHis crucial. We estimate the current contract generates 15-20% of EBIT, and it ends in April 2008. In fact, MH has no alternatives with respect to fish feedsuppliers. On 14 February, Nutreco will release its 2007 results, and weexpect them to be healthy at the EBIT line.
Valuation
We calculate our target price (TP) through a scenario analysis. We currentlygive a 40% weighting to a standalone scenario including some further value-enhancing acquisitions (TP €47.3). The chance of no further deals is set at50% (TP 43.2). Finally, a private equity scenario has a low 10% weighting (TP €40). The weighted average of these scenarios is €44.5. As statedabove, Nutreco’s valuation is low relative to our small and mid-cap food & beverages universe, trading at a 2009F EV/EBIT discount (7x vs 9x). _
Main shareholders (%) Fortis 11.2ING 10.0Maesinvest 9.3AEGON 5.0
Share data No. of shares (m) 33.9Daily turnover (shares) 152,278Free float (%) 100.0Enterprise value (€m) 1,402.4Market cap (€m) 1,358.7
Newsflow
Date Description
14 February 2008 Nutreco 2007 results 31 July 2008 Nutreco 1H08 results
Share price performance
30
35
40
45
50
55
60
12/05 6/06 12/06 6/07 12/07PriceAEX All Share (rebased)
Company profile History Nutreco was established through a leveraged buyoutfrom BP in 1994 and listed in 1997. Since the early1980s, it has benefited from its leading position in the strongly growing salmon feed business. In 1999-2000, the company expanded strongly insalmon farming, but this detracted attention from itscore activities (animal nutrition, fish feed), as didinvestments in poultry and pork processing. A relateddistracting factor was the volatility of profits and theshare price. In 2004, Nutreco changed its strategy,intending to increase focus on animal nutrition again.Most divestments have now taken place. The companynow likes to use its war chest to expand in emergingmarkets, in premix/specialities and in fish feed, as wellas in North America.
Fish feed In salmon feed, Nutreco is the world market leader witha 40% market share, slightly more than Cermaq’s 40%share. A small part of fish feed sales are in other species (such as trout, halibut, cod, tuna andbarramundi), but Nutreco wants to grow strongly inthese species.
Premix/specialities In pre-mix, Nutreco is the European market leader(c.15% market share), and it has a small position in theUS and in several emerging markets.
Compound feed and meat processing The main compound feed positions are in the Beneluxcountries and Spain/Portugal, in which Nutreco hasleading positions. In the Benelux, this is a cash flow-generating business. In Spain, it is necessary to havecontrol of the chain, which is why Nutreco is also activein poultry and pork processing. In poultry processing,Nutreco has one-third of the market.
Breeding and other Nutreco still has a small position in breeding, but weare not sure whether it will retain this business.
Risks Nutreco’s operating results are sensitive to animaldiseases, contamination and, to a lesser extent, proteinprices.
SWOT Strengths Global market leader in the production of fish feed forsalmon and several other species.. Leading position in premix and specialities.Management is cautious on risky emerging-market acquisitions. Good control of the operating margin.
Weaknesses The company still has a low exposure to emergingmarkets. Thus, too much focus on maturing markets.
Opportunities The war chest still gives the company room to expandin emerging markets where feed growth is high. Aquaculture is a growth market.
Threats Animal diseases now and then hurt the stock price. It could wait too long before expanding in relevantemerging markets.
Nyrstar is the global leader in zinc smelting, with the strategyto further consolidate the sector. It has a strong balancesheet and should generate enough FCF to support this strategy. Still, Nyrstar trades below book value and at a 25%discount to peers. Hence, we rate the share a BUY.
Investment thesis
Nyrstar was created in September 2007 via the merger of the zinc smeltingdivisions of Zinifex and Umicore. Nyrstar is the world’s largest zinc smelter,with a market share of 10% and activities on four continents. As such the company is the most geographically diversified zinc smelter.
Given its size, Nyrstar seeks to set the annual benchmark in treatmentcharges. The treatment charge, which is Nyrstar’s most important profitdriver, is the discount to the zinc price that smelters negotiate with minerswhen purchasing zinc concentrates. We believe that Nyrstar will, given itsweight, introduce more price discipline in the sector, and as such increase the ROCE for zinc smelters.
Due to high zinc prices in 2006 and 2007, old zinc mines were reopened andnew mines started up as of 2007. We expect this to provide a substantialboost to zinc mine production. As such, we expect to see a surplus in zincmine production compared to the zinc smelting capacity. This should resultin high treatment charges for zinc smelters, such as Nyrstar, at least until the end of 2009. Although we expect the zinc price, which is the company’s second-largest profit driver, to decline to historical averages, Nyrstar should generate €0.7bn in FCF by end-2009. We believe Nyrstar will use the cashto finance growth and margin initiatives, drive sector consolidation andreward shareholders. A further weakening of the US$ could dampen thisoutlook.
Key newsflow
Nyrstar should publish FY07 results on 19 March 2008. At this occasion, weexpect the company to comment on 2008F TC’s. In the meantime, the shareprice should be impacted (positively or negatively) by the level of the zincprice and the US$ strength/weakness versus the euro.
Valuation
Nyrstar currently trades roughly in line with its book value of €15.7/share and trades at 3.2x 2008F EV/EBITDA. This implies that the company trades at a 20% discount to its peers, which trade at 3.9x 2008F EV/EBITDA. GivenNyrstar’s leading role in zinc smelting, we argue that the company deservesto trade at least in line with peer group multiples. Hence, we rate the share a BUY with a DCF-based €20 TP. Our target price corresponds with avaluation of 4.2x 2008F EV/EBITDA, and is in line with cycle-average multiples. _
Main shareholders (%) Blackrock Group 8.13Zinifex Ltd 7.79Fidelity International 7.02Umicore 5.25
Share data No. of shares (m) 100.0Daily turnover (shares) 241,933Free float (%) 100.0Enterprise value (€m) 1,349.7Market cap (€m) 1,595.0
Company profile Nyrstar was created in September 2007 via the mergerof the zinc (and lead) smelting divisions of Zinifex andUmicore. The company is the world’s largest zinc smelter, with a capacity of 1.1mt of zinc per annum,which corresponds to a market share of 10%.Nyrstarhas activities in four continents, and we expect EBITDAof €531m in 2007F. Zinc is predominantly used forcorrosion protection of steel, via galvanised coatings.According to Brook Hunt, a sector specialist, damagecaused by the corrosion of steel costs roughly 4% of anindustrial country’s GDP. Given that only 15% of steeland 50% of worldwide sheet steel is protected by zinc,there is still an economic justification for a higher andmore intensive use of zinc. Nyrstar benefits from a fairly secure feedstock, since48% of its concentrate requirements are provided for by‘life of mine’ agreements with Zinifex. This is animportant asset, especially in times of concentrateshortage. Furthermore, 20% of Nyrstar’s feedrequirements are sourced from secondary materials,thus reducing its dependency on concentrates andimproving profitability (a cost saving of about 5% vis-à-vis concentrate, according to Nyrstar management). Uniquely, Nyrstar has a global presence, withproduction facilities on four continents, with salesstemming mainly from Europe (54%) and Asia-Pacific (35%). The production assets are efficiently managed,with upside identified in terms of recovery rate (groupaverage of 94% to be lifted to 96%, as reflected in ourestimates). In addition, cash conversion costs areestimated by Brook Hunt to be in line with industryaverages. In terms of products, the company producesan extensive range. Special high grade (SHG) zinc (astandard product) accounts for 45% of sales andgenerates premiums of US$200-300/t. In addition, thecompany produces galvanising alloys (25% ofsales)with premiums of 20-40% to SHG and die castalloys (30% of sales) with premiums of 35-50% to SHG.
SWOT Strengths Market leadership in zinc smelting Most geographical diversified zinc smelter Market fundamentals in favour of smelters Solid negotiation position versus zinc mines – life of mine feedstock agreements Strong balance sheet and cash flow generation until2009 Experienced management team
Weaknesses High cyclicality, limited visibility on profit drivers after2010 High sensitivity to US$ High dependence on Century and Rosebery mines Large environmental liabilities
Opportunities Lead industry consolidation Exploit European synergies Improve assets to ‘best of class’ Realise planned growth projects
Threats Faster-than-expected decrease of TCs Stronger than expected decrease of zinc price Weakening of the US dollar versus the euro Increase in energy prices Higher than expected drop in price of by-products
Following poor 3Q07 results and FY07 guidance, we reduced our estimates. Océ’s profitability is still below our expectations and we remain cautious, particularly in view ofthe slowing (US) economic backdrop and US dollar weakness.The latter risk leads us to reduce our TP to €12.5.
Investment thesis
Following disappointing 3Q07 results and FY07 guidance, we reduced ourestimates by 16%. While at first sight, double-digit system (non-recurring)revenue growth of 17.9% may look encouraging, this was in fact a combination of impressive WFPS growth (20.8%) and an easy comparisonbase for DDS (16.5% vs -12.5% in 3Q06) – and DDS still reported an EBIT loss. Moreover, the higher-margin service (recurring) revenues were again disappointing: 0.0% organic growth at DDS and 0.4% at WFPS; hence thelower-than-expected margins.
Key newsflow
Océ reports its 4Q07 results for the three months ending 30 November inJanuary. Management expects WFPS’s recurring revenue growth to rise inthe coming quarters. While this is encouraging, for Océ really to show improved profitability, the more important DDS recurring revenues will needto grow, and there was little in the 3Q07 numbers to suggest that this is likelyto occur any time soon. In fact, both divisions’ equipment order books grewonly slightly on a sequential basis, which suggests that the strong growth innon-recurring revenues may also be short-lived.
Valuation
Océ’s profitability is still below our expectations, and we remain cautious, particularly in view of the slowing (US) economic backdrop and the US dollarweakness (c.45% of Océ’s sales are in the US). Hence, we continue to be concerned about whether Océ will achieve its 5%-plus organic top-line growth target within the 2007-10 timeframe as pricing pressure remainsunabated (3-5% pa) and the macroeconomic backdrop appears to bedeteriorating. Moreover, the still flattish (high-margin) recurring activities need finally to start growing in order for profitability to improve substantially. Otherwise, sales growth is unlikely to lead to meaningful earnings growth. We believe a 2008F EV/EBITA multiple of 11.5x is justified; hence our DCF-based target price of €12.5. This represents a downgrade from our previous€13.5 target price as, while dollar weakness may not immediately affectOcé’s earnings, it is likely to keep the share price from moving higher.However, the continued dividend payout should provide some downsideprotection. Hence our HOLD rating on the stock. _
Main shareholders (%) Orbis 10.0Pictet 6.7ING 6.3Rabobank 6.3
Share data No. of shares (m) 84.2Daily turnover (shares) 190,478Free float (%) 100.0Enterprise value (€m) 1,899.1Market cap (€m) 1,033.5
Company profile Océ manufactures a wide range of digital copier/printersfor corporate environments and commercial printers.
Océ is organised into two divisions, the DigitalDocument System (DDS) division (69% of 2005 sales)and the Wide Format Printing Systems (WFPS)division. About 70% of sales are recurring machinesales versus 30% for non-recurring machine sales.DDS was formed in 2002 to address all clients withhigh-volume and high-speed copying/printing needs –both corporate (offices, repro departments and datacentres) and commercial printers (copy shops, graphicsindustry and paper production).
Océ focuses on the high-volume segment (>50,000 prints per month), where the number of suppliers islimited. Its main strengths lie in the productivity andreliability of its machines. Océ retains a direct sales andservice channel. In order to improve its position in DDSoffices in the US, Océ acquired Imagistics at the end of2005. Imagistics is a distributor of low-volume officemachines from Konica Minolta, Toshiba and Sharp.
WFPS encompasses two subdivisions. TechnicalDocument supplies equipment, software and services toindustrial companies, mechanical engineering andconstruction companies and architects, for wide-format printing. Océ has steadily strengthened its leadingposition in this niche.
Although technical printing is mainly in B&W, the shareof colour is growing. Display Graphics is a relativelynew market for wide-format graphic illustrations. Themain applications are outdoor and indoor advertising.Customers are mainly specialised printers. Océ'sposition was reinforced in 2001 by the acquisition ofGretag Professional Imaging.
Risk factors The main risks to our estimates, TP and rating include apossible stronger-than-currently expected marginrecovery in 2008-10, but there is still significant short-term earnings risk too, partly due to Océ’s US dollarexposure.
SWOT Strengths Strong niche market positions (particularly in WFPS) Strong product and service quality image
Weaknesses Limited presence in cut-sheet and colour (DDS) Low brand awareness vis-à-vis (larger) competitors
Opportunities Increased usage of colour printing Roll-out of Imagistics model in Europe
Threats Continued pricing pressure on higher-margin serviceactivities Further entry of competitors into niche segments
Omega Pharma’s (OP) long-term outlook is, in our view,appealing, as its business plan includes several growthdrivers. Moreover, OP trades at undemanding valuationmultiples, certainly compared to its sector. BUY maintained.
Investment thesis
Omega Pharma is a major consolidator in the fragmented European OTCmarket. It showed extensive external growth for several years and through the strategically important Bittner Pharma takeover in October 2006, OPextended its scope to the fast-growing eastern European OTC market, thus adding sales coverage in 13 countries and bringing its geographical scope to 30 European countries. Its aim is to become a top worldwide OTC companyby 2017. OP ranks No.11 globally.
We rate OP a BUY in view of: (1) the very reasonable valuation multiples atwhich the shares trade; (2) OP’s solid long-term strategy and its numerous long-term growth drivers (exposure to the fast-growing Eastern European OTC market, cross-selling opportunities); (3) the upgrade of its product mix towards an increasingly higher proportion of international brands, which inour view is an additional long-term value driver; (4) the stock’s re-rating potential from its OTC pure-play profile following the carve out of Arseus, although some short-term worries (eg, evolution of generic drug sales, recovering OTC sales) should be lifted first.
Key newsflow
The stock’s share price was hit hard after the announcement ofdisappointing 3Q07 sales, due to a sudden drop in generic drugs sales and asharp YoY fall in sun-related product sales. The announcement of solidOctober sales (+17% YoY) and of the company’s share buyback (up to 2mshares to May 2008), triggered a strong share price rebound.
OP’s targeted 400bp REBITDA margin improvement from 2006 to 2010F(from c.16% to 20% by 2010F) should come from: (1) plus c.200bp thanks toan improving product mix (higher margin star brands should proportionally mount in overall sales); (2) plus c.200bp through the reassessment of group-wide production and procurement policy; (3) plus c. 200bp throughoperational leverage (SG&A costs should rise proportionally less than thetargeted 7% organic growth); (4) minus 200bp as OP wants to invest more inmarketing (to focus on its brand strategy).
Valuation
Valuation multiples are low: adjusted 2008F PER of 11.3x, 2008F EV/EBITof 10.5x). As such, OP’s shares trade at a c.35% discount to its sector peersand at a c.12% discount to Belgian small & mid-caps on average. We believe such a discount to be exaggerated in view the company’s almost un-cyclical sector and long-term growth potential (CAGR 2006-09F EPS of 15.3%). We stick to our Buy recommendation and our €55 TP on the stock, based on a 20% discount to a blended peer group valuation.
Main shareholders (%) Couckinvest 29Own shares 2
Share data No. of shares (m) 25.9Daily turnover (shares) 75,269Free float (%) 65.2Enterprise value (€m) 1,411.0Market cap (€m) 1,210.8
Newsflow
Date Description
17 Jan 2008 4Q07 trading update 13 Mar 2008 (tentative)
At its foundation in 1987, Omega Pharma (OP)developed shampoos. By expanding its assortment andthrough internal and extensive external growth from1997 onwards, OP became a prominent OTCintermediary for pharmacists throughout Europe(ranked as Europe’s sixth largest), acting as a majorconsolidator in the fragmented European OTC market. OP has built up the largest sales network to Europeanpharmacists for its prescription-free, consumer-oriented health products, covering 30 European countries andnow employing c.1,650 people. In 2007, OP carved outits professional healthcare activities (Arseus) throughan IPO of this unit. OP and Arseus thus regained theirpure-play profiles in their respective activity fields. OPstill owns a 24% stake in Arseus. OP comprises five business units, which aregeographically defined: (1) Omega Belgium (c.25% ofsales); (2) Omega France (c.24%); (3) Omega North-Europe (c.12%); (4) Omega South-Europe (c.18%); and(5) Omega Rest of the World (c.21%). These businessunits market and sell OP’s consumer products (OTCmedicinal products, cosmetics, nutritional products,medical devices, phytotherapy products) – which aremainly and increasingly proprietary products – to pharmacists. Via a distribution agreement signed withEurogenerics, OP is also the number-one distributor of generic drugs in Belgium (with a market share ofc.40%). OP is still mainly active in Western Europe (92% ofgroup sales), but aims substantially to increase itsexposure to Eastern Europe (c. 8%) and lift it towards25-30% of group turnover in the longer term.
Risks The main risk to OP’s model is the inherent risk ofintegrating acquired activities. The achievement of ourtarget price is dependent on overall stock marketconditions, and consumer spending in healthcare andpersonal care products.
SWOT Strengths The increasing proportion of proprietary OTC brands First consolidator in a highly fragmented market Largest sales force in its main markets, enablingquicker market penetration for new products
Weaknesses Developing brand awareness for its products in newmarkets takes time
Opportunities Still significant growth potential to target (through furtherinternationalisation and consolidation), the exposure to the high growth Eastern European OTC market Spinning off the B2B activity should increase thepotential of both OTC and B2B
Threats Its relatively low valuation multiples and the increasingM&A in OTC could prevent OP from taking oversizeable targets
OncoMethylome’s pipeline of cancer diagnostics continues tobuild, with good data released on a bladder cancer test andon stool- and blood-based colorectal cancer tests in 2H07.2008 should see the company generate its first in-market revenues in the US and we remain fundamentally positive.
Investment thesis
Earlier, more accurate diagnosis of cancer is a huge unmet need and wouldresult in much-improved clinical outcomes, as would better assessment ofcancer risk. Aberrant methylation (a form of chemical modification) of certaingenes correlates with the onset and development of cancer. Detectingcancer-specific methylation markers brings the possibility of a newgeneration of ultra-sensitive diagnostics. OncoMethylome is a leader in this field and has key advantages over its competitors. The company hasdiagnostic products in development for six cancer types with a combinedmarket potential in excess of €1bn, we estimate. The company now has clinical data on a range of methylation-based tests including biopsy and urine-based diagnostics for prostate cancer (partnered with Veridex, part of Johnson & Johnson), a urine-based bladder cancer test, stool- and blood-based colorectal cancer tests and a test to predict response to Schering-Plough’s brain cancer drug Temodar. Key risks to our thesis relate to theunapproved nature of the company’s products and R&D risk.
Key newsflow
2008 should see OncoMethylome deliver on the next phase of its businessstrategy: that is, to begin generating revenues from selling its diagnosticproducts in the form of ‘home brew’ assays via US service laboratories. In particular, we expect the launches of the tissue-based early prostate cancer diagnostic via LabCorp and of the MGMT pharmacogenomic test (whichpredicts a patient’s response to Schering-Plough’s brain cancer drug Temodar) via an as yet unsigned laboratory partner. In addition, we expect tosee further partnering deals, potentially involving the company’s bladdercancer and CRC tests as well as several pharmacogenomic tests (followingon from recent deals with GSK Biologicals and Abbott).
Valuation
As a result of the lack of appropriate comparatives (given the depressed valuation of methylation competitor, Epigenomics), we use a risk-adjusted NPV to value OncoMethylome. We recently (28 November 2007) updatedour model for the weak US dollar and for pipeline developments (includingan assumed delay to the timing of royalties from US partner, EXACT Sciences, on its PreGen-Plus v2 colorectal test). This lowered our NPV-derived price target from €16.2 to €13.5. It should be noted, however, thatour NPV model uses a standard tax rate of 30% and makes no allowance forthe change in Belgian taxation of patent-related income which could seeOncoMethylome pay a sub-10% tax rate once established and profitable. _
Main shareholders (%) ING Belgium 18.5LSP 12.0Edmond de Rothschild 10.7PolyTechnos 9.2
Share data No. of shares (m) 11.8Daily turnover (shares) 8,910.0Free float (%) 40.1Enterprise value (€m) 86.7Market cap (€m) 112.2
Newsflow
Date Description
1Q08 FDA update on PreGen-Plus 13 Mar 2008 2007FY results 1H08 US launch of prostate test 1H08 US launch of MGMT test
Company profile Overview Based in Liege, Belgium, OncoMethylome Sciences is aleader in DNA methylation technology. This is anexciting new approach to cancer detection anddiagnosis that relies on the fact that aberrantmethylation (a specific type of chemical modification) ofcertain genes correlates with the development ofcancer. This technology may result in a new generationof ultra-sensitive cancer diagnostics and improvedpersonalised cancer treatment.
Technology leader OncoMethylome Sciences is one of two quotedcompanies (the other being Epigenomics) active in thistechnology field. We believe its market position is thestrongest given its pre-eminent proprietary technologyplatform (methylation-specific PCR) and its unrivallednetwork of scientific advisers (which includes three ofthe top five cited cancer researchers).
Broad pipeline, strong partners OncoMethylome Sciences has diagnostic products indevelopment for six cancer types with a combinedmarket potential in excess of €1bn, we estimate. Themost advanced are an early prostate cancer diagnostic(partnered with Veridex, part of Johnson & Johnson) and a test to predict treatment response in brain cancer(partnered with Schering-Plough). Each could generatefirst sales in the US reference laboratory market in 2008and achieve full commercial launch in the 2009-10 timeframe.
Risks The main risks are those associated with the novelty ofthe technology. While highly promising, none ofOncoMethylome Scence's diagnostic tests have yetbeen approved by the FDA or other regulatory body andfull clinical data has not been generated on any of itsproducts at this point. In addition, there are potentiallycompeting technologies (eg, DNA mutation analysisand RNA analysis) in the race to find new, improvedcancer diagnostics. OncoMethylome Sciences is loss-making as it invests heavily in its pipeline, and hencedelays or product failures could increase losses and thetimescale to profitability.
SWOT Strengths World leader in DNA methylation technology Strong commercial partners
Weaknesses Competitor methylation-based tests have disappointed Products not yet approved by regulatory authorities
Opportunities Large potential market for improved cancer detection Opportunity to use technology for targeted drug therapy
Threats Competitors developing diagnostics via range ofmolecular technologies Vulnerable to changing priorities of commercial partners
OPG’s outlook is mixed, with good strategic acquisitions in Direct & Institutional and roll-out of the Mediq concept, but ongoing uncertainties in the Polish and Dutch pharmacy markets. The valuation has become attractive, but we see limited short-term triggers; hence our HOLD rating.
Investment thesis
We maintain our HOLD rating due to the mixed outlook. At Pharmacies Netherlands, we see the roll-out of the Mediq concept as the right strategicstep. Feedback from the concept is positive, although it is too early to draw conclusions. However, we believe Mediq pharmacies are experiencing astrong increase in over-the-counter pharmaceuticals (4% of sales). Lookingat market conditions, we believe the new multi-party agreement for the two years from 1 January 2008 will give some stability. The agreement will have a €13m impact on EBIT, but most of it will be offset by efficiencies and betterpurchasing. Besides the multi-party agreement, recent measures from somehealthcare insurers to reimburse only the cheapest medicines provideuncertainty and may pressure the profitability of Dutch pharmacies. For the Direct & Institutional activities, we are also positive based on sustainablehigh organic growth of 6-8% and attractive acquisitions. Regarding Poland,we have a cautious view due to difficult market conditions with heavy competition and price pressure. That said, we believe OPG is taking the rightmeasures with new marketing efforts, standardisation processes and moremanagement attention. In this context, OPG has recently expanded itsexecutive committee by one member responsible for the Polish business.We believe the first target is to restore profitability and the sale of the Polishactivities is not currently on the agenda.
Key newsflow
The focus will be on acquisitions as, given its unleveraged balance sheetand healthy cash flow-generative power, OPG has plenty of opportunity for acquisitions (we estimate a warchest of at least €250-300m). In addition, the focus is on measures from the Dutch government and healthcare insurers toreduce the costs of medicines. Following recent Dutch pharmacy marketturbulence, with some healthcare insurers only reimbursing the cheapest medicines, we lower our EBIT margins for the Dutch pharmacy chain from9.8% in 2007F to 9.3% in 2008F and 9% in 2009F. As a result, we lower ourEPS from €1.74 to €1.70 for 2008F and from €1.84 to €1.79 for 2009F.
Valuation
Although the valuation is becoming attractive and OPG has a defensive profile, we retain our HOLD rating as we see few short-term positive triggers for the shares with pressure on profitability and still uncertain Polish market conditions. Based on our lower estimates and lower peer group multiples, we lower our TP to €20.5, implying a 20% discount to larger European peers. We see this as justified given OPG’s smaller size and relatively highexposure to a single regulatory environment, the Netherlands.
Main shareholders (%) Columbia Wanger Asset 7.3ING 6.1St. SAO 6.1
Share data No. of shares (m) 58.4Daily turnover (shares) 464,019Free float (%) 70.0Enterprise value (€m) 1,212.3Market cap (€m) 1,092.1
News flow
Date Description
11 February 2008 2007 figures 25 April 2008 1Q08 trading update
Share price performance
12
17
22
27
32
12/05 6/06 12/06 6/07 12/07PriceAEX All Share (rebased)
Company profile Overview OPG is a retailer and distributor of pharmaceutical andmedical supplies. With more than 6,700 employees, itspecialises in pharmaceutical operations and pharmacymanagement, pharmaceutical wholesaling and logisticsservices, and marketing and distributing medicalsupplies. The company has three divisions: PharmaciesNetherlands, consisting of the Dutch wholesale andpharmacy chain (50% of sales and 53% of EBIT);Pharmacies International, consisting of the Polish retailand wholesale activity (30% of sales and 5% of EBIT);and Direct & Institutional (20% of sales and 42% ofEBIT). More than 70% of revenues are generated in the Dutchmarket, and the company also has operations inPoland, Belgium, Norway and Hungary. In the Dutchpharmacy market, OPG is market leader with 207pharmacies, giving it a market share of around 13%. Its markets are characterised by high long-term growthdue to demographic factors and technologicalinnovation and by the structure of the healthcareinsurance and reimbursement system. For several years now, the company’s strategicexpansion has focused on activities targeted directly atthe consumer. Retailing currently accounts for around30% of sales and 70% of operating profit. The companyhas a selective acquisition policy in the Netherlands,due to its already strong position in the pharmacymarket. OPG is building a well profiled retail chain, and thelaunch of the Mediq Pharmacy is clear evidence of thisstrategy. In the Polish market, OPG will continue to acquirepharmacies. In addition, it targets acquisitions in the healthcare products and services sector. Financial targets are a ROCE of 15% and long-term EPS growth of 8-10%.
SWOT Strengths Market leader in the Dutch pharmacy market Strong market position in the attractive direct &institutional segment Strong balance sheet
Weaknesses Weak performance of Polish activities Very dependent on Dutch market Not a very strong acquisition track record abroad
Opportunities Further consolidation of the market, perhaps becominga target Demographic trends, such as the ageing of thepopulation
Threats Governmental regulation/pressure Uncertainties regarding the role of health insurancecompanies Risk of overpaying for acquisitions
Option’s latest results indicate that it has not yet found theway to face the strong price pressure experienced in itscommoditising industry. In addition, Qualcomm’s new platform is likely to further facilitate the entrance of newplayers and should result in more price pressure.
Investment thesis
• Option is a leading vendor of wireless data products (cards, USBwireless access devices, embedded modules and wireless routers) along with Novatel Wireless and Sierra Wireless. These slot into laptops andenable them to send and receive data over a wireless network. Option isheadquartered in Leuven, Belgium. Its main customers are operators thatsell the cards predominantly to corporate laptop users.
Gobi (global mobile internet) is a universal chipset developed by Qualcommwhich combines both the CDMA EV-DO and the HSPA technology.Qualcomm expects volume to start shipping in 2Q08. Although it potentiallyopens a new market for Option (CDMA), it facilitates the entrance of newplayers in the industry as its standard software and reference design makedealing with notebooks OEM and telecom operators much easier.
3Q07 disappointed again and 4Q07 guidance is at risk. Option’s management blamed: (1) supplier (Qualcomm) related technical issuespreventing the early rollout of higher-margin HSUPA products; and (2)several one-off items totalling €5.3m (inventory, bad debtor writedown andprovisions for accelerated R&D amortisation). Option is guiding for 4Q07sales of €90m and an EBIT margin of 9% excluding non-recurring elements. This already disappointing guidance still contains some risks in our view, asevidenced by: (1) the uncertainty relating to the level of additionalwritedowns (3Q07 results were not audited) that will have to be carried; and(2) several articles published in local press (De Standaard) quoting companyinsiders saying that 4Q07 sales may not even reach the €80m mark.
Key newsflow
For more than a year, newsflow has been dominated by negative surprises(four profit warnings) highlighting its difficult situation. As long as Option failsto successfully manage the transition from a low-volume high-margin player to a high-volume low-margin one, we believe newsflow will remain mostly negative. Further positive news related to the Intel partnership could have atremendously positive impact on the stock.
Valuation
Currently at 2007F multiples of 11.8x PER and 4.7x EV/EBITDA, the stock is at an average 30% discount to its peers. We believe a discount is justified inview of Option’s negative momentum (44% EBIT decrease in 2007F), therisk of further disappointments resulting from large impairement on theinventory and the receivables, the challenges ahead and management’s loss of credibility.
Main shareholders (%) Jan Callewaert 18.2Goldman Sachs 5.4UBS 4.7Sloane Robinson 3.5
Share data No. of shares (m) 41.2Daily turnover (shares) 61,572Free float (%) 81.8Enterprise value (€m) 187.5Market cap (€m) 234.3
Newsflow
Date Description
28 Feb 2008 FY07 results 24 Apr 2008 1Q08 results 24 July 2008 2Q08 results 23 Oct 2008 3Q08 results
Company profile Overview Option is a leading vendor of wireless data cards, alongwith Novatel Wireless and Sierra Wireless. These slotinto laptops and enable them to send and receive dataover a wireless network. Option is headquartered inLeuven, Belgium. Its main customers are operators thatsell the cards predominantly to corporate laptop users.
After strong demand at the end of the 1990s, Optionran into financial difficulties in 2001-02, as demand for GSM (2G) data cards ran out of steam. End-2003, growth re-accelerated thanks to high demand for GPRS(2.5G) cards, which allows operators to offer datatransfers to laptop users at reduced costs and fasterspeeds. The data card market received another majorboost with the launch of UMTS (3G) cards in 2004.
Going forward, growth is likely to be driven by demand for HSDPA (3.5G) and next generation HSUPA cards,which worldwide operators are widely deploying.Another driver should be recently announced tier 1operators Cingular, Orange, TIM, Telefonica,TeliaSonera and Hutchison 3G. Moreover, Option couldbecome a major supplier to the potentially substantialJapanese data card market.
Around end-2005, Option also launched new products,which should already represent 25% of 2006 revenues:(1) wireless modules, which are data cards integratedinside laptops; (2) wireless routers, which wirelesslyconnect all computers in a home to the outside worldvia mobile networks at broadband speeds; and (3)ICON dongles, which are data cards that can connectto any PC (laptop or desktop) through the USB slot.These new products carry lower gross margins thandata cards, except ICON, which Option expects to bethe largest revenue contributor of these new products.
Risks Competition in HSPA modules is increasing and islikely to result in lower profitability; potential furtherdecline in profitability are possible as a result ofincreasing competition from new entrants (Huawei andZTE).
SWOT Strengths Strong industry growth expected Net cash position
Weaknesses Low barriers to entry in commoditizing industry Not enough layers of management
Opportunities Partnership with Intel for Mobile Internet Devices Cheap valuation
Threats Chinese players to pressurize margins Unknown amount of impairments on inventory andreceivables
Although we believe Ordina is well positioned to benefit fromlong-term industry growth trends and further BPOinvestments should drive future growth, the share priceperformance may be hindered in the coming months bymarket concerns over the IT spend cycle.
Investment thesis
Ordina has a strong growth record. Organic growth was 12% in 2006 despitemid-double-digit attrition rates. Simultaneously, management has kept costsper employee under tight control by hiring less experienced staff. Henceoperating margins have continued to expand.
Ordina’s 2007 guidance should be achievable, although the tight IT labourmarket may prevent the company from significantly beating its guidance thistime. We expect Ordina to meet its sales guidance on the back of high-single-digit organic growth in the core portfolio excluding Business Process Outsourcing (BPO), the addition of BPO (€35m), acquisitions and additionalsales from the Rabo contract. Organic growth should be driven by priceincreases that should exceed expected wage growth of 3-5% and by a relatively small net inflow of new employees.
BPO activities should break even in 2008F, while still generating a smallEBITA loss in 2007F. Additional BPO investments of c.€25m in 2007F (€11m in 2006) should provide a platform with the ability to generate €100m in revenues, and BPO activities should reach group margins in the longer term.Ordina maintains a long-term 10-15% EBITA margin target, but also stresses that growth in application management and BPO is of the highestimportance. Large contracts with initially lower margins would thus not be rejected, and acquisitions will remain on the menu to reach market-leading positions.
Key newsflow
Ordina reports on a six-month basis. The next release is scheduled forMarch 2008 (the FY07 results). On 5 November, Ordina reiterated its full-year guidance for sales of c.€660m and EBITA of €61-64m.
Valuation
While we believe Ordina is well positioned to benefit from long-term industry growth trends, recent market worries over the IT spend cycle are likely tolimit chances for the share to outperform in the months ahead, hence we ourDCF-based TP of €12.5 and our HOLD rating. _
Main shareholders (%) Fortis 8.4UBS 5.8ING 5.0
Share data No. of shares (m) 41.6Daily turnover (shares) 127,240Free float (%) 85.0Enterprise value (€m) 524.7Market cap (€m) 505.7
Newsflow
Date Description
Mar 2008 2H07 results May 2008 AGM Aug 2008 1H08 results
Share price performance
10
12
14
16
18
20
12/05 6/06 12/06 6/07 12/07PriceAEX All Share (rebased)
Established in 1973, Ordina is a Dutch IT servicescompany that aims to have a leading position in theDutch and Belgian IT services market, in terms of bothquality and market share. Most of Ordina’s revenues are currently generatedthrough system integration activities, while the companyaims to increase revenues in application managementand in business process outsourcing in financial services. In early 2005, Ordina decided to withdraw from thecommoditised infrastructure management segment.Remaining revenues are generated in consulting. Themain industry segments in which Ordina is activeinclude the public sector, finance and trade, transportand industry. To develop its leading position further, Ordina continuesto pursue an acquisition strategy in the Benelux,targeting medium-sized organisations with annualrevenues of €8-40m, strong management andprofitability, and that would enhance its service offeringin specific knowledge or industry areas. The company is organised according to: (1) industrygroups, which include account management functionsand business solutions; and (2) knowledge groups. Thelatter deal with the following areas: enterprise solutions,systems integration and development, applicationmanagement, technical automation and infrastructuremanagement services. Risk profile Apart from the GDP-related IT demand cycle, Ordina’sgrowth is determined by its ability to attract and retainqualified staff.
SWOT Strengths Leading player in Dutch IT systems integration and consulting (particularly in the public sector) Solid management and strong track record
Weaknesses Limited exposure to long-term business GDP-sensitive IT cycle
Pinguin is building a leading position in Europe’s fragmentedfrozen-vegetable market. Valuations are attractive: the stocktrades at a discount to the sector despite superior growth prospects, and its free cash flow yield stands at 13%, asupportive level.
Investment thesis
Pinguin is a food processor that is building a leadership position in theEuropean frozen-vegetable market with an estimated 11% market share. We believe the company should deliver strong earnings growth (a 23% EBITCAGR in 2008F-10F) through operating efficiencies as it is taking on the roleof European sector consolidator. We expect operating margins to rise from2.8% in 2006 to 5.6% in 2010F, which should lead to a sharp turnaround inreturns on invested capital, from 5.8% in 2007F to 11.9% in 2010F, whichcompares favourably with our forecast WACC of 6.8%.
Further upside, not reflected in our model, could come from shifts in productmix (towards higher-margin convenience food) and entry into growingmarkets (Southern and Eastern Europe). Other identified growth driversinclude productivity enhancements, a focus on core competencies andacquisition synergies (especially from Lutosa).
Pinguin recently acquired Lutosa, the number-four frozen French fries producer in Europe, and two frozen-vegetable processors in the UK, buildingthe number-one position in the country. The build-up in capacity should lead to: (1) economies of scale; and (2) increased bargaining power with customers (food retailers, caterers and the food industry) and suppliers(farmers and cooperatives).
Key newsflow
Key to Pinguin’s recent strategic drive is its main (c.30%) shareholder, HeinDeprez, co-owner (with CVC) of Univeg, a leading European wholesaler offresh fruit and vegetables with €2.2bn in turnover. Pinguin could becomepivotal to CVC’s exit strategy through, for instance, a reverse takeover. Thiswould enhance Pinguin’s scope, size and free float. The market will also be tracking the critical price negotiations with suppliers (farmers) and clients(food industry, caterers and retailers).
Valuation
Our €18.7 target price is based on a DCF, valuing Pinguin at a 2008FEV/EBITDA of 8.0x, broadly in line with the sector average. Our analysis suggests a valuation range of between €16.5 (SOTP based on 2008estimates) and €20.4 per share (M&A takeout multiple). At such levels,Pinguin would trade at a 2008F EV/EBITDA of between 7.4x and 8.4x,compared with a sector average of 7.8x. The stock’s 13% FCF yield is alsovery supportive. _
Main shareholders (%) STAK 44Van den Broeke 15KBC PE 9Lur Berri 8
Share data No. of shares (m) 10.7Daily turnover (shares) 300.0Free float (%) 16.0Enterprise value (€m) 268.3Market cap (€m) 173.0
Pinguin is a leading European frozen-vegetableproducer, with total production capacity of close to300,000t of frozen vegetables and 325,000t of frozenpotatoes. Its production capacity is located in Belgium(vegetables and potatoes, with six sites in total and combined capacity of 395,000t), the UK (vegetablesonly, with five plants and 149,000t) and France(vegetables only, with one plant and 40,000t). Geographical exposure (estimated pro forma): theUK (43%), France (17%), the Benelux (10%), Germany(7%), Other EU (15%) and Others (8%).
Frozen vegetables (57% of 2008F sales) The company has an estimated 11% share of theEuropean frozen-vegetable market (No.3 position,behind Ardo of Belgium and Bonduelle of France).Pinguin shares a leadership position with Bird’s Eye in the UK with 30% of the market, through its existingplant in King’s Lynn (50,000t) and the recentacquisitions of Padley (40,000t acquired in June 2007)and Salvesen (59,000t acquired in August 2007).Pinguin has a 13.5% share of the Belgian frozen-vegetable market and is ranked No.2. Prior to the UKacquisitions, Pinguin’s main products included peas(17% of sales in 2005/06), carrots (11%), beans (10%),sweetcorn (5%) and spinach (5%). Mixes accounted for18% of sales. The acquisitions of Padley and Salvesenin the UK are likely to add to group sales of peas(Pinguin is now a leading European pea producer).
Frozen French fries (43% of 2008F sales) The exposure to the potato market is recent, throughthe acquisition of Lutosa (announced in June 2007), aleading Belgian frozen-potato producer, which has anestimated 6% of the European market (No.4 position)and 3% of the world market.
Risks Pinguin is reliant on uncontrollable external factors(climate change/diseases in crop yields, rawmaterial/crop prices, a harsh regulatory environmentregarding the use of fertilisers, etc). It operates a highly seasonal business with variable harvesting periods. Interms of value chain positioning, the risks lies with: (1)the security of supply; and (2) the concentration amongcustomers exercising pricing pressure on vegetableprocessors.
SWOT Strengths Strong market position in fragmented sector. Balancedcustomer split between food service, food industry andfood retail. Strong domestic market in terms ofvegetable supply (fertile farmland) and of Europeanlogistics (central positioning in a north-south axis).State-of-the art production facilities.
Weaknesses Highly dependent on external factors (climate, cropyields, raw material prices, etc). Seasonal business.Limited free float and investor relations experience.
Opportunities Lutosa’s sales network outside of Europe. Strong UKposition and ample restructuring potential. Productionflexibility. Strong shareholder structure with the Deprezfamily (could lead to synergies).
Threats Security of supply as, with the advent of lucrative bio-fuel-related crops, farmers can now arbitrage betweenvarious crops and threaten the supply of vegetables.Concentration among customers is exercising pricing pressure on vegetable processors.
Quest for Growth (QfG)’s NAV and share price declined since the end of October, in line with relevant benchmark indices. As a result, year to date capital gains within QfG’s fund are nearly wiped out and QfG’s dividend on FY07F operations is likely to be very limited. HOLD.
Investment thesis
QfG’s investment objectives can be summarised as follows. With its quoted portfolio (c.70% of funds), it aims to seek a high absolute return and thus the portfolio is sometimes hedged. Through its investments (c.30%) in unquoted companies, with an exit opportunity through M&A or an IPO, the QfG fund provides access to private equity and to pre-IPO capital gains following a company’s flotation. QfG’s rules state that 90% of its realised benefits are to be paid out via dividends. Owing to this 90% minimum payout, QfG’s NAV per share (or share price) cannot rise substantially.
Key newsflow
QfG filled up its private equity portfolio quite well during 4Q07, via: (1) a €1.5m investment in TcLand (active in the development of gene expression biomarkers in transplantation and auto-immune disorders); (2) a £1.1m funding of Prosonix (commercializes proprietary added value ultrasonic process solutions, mainly for the Pharmaceuticals and Minerals Processing markets); (3) a £1.5m investment in Syntaxin (biopharmaceutical company focusing on the development of new medicines derived from bacterial toxins to treat chronic diseases).
Within QfG’s private equity portfolio, we noted: (1) that the major licence agreement between IDEA (in which QfG invested €1m) and Alpharma for it main product Diractin resulted in a sizeable payment at closing (US$60m) and milestone payments (US$77m) and royalties. This appears to us as an important catalyst for IDEA, which in turn might result in substantial capital gains for QfG on this investment. In view of the difficult IPO climate for biotech companies in Germany, we do not expect an exit from IDEA to materialise soon; (2) Kiadis Pharma (in which QfG invested €2m) postponed its IPO to 2008 owing to worsening market conditions.
Valuation
QfG’s current NAV per share posted at €9.88 as on 31 December 2007, meaning the QfG shares trade at a 14% discount to NAV, which is in the middle of the historical range (0-40%). Our NAV-based target price on QfG is set at €9.30 (expressed post-dividend payment in 2008F) on a 12-month horizon, thereby assuming that QfG’s shares will trade at a 12.5% discount to NAV and that QfG’s quoted and unquoted portfolio should appreciate at a 10% annual rate for the remaining period up to January 2009F. This implies a total expected return on QfG shares of 10.1% (0.7% gross dividend and 9.4% increase in share price). Hence, we rate QfG a HOLD. _
Main shareholders (%) Dexia Bank 9.5
Share data No. of shares (m) 11.7Daily turnover (shares) 760.0Free float (%) 100.0Enterprise value (€m) 89.7Market cap (€m) 99.0
Company profile Overview QfG is a closed-end fund that invests in listed and non-listed, technology-based growth companies. QfG invests in sectors such as biotechnology, medical,healthcare, IT, software, electronics and new materials,and other opportunities in growth sectors. Funds under management amount to c.€120m, following the partial (74.7%) exercise of outstandingwarrants in October 2005 and the rights issue in April2007. QfG’s portfolio is diversified among sectors andcountries and can be hedged.
Specific investment rules (1) A minimum of 50% of the portfolio has to beinvested in equity. (2) A minimum of 70% of the portfolio has to be invested in either unquoted companies (target 35%),companies quoted on a growth market or venture fundswith an investment policy similar to QfG. (3) The company is not allowed to invest more than20% in one company, nor invest over €6.2m in oneyear in one company. A typical investment for QfGamounts to €1-3m.
Risks When stock markets are declining (or in a slump),QfG’s NAV is likely to be hit as the fund often invests inhigher beta stocks and as this might result in thedisappearance of exit opportunities for its private equitystakes (via IPO, M&A, etc).
SWOT Strengths QfG’s quoted portfolio managed quite regularly tooutperform the benchmark indices QfG has proved that it made good private equityinvestments, which led to huge potential capital gains
Weaknesses The size of QfG’s fund is often too small to get accessto very popular private equity financing rounds The lock-up on listed - former private equity -investments might lead to it missing the potentialunrealised capital gain entirely
Opportunities QfG’s private investments could unveil sizeable capitalgains, certainly in a context of increased M&A and anactive IPO climate
Threats When stock markets are declining (or in a slump), QfG’sNAV is likely to be hit as the fund often invests in higherbeta stocks and as this might result in thedisappearance of exit opportunities for its private equitystakes (eg, via IPO or M&A)
_
Quest for Growth: breakdown of holdings at 30/11/2007
The Vedior merger makes Randstad a strong global No.2, improving its exposure to specialist staffing, permanentplacement and Asia. In our mid-cycle dip scenario thiscreates attractive upside from operational/financial leverageon top of cost synergies, but not without a higher risk profile.
Investment thesis
In the first week of December, Randstad and Vedior announced they hadreached a conditional agreement to combine both companies. In our viewthe merger offers attractive upside in our mid-cycle dip scenario as Randstad would benefit from (1) operational leverage; (2) financial leverage; (3) upsidefrom synergies; and (4) re-rating potential. However, we also acknowledgethat the risk profile for the short-to-medium term has increased given theuncertainty on the cycle, ie, Randstad is vulnerable in a recession scenariodue to its financial leverage and internal focus.
The rationale for the deal is clear, ie, (1) Randstad strengthens its existingmarket positions/global footprint and solves strategic issues like its smallmarket positions in two major staffing markets, ie, France and the UK; (2) it becomes a global leader in professional staffing, improving exposure from18% to 26% (ING estimates); (3) improved exposure to the structural growthniche of permanent placement; (4) increases exposure to emerging marketslike Asia; (5) Randstad puts the balance sheet to work; and (6) exposure toNL is reduced from 35% to 22%, and Randstad might create more value inVedior’s volume contracts via the introduction of its Inhouse concept.
Randstad guides for €100m in synergies of which €80m is cost synergiesand €20m tax synergies. The €80m cost synergies represents c.1.1% ofcombined overlapping sales vs an estimated 1.5% seen in the USG-Solvus merger. We believe the €80m is a cautious, but rational amount given the more limited overlap between Randstad and Vedior.
Based on our assumptions the merger would be earnings accretive in FY09Fby c.9% and also EVA positive, while Randstad guides for EVA positive inFY10F (ie, its cycle assumptions are more cautious).
Potential issues: Randstad might face competition issues in NL althoughdependent on the market definition. Based on CBS data and ING estimateswe estimate that the combined market share would come out at c.25% vsc.44% in the narrow market definition. Also the merger of a mono-brand (Randstad) and multi-brand strategy and the minority structure at Vediormight make the integration more risky (cultural differences).
The balance sheet seems recession proof. A stress test in our recessionscenario still gives a maximum net debt/EBITDA of 3.0x which is safe.
Valuation
On our pro forma EPS estimates Randstad trades at a 2008F EV/EBITDA of6.0x, ie, an 8% premium to the sector, but still at a 17% discount to Adecco. _
Main shareholders (%) Mr F. Goldschmeding c.43
Share data No. of shares (m) 116.6Daily turnover (shares) 1,215,250Free float (%) 40.0Enterprise value (€m) 2,833.8Market cap (€m) 3,215.9
Company profile History Randstad was founded in 1960 as one of the firststaffing companies in Europe. Randstad has an EBITAmargin target range of 5-6% through the cycle andguides for at least 4% in the downturn and more than6% in the peak of the cycle. Randstad generates c.32%of sales from specialist staffing. Free float is c.45% andthe largest shareholder, founder F Goldschmeding,owns c.40-45%.
Geographical spread The following splits are based on pro forma figures:Randstad's mainstay is the Netherlands where itgenerates 22% of total sales. Outside the Netherlands itgenerates 10% of sales in North America, 10% inGermany, 9% in Belgium, 23% in France, 5% in Spain,8% in the UK, 3% in Italy and 4% in other Europe.Randstad ranks No.1 in the Netherlands, Belgium,Portugal, Poland, Canada, and India and Germany.
Segmental spread Specialist staffing as a percentage of sales is currentlyc.32%. Looking to its segmentation to service conceptswe see that Randstad generates 79% from mass-customised services, 15% from in-house and the highly specialist yatch unit produces 6%. Randstad employs amono- brand strategy in combination with somespecialist labels. Main brands: Randstad, Tempo-Team (the Netherlands, mass-customised), Capac (in-house services, volume), yacht (professionalsNetherlands/Germany), Teccon (engineering Germany)and MartinWardAnderson (UK professional).
Risks A general slowdown of economic growth worldwide butspecifically in the Netherlands and Germany.Integration risk Vedior. Vulnerable in recession due torather high leveraged balance sheet.
SWOT Strengths Strong No.1 position in Benelux and Germany High exposure to large but immature growth market ofGermany Management Disclosure Cash-flow generation
Weaknesses US margins and overcapacity Dependence on Netherlands
Opportunities Improve US margins Expand in Asia Increase exposure to specialist staffing Margin/cost management in downturn Successful integration of Vedior Higher cost synergies with Vedior
Threats Integration risks Vedior Leveraged balance sheet Strengthening competition in Germany Investing into the downturn Adecco acquiring USG People
We maintain our HOLD recommendation on Recticel in theabsence of share price triggers, thereby balancing betweenits low valuation and good operational performance in most of its businesses on one hand, and the still difficult outlook forits US interior trim activity on the other.
Investment thesis
The capex linked to Recticel’s major expansion in interior trim and the recentlyrecorded losses on this ‘spray’ activity (mainly in the US), alongside thesensitivity to raw material price increases in foaming, have increased thecompany’s gearing over the years and brought it close to a breach of covenant on its €250m syndicated loan facility. In order to reduce this debt burden,Recticel tried to divest from the promising (but loss-making) interior trim activity (which did not materialise), cut capex for this activity and refunded the companythrough a €50m subordinated convertible bond loan. In view of the restructuringof the US interior trim operations, we expect Recticel’s net debt level gradually todecline as the company is performing fairly well in all other fields.
Key newsflow
1H07’s operational performance for all divisions surprised positively, inparticular Bedding and Insulation, where Recticel capitalises onenvironmental and energy issues. To meet the buoyant demand inInsulation, Recticel will increase its capacity in the UK by c.30% by mid 2008F.
In 2009F and 2010F, Interior trim’s growth is most likely to stall as severalprojects are moving to a phase out, whereas new projects will replace themand move into the ramp up phase. So as to reassess this outlook and toaccount for the prosperous evolution in Recticel’s other divisions, we reviseour forecasts, which results in a 5.9% increase in EPS 2007F (from €0.91 to €0.96), a 9.6% rise in EPS 2008F (from €1.12 to €1.22) and a 4.3%decrease in EPS 2009F (from €1.33 to €1.28).
Valuation
We maintain our HOLD recommendation, but raise our TP from €10.60 to €11.30 (based on a 10% discount to sector peers on PER, EV/EBITDA andEV/EBIT for 2008F and 2009F) on Recticel. We believe the downside risk onthe shares to be limited in view of the company’s low valuation (adj. 2008FPER of 8.1x, 2008F EV/EBITDA of 4.4x, at a c. 30% discount compared tothe median for Belgian small & mid-caps when comparing EV/EBITDA,EV/EBIT and PER for 2007F to 2009F). However, we consider a c.20%discount as logical in view of Recticel’s cyclical and low margin profile.Speculation on the eventual sale of the interior trim activity might re-emerge in the future, and may revive Recticel’s share price. However, we do notexpect this to materialise soon, and there is a lack of short-term catalysts to drive the stock higher. _
Main shareholders (%) Rec-Hold+Bois Sauvage+Vean 33.18Mercator Verzekeringen 8.77Rec-Man 3.58
Share data No. of shares (m) 28.6Daily turnover (shares) 59,906Free float (%) 51.4Enterprise value (€m) 553.3Market cap (€m) 284.9
Newsflow
Date Description
Early Mar 2008 2H07 results 15 May 2008 AGM 28 Aug 2008 1H08 results
Company profile Overview Recticel is a leading polyurethane foam converter andbedding group. The group operates in four differentmarket sectors (bedding, automotive, flexible foamsand insulation) and retains a prominent Europeanposition in several of them. The group has more than100 plants in 26 (mainly European) countries.
Bedding (c25% of 2006 sales) In the bedding sector, Recticel is the major producer ofmattresses and slat bases, which are marketed undervarious well-known brand names such as Beka, LiterieBultex, Lattoflex, Swissflex, Schlaraffia, Superba andEpeda.
Automotive (30%) The company supplies some of the world’s leading carmanufacturers with a clear focus on selected niches (ie,moulded foam for car seats and interior fittings) inwhich Recticel holds a significant and growing marketshare.
Foam (38%) This division manufactures foam fillings for cushions,furniture and mattresses. The brand marketingapproach (Comfort Bultex), often linked with its bedding activity, secures a European market share of c.20%.This activity also comprises the development of a widerange of technical foams for specialist applications.
Insulation (7%) The insulation branch supplies materials to the buildingand industry sectors. This activity aims to capitalise onthe increasing interest in insulation and on the superiorinsulation features of PUR.
Risks The main part of Recticel’s turnover relates to lowmargin business (eg, foam fillings, seat cushions),where Recticel is vulnerable to raw material priceincreases, which are often difficult to recover in itsselling prices and/or which can only be applied after acertain timelag.
Geographical breakdown of sales European Union: 87%, RoW (eg, US, Japan): 13%.
SWOT Strengths Strong brands and positioning in the bedding sector Top European player in foaming Recticel’s ‘spray’ technology enjoys higher demandthan the company’s financial structure can meet
Weaknesses Poor balance sheet: high gearing, low interest cover Main part of turnover relates to low-margin business (eg, foam fillings, seat cushions) Around 65% of turnover relates to mature, slow-growing end-markets
Opportunities A divestment of the Spray activity should lower thecompany’s debt burden and substantially increase itsnet earnings Eastern Europe provides further growth opportunities
Threats A deteriorating operational performance might lead to abreach of a covenant on its syndicated loan facility Rising raw material prices are difficult to recover in the company’s selling prices (or with a certain time lag)
Resilux’s gross margin should strengthen, capitalising on an improving product mix and decreasing overcapacity in thePET packaging market. As such, Resilux shares’ downside risk should have diminished, but we rate Resilux a HOLD as the upside potential to our DCF value is too limited.
Investment thesis
After five consecutive semesters below break-even, 1H07 results surprised positively, driven by economies of scale (fairly stable cost basis, 10% YoYvolume growth and a better product mix resulting in better capacity usage).The good weather conditions in 1H07 contributed to this as well. As Resilux’s market appears to show signs of recovering as the adverse impactof excess capacity in the European PET packaging market starts to diminish, thanks to the recovering German market and the inherent growth of its endmarkets, we believe a more favourable era in terms of pricing could (finally)be initiated, which should result in operational leverage kicking in whenconsidering Resilux’s high fixed cost base.
Key newsflow
Outlook: whereas the poor summer weather conditions point towards aserious drop in volumes sold in July and August 2007 (est. -15%?) causing weaker cost coverage in 2H07F, other elements are supportive for Resilux’s evolution in 2008F and beyond. We expect, in line with management, that2H07F net result will exceed the weak level recorded in 2H06 (-€0.7m), but we bank on a net result hardly exceeding the break-even level (ING est. €0.4m).
On the positive side, we believe the strengthened gross margin will persist in 2008F and 2009F (without expanding) in view of a gradually improvingproduct mix, due to the gradual shift from volume products to an increasinglybroad assortment of higher barrier PET preformed products offering a longer shelf life to items such as carbonated drinks, beer, fruit juices, wine andketchup. Moreover, the overcapacity in the PET packaging market isdiminishing (thanks to the recovery of the German market and its structural growth) and competitors do not appear to invest in additional capacity.
Valuation
Despite the very disappointing share price performance since 2003 (or evensince 1998), Resilux still trades at high valuation multiples in terms of PER orEV/EBIT, but in terms of EV/EBITDA for 2008F or 2009F (respectively at 5.6x and 5.0x) or P/FCF c.10x, in our view the current share price level indicates a diminishing downside risk. Resilux’s valuation multiples arec.13% lower than sector peers in terms of EV/EBITDA, but c 40% higher in terms of PER, which appears to us as not offering material upside potential.We have a €39 TP on Resilux, which represents a 10% discount to our DCFvalue. _
Main shareholders (%) Tridec (de Cuyper family) 46.5de Cuyper family 11.0
Share data No. of shares (m) 2.0Daily turnover (shares) 152.0Free float (%) 42.5Enterprise value (€m) 127.9Market cap (€m) 76.9
Resilux specialises in the manufacturing and marketing of PET (polyethylene teraphthalate) preforms. Resiluxwas founded in 1994 and since then has increased itsproduction capacity and geographic coverage at a rapidpace. Resilux now has production sites in Belgium,Spain, Russia, Greece, Switzerland, Hungary and theUS.
PET preforms and bottles Resilux specialisation relates to the manufacturing andmarketing of PET preforms. These PET preforms aresubsequently blown into bottles (either by Resilux orthe customer) and then filled with either water, softdrinks, edible oils, ketchup, detergents, milk, beer orcosmetics. Resilux’s product range consists of a varietyof preforms and bottles: standard preforms with weightsranging from 12-103g, custom-made preforms (colourand/or design according to client specifications) andbottles that can be designed for single or multiple use.Moreover, multi-layer preforms and bottles areproduced to enable PET bottles to contain beer, fruitjuices or milk. Resilux also offers the second step of thetwo-stage manufacturing process of PET bottles:blowing preforms into bottles. As the volume mountsdrastically at this second stage, this activity is eitherdone at or very close to the premises of Resilux’sclients. Resilux currently has three in-house blowingprojects. Geographical breakdown of 2006 sales: WesternEurope 71%, Eastern Europe (ex-Russia) 14%, Russia11% and ROW 4%
Risks The significant overcapacity in the European PETpackaging market, the amplitude of the recoveringGerman PET market and the weather conditions can largely influence Resilux’s results in either way.
SWOT Strengths Top European player in PET packaging Highly flexible, geographically well spread and state-of-the-art machinery
Weaknesses Seasonality of operations Partial exposure to raw material price fluctuation The need to dispose of excess capacity for just-in-time delivery to clients High gearing
Opportunities Entry into new markets with additional PET applications(eg, detergents and cosmetics) Potential of fruit juice, milk, wine or beer market
Threats Excess capacity in the European market continues tosqueeze already limited margins Price erosion of preforms
In our view, the takeover of L’Express provides RMG with plenty of opportunities to exploit over a 3-5 year horizon, and allows RMG to join another league in magazine publishing. The uncertain magazine advertising climate might, however, limit RMG’s short-term share price potential.
Investment thesis
Roularta Media Group (RMG)’s business model contains several medium-term catalysts. Through the purchase of Groupe L’Express Expansion (GEE), RMG’s expansion in French printed media activities has taken a leap forward, while also offering RMG an opportunity to leverage on improving GEE’s low profitability. In 2007F, RMG’s audiovisual media activity should also mark a further EBIT improvement, driven by contracted additional revenues for its TV content and high growth in radio revenues alongside the company’s cost-saving programme. For 2008F, we believe several positive trends are initiated on which RMG should be able to capitalise in FY08F (eg. at GEE), but we expect the difficult magazine advertising market to limit a steeper bounce YoY in profitability (which we estimate at 19.5% YoY in terms of EPS).
Key newsflow
At GEE, we estimate 2007Fs EBIT margin at 3.5% and at 8% for 08F, thereby accounting for the more difficult French advertising market and some restructuring charges. We expect the non-recurring charges at GEE in 2008F to become fairly limited, as the integration process will be finalised in 2007F to a large extent, in our view.
In Audiovisual Media, we expect VTV’s sudden (and drastic) drop in 3Q07 sales to have a c.€1.2m impact on the divisional EBIT. On the other hand, we think VMM’s EBIT should double YoY, to 14.7%, driven by cost savings and additional revenues in TV and the continuing strength (and operational leverage) in the radio operations. Kanaal Z might prove to be a disappointing element in the FY07F results.
Outlook: Management states that prospects for radio and TV activities (AM) remain good and that the readers’ market (PM) continues to evolve positively as well. However, management remains cautious on the advertising market, in particular in France, where the social climate affects advertising spending. For the French activities, 2007F should be a transition year, but this statement has already been made before.
Valuation
Our DCF value on RMG stands at €62.90. In view of ING’s underweight stance on the media sector and its valuation (in line with the median for Belgium small and midcaps and at a 12% discount to sector peers on PER, EV/EBITDA, EV/EBIT and EV/sales for 2007F to 2009F), we stick to our HOLD recommendation, but lower our TP from €58 to €56, so as to align it with a 10% discount to our DCF value.
Main shareholders (%) Stichting Administratiekantoor RMG 64.2
Share data No. of shares (m) 11.0Daily turnover (shares) 20,733Free float (%) 32.4Enterprise value (€m) 729.2Market cap (€m) 543.4
Roularta Media Group (RMG) is a well-diversifiedmedia player. It is market leader in Belgium for its freesheets, news magazines and commercial TV station.RMG is also active in related activities such as TVproduction, CD-ROM and DVD replication activities,and radio stations. RMG is Belgium’s main advertisingseller.
Printed media (c.77% of sales 2007F) RMG is the market leader in Belgian free sheets viaseveral publications, such as De Streekkrant and DeZondag. The company also holds a dominant positionin the Belgian magazine market via titles such asKnack, Trends, Le Vif/L'Express. In 2006, RMG markeda milestone in its international expansion and statusthrough the full acquisition of Groupe ExpressExpansion, thereby becoming the owner of themagazine L’Express, which is ranked as the worldwideNo.7 in terms of paid circulation and adult readership(2.3m) within news magazines, with ‘Time’ and‘Newsweek’ as the respective No.1 and 2.
Audiovisual media (c. 23% of sales 2007F) This division (AM) groups television and radio activitiesas well as RMG’s production of audiovisual mediacarriers such as DVDs. The lion's share of which stemsfrom VMM, the holding company of VTM, the mainFlemish commercial TV station, which holds a marketshare of c.21%, behind public broadcasting channelTV1 (29%), but clearly ahead of Canvas (10%), VT4(6.9%) and VMM’s second channel, Kanaal 2 (6.8%).
Geographical breakdown of 07F sales Belgium 63%, France 34%, ROW 3%.
Risks With a large exposure to Flanders (Belgium) andFrance and depending on the willingness of companiesto spend money on advertising, RMG’s revenues arevulnerable to the economic environment.
SWOT Strengths Leading market shares in its different (Belgian) activities Relatively high resilience to a declining advertisingmarket, thanks to a high proportion of subscription sales
Weaknesses Little room for expansion in Flanders Fragmented group structure with a lot of JVs, limitingoverall control
Opportunities Expansion in France, through the intended acquisitionof L’Express and the acquisition of Point de Vue Further internationalisation of successful formats (eg, , magazines and free sheets) Further diversification in some content-related niches
Threats Cyclical nature of advertising expenditures Sensitivity to increasing paper prices
Although core activities have a long-term attractive growth and profitability profile, we believe there are some short-term clouds at Geosynthetics and Grass. Therefore, we believeFY07 guidance is too challenging. Looking at the valuation we believe TenCate’s growth potential is already priced in. Hold.
Investment thesis
Longer term, we are positive as we see significant potential to lift growth andprofitability to a higher level, however shorter term we believe there aresome clouds on the horizon. Longer term: positive. Looking at the five coreactivities we think TenCate has significant potential to raise growth andprofitability to a higher level. Aerospace: the longer-term growth story is extremely attractive with each new generation of aircraft using more composites. Armour: with the recent acquisition of Roshfield and ComposixTenCate has further strengthened its position in this attractive market.Besides a strong position in Europe, the company has now as a result of theacquisition of Composix also a good position on the highly attractive fastgrowing US armour vehicles market. Protective fabrics: these activities arecurrently running at full capacity in the US to meet the high level of demand.We expect a decision to expand capacity in 2008. Grass: after the recentacquisition of Mattex, TenCate is the market leader (market share of 70%)in this fast-growing (15% on average per annum) market. Geosynthetics:except for Asia we consider this as a mature market with relatively modest profitability levels. Shorter term: some clouds. At Geosynthetics in the USvolumes are more or less stable, but profitability is declining. Rising materialprices have a negative impact (the time lag for passing on to clients isaround three months) with all producers focusing on filling capacity.TenCate’s Grass operation is having some problems with the expandedmachine fleet in the Netherlands, which is not functioning at maximumcapacity. As we expect these problems will not be solved easily, we lower our estimates for 2008 from €2.25 to €2.11 and for 2009 from €2.61 to €2.51.
Key newsflow
Focus is on 2007 results to be released end of February. Although TenCateadmits that growth in 3Q07 was sluggish it kept its guidance for net profitgrowth of at least 25%, implying a net result of €42.5m. Zooming in on the 4Q07 implies a net profit of €12m compared with €7m last year. The reasonsfor a strong 4Q07 are large deliveries in protective wear, the contribution ofMattex, a catch up in anti-ballistics and deliveries of Cetex to Airbus.However, we believe the guidance is challenging and leaves limited room forpositive surprises on the upside. We forecast a net profit level of €40.8m.
Valuation
Although valuation becomes attractive we have a HOLD rating as we believe there are limited triggers in the short term with its high exposure to the US.Based on our lower estimates and lower peer group multiples we lower ourTP to €22. TP is also supported by our SOTP valuation and DCF model.
Main shareholders (%) Kempen 15Schroders 11WAM 9
Share data No. of shares (m) 23.4Daily turnover (shares) 83,452Free float (%) 0.6Enterprise value (€m) 711.4Market cap (€m) 468.9
Company profile Company Profile Royal TenCate is a Dutch based company producingtechnical textiles and synthetic materials used in a widerange of applications. The company’s main activitiescomprise the production of artificial grass, antiballisticand flame resistant materials, aerospace compositesand protective fabrics. TenCate also manufacturestextiles used in civil engineering, agriculture and otherindustries, as well as fabrics for outdoor applications.Ten Cate roots date back to early 1700, and operates in the US, Europe, Australia and Asia. Since the early1990s, the company transformed its operations fromtraditional textiles to become a specialist in technicaltextiles, plastics and rubber products. The company is aglobal player, headquartered in Almelo.
Adv Textiles & Composities (2006: 36% of sales) TenCate’s advanced textiles & composite divisionconsist of three business units. The Protective andOutdoor fabrics produce protective and safety fabricsfor applications in specialist professions and industry and for outdoor applications. Mainly active in Europeand the US, the company is global market leader insafety fabrics. The Aerospace activity deliverscomposites mainly to the aerospace industry. ArmourComposites makes composites for bullet- and stabproofbests, as well as armouring vehicles used by armedforces.
Geosynthetics & Grass (2006: 52% of sales, 36% of Geonsynthetics produces synthetic fabrics, nonwovensand grids used in civil engineering projects. The grassactivity basically operates in two markets, syntheticgrass used for sport pitches and for landscaping.Following the recent acquisitions of Mattex, TenCatehas become the segment market leader by a significantmargin.
SWOT Strengths Global market leader in safety fabrics Fix it/exit strategy focusing on restoring profitabilitylevels and divesting activities Value chain management
Weaknesses Time lag for passing increased material prices
Opportunities Strong prospect in the use composite in the aerospaceindustry
Threats Rising raw material prices High exposure to US dollar
Although the office furniture market shows improving marketconditions, we believe operational leverage at Samas islimited by gross margin pressure and a relatively too high cost level. We expect no fireworks from the strategic reviewto be concluded in March 2008, and maintain our Hold rating.
Investment thesis
With a new management team, Samas has left the European dream andpotential benefits from Harmony behind. In order to survive and becomeprofitable again, focus is internally on the stabilisation of the organisationand reduction in complexity. Therefore, Samas will again adopt the countrymodel with responsibilities at the individual national organisations. In addition, focus is on streamlining its product portfolio which we consider toobroad with almost unlimited options. However, we believe the impact ofthese measures will take time to be felt, as the product offering can only bechanged once a year and portions of the contracts contain long-term commitments. Looking at the market conditions, developments are inpositive territory, with accelerating growth in Germany and good prospectsin the Benelux; only France is still relatively weak. Despite the newinitiatives from the new management, we still fear that operationally Samaswill be not ready in time to benefit from the improved market conditions. Wealso believe operational leverage at Samas is limited owing to the grossmargin pressure and a relatively overly high cost level.
Key newsflow
We expect to hear more on the strategic review regarding variouspossibilities for restoring profitability. The timetable is to finalise this processaround March 2008. Samas expects the office furniture sector will continue to consolidate, especially on a national level. Looking at the possibilities,acquisitions are certainly not on the agenda for the coming two yearsconsidering its stretched balance sheet. Also, room for further plantclosures is limited. Looking at geographic areas, we believe the first priorityregarding strategic options is France. However, France has beenunderperforming already for years, so selling this business at a reasonableprice is no easy task. We expect no real fireworks from the strategic review, as financial room is limited and the operations are not yet in the right shapeto secure an acceptable price, in our view.
Valuation
We maintain our HOLD recommendation as we see few triggers with theoffice furniture market already showing a recovery, but Samas is not yetready to benefit. Looking at the valuation, the stock trades at a discount of50% to its larger peers, which we consider justified, given the high riskprofile at the moment and its relatively low profitability levels. _Look
Main shareholders (%) ING 21.0Kempen 9.8Generali 5.8
Share data No. of shares (m) 34.1Daily turnover (shares) 30,382Free float (%) 30.0Enterprise value (€m) 220.8Market cap (€m) 170.8
Newsflow
Date Description
March 2008 Strategic update May 2008 FY07/08 figures
Share price performance
456789
101112
12/05 6/06 12/06 6/07 12/07PriceAEX All Share (rebased)
Samas is a leader in the European market for officefurniture, with a broad product range. Its core activitiesare the sale and production of furniture and chairs forthe B2B office furnishing market. Samas is active in Europe through around 20 localcompanies. Strong local brands give it leading marketpositions in the Benelux (22% of sales), Germany(51%) and France (27%). In the medium term, it will benecessary to decide, in each case, whether it makesmore sense to manufacture itself or buy in. As a leadingplayer, Samas has an excellent starting point to build further. Consolidation in the industry should give rise toa small number of large players. Samas is likely to playan active role in this process and look more toacquisitions and/or collaboration with major players. After four years of crisis in the European office furnishing market, the structural objective for return oninvestments throughout the cycle has faded. At thistime, Samas has no targets, but the 18% objective forreturn on investment will be redefined when the marketstabilises. History has shown that a disproportionate decline in theoffice market, as in recent years, is followed by a morethan proportionate rise in market demand when theeconomy does recover.
SWOT Strengths Market-leading positions in Europe Introduction of attractive new product lines
Weaknesses Weak earnings track record and low visibility Weak balance sheet Limited room for further restructuring if needed
Opportunities Shift of production to low-cost countries Weakening local competition, especially in Germany
Threats Slowdown in the European office furniture market Gross margin pressure in office furniture markets
The sharp input price increase in 2007 is a hindrance todouble-digit earnings growth and may offset positive triggersstemming from newly awarded contracts. At a 15% discount to Saipem, we rate SBMO a HOLD with a TP of €24.
Investment thesis
The upswing in oil & gas capex continues at full speed; double-digit E&P capex increases can be expected for 2008-09, after up to 20% growth in2007. This is due mainly to the high oil price and production firms strugglingto keep up with demand growth against dramatic depletion rates.
SBMO benefits fully from being a major participant in offshore deepwateracreage, as this is one of the strongest growth segments. FPSOs, SBMO’s main product line, are cost-effective and attractive compared with otherdeepwater solutions such as fixed platforms. Furthermore, oil majors arebecoming more convinced that calling in a contractor shifts projectresponsibility onto that contractor, including a reduced chance of delays.This means the main contractors have to be strict with their sub-contractors to deliver, with contracts almost signed before the main contractor tenders aproject. There is also a price risk, which materialised in 2007 with regard to projects won in 2006 but with deliveries due in 2008 and probably 2009.Input prices skyrocketed during 2007, and several suppliers were unwilling todeliver to SBMO unless concluded prices were renegotiated. As a result,SBMO is suffering margin pressure in its supply parts business. There is noguarantee that margins will recover in the short term.
On the plus side, SBMO is on the verge of securing important contracts suchas P-57, two contracts from BP and Shell’s Bonga Southwest. For purchase contracts, SBMO is now more strictly organised, so margin pressure shouldease. From a lease viewpoint, we believe SBM will be able to stick to its 12%demanded return, thanks to its consistent focus on major oil firms.
Key newsflow
The key news item will be preliminary figures released at the end of January.We expect SBM to repeat its guidance of 7 December: for modest earningsgrowth in 2008 while barely exceeding 2007’s guidance of US$265m. Thiscould be a disappointment to the market, as consensus is too high. In our view, the margin pressure in supply and modest outlook explain whyinvestors are focusing more on earnings growth than awarded projects.
Valuation
Trading at a 2008F EV/EBITDA of 10.5x or a 15% discount to Saipem (€27, Not Rated), a SOTP value of €19 implies that only 1.5 FPSOs are includedin the current share price. To this, we add a further 1.5 FPSOs to reach our€24 TP. We rate SBMO a HOLD, as we believe the market will shift its focusfrom projects to slow earnings growth, especially in supply parts, bearing arisk of figures disappointing in 2008. _
Main shareholders (%) Cap Research and Management 6.5Schroders 5.0
Share data No. of shares (m) 144.7Daily turnover (shares) 583,301Free float (%) 100.0Enterprise value (US$m) 6,133.5Market cap (US$m) 4,522.6
Newsflow
Date Description
29 January 2008 Prel. FY07 figures 11 March 2008 Def. FY07 results 15 May 2008 AGM 19 August 2008 1H08 results
Share price performance
161820222426283032
12/05 6/06 12/06 6/07 12/07PriceAEX All Share (rebased)
Company profile Profile SBM Offshore designs, builds and operates equipment,vessels and complete systems for the global offshoreoil & gas industry. This encompasses the design andconstruction of FPSOs (floating storage and offloadingvessels) and FSOs (based on the same principle butwith oil, gas and water separation carried out in aseparate facility), in addition to associated equipment. SBM aims to keep its position through advancedtechnology and to be a preferred supplier by keeping itsexcellent track record in timing, delivery without costoverruns and operational performance. It aims to haveoil majors and NOCs on its client list and targets largecomplicated FPSOs. In the future, it aims to participatein the booming LNG industry by designing and buildingoffshore import terminals. The group also contracts and operates FPSOs underlong-term leases to oil companies. In early 2007, SBMOffshore had 12 FPSOs and four FSOs/MOPUstor/semisubs in operation, with three and two underconstruction, respectively. This gives a worldwideleading position in lease FPSOs with an estimatedmarket share of 35%. SBM’s lease portfolio contributesthe lion’s share (70-80%) of EBIT except for in 2007when it contributed as low as 55%.
Risks The main risk on the downside is a sharp fall in oilprices leading to lower spending in oil and gas E&P.Another risk is a further upturn in costs that cannot bepassed on, eroding margins. On the upside, risks couldinclude SBM gaining large contracts, enabling it toexpand its lease fleet materially in 2010 (by five units ormore).
SWOT Strengths Worldwide leader in lease FPSOs with a 35% marketshare Strong technological basis with advanced product range Able to execute the most complicated projects with thehighest added value at attractive rates Clients, in general, of highest quality including major oilfirms and state-owned oil companies.
Weaknesses Dependent on one segment of the oil services market Not always commercial enough Dependent on timing of projects
Opportunities Deepwater capex exceeds that for oil & gas in generaland FPSOs are a cheap and, in timing terms, attractivealternative for other sorts of platform Gulf of Mexico not yet open but opportunities are there Offshore import LNG terminals will expand SBMO’sproduct range in an attractive market segment
Threats Competition with deep pockets and lower cost of capitalbut also lower salaries and FX rates Only a few very big customers Shortage of employees in the oil and gas industry
We rate Sioen Industries a BUY in view of the improvingfinancials, a positive outlook (2006-09F EPS CAGR of 20.2%)underpinned by strong growth in the trailer market and its low valuation multiples (eg, 2008F PER of 10.8x).
Investment thesis
Sioen should be able to capitalise further on the strong demand for trucktarpaulins (c.30% of group sales) and the resulting better capacity usage,further development of new products (coatings as well as apparel), theaccretive impact of recent acquisitions and the imposed selling priceincreases and the further optimisation of the product mix and client portfolioin the Apparel division. In our view, this combination of elements will result in a sizeable operational leverage in 2007F (2007F EBIT +31% YoY, net EPS+34.7% YoY).
Key newsflow
Sioen’s 3Q07 sales update and its 1H07 results provided evidence oforganic growth in coating, persisting strong demand in truck tarpaulin sales and a sharp gross margin recovery (+270bp) compared with 2H06. WhereasApparel’s top line continues to decline YoY (-7.3% in 1H07), it should be noted that divisional EBITDA surged 89% YoY during the same period. Assuch, Sioen continues to focus on margins rather than on volumes, byimproving its product mix and its client portfolio.
Considering the positive statements of truck manufacturers such as Volvoand Scania (European orders increasing more than 40% during the first ninemonths in 2007), and which continue to see strong demand in 2008F (5-10% growth according to Volvo trucks), we believe Sioen is well positioned tobenefit from higher volumes (and firm pricing) in its truck-related activities (c. 30% of sales), as well as from the resulting better capacity usage.
Valuation
Sioen trades at attractive 2008F valuation multiples (PER of 11.5x, EV/EBITDAof 6.1x, P/FCF of 12.5x) as the shares did not really capitalise on the clearlyimproved results and outlook in 2007. We have a €10.80 TP on Sioen, aligning it with a 5% discount to Belgian small & mid-caps on PER, EV/EBITDA andEV/EBIT for 2007F-09F. At €10.80, the shares would still leave Sioen trading at a12% discount to its DCF value. In view of the company’s expected earningsgrowth (2006-09F CAGR of 20.2%), the strength in its main market (Europeantrailers) and its low valuation, we rate Sioen Industries a BUY. _
Main shareholders (%) Sihold NV 60.3
Share data No. of shares (m) 21.4Daily turnover (shares) 6,218.0Free float (%) 39.7Enterprise value (€m) 352.7Market cap (€m) 209.6
Sioen Industries is an integrated group specialising intechnical textiles. The group's main activities comprisethe coating of synthetic fabrics and manufacture ofprotective coated clothing. Sioen was founded in 1960and now owns 29 production plants and 32 sales unitsin 14 countries. During its expansion, Sioen adopted apolicy of diversification and vertical integration.
Coating (c.60% of sales) Sioen’s coating division boasts worldwide marketleadership in the coating of synthetic fabrics. The coating makes the fabrics waterproof and gives themspecific technical properties. Market niches aretargeted, including tarpaulins and commercial banners.
Apparel (c.17% of sales) Sioen's apparel division holds European marketleadership in protective coated clothing. This divisionalso manufactures active outerwear. Industrialprotective apparel includes general industrial winterclothing and rainwear, high-visibility clothing, garmentsfor the chemical industry, etc, and higher value added niche products such as fire-resistant clothing and bullet-proof vests.
Industrial Applications (c.23% of sales) Sioen is the world's largest producer of tarpaulins andcurtains, enjoying a market-leading (45%) market shareamong new trailers. This division also includes productssuch as inflatable silos, pond foils, etc, and an airbagcutting activity. Geographical breakdown of 2006 sales was: Western Europe 81%, Eastern Europe 8%, US 2% &ROW 9%. Risk statement: Sioen’s business model is sensitive toprice increases of polymers and the strength of thetrailer market.
SWOT Strengths Strong international market positions in coating andapparel High vertical integration strengthens market positionand margins Weaknesses Still insufficient diversification in coating’s product mix Sales are sensitive to weather conditions
Opportunities Expanding its product mix in new niches, in a quest forhigher diversification and higher margins Increasing and intensifying its geographical scope
Threats Asian competition in apparel Raw material price increases are often difficult torecover in selling prices
Sligro’s short-term performance is being hampered by a toughintegration and turnaround process at the approximately 80 converted former Edah supermarkets. This development is insharp contrast to the outstanding performance of Sligro’slarger Foodservice division.
Investment thesis
Although government plans for 2008 do not bode well for Dutch retailspending (eg, tax increases), expected wage increases, low unemploymentrates and rising food inflation should help preserve momentum.
We believe Sligro’s Foodservice division (60% of 2008F sales), which ended2007 with 9.1% organic sales growth in 4Q07, should continue to benefit from a combination of good Out-of-Home market conditions and a favourablecompetitive environment. Negative factors such as the smoking ban frommid-2008 should be more than compensated for by extra demand stemmingfrom events such as the European Football Cup and the Olympics. Withcosts well under control, EBIT margins should rise further from an estimated6.5% in 2007 to 6.8% in 2008.
Sligro’s food retail division (40% of 2008F sales) should face anothertransitional year. Since the group’s 3Q07 trading update, it has become clearthat the integration of former Edah stores is going less smoothly thanplanned. The problems mainly stem from lower-than-expected sales uplifts post-conversion in combination with high operating costs. Assuming nofurther conversion costs, our 2008 forecast indicates an EBIT marginrecovery of 120bp to 2.2% (note that this comes from 5.2% in 2006).
For the group, we forecast 8% and 31% net profit growth for 2007 and 2008,respectively. Our 2008 forecast reflects the absence of conversion costs andimproved store efficiency.
We have a HOLD rating on Sligro given the limited upside potential to ourDCF-derived €28 target price. The main downside risk to our TP comes frompotentially bigger integration/execution problems at the converted formerEdah stores. Upside risk could come from a faster margin recovery at the converted former Edah stores.
Key newsflow
On 3 January, Sligro reported 24.4% higher FY07 sales of €2,066m. Organic sales growth amounted to 5.6% (6.9% in 4Q07: Foodservice 9.1%, Foodretail 0.5%). Sligro publishes its FY07 results on 24 January, at which point itshould provide more clarity on its food retail operations.
Valuation
On 2008F PER (13.5x) and EV/EBIT (10.9x) multiples, the shares trade at13% and 4% respective discounts to other European retailers. Under normalcircumstances, Sligro should trade at a premium in view of its highergrowth/return profile. Currently, however, the lower-than-usual visibility as a result of the problems at Food retail warrants a more in-line valuation.
Main shareholders (%) Slippens family 33.95ING 7.79KCM 6.36Darlin 6.12Boron 5.19
Share data No. of shares (m) 43.4Daily turnover (shares) 73,141Free float (%) 100.0Enterprise value (€m) 1,317.2Market cap (€m) 1,187.9
Newsflow
Date Description
24 January 2008 FY07 results
Share price performance
15
20
25
30
35
40
12/05 6/06 12/06 6/07 12/07PriceAEX All Share (rebased)
Company profile History Founded in 1935, Sligro traded edible oils and fats.Through organic growth and acquisitions, it achieved aleading position in the Dutch food distribution market.With the acquisitions of Prisma (2000), Em-Té (2002)and a 50% stake in a legal entity that acquired the Edahstores (2006), Sligro entered the food retail arena. Focusing on its Foodservice activities, Sligro acquiredVen, a major foodservice player in the Netherlands, in2004 and Inversco in 2006.
Foodservice (60% of 2008F sales) The Foodservice division services the professionalfood-sellers market. Hotels, restaurants and smallretailers are served by a national network of cash &carry outlets under the Sligro brand and by homedelivery. With c.€1.3bn pa in sales, Sligro ranks secondin this market segment behind Makro (Metro,Germany). Its main competitors are Deli XL (Bidvest,South Africa), Makro and Hanos (privately owned, theNetherlands). The institutional market is served by VanHoeckel and Inversco.
Food wholesale and retail (40% of 2008F sales) Sligro entered the home market via the acquisition ofPrisma at the end of 2000. Prisma acts as wholesaler toGolff and Meermarkt supermarkets, among others. Golffand Meermarkt are medium-sized supermarkets. In2002, Sligro acquired Em-Té, a supermarket operatorwith c.€100m pa in sales and a very strong market position in the Tilburg region. The latest acquisition, ofthe Edah chain, should almost double Sligro’ssupermarket sales by 2008. Its main competitors areAlbert Heijn, Schuitema, Sperwer and Laurus. From4Q07 onwards, Sligro started transferring its small storewholesale business (Meermarkt) into a new jointventure with Sperwer.
Risks Risks include changes in consumption trends,competitor actions, management decisions andoperational execution. Since 4Q06, the group has beenmore exposed to food retail with the acquisition of c.80former Edah stores. The transition process entails extrarisks over the immediate term.
SWOT Strengths Seasoned management team, market-leading positions in several foodservice segments in the Netherlands.Track record of almost 5% organic sales growth overpast 15 years.
Weaknesses Low market share in food retail, exposure to leisureregions gives volatility.
Opportunities Add-on acquisitions, store openings in food retail,successful turnaround of converted former Edah stores.
Smit is again surpassing earnings forecasts in 2007, butdisappointment could be around the corner, with c.70% of itsresults from unpredictable Transport, Heavy Lift and Salvage. Moreover, the URS acquisition was expensive. Fully valued at an adjusted 2008F EV/EBITDA of 8.5x, we maintain our HOLD.
Investment thesis
Smit has undergone a successful transformation since 2002, with newmanagement transforming Smit from an unfocused outfit into a company witha clear strategy of making valuable investments in new equipment. Marketcircumstances have improved considerably, supporting Smit’s strategy andleading to an eightfold hike in net earnings between 2002 and 2007F to over €100m. However, beside the more structural component of energy-related activities, extraordinary circumstances have supported earnings growth.
Our concern is that extraordinary circumstances will return to normal:hurricanes still exist, but it is doubtful whether they will strike as they did in2005. Certainly they did not do so in 2006 and 2007. Looking at the 2007results, the dependence on Salvage and Transport Heavy Lift (THL) isextreme and, we believe, unsustainable, representing 70% of EBIT. The EBIT of Heavy Lift, THL’s most cyclical part, was also better than normal in 2007thanks to salvage contracts for wreck removals; we see this as unsustainable.
Smit has undertaken a large investment programme in its core HarbourTowage and Terminals business, and both divisions are growing in line withexpectations. HT suffered from the Rotterdam strike in 1H07 and maybe2H07, but other harbours compensated over the full year. Terminals has wona couple of interesting contracts, and Transport Services, the low-cyclical part of Transport, is growing rapidly. The main question is whether the €200m capex programme over the coming years, which supports earnings growth incore divisions, will be enough to compensate for a return to normality in Smit’scyclical businesses. We believe not, with the risk of earnings disappointment.
We see the 50% URS stake acquisition as alright strategically and as bringingmore stability to Smit’s earnings, but consider the price to have been high, withthe business not set to generate a ROACE over WACC before 2011F.
Key newsflow
No newsflow is expected before 2007 figures are published in March 2008,with Thunder Horse salvage moving towards arbitration (and perhaps anappeal) in 2008 or even in 2009 whereas we expect a settlement for Arctic I.
Valuation
We rate Smit a HOLD, believing it to be fully valued. The risk is high of THL and Salvage dipping by 25% in 2008, entering into a more normal earningspattern, while Smit also made an expensive acquisition. At a 2008FEV/EBITDA of 8.5x, or 8.3x adjusted for the value of participations, thevaluation is demanding. Our €62.8 TP is based on a break-up of HT and Terminals (peer group comparison) and THL and Salvage (DCF).
Main shareholders (%) Delta Deelnemingen Fonds 14.91JP Morgan 10.09Fairplay 9.99ING Group 8.28
Share data No. of shares (m) 17.4Daily turnover (shares) 15,062Free float (%) 48.0Enterprise value (€m) 1,319.7Market cap (€m) 1,200.8
Newsflow
Date Description
6 March 2008 FY07 results 7 May 2008 AGM
Share price performance
20
30
40
50
60
70
80
12/05 6/06 12/06 6/07 12/07PriceAEX All Share (rebased)
Smit International is c.100 years old and has vestedpositions in harbour towage, terminals, salvage,transport and heavy lifting. It has booked strong resultssince a reorganisation in 2002. A new strategy hasbeen implemented to transform Smit into a focused andgrowth company (via acquisitions and organically).
Harbour Towage (23% of revenues, 27% of EBIT) This business provides the vital link between ship andberth as well as other port-related activities. It hasstrong positions in three of the biggest harbours in theworld – Rotterdam, Antwerp and Singapore – and additional towage concessions in Panama andVancouver. It is building up a position in Brazil with 18tugs in six harbours. With the acquisition of URS, Smitbecomes larger in Harbour Towage from 2008.
Terminals (20%, 16%) This business involves managing and operatingterminals on- and offshore and providing associatedservices. It has a leading position with as many as 20terminals, mainly in West Africa and the Middle East.
Salvage (26%, 26%) This business offers salvage and maritime emergencyresponse services and wreck removal. It also takescare of the environment with specialised services toremove oil and chemicals. With a 25-35% marketshare, Smit is the world market leader, most famous forcomplex salvage operations (such as the Kursk).
Transport & Heavy Lift (37%, 39%) Smit is the leading provider of transport and heavylifting solutions for clients with special needs. Besidesshort-term contracts, Transport now has a couple oflong-term (one- to five-year) contracts for services withseagoing tugs. HL often lends equipment to salvage.
Risks Higher-than-expected demand in energy-related businesses is the main upside risk to our HOLDrecommendation. Downside risk could come from adelay in harbour and terminals expansion. Anotherdownside risk is the possibility that earnings decline ofTHL and Salvage is much higher than we expect.
SWOT Strengths One of the world’s largest towage firms, with footholdsin three of the world’s top ten harbours; strong positionsin terminals, one of the leading firms with operationsmainly in West Africa. Leading salvage firm under LOFTransport and heavy lift; leading firm in size of craneson a boat and strong position in heavy transport. Strongbalance sheet, with limited debt
Weaknesses Cyclical company dependent on external factors suchas world trade volumes. Backlog in investments built upbetween FY00-04. Replacement in HL too expensive
Opportunities Further growth of trade worldwide; Larger shipsentering harbours which need towage Opening of newmarkets offering opportunities for Smit to achieve ahigher market share in towage Growth of FPSO andLNG terminals due to boom in energy supplies. Morecomplex salvage operations including environmentalprevention or clean-up. O&G demand for transport
Threats Competition from subsidiaries of companies with deeppockets such as SvitzerMuller (Maersk). Local orharbour regulations or monopoly and no entrancepossible. Fast-growing terminals firms (eg, Lamnalco).
Since the arrival of Jan Brouwer (ex Schuitema) as CEO inNovember 2006, SDB’s recovery has slowly been takingshape. However, with much of the earnings recovery potentialalready priced in and limited upside potential, we rate thestock a HOLD.
Investment thesis
Since the arrival of CEO Jan Brouwer in 2006, SDB’s recovery has slowlybeen taking shape. Like-for-like sales development turned positive in 2Q06,but this has not yet resulted in a return to profitability (the company’s FY07net profit target is to break even). SDB’s most recent sales figures (3Q07)again imply a loss of market share on a store-by-store basis, on top of a further loss in share due to planned store closures. By the end of 2007F,SDB should service some 318 SDB stores (down 39 YoY), of which 175should be operated by franchisees. In 2008, SDB’s management will need to focus on several issues: first, own stores, which are performing less wellthan franchise stores in terms of sales density, need to be made moreprofitable, a tough project given the intense competition in the Dutch market.The second challenge is to come to a reasonable wholesale marginagreement with its franchisees. SDB has not reached an agreement on thisfor either 2007 or 2008, according to Distrifood. The problem is (the thirdchallenge) that SDB has the highest selling prices and needs to make price cuts (to become more competitive in the marketplace), for which franchiseespartly have to pay. However, having faced with many large investments inrecent years and poor profitability, they have issues doing so.
The above, together with the fact that SDB’s selling prices are still among thehighest in the market and the possibility that leader Albert Heijn could start anew price war in 2008, make us cautious on the potential/speed of recoveryof SDB in 2008. Limited upside to our TP and our view that much of the earnings recovery potential is already priced in explain our cautious stanceon the stock. Given the lack of profitability and suitable partners/buyers, wedo not expect M&A activity in the short term.
For 2007, we forecast net profit of €1m, followed by €11m in 2008. The latter corresponds to EPS of €0.10, giving a PER of over 30x.
Key newsflow
SDB reported 2.1% and 5.4% LFL sales growth in 3Q07 and 2Q07,respectively. It will report 2007 sales figures on 16 January. In view of thebenign Dutch consumer environment and positive industry forecasts for2008, albeit largely driven by food inflation, we expect SDB to continue topost positive LFL sales figures.
Valuation
Our €3.5 TP is based on a DCF analysis. Compared with European peers,the shares trade at a c.20% premium on 2008F EV/EBITDA and a c.75%premium on 2008F EV/EBIT, reflecting the group’s sub-trend earnings. _
Main shareholders (%) Casino Guichard-Perrachon 44.4Bank consortium (ING, RABO, ABN) 6.7Total Casino potential 51.1Amber Capital LP 18.0
Share data No. of shares (m) 114.8Free float (%) 100.0Enterprise value (€m) 475.4Market cap (€m) 384.6
Newsflow
Date Description
10 July 2007 2Q07 sales 28 August 2007 1H07 results 9 October 2007 3Q07 sales 16 January 2008 FY07 sales
Share price performance
1.52.02.53.03.54.04.55.05.5
12/05 6/06 12/06 6/07 12/07PriceAEX All Share (rebased)
Company profile History Laurus came into existence in 1998 through the mergerof Vendex Food Group and De Boer Unigro, forming thethen second-largest food retail company in theNetherlands behind Ahold’s Albert Heijn with a 26%market share. Following eight years of setbacks due towrong concepts and poor execution, the decision wasmade in 2006 to sell two of the three remainingsupermarket chains and focus on the Super de Boerchain. On 1 January 2008, Laurus changed its name toSuper de Boer. French retailer Casino owns a 45%stake with an option (until end-2009) to increase it to51%.
Super de Boer With a market share of c.7%, Super de Boer ranks No.5behind Albert Heijn, C1000, Aldi and Plus. Super deBoer is positioned as a high quality supermarketformula with attractive prices. Today’s reality however isthat quality perception is average, while selling pricesare the highest in the market. Following the plannedsale of 50 underperforming stores in 2007, Super deBoer should have around 300 stores that generate annual net sales of c.€1.7bn. Almost 60% of thesestores are runned by franchisees.
Risks These include changes in consumption trends,competitor actions, management decisions, operationalexecution and equity market volatility.
SWOT Strengths Seasoned CEO (Jan Brouwer), who has over 25 yearsof experience in food retail and franchising/foodwholesaling in particular.
Weaknesses Selling prices are among the highest in the country, 5th
position in a competitive environment, the roughly 50/50combination of own stores and franchise stores.
Opportunities Improve execution, price perception, align distributionprocesses and improve relationship with franchisees.
Threats A potential price war in 2008 as Albert Heijn would liketo further improve its price perception. Further loss ofmarket share due to potentially more storedisposals/closures and below-market growth rates.
Active portfolio management has structurally improved TMG’smarket position, but newspaper ad trends remain sluggish.Telegraaf promises to reach peer profitability levels in 2009F,vs current depressed margins, which reflect a lack of efficiency. We rate the stock a HOLD.
Investment thesis
1H07 proved another tough period for Telegraaf Media Group (TMG), as evidenced by a further slight decline in newspaper subscribers andadvertising volumes in its national daily. TMG failed to benefit from the earlysigns of an improving Dutch economy, unlike during the upturn in the early1990s. We believe this setback has made management even more awarethat its core newspaper product is highly mature. To deal with this, thepublisher is restructuring to reduce costs.
In March, management set ambitious targets for 2009, namely for EBITAmargins of 15% for print (vs 6% in 2006) and 30% for digital products. Notethat the 15% print target amounts to c.13.5% at the group level because it isnot applicable to printing and distribution activities. Our 2009F EBITA marginestimate is for 8.6% as we have taken into account announced personnel reductions to date and, given Telegraaf’s track record, we want to beconvinced by results first.
More importantly, TMG is accelerating its strategy of shifting sales from(mature) newspapers to ‘younger’ media such as broadcasting and theinternet, which are gaining advertising market share. Important steps haveincluded buying 49% of Sky Radio and divesting the Limburg and Wegenerregional newspapers. Next, we expect Telegraaf to: finance potentially largeacquisitions, such as buying the 51% of Sky Radio it does not already own (c.€100m); possibly invest more in SBS (c.€230m to maintain its stake ifdiluted by the potential ProSieben merger) and sell regional newspapers inHolland (€240m); or buy back another c.5% of its shares.
Key newsflow
Key newsflow to watch will involve advertising trends and M&A. We expectquarterly advertising trends to improve on the back of a growing Dutcheconomy. M&A should continue at Telegraaf, with the potential for anacquisition of the remainder of Sky Radio in the summer when Dutch media laws are expected to be relaxed.
Valuation
Our valuation of Telegraaf is in line with the European consumer publisherpeer group average of 2008F EV/EBITDA of 7.7x. We maintain our HOLDrating as we believe Telegraaf needs to realise cost savings and we prefer to be cautious, even though its upgrade to a multimedia profile and its higher-return targets are promising. For these reasons, our target price continues tobe based on Telegraaf trading at a c.10% premium to peers on 2008FEV/EBITDA. _
Company profile History From its origins as De Telegraaf, publisher of the Dutchnational newspaper of the same name, the companyhas grown mainly organically but also through smallacquisitions. It has since changed its name to TelegraafMedia Group.
Newspapers Telegraaf Media Group publishes the largest Dutchnational daily with a circulation of c.700,000 and ac.40% market share. It also holds a c.13% market sharein Dutch regional newspapers, with strongholds in the provinces of northern Holland, and publishesfreesheets.
Consumer magazines Telegraaf Media Group holds the number-two positionin Dutch consumer magazine publishing, with anestimated 15-20% market share, behind Sanoma. Italso publishes consumer magazines in Sweden.
Radio TMG owns 49% of Sky Radio, one of the strongestradio assets in the Dutch market, with the option toexpand to 100% once cross-ownership rules allow.
Stakes Telegraaf Media Group holds a valuable option toacquire 12% of the pan-European broadcasterProSiebenSat1/SBS for €455m in summer 2008.
Risks Risk factors include advertising revenues, which makeup about half of Telegraaf’s overall revenues, executionof cost savings and finding acquisition candidates atattractive multiples.
SWOT analysis Strengths TMG owns the largest newspaper in the Netherlands(more than twice the size of runner-up Volkskrant) and has strong brands in the Netherlands, such as the Prive magazine
Weaknesses Newspaper publishing is a mature business facing a structural decline in subscribers Relatively high cost structure
Opportunities Expansion into new media Improve efficiency and capitalise on scale
Threats News readership is partly shifting to the (free) internet Advertisers shift their spend online
Telenet has a strong position in Belgium with the second–largest broadband market share (leader in Flanders), and issuccessfully delivering on its business plan. The forthcomingdeal with Flemish cable operator Interkabel should unlockvalue by expanding Telenet’s customer base. BUY.
Investment thesis
The company is delivering on its business plan of cross-selling triple-play services to its existing customer base and recently added a mobile product(on Mobistar network) to its product portfolio. In 3Q07, 18% of its customerbase comprised triple-play customers (against 13% in 3Q06), while itsbroadband customers grew by 16% YoY (organically) and its iDTVcustomers by 86%. Telenet shows strong operationals with an EBITDAmargin of 48% and total revenues up 15% for 9M07.
Telenet successfully implemented its refinancing plan last year. Of the€2.3bn of new debt, €1.9bn has already been drawn to reimburse existingdebt and pay a €6-per-share capital reduction to shareholders. Theremaining €400m to be drawn could be used for acquisitions, internalprojects or be paid back to shareholders.
Telenet is engaged into an ambitious network upgrade programme (Mach 3)that will result in bandwidth expansion and the implementation ofEurodocsis3.0. The upgrade should be achieved by the end of 2008 and willenable higher broadband speed of up to 200Mbps downstream and 30Mbpsupstream.
Telenet announced a promising deal with Interkabel last November. TheFlemish cable operator has agreed in principle to acquire Interkabel’s800,000 TV customers (expanding Telenet’s existing 1,700,000 TV clientbase) for 8x EV/EBITDA, which appears fair to us and would unlocksignificant value for Telenet, allowing it to offer its triple-play product to all of Flanders. This should add €1.5 of fair value per share (coming from cost synergies and incremental customer intakes) if it proceeds under the currentframework.
Key newsflow
We expect the signing of the deal with Integan and the three other inter-municipalities to be a catalyst for the stock. This is expected to happen by the end of 1Q08 as Integan required external advising which is delaying thetransaction. Although there is little room for cable consolidation in Belgium,Telenet’s CEO Duco Singhe announced its desire to build an alliance withSouth Belgium cable operator Voo, which could be announced in 2008.
Valuation
The stock trades at 7.8x EV/EBITDA, which compares with 7.3x for US peersand to M&A transaction multiples of 9-10x. Risks include the potentialintervention of the regulator on broadband prices, which have been stable in Belgium for the last three years. Our €23.5 target price is DCF-based.
Main shareholders (%) Liberty Global 52.1Financial consortium 4.7MIC/Electrabel 3.3Fortis 3.2
Share data No. of shares (m) 101.3Daily turnover (shares) 36,178Free float (%) 43.8Enterprise value (€m) 3,843.6Market cap (€m) 2,007.8
Company profile Telenet is a cable TV operator present in the north ofBelgium (Flanders) offering a triple-play service (digitaltelevision, broadband, telephony). The company has itsown network with 1.7m cable TV customers to which itcan offer its triple-play product. In addition, Telenet cansell its broadband internet and telephony products andservices to 0.8m subscribers on a Partner Network. Telenet’s revenues were well balanced in 2005 with36% of revenues from television, 31% from broadbandinternet, 21% from telephony and the rest frombusiness services. The current growth engine of the company is internetbroadband but the launch of a digital platform and the digital migration of its basic television subscribers are atthe core of Telenet’s strategy, opening new avenues forfuture revenue growth. The company raised €280m at its IPO in September2005 and used the proceeds to reimburse €255m worthof existing debt. The company is still heavily geared at3.8x EV/EBITDA for 2005F. We do not envisageTelenet paying a dividend in the next three years.
SWOT Strengths Strong management team. Enjoys a duopoly with Belgacom on broadband. Cable is not regulated, unlike copper and mobile.
Weaknesses Growth potential limited in Flanders. Highly leveraged balance sheet.
Opportunities Expansion of customer base through Interkabel deal. Further consolidation/alliances in Belgian cable.
Threats Dispute with Integan might not solve out. Broadband prices may be impacted by regulation.
Tessenderlo published strong 3Q07 results (8 November) and held a reassuring analyst meeting afterwards. Since then, the share price has dropped 25% on what we believe to be exaggerated fears of a PVC margin squeeze. We recommend BUYing the shares.
Investment thesis
On 8 November, the company published above-consensus 3Q07 figures and increased its FY07 REBIT guidance from €126.5m to c.€147.4m. Tessenderlo confirmed on 25 November that October was in line with thegood 3Q results. Therefore, on 26 November we raised our FY07F REBITestimate from €146m to €156.8m, which cautiously implies that 4Q07Fresults should be in line with the weakest quarter of 2007 (REBIT of €35.9m)
For 2008, Tessenderlo confirmed that its ‘target 2007’ cost-cutting plan is on track, which implies a €20m increase in REBIT. Further, Tessenderlo seesstrong price increases for raw materials, but is confident that these increaseswill be passed on into the prices of inorganic products. Also, it expects acontinuation of improvements in Specialities. The main uncertainty for 2008comes from PVC. Tessenderlo sees no negative signals so far, but expectsa slight decrease in margins in 2008, on the back of slower building activities. We expect that the margin between PVC and Ethylene, which wecurrently estimate at €654/ton, will gradually decline to €609/ton by the endof 2008. As such, we expect Tessenderlo’s 2008F REBIT to decline to€143.1m (from €158.6m in 2007F). Our new estimates imply a drop in PVCFY08F REBIT of €24m (or 28%) from €84.5m to €60.7m, which is more thana ‘slight decrease’, and as such we believe our estimates are sufficientlycautious.
Key newsflow
Further upside potential could come from ‘strategy 2012’, in which the aim isa ROCE of 12% in all businesses. Today, Tessenderlo does not earn aROCE of 12% in Gelatin, but is addressing the problems of its UK (bone)gelatin plant and should continue to invest in South America and Asia (higher growth and lower costs). Further, Tessenderlo is seeking alliances inits commodity activities (current ROCE is 12%), although we do not expectany related announcements before mid-2008. Finally, Tessenderlo issearching for new takeovers in the lucrative field of activities that combineservice providing and valorisation of by-products (style Kerley and Caillaud).Tessenderlo should report 4Q07 results on 13 March 2008.
Valuation
We value Tessenderlo at a 10% discount to its peer group multiple of 5.9x 2008F EV/EBITDA at €44 per share. This valuation at 5.3x 2008FEV/EBITDA seems fair, given Tessenderlo’s relatively high exposure to thecyclical PVC activities, compared to its peer group of diversified chemicals. _
Main shareholders (%) SNPE 25.7
Share data No. of shares (m) 27.4Daily turnover (shares) 88,294Free float (%) 73.6Enterprise value (€m) 1,129.5Market cap (€m) 938.0
Newsflow
Date Description
13 March 2008 FY07 results 24 April 2008 1Q08 results 3 June AGM 28 August 2008 2Q08 results
Company profile Tessenderlo is a Belgian diversified chemicals groupwith leading global/European positions in most of itsproduct areas, thanks to a strong focus on nichemarkets and a high level of industrial integration. Itsmain market is Europe (80% of sales). Tessenderlo hasthree divisions. French state-controlled company SNPEcould divest its 26.41% stake, possibly from end 2007Fonwards.
Chemicals This division comprises the PVC, Inorganics and Chlor-Alkali activities. PVC is the most unstable contributor togroup earnings due to the volatility of PVC prices.Production capacity is 550,000 tons of VCM and480,000 tons of PVC pa. Some of the raw materials,such as chlorine and hydrochloric acid, are producedin-house. The Inorganic activities include the formermineral division (production of sulphates, potassiumand sodium sulphate, worldwide No.1 producer of liquidsulphur-containing fertilisers) and the electrolysis unit(production of 300,000 tons of chlorine pa). Chlorineproduction also releases c.100,000 tons of causticpotash and c.250,000 tons of caustic soda. In 2006,this division accounted for 42% of group sales and 42%of group REBIT.
Plastics converting This division represents the downstream integrationtowards the plastic pipes systems and PVC profilesextrusion activity of the Group as PVC producer. In2006, these activities generated 34% of group salesand 76% of group REBIT. Overall, the construction andrenovation sectors represent 80% of divisional sales.
Specialities This division is based on three major business units:Fine Chemicals, Gelatin and Natural Derivatives. For several specialities, Tessenderlo holds a leadingposition in the world market. In 2006, Specialitiesgenerated 24% of group sales, but had a negativecontribution to overall REBIT.
SWOT Strengths Diversification and vertical integration temperTessenderlo’s cyclical nature Leadership in niches Attractive dividend yield
Weaknesses Cyclical nature Cost basis is euro-dominated
Opportunities Target 2007 cost savings programme Strategy 2012 ROCE improvement programme Reduction of WC programme underway Cogeneration programme started
Threats Uncertainty regarding sale of SNPE stake EU investigation into possible animal feed phosphatecartel Increased competition from low-cost counties for commodity products
Although US dollar weakness recently led us to trim ourtarget price, we note that TiGenix has met its key promisessince its March 2007 IPO and that its ChondroCelect cartilagerepair product is on track for launch in 2008/9. We remainfundamentally positive and see M&A possibilities.
Investment thesis
Over 2m patients pa are diagnosed with knee cartilage damage, mostlysports-related, and we believe this represents a substantial (>€1bn) market opportunity. TiGenix aims to develop biological treatments for damagedjoints and its lead product, ChondroCelect, is the first ever to havesuccessfully undergone a pivotal phase III trial (known as TIGACT01) designed to meet FDA and EU regulatory standards. This trial comparedChondroCelect with microfracture, the current surgical standard-of-care in the treatment of full-thickness knee cartilage injuries. Results, after 18 months of follow-up, showed that ChondroCelect met the trial endpoints of superiorityof structural repair and non-inferiority in short-term clinical outcomes. This trial will be followed for up to five years to see if the superior structural repairseen with ChondroCelect results in improved long-term clinical benefit. Following regulatory review of this study, we believe that ChondroCelect could be launched in Europe in late-2008 and in the US in 2009 and weestimate that it has the potential to achieve sales of €85m pa by 2015F. On this basis, we expect TiGenix to become profitable in 2012F. In the longerterm, TiGenix has a pipeline of products behind ChondroCelect, including amore patient- and surgeon-friendly ‘next generation’ product (ChondroCelect3D) that could take it into the more lucrative osteoarthritis market.Fundamentals aside, given that a number of the larger orthopaedic companieshave begun to invest in biological-based joint and cartilage repair R&D, webelieve that TiGenix could become the subject of M&A interest. The key risk is of non-approval of ChondroCelect by the European and/or US regulators.
Key newsflow
We expect a number of crucial value-creating events in 2008: firstly, TiGenixshould in 1H08 receive the long-term (three-year) outcomes data from TIGACT01 and we believe there is a strong likelihood this will demonstratesuperior outcomes versus microfracture; secondly, we expect the companyto file ChondroCelect with the FDA around mid-year; thirdly, we expect European approval of the product in 2H08 (the process is likely to take 13-17 months from the June 2007 filing); finally, TiGenix should begin clinicaltesting of its next-generation ChondroCelect 3D product.
Valuation
Our target price of €7/share is based on risk-adjusted NPV. This was recently (28 November 2007) revised down from €8/share to account for the weak US dollar as we believe around 80% of the market opportunity forChondroCelect resides in the (higher-priced) US market. _
Main shareholders (%) ING Belgium 16.5Auriga Venture 9.4Fagus (Fortis/EIF) 8.1Capricorn Venture 6.1
Share data No. of shares (m) 23.9Daily turnover (shares) 10,488Free float (%) 38.6Enterprise value (€m) 112.1Market cap (€m) 114.5
Newsflow
Date Description
21 Mar 2008 FY07 results 2Q08 3-year data on ChondoCelect Mid-08 FDA filing of ChondroCelect 2H08 EU approval of ChondroCelect
Company profile Overview TiGenix is a biomedical company that is developingbiological treatments for damaged joints. Its leadproduct, ChondroCelect, aims to repair damaged kneecartilage more durably than existing methods.
ChondroCelect and cartilage repair Over 2m patients pa are diagnosed with knee cartilagedamage, mostly sports related, and we believe thisrepresents a substantial (>€1bn) market opportunity.TiGenix aims to develop a series of biologicaltreatments for damaged joints, and its lead product, ChondroCelect, is the first ever to have successfullyundergone a pivotal phase III trial designed to meetFDA and EU regulatory standards. ChondroCelectcould be launched in Europe in 2008 and in the US in2009 and we estimate it has the potential to achieve sales of €85m pa by 2015. ChondroCelect's keycompetitor will be Genzyme's Carticel, which, althoughavailable in the US since 1995, is not supported bycontrolled clinical trial data. Based on our expectationsfor ChondroCelect, we expect TiGenix to becomeprofitable in 2012.
Pipeline opportunities TiGenix is developing a more convenient ‘next-generation’ ChondroCelect product (in which thecartilage-forming cells are embedded in a 3D matrixthat can be implanted via arthroscopy), which also hasthe potential to extend usage into the lucrativeosteoarthritis market. This is set to enter clinical studiesin 2008. Other research areas include meniscus andallogeneic (non-self) cartilage repair.
Valuation and risks TiGenix’s shares initially rose significantly after theMarch 2007 IPO (which took place at €5.0/share) buthave since suffered in the biotech sector sell-off that followed the US credit crunch. We continue to seesubstantial fundamental upside based on our risk-adjusted NPV and on the possibility of M&A interestfrom one of the larger orthopaedic players. Currenciesand sector trends aside, risks include clinical andregulatory disappointments, as with any other emergingbiotech company, and commercial issues (eg, whetherTiGenix obtains adequate reimbursement pricing forChondroCelect).
SWOT Strengths World scientific leader in cartilage and bone repair Strong management
Weaknesses No clinical proof of concept for ChondroCelect 3Dproduct Regulatory hurdles for one-step allogeneic ACI product very high
Opportunities First evidence-based cell therapy product for cartilagerepair Huge opportunity if platform can be extended toosteoarthritis
Threats Competitors ahead in Europe with 3D matrix-based products Genzyme has a long established presence in the US
TKH is a highly innovative niche player with attractive growthpotential and profitability levels. For 2008 we are positive asrecent innovations will bear fruit and TKH should benefit from acquisitions. We believe its potential growth and profitabilityare not fully reflected in the valuation and rate it as a BUY.
Investment thesis
TKH has successfully moved from being a product supplier to a solutionsprovider. Its innovative powers are growing (in 1H07, 23% of sales stemmedfrom recent innovations). We are positive on the stock as the outlook for allthree divisions is favourable.
(1) Within the Technical Trading group, TKH is investing strongly in themarket development of innovations, which should lead to acceleratedgrowth. Focus areas are communications, security, the healthcare sector,time-shifted IP-TV and home networking. The focus on innovations is payingoff with accelerating organic growth of close to 10% in 3Q07. In addition, the recent acquisition of CAE groupe offers scope for cross-selling and acceleration of organic growth in 2008.
(2) For the Cable group, optical fibre market conditions are becoming morefavourable. In addition, the focus on specialty cable is bearing fruit (the target is to increase share from 70% to 80-90% of sales).
(3) The Machinery group, we believe should be back on track in 2008 after adip in profitability (EBIT margin dropped from 10% to 4.6% in 1H07) and theEBIT margin should recover to around 10%. Trends for the Machinery groupare also positive, driven by market developments, outsourcing trends andthe high number of innovations. TKH has developed a new type of tyre-manufacturing machine (MTM, modular tyre manufacturing) with a selling price of c.€6m, compared with €2m for standard machines. TKH has alsodeveloped an OTR system (a machine that can produce off-the-road tyres for the mining industry). This is an attractive niche market with a high sellingprice of €8m.
Key newsflow
Besides the upcoming results, the focus will be on the successful integrationof the recent acquisition in France and market conditions in the optical fibremarket, hopefully with some large fibre-to-the-home projects in Europe.
Valuation
We believe the outlook for 2008 is strong with recent innovations expected topay off. In addition TKH will benefit from full-year consolidation of the CAE Groupe. Other positives are its limited exposure to the housing market andno exposure to the US. In terms of valuation the stock is trading at 2008FPER of 9.2X and offers an attractive dividend yield of 6% for 2008. Ourtarget price of €18.50 is based on a sum-of-the-parts valuation and implies a 2008F PER of 11.7X. _
Main shareholders (%) Delta Deelnemingen 10.3Fidelity 9.3Kempen Capital Management 7.4Aviva 6.4
Share data No. of shares (m) 34.6Daily turnover (shares) 21,031Free float (%) 54.0Enterprise value (€m) 615.4Market cap (€m) 502.0
Newsflow
Date Description
12/03/2008 FY07 figures
Share price performance
8
13
18
23
28
12/05 6/06 12/06 6/07 12/07PriceAEX All Share (rebased)
Company profile Overview TKH is a group of companies specialising in providingsolutions, creating and supplying innovative telecom,building and industrial solutions. With its 25 companiesworldwide, TKH is a global player. Growth isconcentrated in northwest Europe, eastern Europe andAsia. The company has three divisions: technicaltrading (35% of sales), cable (46% of sales) andmachinery (19% of sales).
Technical trading The technical trading business supplies a wide range ofcomponents and systems for cable and datacommunications, telecoms, ICT and electricalengineering applications as well as industrial automation.
Cable The cable division is striving for a position as a nicheplayer and is shifting its focus increasingly towardssolutions in the form of total systems, in co-operationwith the technical trading group.
Machinery The machinery division specialises in the developmentand assembly of tyre-manufacturing systems for carsand trucks and automated flexible product-handling systems. TKH’s objective is to increase EPS. This has to beachieved on the basis of turnover growth and bystriving for a strong position in the high-potential segments of (indoor) telecom solutions, buildingsolutions and industrial solutions. Communications,security, care and comfort are seen as key growthareas within these sectors. Growth will be realisedprimarily through a strong focus on technical tradingactivities (value-added reselling). TKH focuses onhealthy balance sheet ratios and a strong operationalcash flow. It targets a solvency ratio of at least 40%, areturn on sales of at least 8-9% and a return on capital employed of at least 18-20%.
SWOT Strengths Strong niche player with very well spread business mix. Healthy balance sheet and strong cash-flow-generativepower. Good acquisition track record.
Weaknesses Limited player in the highly competitive optical fibremarket in China.
Opportunities For the machinery group, outsourcing trends at the tyreproducers. Strong growth prospects for triple play. Introduction of new MTM machine at the machinerygroup. Well filled war chest (at least €150m) with which tomake acquisitions.
Threats Still some overcapacity on fibre-optical market. Rising raw material prices, especially copper.
TomTom continues to beat expectations, and the pendingacquisition of Tele Atlas would provide long-term sat nav market growth opportunities. While we await the outcome ofanti-trust proceedings, we rate TomTom a BUY with a TP of€70.
Investment thesis
Newsflow has been intense since TomTom launched its initial bid for mapdata provider Tele Atlas in July. After what initially looked to be becoming abidding war with US competitor Garmin, TomTom appears to be the likelyacquirer of Tele Atlas at a price of €30 per share. Apart from revenuesynergies, we believe Tele Atlas provides TomTom with long-term sat nav growth exposure. This could prove important if at some point in the futureGPS-enabled handsets make the PND format obsolete. As such, the dealcould reduce TomTom’s risk profile and extend the company’s life cyclethrough exposure to long-term sat nav market growth via a broad range ofplatforms such as wireless and the internet.
Meanwhile, TomTom continues to beat expectations. The 3Q07 results werebetter than expected with particularly strong margins. The gross marginjumped to 48.8% from 44.6% in 2Q07 due to continued cost savings,particularly on new devices. Despite ongoing ASP erosion, YoY growthremained strong in 3Q07 (sales up 21%, EBIT up 33%, net profit up 36%)and TomTom kept its opex and working capital under control. Following the release, we raised our 2007-09F EPS estimates by an average 13%,bringing our 2007-09F earnings CAGR to 31% on the back of a 26% salesCAGR.
Key newsflow
TomTom raised its FY07 guidance in October, and it now targets sales of€1.7-1.8bn (from €1.6-1.8bn) on PND volumes of 9-10m units (8-9m). Furthermore, it is guiding for an operating margin “well in excess of 20%”(from “at least 20%” previously), and we believe the new product rangesshould allow for a strong 4Q07.
Valuation
In our view, the long-term growth investment case remains compelling,unless anti-trust authorities refuse to allow TomTom to acquire Tele Atlas.We do not currently expect this to happen. On a standalone basis, webelieve TomTom is fairly valued at around €55 per share (a 2008F EV/EBITof 12x), but together with Tele Atlas, our pro forma combined DCF modelsuggests a value of c.€70; hence our TP and BUY rating. _
Main shareholders (%) H Goddijn 13.3C Vigreux-Goddijn 13.3P Geelen 13.3P Pauwels 13.3
Share data No. of shares (m) 121.6Daily turnover (shares) 845,035Free float (%) 43.0Enterprise value (€m) 5,513.8Market cap (€m) 6,288.4
TomTom is the clear European market leader in thepersonal navigation device (PND) market. Thecompany began focusing on personal satellitenavigation in 2001 and has grown strongly since then.
The majority of TomTom’s products are distributed toretailers through several large national and regionaldistribution companies, but the company also has directrelationships with larger European and US retail chains.
TomTom is building a global brand name, which shouldbecome the most widely recognised brand in personalnavigation. It is in the process of rapidly increasing itsnumber of outlets in the US, while penetration in Europeis already quite high.
TomTom’s strategy is to expand its product portfoliowith various personal navigation products and services.Adding new functions to current products and enteringnew segments of the navigation market should drivegrowth. The company is also in discussions withwireless operators and mobile phone manufacturers todistribute the TomTom Mobile navigation softwareproduct for smartphones.
TomTom focuses on hardware and software design andmarketing and has outsourced most other businessfunctions, such as production and distribution. Thecompany has a product design cycle of c.12 months.
Risk factors The main risks for TomTom include continued ASPdeclines and substitution risks from GPS adoption onhandsets, although the pending acquisition of Tele Atlaswould give TomTom exposure to this segment.Furthermore, competing offers for Tele Atlas or anti-trust issues cannot yet be ruled out, and sat nav marketgrowth could disappoint.
SWOT Strengths Leading quality product Market leader in Europe with a strong brand image
Weaknesses Relatively long product R&D cycle Lack of US patents
Opportunities US market penetration Service sales growth to increasing customer base
Threats Potential adoption of GPS functionality in handsets Continued pricing pressure due to PND commoditisation.
We are convinced of Transics’s genuine growth profile, whichtogether with a strong management team, a positive freecash flow profile and an undemanding valuation makes us BUYers of the stock.
Investment thesis
Founded in 1990, Transics is currently the No.2 in Europe in the fast-growing and highly under-penetrated (5% penetration) Fleet Management Solution(FMS) market, with a 7% market share. According to industry specialists, Transics market segment should grow 15% pa until 2012 to reach €660m. Transics is a high-growth company which should benefit from the followingdrivers (1) strong expected market growth; (2) market share gains thanks toa high-end focus and a talented management team; and (3) regulationswhich drives upgrade.
Offering exclusively high-end FMS to customers, Transics has a strong track record of growth and profitability, with organic revenue and EBITDA growthof 39% and 193%, respectively, over 2004-06. We believe it will continue tostrengthen its leading position in Europe thanks to its sound developmentstrategy: a high-end product portfolio offer, rapid expansion of its operationsinto Europe, where the market is still under-equipped, and a proactive acquisition approach. We expect Transics to be a key player in anyconsolidation of the fragmented FMS market. Several significant competitiveadvantages should bolster this strategy, in our view; an experiencedmanagement team, a lean and centralised organisation and a long-term customer-centric culture within a large installed base.
Thanks to a highly geared business model, we believe Transics shouldcontinue to deliver faster top-line growth and steadily improve its margin overthe next three years. For 2007F, we forecast a 65.3% rise in reportedrevenues to attain €41.8m, driven by highly profitable solution sales. Theoperating margin should reach 24.9%, up from 20.3% last year (mainly onthe back of the margin-accretive acquisition of DIS).
Key newsflow
The company listed on Euronext Brussels in June 2007. So far, newsflowhas been dominated by new customer win announcements and excellent1H07 results. In the future, we expect both, new customer winannouncements and excellent FY07 results which will be published on 29 February 2008.
Valuation
At the current share price, Transics trades at a 2007F EV/EBIT of 14.8x andEV/EBITDA of 11.9x and at a 2008F EV/EBIT of 11.0x and EV/EBITDA of8.9x. The average discount to peers is 49.4% and 49.2%, respectively. We believe a discount is not justified as the company has better momentum thanits competitors and sound fundamentals.
Main shareholders (%) Carlyle Group 42.2Walter Mastelinck 12.3Ludwig Lemenu 12.3
Share data No. of shares (m) 8.1Daily turnover (shares) 201.0Free float (%) 32.5Enterprise value (€m) 145.9Market cap (€m) 143.5
Company profile Founded in 1990, Transics is the No.2 in Europe in thefleet management solutions (FMS) market, with 7%market share. FMS is a complex information systemthat enables companies in the transport and logisticssector to manage all aspects relating to a fleet ofvehicles with real-time information in order to increaseefficiency, reduce costs and improve customerservices.
Organisation The company has a centralised organisation based inIeper (Belgium) with 120-strong staff at end 2006. Itsworkforce is split as followed: 25% in R&D, 33% incustomer care, 35% in sales and marketing and therest in administration. Transics offers the whole value chain in FMS solutions,from on-board computer device (bundling hardware andsoftware) to maintenance and services.
Product sales (79% of 2007F sales) Product sales consist of the On-Board Computer (OBC)hardware and related software. When installed in atruck, an OBC device enables the tracking of thevehicle and its goods, exchanging data with the client’sinformation systems (technical data of the vehicle,activity reporting, navigation, etc). The list price rangesfrom €2,000 to €2,500.
Recurring sales (17% of 2007F sales) Recurring sales encompass all recurring elementslinked to the OBC from maintenance to telecoms communication. This should continue to grow in thefuture faster than the installed base as the offering ofservices is enlarging.
Field services (5% of 2007F sales) Field services revenues derive from the billable hoursrelated to project implementation, training andconsulting.
Geographic breakdown of sales (2007F sales) Benelux: 60%; France: 20%; Rest of Europe: 20%
Risks Potential risks range from economic uncertainties,technology shifts and intensifying competition, tocompany-specific concerns like execution risks,acquisition-related risks, potential product delays andimplementation of an indirect distribution channel
SWOT Strengths Focus on profitable high-end FMS Growing part of recurring revenues
Weaknesses Investment in S&M necessary to penetrate new markets Small market share (7%)
Opportunities International expansion Highly under-penetrated market (6%)
Threats Hardware price erosion Potential competition from Telematics giants
The EU rejection of Cimzia in Crohn’s disease has led togreater appreciation of the regulatory and execution risksthat lie ahead for UCB. However, reassuring 2008 financial guidance, together with the shares falling below our targetprice, led us recently to upgrade from Sell to HOLD.
Investment thesis
UCB is a biopharmaceutical company that focuses on medicines forinflammation, neurology and oncology. The company’s key attraction forinvestors is its broad late-stage pipeline. By end-2007, UCB will have two drugs in the launch phase (Neupro and Xyzal) and four undergoingregistration in six indications (Cimzia in Crohn’s and rheumatoid arthritis;Neupro, restless legs syndrome; fesoterodine, overactive bladder; Vimpat,epilepsy and neuropathic pain). Despite these multiple new drugopportunities, we believe UCB faces a tough transition period in the coming years as the patents protecting half of its current business – including its two best-selling drugs, Keppra (for epilepsy) and Zyrtec (allergy) – expire by May 2010. Indeed, by 2012 we estimate UCB’s current portfolio of drugs will be generating revenues of €2.3bn (vs €3.3bn in 2007F), implying a profit ‘drag’of up to €800m pa. Given the massive scale of the transition in the business,we do not expect many observers to give full credit to the pipeline until therisks (regulatory, clinical and commercial) can be gauged more clearly.Furthermore, we see a significant risk that UCB could fail to meet its target of‘an intensive growth period from 2010 on’ if there is any slippage ordisappointment from pipeline drugs. The EU rejection of Cimzia for Crohn’s in November 2007 (following a similar decision by the FDA late in 2006) is aclear warning that a smooth transition may not be in prospect and this hasconcerned many investors, leading to the recent share price decline.
Key newsflow
The range of possible profit outcomes for UCB over the coming years is verywide given the conflicting factors highlighted above. The outlook should start tobecome clearer in late 2008 when we expect the company to receive severalimportant FDA decisions (Cimzia in RA, Vimpat in epilepsy and neuropathicpain, Neupro in restless legs syndrome), together with the results of a study onCimzia conducted in support of FDA approval in Crohn’s.
Valuation
Following the EU rejection, we removed EU Crohn’s sales of Cimzia and cut the odds of approval in RA in our NPV model from 80% to 60%, given thegreater uncertainty engendered by the EMEA rejection. Our NPV/share nowstands at €33/share. This forms the basis of our target price, backed up byPER comparisons with mid-cap pharmaceutical peers and by DCF. On 17 December 2007, we upgraded our rating from Sell to HOLD on valuation. Risks on both the upside and the downside are largely pipeline related. _
Main shareholders (%) Financiere de Tubize 36.2Capital Research/Intl. 10.0Tubize concert party 9.7Eupac 5.0
Share data No. of shares (m) 180.2Daily turnover (shares) 681,864Free float (%) 54.1Enterprise value (€m) 8,014.2Market cap (€m) 5,649.3
Newsflow
Date Description
Jan 2008 FDA filing of Cimzia in RA 29 Feb 2008 2007FY results 1Q08 Phase II data on CDP871 1Q08 Keppra XR filing in epilepsy
Company profile Background UCB is a Euronext Brussels-listed biopharmaceuticalcompany that is focused on medicines for inflammation,neurology and oncology. The company has undergonea major corporate reshaping in recent years, via thedivestment of its chemicals activities and theacquisitions of Celltech and Schwarz Pharma, with theaim of becoming ‘the next generation biopharma company’.
New drugs versus old UCB has a broad late-stage pipeline, with two drugs inthe launch phase (Neupro and Xyzal) and fourundergoing registration in six indications (Cimzia inCrohn’s and rheumatoid arthritis; Neupro, restless legssyndrome; fesoterodine, overactive bladder; Vimpat,epilepsy and neuropathic pain). However, it also faces atough transition as patents protecting half of itsbusiness will expire by May 2010. Given the scale ofthis transition, we do not expect many observers to give full credit to the pipeline until the risks are understoodmore clearly. Indeed, we see a significant risk that UCBwill fail to meet its target of ‘an intensive growth periodfrom 2010 on’ if there is any slippage or disappointmentfrom its late-stage products.
Valuation & risks Our target price of €33/share is based on a combinationof sum-of-the-parts (using NPV for pipelinecompounds), peer multiple comparisons and DCF.Potential downside to our valuation could result fromnew drug regulatory and commercial executionsetbacks. In particular, Cimzia - which is seen by manyobservers as UCB's highest potential compound - looks to be entering the competitive anti-TNF segment as a distinct latecomer with no obvious efficacy advantages.The main potential upside would come from positiveregulatory or clinical surprises.
SWOT Strengths Market-leading franchise in epilepsy Unusually extensive late-stage pipeline
Weaknesses Pending patent expiries on key products Modest primary care sales and marketing infrastructure
Opportunities Leveraging epilepsy franchise with new drugs Exploiting the anti-TNF market with Cimzia
Threats Execution risk in transitioning business R&D and regulatory setbacks
Umicore’s cyclical nature has been dwarfed by the zincsmelting spin-off. The stock is now more a structural growthstory through its exposure to auto catalysts and advanced materials. Balance sheet de-leveraging and speculativeappeal will be supportive themes into 2008. BUY.
Investment thesis
Umicore has pulled out of Nyrstar, the last remnant of its metals and miningpast. Its profile is now focused on global leadership positions in materialstechnology and high valued-added applications derived from special andprecious metals, providing the company with a more structural growth profile.
In auto catalysts, Umicore operates in an oligopolistic market with a strong position in Europe (No.1 in diesel engines) and in China (the fastest-growing car market). The auto catalyst market is expected to grow structurally, drivenby stricter pollution emission legislation and, hence, rising penetration(including heavy-duty diesels, a major market for catalysts). In AdvancedMaterials, Umicore commands global leadership in cobalt and germanium,used in growth applications that also have an ecological angle (rechargeablebatteries and satellite solar panels, respectively). Another jewel is Umicore’s precious metals recycling plant in Hoboken (Belgium). The plant is able torecycle electronic scrap and spent auto catalysts, another of the company’senvironmental exposure, to recover valuable precious and special metals.
The expected re-rating triggered by the Nyrstar disposal was overshadowedby market turmoil, indicating significant upside in valuation terms. Thevaluation discount highlights Umicore’s speculative appeal with its 100% freefloat and rising scarcity value via its exposure to the prized auto catalystmarket (Engelhard was taken out in 2006 by BASF at 10x EV/EBITDA,leaving Johnson Matthey (JM) and Umicore as sole sector plays).
Key newsflow
The market will be eyeing more news on recent announcements: (1) the status of the €400m share buyback programme (financed by the €700m netproceeds from the Nyrstar disposal), (2) on 5 February, an EGM will be heldto approve a 1.2m share cancellation and (3) a 5-for-1 stock split. Guidance is in a REBIT range of €355-365m (INGF €381m). The ongoing strength ofprecious metal prices could lead to earnings surprises in 2008.
Valuation
Umicore’s growth and return profile should improve radically post the Nyrstardisposal, with enhanced returns, lower earnings volatility and a more attractive overall profile. This should fuel a re-rating towards peer multiples, as Umicorestill trades at a 31% discount to JM (1821p, not rated). Our SOTP-derived TP is €211 (from €191), where it would trade at an 11% discount to JM. We valueCatalysts at 10.5x 09F EV/EBITDA (was 08F), Advanced Mats at 7.5x (was8.5x), Precious Metals Services at 6x (was 7x) and Zinc Specialities at 5x (was6x). We see strong support from Umicore’s speculative appeal. _
Main shareholders (%) Parfimmo 3.1Treasury shares 3.1Deutsche Bank 2.7UBS 1.7
Share data No. of shares (m) 25.0Daily turnover (shares) 136,969Free float (%) 97.5Enterprise value (€m) 3,922.0Market cap (€m) 4,218.0
Newsflow
Date Description
5 Feb 2008 EGM 14 Feb 2008 FY07 results Late April 2008 1Q08 trading update
Company profile History Umicore is a speciality chemicals group with a focusthat has shifted from metals & mining (through thedemerger of Cumerio and Nyrstar) towardsdownstream and application-oriented products(organically and through acquisitions, notably OMGroup in 2003). Umicore has transformed itself into a materialstechnology group focused on high-value-added applications derived from special and precious metals.The company operates in markets exposed to structuralgrowth drivers such as pollution control, electronicscrap recycling, rechargeable batteries and strong-growing electronic applications that require specialmetal compounds. Geographic split of sales (2006, includingdiscontinued zinc smelting): Europe 53%, Asia 28%,America 10% and Africa 9%.
Precious metals & catalysts (44% 2007F REBIT) Umicore is a leading world player in recycling complexmaterials containing precious metals. It ranks firstworldwide for catalytic converters for diesel engines.
Advanced materials (14%) This division produces high-purity metals, alloys,compounds and advanced materials for a wide range ofapplications. It is world leader in cobalt componentsand germanium-based products.
Precious metals services (37%) Umicore is the world’s leading recycler and refiner ofcomplex materials containing precious metals (notablysilver, platinum, palladium and rhodium). The facility atHoboken, Belgium, is the most advanced preciousmetals recycling and recovery operation in the world.
Zinc specialities (15%) Umicore is a leader in downstream zinc applications,which consists mainly of the transformation of zinc intobuilding products (rolled and pre-formed zinc productsfor roofing, rainwater systems decoration) and zincchemicals (zinc oxides used in tyres and zinc powdersused in protective coating and paints for marineapplications).
Risks Umicore is exposed to zinc and precious metal pricesas well as US dollar exchange rate fluctuations.
SWOT Strengths Management that has undertaken a radicaltransformation towards higher-growth/returns activities
Weaknesses Remains quite diversified with complex businessmodels. Even without zinc smelting, profitability remainshighly leveraged to precious and special metals
Opportunities Positioning in environmentally sustainable technologies,products and services. Tightening worldwide regulationrestricting automobile pollution emissions. Wide shareownership (close to a 100% free float), which couldmake Umicore a potential prey in the sector
Threats Adverse metal prices. Strengthening competition (withstronger financial means) in view of sector consolidation
Unit 4 Agresso (U4A) is showing impressive top-line growth (14% organic growth in 1H07). Through its improved focus(with the sale of I&S) and cross-selling opportunities from acquisitions, we expect both top-line and profitability growthto be strong in coming years. Valuation is attractive. BUY.
Investment thesis
We like U4A for its strong accelerating organic growth prospects, market-leading positions with cross-selling opportunities and potential for attractiveacquisitions.
U4A showed strong organic sales growth of 14% in 1H07, well above theindustry average (5-6%) and driven by: (1) strong positioning in the publicsector; (2) pent-up demand in more mature markets like the Netherlands and Norway; and (3) high client retention rates. U4A is experiencing highdemand for replacing old ERP systems purchased in the late 1990s.
U4A has market-leading positions in segments of the public sector in the UKand Nordic regions. Demand continues to be robust in the ERP mid-market as pre-Y2K implementations are being replaced or upgraded. We expectU4A to continue to post strong organic top-line growth of 7-9% in 2007-09F, driven by recurring maintenance sales growth of 8-10%, which should thus represent 40% of sales in 2008F versus only 33% in 2003.
After acquiring Spanish CCS (€34m revenues/14% on total) at end of FY06acquisitions are still high on U4A’s agenda and the company is activelysearching for attractive deals. Recently, it was quite close to a sizeableacquisition (€50-100m), however, the takeover process ceased due todifferences over the price. According to U4A, the pipeline for acquisitionsremains well filled. Looking at the balance sheet we think company hasenough room and we estimate it has a war chest of around €200m.
Key newsflow
Besides acquisitions, the focus will be on FY07 figures and guidance forEBITDA growth of at least 20%. We believe guidance is very cautious, as:(1) management wants some slack for potential integration costs relating tothe integration of CCS; and (2) it wants to beat guidance at year-end. We have EBITDA growth of 28% in our model.
Valuation
Given the good growth outlook, we expect a further re-rating of European ERP mid-market players of c.8% over the next 12 months. U4A currentlytrades at 13% discount on 2008F EV/EBITDA against an international peergroup of business software companies. In our view, U4A should be valued ata 6% discount against its peers, reflecting its strong positioning in the public sector and higher profitability growth. We reiterate our BUY rating and €21.5 target price, which reflects a 2008F EV/EBITDA of 9.0x. _
_
Main shareholders (%) Aviva 7.5WAM 6.8Navitas 6.1
Share data No. of shares (m) 26.5Daily turnover (shares) 26,313Free float (%) 80.0Enterprise value (€m) 449.6Market cap (€m) 510.5
Newsflow
Date Description
26 February 2008 2007 results 7 May 2008 AGM
Share price performance
1012141618202224
12/05 6/06 12/06 6/07 12/07PriceAEX All Share (rebased)
Company profile Unit 4 Agresso produces, sells, implements andsupports ERP software, which includes financial andadministrative packages and logistics software, as wellas software for information management and reports. Itoriginally focused on the Dutch wholesale anddistribution segment and the Dutch SME market, withthe Omnivers and Multivers products, and strengthenedits offering through the Agresso acquisition in 2000. The Agresso product has a strong installed base in theNordic region and in the UK in the public sector andwith professional services organisations. To furtherproliferate this product, Unit 4 Agresso has madesmaller acquisitions in Spain, France, the UK and the Netherlands. In the US, Sabre, the large infrastructureprovider to the travel industry, has agreed to market theAgresso product as a replacement for its own ERPproduct to its international client base of travelagencies.
SWOT Strengths Flexible Agresso product, which is well positioned in thegrowing public and professional services sectors inEurope. Strong installed base of the Agresso product inScandinavia and the UK.
Weaknesses Limited number of implementation partners. Limited position in some European countries.
Opportunities Potential of Agresso product in newer countries likeFrance, Spain, the Netherlands and the US (alsoSabre). Cross-selling opportunities with recent and potentialnew acquisitions.
Threats Increased mid-market focus of larger competitors SAP,Oracle and Microsoft. Opportunistic acquisition strategy.
We believe the recent 49% sell-off is overdone. Despite arecent softening of the Dutch staffing market we still feel thatFY07 guidance is safe on the low-end. Comps for NL will remain difficult until end-Q108, but a 80-90% chance of recession seems priced in and we see good rebound potential.
Investment thesis
Following the recent 49% sell-off vs 42% for the sector, USG People seems tooffer good rebound potential, hence we reiterate our BUY rating. We acknowledge that the sales guidance of c.10% growth for 2H07 is too optimistichaving seen the slowing of USG’s key markets, ie, NL, Belgium and France. Still,we remain confident that the FY07 EBITA margin guidance of c.7% is safe, but on the low-end side (INGF: 6.8%) due to (1) strong pricing in NL, and (2) lessone-off costs in 2H than seen in 1H07.
Key points: (1) Despite a slowing of growth in its main markets, we underline thatUSG still enjoys a favourable mix, ie, high exposure to late-cyclical SME segment (c.40% of sales) and specialist staffing (also c.40%) and no downsiderisk to ther US. (2) Compensation for slowing top-line growth is found in strong pricing. The pricing cycle has only just turned in USG’s favour in NL since 4Q06 and in previous cycles lasted three-four years. (3) Non-Benelux operations (1/3 of sales) are a swing factor for earnings growth. We estimate the proportion of EBITA from non-Benelux to rise from 11% in 2006 to 20% in 2009F.
Our 7.6% EBITA margin forecast for FY09F is still well below previous peakmargin of c.8% and thus seems rather cautious in our mid-cycle dip scenario due to (1) further gross margin recovery in the Netherlands and (2) focus ongrowth in specialist staffing.
From a timing perspective we stress that the main catalyst, ie, the Dutchstaffing market will remain tough until late in Q1 due to difficult comps.However looking at valuation and the recent share price performance of thesector since the recent peak (-42%) we believe the market has priced in a80-90% chance of a global recession. Also fears that the Dutch market mightshow negative revenue growth in FY08F seems too negative as we believethe recent softening seems exaggerated by (1) the government segment not hiring, which might come to live in 1Q08, and (2) a soft financial sectorrelated to the merger between ABN and Fortis ,which might return in 2H08F.
Our recession scenario assumes: FY07 is the cycle-peak, a 9% sales loss and trough EBITA margin of 4.5%. Applying an 8.5x PER multiple (15%discount to the sector) generates a trough fair value of €11.9, ie, 37% downside.
Valuation
After the recent sell-off the stock trades significant below historical lows at7.0x 2008F PER and 4.6x 2008F EV/EBITDA. USG remains by far the cheapest stock in the staffing sector trading at a c.20% discount to the sectoron 2008F EV/EBITDA. TP is based on a 6.5x 2008F EV/EBITDA targetmultiple, ie, a 15% discount to the sector.
Main shareholders (%) Mr A Mulder 17.5
Share data No. of shares (m) 63.7Daily turnover (shares) 603,778Free float (%) 82.5Enterprise value (€m) 1,493.8Market cap (€m) 1,196.9
Company profile History In 1997, Unique International was formed as the resultof a merger between Goudsmit and UniqueInternational. In 2002, USG acquired Start and in 2005USG merged with Solvus and became the No.5 playerin Europe and generates c.40% in specialist staffing.Management target for EBITA is around 7% for 2007.Founder and chairman of the supervisory board, MrAlex Mulder, owns c.17.5%.
Geographical breakdown USG is active in 13 countries including the Netherlands(45%), Belgium (21%), France (14%), Spain/Portugal(11%), Germany (3%), Italy (4%), Switzerland, Austriaand Poland (together 3%). USG holds a strong marketposition in the Benelux with a No.2 position in both theNetherlands and Belgium with market shares of 17%and 18%, respectively. In France, USG ranks No.7 witha 2% market share.
Segmental breakdown USG generates c.60% of sales in general staffing, 30%in specialist staffing, 8% in professional, 2% in special services and c.40% in white collar staffing. USG is astrong player in the SME segment in the Netherlands.USG generates c.40% of Dutch sales and c.20% ofgroup sales from the SME segment. Withinspecialist/professional staffing, USG is mainly active in admin/finance & accounting, engineering, legal andICT. Main brands are Start People, Content, Unique,and USG Innotiv.
Risks Economic slowdown of the Eurozone and, in particular,the Netherlands. Scarcity of labour in the Netherlandshampering growth. Acquisitions risk in combination withleveraged balance sheet.
SWOT Strengths Strong Benelux franchise with No.2 position Highest specialisation rate of large staffing firms Strongest cash flow generation in the sector Experienced management and experienced in cashflow management
Weaknesses Dependence on the Netherlands (45% of sales) Relative highest leveraged balance sheet in the sectorreducing options for growth Too little exposure to Germany
Opportunities Expansion in Germany and Italy Rollout of specialty labels outside Benelux to increasemargin and growth profile Reduce debt position rapidly due to earnings growthand DSO reduction Gross margin improvement due to strong pricingrecovery in NL
Threats Slowdown of the Dutch economy Scarcity in the Dutch labour market hampering growth
We view Van de Velde (VdV) as an excellent long-term outperforming investment, which offers single-digit earnings growth, an attractive dividend yield on top of solidfundamentals, an outstanding record and an extra long-term growth driver in the alliance with Intimacy. BUY.
Investment thesis
VdV’s 1H07 results confirmed once again the company’s excellent trackrecord, with sales up 5.5% YoY, EBITDA rising 7.2% YoY and recurrent earnings up YoY. As such, VdV has pursued its uninterrupted series ofannual growth of sales, EBITDA and adj. EPS since at least 1993. Theincreasingly difficult comparison basis calls for slower earnings growth in2007F, mainly also as VdV’s business development is mainly organicallyinspired. However, we consider the 49.9% stake in US-based Intimacy (INT) as a main driver for long-term growth, through VdV’s product sales to theINT stores alongside the net contribution stemming from this stake.
Key newsflow
In March, VdV acquired a 49.9% stake in Intimacy (INT) for US$14.97m. INT isexpected to realise a US$18m turnover in the three stores it operates in the US(Atlanta, NYC and Chicago). INT looks a perfect match in terms of marketing andsales concept, as it adds a major growth driver by adding a sizeablegeographical area for VdV to expand in (the US). In the short run, the impact onfinancials should be limited: INT will be accounted for via the equity method. ItsEBIT margins attain c.10%. INT intends to expand the apparently successfulmulti-brand store concept in the US by adding c.3-4 stores pa, which INT should be able to finance out of its free cash flow. In November a new store was openedin Boston; in 2008F, we expect additional openings in Miami and Dallas.
At 1H07 results announcement, VdV issued its FY07F guidance as follows:c.5% YoY sales and EBITDA growth, which is close to ING (+5.4% YoY insales and of 6% YoY in EBITDA) and consensus estimates.
In November, VdV Holding sold a 3.69% stake to institutional investors,following the full sale of Karel Van de Velde’s stake (7.4%) as he is no longeractive in the company (he withdrew from the board in January 2006). WithinVdV Holding, Karel VdV’s remaining 3.7% stake was acquired by other shareholders.
Valuation
VdV’s shares trade at a c.4% discount to sector peers and in line with themedian for Belgian small & mid caps when considering PER and adj.EV/EBIT for 2007-09F. Considering its outstanding record, VdV’s high netmargins and management’s traditional cautious guidance, we believe that apremium is warranted for VdV’s shares compared with both of the above-mentioned peer groups. Hence, we maintain our BUY recommendation and our DCF-based TP of €41.50. _
Main shareholders (%) Van de Velde Holding NV 55.3
Share data No. of shares (m) 13.6Daily turnover (shares) 333.0Free float (%) 41.0Enterprise value (€m) 443.3Market cap (€m) 508.4
Newsflow
Date Description
9 Jan 2008 2H07 sales 15 Feb 2008 2H07 results 30 April 2008 AGM 9 July 2008 1H08 results
Company profile VdV is one of Europe's leading luxury lingerieproducers, designing, producing and marketing luxurylingerie under its own brand names. It was establishedin 1919, and the founding family still owns 55%. Itsmain markets are Benelux, Germany and France. Despite the sizeable dividend payment in 2005 and2006, VdV’s cash pile should still reach €59m by end-2007F (equivalent to €4.37/sh).
Brands The proprietary brands are Marie Jo, Marie JoL'Exclusive (launched in 2001), Marie Jo l'Aventure(Marie Jo brands account for 56% of sales) and PrimaDonna (44% of sales). VdV's products are positioned inthe upper-middle and top segment of the market anddistributed to independent lingerie shops anddepartment stores. Benelux, Germany and Franceaccounted for c.70% of group sales. VdV is notexposed to international travel and tourism, factors thatare important for traditional luxury products. The company had limited exposure to the US (c.3% ofsales) and Asia until 2006, but in view of the 49.9%stake in US based Intimacy, acquired in March 2007,we believe VdV made a major strategic move toexpand its sales in the US by adding this independenthigh profile, multi-brand lingerie retailer, which is eagerto increase its currently limited (but profitable) storebasis in the US. VdV’s integration downstream started in 2002, byopening mono-brand stores in Germany and France tooptimise its distribution in certain areas. This projectwas not particularly successful and will be scaled downto 7 stores. Manufacturing was outsourced to low-wage countriesas early as 1995. Currently, 95% of manufacturingoccurs abroad (Tunisia, Hungary and China).
Top Form In 2001, VdV acquired a stake in Top Form, a leadingsupplier in the bra trade with manufacturing facilities in China, the Philippines and Thailand. Top Form's sharein VdV's production was c.50% in 2004.
Risks VdV’s main potential risk lies in an unenthusiasticresponse to new collections or weak consumerspending.
SWOT Strengths Market leader in the Benelux, third-largest luxurylingerie group in Europe. Solid cash position enablesmanagement to look for external growth
Weaknesses Low market share and brand awareness in France.Own store concept is being reassessed to fine-tune the look/format/location of new stores. VdV’s core marketsare maturing
Opportunities Increase market penetration in the US via Intimacy.External growth in Southern Europe is being considered Building up larger sales offices in growing markets suchas Spain, Italy, the UK, Scandinavia and EasternEurope. Better coaching and training of clients
Threats Multi-brand lingerie stores tend to lose market share tointernet shops or catalogue sales. New licensed brands(eg, Calvin Klein and Tommy Hilfiger) enter the market
Results continue to disappoint, but halting the specialistbusiness in the US should end the current loss-making period. Our rate the stock a HOLD with a TP of €3.00, a 6% discount to its adjusted €3.20 DCF, as it is not yet clear how long VDMwill remain in the current transition phase.
Investment thesis
With the announcement that it is to sell its US specialist activities to LehmanBrothers, Van Der Moolen (VDM) becomes a pure brokerage and tradingfirm with the majority of its activities in Europe. This step confirms 2007 as atransition period and that 2008-09 should show prove better. The use of thehybrid trading model on NYSE has meant that the US specialist operations have been unable to make a sustainable profit. VDM maintains a brokeragetrading activity on the Chicago Board of Trade, representing no more than acouple of percentage points of total revenues.
Following the sale of its US specialist book for nil, VDM’s 4Q07 net result will include charges for derecognition of certain intangible assets amounting to€40m (net of taxes). This excludes any charges for severance and otherone-off restructuring costs. Excluding this charge, we estimate that 2007 willend with a loss per share of €0.50. For 2008, we are more optimistic thanksto the closure of the US specialist activities. However, one must bear in mindthat VDM’s margins were considerably better on its specialist activities in theUS than its European trading activities, at 35%-plus and not more than 10%, respectively.
Normalised earnings could come out at €10-11m, or around €0.25 per share. For 2008, the dismantling of the US and maybe some settlement of oldissues make us cautious with regard to VDM reaching normalised earnings.We expect net profit of €5m, or €0.11 per share. 2009 should be VDM’syear, with operations probably leading to net profit of almost €10m.
Key newsflow
VDM will report its 2007 figures on 15 March 2008. As well as reporting a loss in 2007, the company may give guidance as to its future strategicdirection. We would not rule out VDM indicating an intention to take furthersteps into the retail segments.
Valuation
In 2008F PER terms, VDM’s share price is valued at 28x and its DCF comes out at €3.20, which is 7% above the current share price. Looking atnormalised earnings based on certain assumptions, we estimate that thevaluation is at a normalised PER of around 12x. This no longer seemsexpensive. However, given the many uncertainties in the outlook of acompany building up a longstanding business (with it unclear how long thistransition will last), we believe a 6% discount to DCF is warranted, leading toa TP of €3. HOLD. _
Main shareholders (%) RDD Foundation 6.1Fortis Utrecht 5.7
Share data No. of shares (m) 47.0Daily turnover (shares) 267,755Free float (%) 93.7Enterprise value (€m) 108.4Market cap (€m) 141.5
Newsflow
Date Description
15 March 2008 FY07 results 26 April 2008 AGM 16 May 2008 1Q08 results 16 August 2008 2Q08 results
Share price performance
23456789
10
12/05 6/06 12/06 6/07 12/07PriceAEX All Share (rebased)
Company profile History Van der Moolen (VDM) is an international securitiesfirm, active as one of the largest specialist firms on theNYSE and a trader on the leading equity and bondexchanges of the US and Europe, trading in the openoutcry and electronic markets. In 2006, the companyreported revenues of €149m and a net loss of €84m.
US – VDM Specialist (60% of 2006 revenues, divested in 2007) VDM is the fifth-largest NYSE specialist in US dollarvolumes with a market share of 11.7% and with 321common stock assignments with a share of 15%.Specialist activities are responsible for more than 80%of revenues and as much as 95-100% of EBITA. Withits specialist book, 27% of revenues are pharma/healthcare related, followed byconsumer/retail/entertainment at 24%. 25% of its USbusiness is in the hands of former owners of specialistfirms in the US.
Europe VDM is a leading equity trader on the Dutch and FrenchEuronext markets as well as on the German, Swiss,Italian and UK exchanges. The unit accounts for about19% of group revenues and 5% of EBITA. On 2January 2006, Curvalue was added to the group.Curvalue, a liquidity provider and online trader, made2005 revenues of €37m and pre-tax profit of €3.4m. The acquisition price is based on an earn-out based on2005/06 figures.
Risks Upside risks could include high volatility in the marketand lot of trading activities, while downside risks wouldbe the opposite with a sharp decline of trading.
SWOT Strengths Cash flow generation Not many competitors in many parts of its business
Weaknesses Financial situation, risk difficult to estimate Growth outlook modest
Opportunities Curvalue acquisition proves successful with synergyeffects in both costs and top-line sales growth Turnaround at VDM due to Curvalue’s management Picking up hybrid model better than competition
Threats New trading model in US Electronic systems and program trading in US No further function for specialists Narrower operating margins
Vopak benefits from early capacity expansion in a marketwith shortages supported by good GDP growth. The outlookfor double-digit earnings growth remains clear. However, Vopak’s valuation reflects all the positive news at 7.9x 2008FEV/EBITDA. HOLD, with a target price of €43.
Investment thesis
The shortage of oil storage capacity remains, explained by buoyant demandand limited capacity expansion in most parts of the world. Demand is fuelled by growing structural imbalances on a worldwide scale between supply anddemand for crude and oil products as dedicated regional oil productiondeclines and refineries’ product slate does not fit local consumption. Thedemand for storage also increases, owing to new products such as bio fuels.
For chemicals in Europe, economic conditions are supported by GDPgrowth. This leads to higher utilisation rates and throughputs. Besides theirwillingness to pay higher prices, clients in structural need of capacity areasking for contracts of longer duration, a favourable development for storagefirms’ capacity planning. We are also seeing new fuel specifications with ahigh chemical content (ethanol) bringing some spin-off effects to demand for chemicals storage.
Vopak, the world’s leading independent storage firm, benefits from thesefavourable trends, especially as it spotted opportunities in the market at anearly stage and acted accordingly by increasing capacity. In Asia, Vopak isincreasing capacity between 2006 and 2008 by more than 1m m³.Worldwide, after announcing a 0.8m m³ expansion in 2006, another 1.7m m³will be added in 2007-09. After 2008, demand for storage and Vopak’sleading position (also in SHEQ) should act as catalysts for further growth investments in capacity and, consequently, earnings.
Key newsflow
Management’s willingness to resolve certain files led to a transaction at year-end for the Tallinn Paktank Terminal with an additional attractive opportunityfor co-operation within Estonia. Also, the most recent decision on GATE, theLNG terminal, and taking 25% in Eemshaven support growth. We believethat before FY07 reporting in March, the company will come up with othertransactions/expansions that are supportive of earnings growth.
Valuation
Vopak is doing well, at a 2008F EV/EBITDA of 7.9x, 10-15% higher than the Benelux small and mid-cap average, as investors have anticipated goodnews. We think there is room for Vopak’s 2008F EV/EBITDA to reach a 20%premium to Benelux small and mid-caps, or 9.0x, due to: (1) Vopak’s goodoutlook, with sustainable double-digit earnings growth; (2) an excellent Asianposition despite limitations in the US; and (3) management consistency inexecuting its ambitious strategy without jeopardising the firm. A 2008FEV/EBITDA of 9.0x leads to a target price of €43, implying a potential returnof 16%.
Main ord. shareholders (%) HAL Investments 47.7ING 7.7
Share data No. of shares (m) 61.1Daily turnover (shares) 94,724Free float (%) 47.0Enterprise value (€m) 2,996.9Market cap (€m) 2,321.7
News flow
Date Description
7 March 2008 FY07 results 22 April 2008 1Q08 trading update 24 April 2008 AGM 28 August 2008 1H08 results
Share price performance
20
25
30
35
40
45
50
12/05 6/06 12/06 6/07 12/07PriceAEX All Share (rebased)
Company profile Vopak is the leading international provider ofindependent tank storage and related logistics services.It was formed through the 2002 spin-off of the logistics arm of the former Vopak, which also included chemicals distribution (Univar). Vopak operateslogistics services in chemicals and oil with aninternational network of 75 terminals and total capacityof 21.4m m³. Adding 1.7m m³ should bring 2008capacity to 23m m³.
Chemicals EMEA (38% of 2006 revs, 25% of EBIT) Strong position with 4.2m m³ across Europe led byAntwerp and Rotterdam. Different chemicals but alsogas storage.
Oil EMEA (21%, 26%) This is Vopak’s backbone with 9.3m m³ storage or 46%of the total. Operations in Europe dominate (Rotterdamhub), but there are growing interests in the Middle Eastand Africa. It is the market leader in this region.
Asia (16%, 31%) Mix of oils and chemicals storage with 17 terminalstotalling 3.7m m³. Led by the Singapore hub with totalcapacity near 2m m³, but it also has important terminalsin China (Caojing, a fully-integrated chemical park).Vopak is the leading firm in this growth region.
North America (16%, 10%) 80% chemicals, 20% oil storage with nine terminals,seven of which are in the US. Combining Mitsui's ITC terminal of 1.3m m³ (2006-07 estimate) in Houston willbring total US operations to 3.7m m³.
Latin America (8%, 8%) Mainly chemicals storage and a little bit of oil. 13terminals with strong positions in Brazil and Mexico, butalso in countries such as Ecuador, Chile and Peru. Risks Downside risks include a slow decline in oil prices andlower throughput due to an economic downturn. Upsiderisks include high volatility in oil and chemicals priceswith unabated further growth in demand for storage.
SWOT Strengths No.1 independent storage firm in the world Quality player, high on customers’ agenda High cash flow of more than €200m Good dynamic management with experience in thisbusiness
Weaknesses Operating in saturated markets Oil prices volatile, chemicals cyclical Expansion is expensive: €50m or 1/6 of EBITDA for 1%capacity growth
Opportunities Growing imbalances of oil and oil products that need tobe shipped and stored Increasing trade flows of certain chemicals Developments of more specifications for fuels includingimportant environmentally friendly additives Outsourcing of oil companies’ assets
Threats Competitive threat from local players Slowly declining oil prices with futures at even lowerprices (backwardation) Unfavourable government decisions
Trading at 7.6x 2008F PER the valuation appears depressed.Improved visibility on EU GDP growth and conditions inseveral of Europe’s key housing markets is vital to trigger a fundamental re-rating. To date these conditions have notbeen met, which restrains us from upgrading Wavin. HOLD.
Investment thesis
Our neutral stance on Wavin is based on several positive and negativecounterbalancing factors. On the bright side we see three attractive growthdrivers: (1) Ongoing strong replacement demand (plastic pipe systemsreplacing all other kinds of materials), which we expect will support top-line growth over a long period of time; (2) Wavin’s above average exposure to fast-growing regions in Eastern and Central Europe (>18% of total sales); (3)We also like Wavin’s geographical diversification, which smoothes earningscyclicality. On the negative side are: (1) Unpredictability of end-market demand (the business model’s low visibility is caused by the two-day order book) despite Wavin’s large and established market positions in Europe; (2)Uncertainty with regard to European residential markets (related to the creditmarket crisis); (3) Wavin faces a very tough comparison base in the first six months of 2008 (last year mild weather conditions added c.200bps to salesgrowth). We expect Wavin to report sales growth of 2% in 2008F and anEBITDA margin of 12.7% (compared with 13% in 2007F). Our €1.20 EPS 2008F forecast stands around 2% above consensus. The performance ofWavin’s Eastern EU, UK/Ireland and North West EU division is something tomonitor closely next year as these units have potentially the largest impacton EPS sensitivity analysis.
Key newsflow
Despite Wavin’s relative large debt position (2.7x net debt/EBITDA 2007F),we expect it to continue its bolt-on acquisition strategy, which we regard tobe a positive signal as Wavin has been the main consolidator in theEuropean plastic pipe systems market. Its share price performance has been highly sensitive to earnings releases from the European Building materialsector and its closest competitors in particular.
Valuation
At 7.6x 2008F PER and 5.8x EV/EBITDA, valuation levels look depressed.However, given a lack of historical trading data and a heterogeneous peergroup, potential trough multiples are hard to derive. The key question is, willEuropean construction sentiment improve next year? Currently, the poorsentiment weighing on EU building material equities is a direct result of the unstable economic outlook. Hence we refrain from upgrading Wavin, despitewhat appears to be depressed valuation levels. As long as visibility on EUGDP growth and conditions in several large EU housing markets remainsunclear, we expect the share price to remain very volatile. End-market stability is vital if we are to return to a more fundamental valuation analysis.HOLD maintained, but DCF-based TP lowered from €10.8 to €9.50.
Main shareholders (%) Julius Baer 5.8Lloyds TSB Bank 5.0Alpinvest 5.0Fortis 5.0
Share data No. of shares (m) 77.7Daily turnover (shares) 232,466Free float (%) 93.4Enterprise value (€m) 1,213.0Market cap (€m) 703.5
Company profile History Wavin is Europe’s leading supplier of plastic pipesystems and solutions. Last year, the companyreported revenues of €1.5bn and net profit of €73m.Wavin provides integrated above- and below-ground solutions for water supply, sewerage, drainage,infiltration, surface heating and cooling, soil and waste,and last-mile telecommunications mainly to customersin the European construction and utility markets. In addition to top-quality products, Wavin offerscustomers end-to-end solutions, which includeconsultation and design services, product support, aswell as implementation and after-sales service. Wavinis headquartered in Zwolle (the Netherlands) and isactive in 27 European countries, with c.40manufacturing sites. Following the acquisition of UK-based Hepworth Building Products in April 2005, thecompany employs approximately 6,700 people. The Wavin Group is actively expanding its presenceacross Europe by selective acquisitions, the opening ofnew plants and depots and the extension of its salesnetwork. In 2007 the company acquired O’Brian inIreland and a Norwegian player active in last miletelecom solutions named Polyfemos. Most recently,Wavin signed an agreement to acquire Pilsa Plastic aTurkish manufacturer of plastic pipe systems. Wavinoffers solutions to two strategic market segments.
Building & Installation Wavin is a full range supplier of all above ground plasticpipe systems in and around the building. Wavin offersproducts and solutions for tap water, surface heatingand cooling, soil and waste, electricity and rainwaterapplications.
Civils & Infrastructure (60% of sales) Wavin is an expert supplier of below-ground pipesystems for civil and infrastructure projects. Within thissegment Wavin offers systems for sewer, drainage,drinking water and telecom applications. Productsinclude manholes and inspection chambers, infiltrationunits and gullies.
Risk factors Despite Wavin’s geographical diversification marketconditions in its UK/Ireland and CEE divisions have amaterial impact on our EPS estimates as theyrepresent c.34% and 19%, respectively, of groupEBITDA. High volatility in raw material prices cannegatively impact gross margin as Wavin is asignificant buyer of plastic reins. The company carries arelative large amount of debt on the balance sheet.
SWOT Strengths Market leader in Europe (economies of scale) Successful bolt-on acquisition strategy
Weaknesses Substantial net debt position Predictability of the business model
Opportunities Continue to be the active consolidator in Europe Superior product features of plastic pipe systems
Threats Large B2B distributors in consolidation mode as well Credit crisis freezing construction spending in Europe
Strong 9M07 earnings ahead of our optimistic expectations support confident company guidance for FY07. Medium-term prospects look even better thanks to the investment pipeline, boosted further by announced acquisitions, which willgenerate additional rents and support NAV growth.
Investment thesis
9M07 results ahead of expectations: Net current 9M07 results came in18.7% higher at €19.4m excl. IAS39 adjustments on the back of strong revenues (+26.9% at €28.0m), helped by strong occupancy (up at 98.4%)and operating expenses in line at €3.1m (+11.1%). EBIT was an excellent€24.9m (+29.2%). Net interest expenses excl. IAS39 adjustments were a bitdisappointing, but net current results were still above expectations at €19.4m or €2.26 per share (+10.1%, €2.20 expected). Net reported results (up81.9% at €43.3m) include IAS39 gains and portfolio results. NAVPS before(final) profit appropriation (ie, excl. interim dividend of €1.29 already paid) was €34.92 (+16.8% YoY) based on an appraised portfolio yield at 7.4%.
Company net current EPS guidance is sustained at €3.03 (+10.2%). Following recent acquisitions, we have raised our EPS from €2.92 to €2.95.
WDP has announced two new acquisitions in top Dutch and Belgian logisticslocations) for a total consideration at completion of €24m to be (re)developed and completed by end-2008. The impact on earnings is immaterial in 2007,slightly negative in 2008 and positive thereafter (full impact on rents from 2009). These acquisitions are in addition to a large project in Sint Niklaas(€55m, expected to generate rents from end 2009) and several projects inRomania. We have adjusted our 2007-09 net current EPS estimates at€2.95, €3.09 and €3.94 (vs €2.92, €3.12 and €4.00) as the initial impact fromhigher financial expenses is gradually compensated for by new rents from2009-10. The portfolio value should exceed €800m in 2009 from the current€600m.
Recent operations are not mere acquisitions of existing sites, but more‘upstream’ redevelopments of land or obsolete assets generating higheryields on investments typically at 8% or more. The margin betweeninvestments and the eventual market value of the completed assets is keptwithin the company. Even when assuming a flat underlying investmentmarket and the high payout of REIT-like structures, we expect WDP NAVPSto show a 2006-2012 CAGR in excess of 6%.
Key newsflow
Beyond an active, nearly recurrent, acquisition flow, the main question mark is Romania. A swift letting of the first two speculative projects there wouldlikely give a boost to the share, given the huge potential of the land acquired.
Valuation
We retain our DCF-based €62 TP as higher medium-term earnings are offset by slightly lower 2007-09 estimates and the interim dividend payment.
Main shareholders (%) Jos de Pauw family 30.5
Share data No. of shares (m) 8.6Daily turnover (shares) 6,652.0Free float (%) 72.4Enterprise value (€m) 784.9Market cap (€m) 387.5
Company profile Listed in June 1999, WDP is a limited partnership byshares; ie, shareholders are silent partners. Thestatutory manager is De Pauw, owned by theeponymous family. WDP manages several companiesspecialising in semi-industrial property (development,design & construction, long-term lease). WDP’s know-how results in an interesting land bank,strong relations with end-users and high-quality buildings. Most Belgian sites are in the sought-after Brussels-Antwerp-Ghent triangle. WDP has sizeableassets abroad, including the Mlada Boleslav site in theCzech Republic and a logistics site in France leasedlong-term to EDF. As of end 2006, the share of foreignassets was 20%. Investors may dislike foreign ventures(diluted focus, fiscal uncertainties), but WDP minimisesfiscal losses (highly leveraged local structures, localSIIC structure in France) and risks (rents in euros,mostly pre-let). Logistics expertise also looks more‘exportable’ than office property (internationalcustomers, strictly rational location and quality criteria). The portfolio value at end 2006 was €430m (fair value, up 25% YoY). There were no major acquisitions in2003-04 as a more progressive approach was adoptedfocused on redeveloping existing projects and smallacquisitions. Occupancy fell sharply in 2004 to 90.2% following bankruptcy of the Hazeldonck tenant (theNetherlands). The site was relet for 10 years in 2006.Alongside completion of projects already in the pipeline,2005 saw acquisitions in Belgium and abroad(additional land in Mlada Boleslav) and several disposals (Italy). 2005 was busy in terms of new leases;WDP restored occupancy to 95%, increasing to 96.6%in 2006. 2006 saw new investments in Belgium &France. An ambitious strategic plan outlines expansionaimed at taking the portfolio size to €700m by 2009. This plan is now virtually completed with the Univegacquisition and the announced expansion in Romania.
Risks Market risk: WDP invests solely in logistics property andwarehouses, mainly in Belgium and Northern France. Itis therefore exposed to possible shifts of favouredlogistics locations to other areas such as CentralEurope. However, WDP already invests in the CzechRepublic and has just announced a new investment inRomania. Interest rate risk: WDP finances most of its debt atfloating rates. However, most of its debt is hedged. Business risk: WDP depends on the financial health ofits tenants (mainly private entities). Risk is reduced bydiversification and the high quality of assets (easierreletting).
SWOT Strengths Strong and experienced management Business model combining high profitability and low risk
Weaknesses Average financial disclosure.
Opportunities Strong development pipeline Good prospects for logistics property in Belgium andsurrounding areas Development potential of sites acquired in Romania.
Threats Higher interest rates but risk mitigated by an activehedging policy Highly cyclical tenants’ base but this is mitigated by thediversification of the portfolio and its high quality.
Results for 9M07 that were fully in line and a slightlyimproving earnings guidance confirm the slow but steadyimprovement in offices. Our TP (€68) is computed as aweighted average of our DCF valuation (75%) and the worst-case scenario NAV (25%) leaving substantial potential upside.
Investment thesis
9M results were in line across the board, with net current results at €15.8m (+3.4%) or €2.96 per share (same shares outstanding, our est. at €3.00). Rents were up 3.2% at €17.6m on a gradual but continuous improvement inoccupancy. Spot occupancy as of end September was 86.3%, vs 86.0% asof end June and 84.0% a year before. The vacancy rate only concerns theoffices portfolio. Reported figures were down 5.8% at €19.0m; no unrealised gains were booked in 3Q07 vs €2.5m in 3Q06. Net current EPS companyguidance for 2007 was up at €3.90 (previously close to 2006 levels, ie,€3.83). Our full-year estimate stands at €4.10.
There is no news on the tax litigation faced since last June (appeal pending).The company faces an administrative procedure with claims of up to €50.9m, fully covered by the Dutch parent company. A penal procedure was alsostarted in 2006 with the risk of the Belle-Île shopping centre (37% of portfolio)being confiscated; this confiscation is not guaranteed by the parent company.
Earnings estimates fine-tuned: On top of higher corporate overheads, wehave included the new lease of 5,000m² in Vilvoorde from December 2007 and the new vacancies in De Veldekens (Berchem) from January 2007(2,000m²) and January 2008 (1,800m²). These additions have a negativeeffect in 2007F (€0.04) but a positive effect from 2008F. Our new 2007-09F net current EPS estimates stand at €4.10, €4.22 and €4.49.
Key newsflow
The important planned extensions at the Nivelels and Tournai shoppingcentres remain overshadowed by the lingering tax litigation. Barring anegotiated out-of-court settlement, no swift outcome can be expected.
Valuation
Share overpenalised: NAVPS as of end-June was €66.13. Deducting the Belle-Île value (€24.5 per share), NAVPS was €41.67. In other words, theshare trades roughly between its NAV and the worst-case scenario, which is therefore attributed a 50% probability. The visibility of this legal case is closeto nil. Still, we believe a 50% probability is exaggerated because, while itcannot be ruled out, confiscation of Belle-Île is highly unlikely, at least notwithout compensation from the parent company, as it penalises minority shareholders of the Belgian company for facts preceding its IPO. Note thatNAV is calculated after full deduction of transfer costs (up to 13.9%) and notthe 2.5% flat rate applied by most SICAFIs. The EPS changes describedabove are too small for us to change our target price (€68), computed as 25% of the worst case scenario NAV and 75% of our DCF valuation (€76), leaving a 12-month potential total return of 30%.
Main shareholders (%) Wereldhave group 68.2
Share data No. of shares (m) 5.3Daily turnover (shares) 1,150.0Free float (%) 31.8Enterprise value (€m) 297.3Market cap (€m) 261.7
Newsflow
Date Description
20 Feb. 2008 FY07 results 9 April 2008 AGM 18 April 2008 Dividend payment 7 May 2008 Q1 results
Company profile Listed in June 1998, Wereldhave Belgium’s (WB) keyfeature is its exposure to shopping malls (57% of total portfolio) offering both a relatively secure flow of income(risk spread among lots of tenants) and management ofthe branch mix in order to maximise revenues. Thedevelopment of large retail premises is heavilyregulated in Belgium. Shopping malls are all in Walloniaand include Belle-Ile (Liège – 37% of FY06 retail rentalincome), Shopping Center de Nivelles (located in theeponymous city) and Les Bastions (Tournai). In 1999-2006, all retail properties posted rental incomegrowth well above inflation. Offices show a less rosypicture. End 1998, WB acquired a piece of land in anoffice park (Business & Mediapark) in Vilvoorde(Brussels Periphery) where an office complex (phase IIIcompleted in 2002) was developed 100% at risk (a firstamong SICAFIs). In 1999, WB acquired a second officesite in Vilvoorde (Olieslagerlaan, 100% let atacquisition) and a second speculative office project inthe Antwerp area (De Veldekens, phase III, completedin 2002). Sizeable leases were signed in 2000-01 but the market deteriorated sharply while subsequentphases of existing projects were completed. 2004-05 witnessed sharp rent increases in the retailportfolio with virtually zero vacancy but an even weakersituation for offices in the Brussels Periphery. Overalloccupancy as of end 2005 stood at 83%, marginallybetter than in 2004. However, FY06 witnessed agradual recovery of offices occupancy. With virtually nofinancial debt, WB cautiously restarted acquisitions in2004 (16% stake in the real estate certificate Kortrijk Ring, shops in Nivelles) followed now by plannedextensions in Nivelles and Tournai. Unfortunately, 2006 also witnessed the re-emergenceof old fiscal litigation.
Strategy As a registered SICAFI (closed-end property investmentcompany), WB's sole activity is the active managementof its property portfolio. It sees the double office/retailexposure as a key diversification feature,complemented by its geographic diversification. WB is apartnership limited by shares; the statutory manager isWereldhave Belgium SA NV, a subsidiary ofWereldhave, a Dutch beleggingsinstelling.
Risk factors Legal risk: A worst case scenario would be theliquidation of the company & confiscation of the Belle-Île shopping centre leaving the NAVPS at €41.67. Marketrisk related to the heavy exposure to the beleagueredBrussels Periphery office market. The expected recovery can't be taken for granted.
SWOT Strengths Some 60% of the portfolio invested in shopping mallsoffering a secure flow of income and a management ofthe branch mix in order to maximise total revenues. Office portfolio consist of modern, attractive buildings
Weaknesses Very poor record especially in offices, with ill-timed acquisitions and developments. Sub-optimal financial structure (no financial debt). Shy financial disclosure policy Low market cap and free float
Opportunities Recovery in the Brussels periphery office market Expansion potential in Nivelles and Tournai
Threats The litigation with the Belgian state remains animportant question, if not financially, but in terms ofreputation
With TOL out of the woods and facing possible positiverevisions at the FY07 stage, it might have passed theinflection point. We see two triggers that might drive a re-rating of the shares in 2008: the potential sale of TOL and thedeconsolidation of Favory frozen. BUY maintained.
Investment thesis
There are three reasons why we like Wessanen: 1) We believe TOL haspassed the inflection point and see the potential for further positive revisionsat the FY07 results. We expect operating margins to reach 2.4% in 2008.2008 could be the year when Wessanen considers disposing of TOL, which would be a trigger for the shares. 2) With the restructuring of Favory frozenpaid for in 2007 and cash flow increasing quickly in 2008F, Wessanen mightopt for a gradual reduction of its 60% stake with an opportunity todeconsolidate in 2009. 3) In 2008, the Branded portfolio should not be heldback by the loss of sole agency contracts and should receive further supportfrom a step-up in A&P spending.
Key newsflow
For TOL, the 4Q07 growth rate should be at least as good as in 3Q07, ie, around 7.5% organic growth. On top of a very easy comparable (-8.9% in 4Q06), the new contracts coming on stream should be a driving factor forgrowth. Finally, the gap has closed in the natural channel, and 4Q07 shouldbe no exception. Wessanen might surprise at the 2007 results, withincreased organic sales growth guidance for 2008. The US Brandedbusiness should continue to be strong.
We expect European Branded to have a solid ending to 2007F, helped bythe re-launch of Beckers and a general step-up in A&P spending for its natural and organic brands. Furthermore, European Branded has a relativelyeasy comparable versus 4Q06. We expect European Distribution to continueto benefit from the roll-out in the UK in 4Q07 but to witness a slowdown froma very strong 3Q07.
The improvement at the FY07 stage should also come at the NWC level.From a somewhat disappointing result in 3Q07, which saw a furtherextension in NWC, an improvement to the year-end and a good sell-through should lower overall NWC in 2007F vs 2006.
At a net debt/EBITDA of approximately 1.2x for 2008F, Wessanen is wellpositioned to engage in more share buybacks or to further consolidate on itsnumber-one position in natural and organic European branded products.
Valuation
Wessanen is currently trading at a 2009F PER of 12.1x, more than a 40%discount to its large-cap peers. On a 2009F EV/EBITDA of 7.8x, the discountis 43%. Wessanen’s current dividend yield of 5.9% should provide furthersupport for the shares. The two ‘call options’ of a sale of TOL and deconsolidation of Favory frozen are the potential icing on the cake. BUY.
Main shareholders (%) Sparinvest 5.4M&G Investments 5.1Delta Lloyd 5.1Fidelity 4.9
Share data No. of shares (m) 68.0Daily turnover (shares) 88,056Free float (%) 22.0Enterprise value (€m) 885.1Market cap (€m) 746.0
Company profile Wessanen's history dates back to 1765 when AdriaanWessanen and Dirk Laan began their trade in mustard,canary and other seeds. During the last decades of the 20th century, Wessanen acquired a large number ofcompanies worldwide. It is a multinational food company that markets,distributes and produces health and premium productsin Europe (38% of 2007F sales) and North America(62%). Distribution services account for 62% of 2007Fsales vs 38% for Branded products. Wessanen's biggest division consists of Tree Of Life(TOL) North America, which markets and distributesnatural and speciality food products in the US andCanada to supermarkets and natural food shops. TOLEurope leads the European market in the marketingand distribution of healthy and natural food productsand specialities to supermarkets and speciality shops. International brands include Beckers, Kame and Daily’sin the premium food segment, while Bjorg, WholeEarth,Gaylord Hauser and Zonnatura are brands focusing onthe health segment.
SWOT Strengths Balance sheet is conservatively geared Dividend payment offers a highly attractive yield Limited impact from commodity environment
Weaknesses NWC progress is worrying Free cash flow in 3Q07 was disappointing Tax rate will increase to 30% lowering NI growth
Opportunities Disposing of TOL for 0.35-0.40x sales Deconsolidating Favory frozen from FY09F onwards Further M&A at 0.8-1.2x sales
Threats Failure to deliver margin progress at TOL in FY08F US market slowdown in Natural & Organic Further SKU rollout might affect NWC
WK is now in good shape, with revived organic growth andmargins. We expect offshoring and new product launches todrive double-digit EPS growth in 2007-09F. We believe progress is priced into the valuation vs peers and considerWK a solid defensive growth stock for if the economy slows.
Investment thesis
Wolters Kluwer (WK) is now in good shape, growing revenues organically(4% in 2007F vs 2003’s -2%) and increasing its EBITA margin from 15.8% in2005 to 19% in 2007F thanks to fruitful product investment (online),successful restructuring and management changes in 2003-07.
We expect further improvements to come from new product launches andcost savings from offshoring. On the back of these, we forecast double-digit EPS growth in 2007-09F. That said, we expect most strategic changes tohave been made by now, with the adaptation of product portfolios and the divestment of the education business. Looking ahead, we expect fine-tuning through bolt-on online and content acquisitions.
WK’s financial position is solid. It recently returned c.€650m in cash via a share buyback, thanks mainly to having divested its education activities, butalso so as to maintain its targeted net debt/EBITDA ratio of 2.5x. We believeits c.€400m annual free cash flow is ample for acquisitions purposes.
In a recession scenario, WK should initially show its defensive strengths thanks to its subscription revenue model with only c.5% of revenue comingfrom advertising. Moreover, its products and client relationships have beensubstantially improved over the last four years. Nevertheless, WK is notimmune; we would expect revenue growth to halve to c.2% (vs 2007F’s 4%)and the EBITA margin to decline to 18% (vs 2008F’s 20%) some two yearsafter the start of a recession.
Key newsflow
Newsflow to watch includes US business trends in the accounting, bankingand pharma industries where e-professionals are WK customers.Furthermore, whether WK announces acquisitions or maintains leveragethrough further cash returns will be of interest. As for the 2007 results, weexpect WK to meet guidance and report an acceleration in its Health division, CFS to have been affected by the US mortgage market situation, and theEuropean and TAL divisions to continue to perform well.
Valuation
WK is trading at a 2008F PER of 15.5x, or a c.6% discount to its peer ReedElsevier (BUY, TP 725p/€16.25), which we believe is justified given thatReed Elsevier boasts lower 2007F organic revenue growth (4% vs 6%) andmargins (19% vs 24%). Our (unchanged) target price of €24 is based on WK continuing to trade in line with professional publishing peers on forward-looking PER and is supported by a DCF valuation. HOLD. _
Main shareholders (%) Morgan Stanley IM 5.1ING Group 5.5Brandes 4.96Silchester 6.0
Share data No. of shares (m) 295.6Daily turnover (shares) 796,857Free float (%) 95.0Enterprise value (€m) 8,391.7Market cap (€m) 6,535.7
Newsflow
Date Description
27 February 2008 2007 results 22 April 2008 AGM 7 May 2008 1Q08 results
Share price performance
16
18
20
22
24
26
12/05 6/06 12/06 6/07 12/07PriceAEX All Share (rebased)
Company profile Overview Wolters Kluwer (WK) provides content products andinformation tools to professionals in the legal, fiscal,medical and educational fields. It has made c.300acquisitions since the end of the 1980s, of which thepurchase of US tax publisher CCH (1995) was a turningpoint. WK’s origins lie in newspaper and bookpublishing and printing, activities that were divested inthe early 1990s.
Legal, Tax & Business Europe (c.35% of revenue) LTB Europe focuses on the legal, fiscal/financial,human resources, public administration, health, safety& environment and transport client segments withpublications and software products. WK has a broadpresence across Europe with leading brands such asTeleroute, Lamy in France, Kluwer in the Netherlands,Croner CCH in the UK and Luchterhand in Germany.
Tax, Accounting and Legal (c.25% of revenue) TAL provides accountants and attorneys in corporationsas well as US government agencies with legal, tax andaccounting information products and services.Examples of WK companies are CCH Group, a leadingUS tax publisher, and Aspen Publishers.
Health (c.25% of revenue) The Health division provides pharma, medical andpractitioner information as well as clinical tools to professional users. The division expanded rapidly in the1990s through the acquisition of distribution platformssuch as Ovid and Silverplatter, and content providerssuch as Lippincott, Facts&Comparisons and Medispan.
Corporate & Financial Services (c.15% of revenue) The CFS division provides compliance and productivitytools for corporate legal and financial complianceprofessionals. Examples of WK companies are BankersSystems Inc and CT Corporation.
Risks Risks include the business climate for the tax and legaldivisions, online product launches and the US$/EURrate, which affects around half of WK’s revenues.
SWOT analysis Strengths Operates in relatively stable markets Robust subscription revenue model with littleadvertising Number 1 or 2 in 80% of its businesses
Weaknesses US$ exposure c.50% of revenues
Opportunities Revenue growth-enhancing acquisitions Financial room to increase leverage
Threats Entrance of internet-based competitors Increased scale of direct competitors Reed Elsevier and Thomson-Reuters
Amsterdam 31 20 563 80 84 Brussels 32 2 547 13 71 Edinburgh 44 131 527 3020 Geneva 41 22 593 80 50 London 44 20 7767 8954 Madrid 34 91 789 8888 Milan 39 02 89629 3660 New York 1 646 424 6033 Paris 33 1 55 68 45 00
261
Benelux small & mid caps January 2008
Disclosures Appendix ANALYST CERTIFICATION The analyst(s) who prepared this report hereby certifies that the views expressed in this report accurately reflect his/her personal views about the subject securities or issuers and no part of his/her compensation was, is, or will be directly or indirectly related to the inclusion of specific recommendations or views in this report.
IMPORTANT DISCLOSURES Company disclosures and ratings charts are available from the disclosures page on our website at http://research.ing.com or write to The Compliance Department, ING Financial Markets LLC, 1325 Avenue of the Americas, New York, USA, 10019. Valuation and risks: For details of the valuation methodologies used to determine our price targets and risks related to the achievement of these targets refer to the main body of this report and/or the most recent company report available at http://research.ing.com.
The remuneration of research analysts is not tied to specific investment banking transactions performed by ING Group although it is based in part on overall revenues, to which investment banking contribute.
Securities prices: Prices are taken as of the previous day’s close on the home market unless otherwise stated.
Job titles. The functional job title of the person/s responsible for the recommendations contained in this report is equity research analyst unless otherwise stated. Corporate titles may differ from functional job titles.
Conflicts of interest policy. ING manages conflicts of interest arising as a result of the preparation and publication of research through its use of internal databases, notifications by the relevant employees and Chinese walls as monitored by ING Compliance. For further details see our research policies page at http://research.ing.com.
FOREIGN AFFILIATES DISCLOSURES Each ING legal entity which produces research is a subsidiary, branch or affiliate of ING Bank N.V. See back page for the addresses and primary securities regulator for each of these entities.
RATING DISTRIBUTION (as of end 4Q07) RATING DEFINITIONS
Equity coverage Investment Banking clients*
Buy 51% 31%
Hold 43% 26%
Sell 6% 27%
100%
* Percentage of companies in each rating category that are Investment Banking clients of ING Financial Markets LLC or an affiliate.
Buy: Forecast 12-mth absolute total return greater than +15%
Hold: Forecast 12-mth absolute total return of +15% to -5%
Sell: Forecast 12-mth absolute total return less than -5%
Total return: forecast share price appreciation to target price plus forecast annual dividend. Price volatility and our preference for not changing recommendations too frequently means forecast returns may fall outside of the above ranges at times.
Research published prior to 15/12/05: EMEA equities’ ratings were based on US dollar total returns; Western Europe’s were based on: absolute return +25%, Strong Buy; greater than +10%, Buy; +10% to -10%, HOLD; lower than -10%, Sell.
.
_
262
Benelux small & mid caps January 2008
il EQUITY MARKETS
Small & mid caps Benelux
Expectations of a mid-cycle dip offer opportunities at discountedvaluations ◆
In the current context, we prefer defensive and structural growth.Avoid high cyclical and US exposure ◆
Dutch top picks: Aalberts, Arcadis, Boskalis, Fugro, Imtech andWessanen ◆
Belgian top picks: Arseus, Colruyt, Kinepolis, Telenet, Transicsand Umicore ◆
Benelux Small & Mid Cap
Team
Benelux small & midcapsSailing in rough seas
January 2008
Ben
elu
x s
mall &
mid
cap
sJan
uary
2008
SEE THE DISCLOSURES APPENDIX FOR IMPORTANT DISCLOSURES AND ANALYST CERTIFICATION
Research offices: legal entity/address/primary securities regulator Almaty Representative office, ING Bank N.V. in Kazakhstan, 85a, Dostyk Avenue, Office 510, 050010, Almaty, Kazakhstan.
Agency of the Republic of Kazakhstan on Regulation and Supervision of Financial Market & Financial Organizations
Amsterdam ING Bank N.V., Foppingadreef 7, Amsterdam, Netherlands, 1102BD. Netherlands Authority for the Financial Markets
Bratislava ING Bank N.V., pobocka zahranicnej banky, Jesenskeho 4/C, 811 02 Bratislava, Slovak Republic. National Bank of Slovakia
Brussels ING Belgium S.A./N.V., Avenue Marnix 24, Brussels, Belgium, B-1000. Banking Finance and Insurance Commission
Bucharest ING Bank N.V. Bucharest Branch, 11-13 Kiseleff Avenue, Sector 1, Bucharest, Romania, 71268. Romanian National Securities and Exchange Commission
Budapest ING Bank Zrt, Dozsa Gyorgy ut 84\B, H - 1068 Budapest, Hungary. Hungarian Financial Supervisory Authority
Dubai ING Bank N.V. Dubai Branch, Level 2, Gate Village 05, Dubai International Financial Center (DIFC), PO Box 121208. Dubai Financial Services Authority
Edinburgh ING Bank N.V. London Branch (Edinburgh office), 2 Canning Street Lane, Edinburgh, United Kingdom, EH3 8ER. Financial Services Authority
Hong Kong ING Bank N.V. Hong Kong Branch, 39/F, One International Finance Centre, Central Hong Kong. Hong Kong Monetary Authority
Kiev ING Bank Ukraine JSC, 30-a, Spaska Street, Kiev, Ukraine, 04070 Ukrainian Securities and Stock Commission
London ING Bank N.V. London Branch, 60 London Wall, London EC2M 5TQ, United Kingdom. Financial Services Authority
Madrid ING Bank NV, Sucursal en Espana, C/Genova, 27. 4th Floor, Madrid, Spain, 28004. Comisión Nacional del Mercado de Valores
Manila ING Bank N.V. Manila Branch, 21/F Tower I, Ayala Avenue, 1226 Makati City, Philippines. Philippine Securities and Exchange Commission
Mexico City ING Grupo Financiero (Mexico) S.A. de C.V., Bosques de Alisos 45-B, Piso 4, Bosques de Las Lomas, 05120, Mexico City, Mexico. Comisión Nacional Bancaria y de Valores
Milan ING Bank N.V. Milano, Via Paleocapa, 5, Milano, Italy, 20121. Commissione Nazionale per le Società e la Borsa
Moscow ING Bank (Eurasia) ZAO, 36, Krasnoproletarskaya ulitsa, 127473 Moscow, Russia. Federal Financial Markets Service
Mumbai ING Vysya Bank Limited, A Wing, Shivsagar Estate, 2nd Floor, South Wing, Dr. Annie Besant Road, Worli, Mumbai, 400 018. India Securities and Exchange Board of India
New York ING Financial Markets LLC, 1325 Avenue of the Americas, New York, United States,10019. Securities and Exchange Commission
Paris ING Belgium S.A., Succursale en France, Coeur Défense, Tour A, La Défense 4, 110 Esplanade du Général de Gaulle, Paris La Défense Cedex, 92931. l’Autorité des Marchés Financiers
Prague ING Bank N.V. Prague Branch, Nadrazni 25, 150 00 Prague 5, Czech Republic. Czech National Bank
Sao Paulo ING Bank N.V. Sao Paulo, Av. Brigadeiro Faria Lima n. 3.400, 11th Floor, Sao Paulo, Brazil 04538-132. Securities and Exchange Commission of Brazil
Singapore ING Bank N.V. Singapore Branch, 19/F Republic Plaza, 9 Raffles Place, #19-02, Singapore, 048619. Monetary Authority of Singapore
Sofia ING Bank N.V. Sofia Branch, 12 Emil Bersinski Str, Ivan Vazov Region,1408 Sofia, Bulgaria. Bulgarian Central Bank and Financial Supervision Commission
Warsaw ING Securities S.A., Plac Trzech Krzyzy, 10/14, Warsaw, Poland, 00-499. Polish Financial Supervision Authority
Disclaimer This report has been prepared on behalf of ING (being for this purpose the wholesale and investment banking business of ING Bank NV and certain of its subsidiary companies) solely for the information of its clients. ING forms part of ING Group (being for this purpose ING Groep NV and its subsidiary and affiliated companies). It is not investment advice or an offer or solicitation for the purchase or sale of any financial instrument. While reasonable care has been taken to ensure that the information contained herein is not untrue or misleading at the time of publication, ING makes no representation that it is accurate or complete. The information contained herein is subject to change without notice. ING Group and any of its officers, employees, related and discretionary accounts may, to the extent not disclosed above and to the extent permitted by law, have long or short positions or may otherwise be interested in any transactions or investments (including derivatives) referred to in this report. In addition, ING Group may provide banking, insurance or asset management services for, or solicit such business from, any company referred to in this report. Neither ING Group nor any of its officers or employees accepts any liability for any direct or consequential loss arising from any use of this report or its contents. Copyright and database rights protection exists in this report and it may not be reproduced, distributed or published by any person for any purpose without the prior express consent of ING. All rights are reserved. Any investments referred to herein may involve significant risk, are not necessarily available in all jurisdictions, may be illiquid and may not be suitable for all investors. The value of, or income from, any investments referred to herein may fluctuate and/or be affected by changes in exchange rates. Past performance is not indicative of future results. Investors should make their own investigations and investment decisions without relying on this report. Only investors with sufficient knowledge and experience in financial matters to evaluate the merits and risks should consider an investment in any issuer or market discussed herein and other persons should not take any action on the basis of this report. This report is issued: 1) in the United Kingdom only to persons described in Articles 19, 47 and 49 of the Financial Services and Markets Act 2000 (Financial Promotion) Order 2005 and is not intended to be distributed, directly or indirectly, to any other class of persons (including private investors); 2) in Italy only to persons described in Article No. 31 of Consob Regulation No. 11522/98. Clients should contact analysts at, and execute transactions through, an ING entity in their home jurisdiction unless governing law permits otherwise. ING Bank N.V., London branch is authorised by the Dutch Central Bank and regulated by the Financial Services Authority for the conduct of UK business. It is incorporated in the Netherlands and its London branch is registered in the UK (number BR000341) at 60 London Wall, London EC2M 5TQ. ING Financial Markets LLC, which is a member of the NYSE, NASD and SIPC and part of ING, has accepted responsibility for the distribution of this report in the United States under applicable requirements. ING Vysya Bank Ltd is responsible for the distribution of this report in India. EQ Additional information is available on request