Journal of Economic Crime Management Winter 2005, Volume 3, Issue 1 Benford’s Law: Can It Be Used to Detect Irregularities in First Party Automobile Insurance Claims? Scott Daniel Petucci Utica Mutual Insurance Group Abstract The research described in this article demonstrates that a digital analysis method called Benford’s Law can be applied to first-party automobile insurance claim data to detect number irregularities, which can be used in uncovering fraudulent automobile claim activity. This work is important because it provides a unique method of automating the automobile claim fraud detection process at Utica National Insurance Group (UNIG). Striving for new and different ways to automate this process sets the stage for more efficient and effective fraud detection both reactively and proactively. The study shows that Benford’s Law can detect number irregularities within first- party automobile physical damage claim payments. With further research and development, Benford’s Law has the potential to become a widely used and respected tool to detect insurance claim fraud. However, additional work must be completed before it will be effective enough to deploy industry wide. Several valuable lessons were learned, and common obstacles recognized, in the process of this research. The project should serve as a “road map” for future research in the field of digital analysis, and more specifically, Benford’s Law. Introduction One of the main objectives for the Internal Audit Department (IAD) at Utica National Insurance Group (UNIG) is to detect fraudulent activity within any function of the company. During 2003, the IAD was involved in an investigation of automobile salvage fraud. The investigation consisted of manually reviewing upwards of one hundred claim files in an attempt to gather concrete evidence that would prove the suspected fraudulent claim activity. As the investigation continued, it became more complicated. From the onset of the initial salvage fraud investigation, the IAD realized that a more efficient way to identify fraudulent claim activity would improve its success in detecting fraud. Based on this, the IAD began to brainstorm for ideas on how to make the fraud detection role more efficient and effective. The investigation had literally “snowballed,” necessitating company-wide audits of automobile material damage and salvage claim handling processes to assess and control weaknesses identified during the salvage investigation. After approximately a year of investigation on the suspected salvage fraud claims, along with attempting to conduct company-wide www.jecm.org
Benford’s Law: Can It Be Used to Detect Irregularities in First
Party Automobile Insurance Claims?
Scott Daniel Petucci Utica Mutual Insurance Group
Abstract
The research described in this article demonstrates that a digital analysis method called Benford’s Law can be applied to first-party automobile insurance claim data to detect number irregularities, which can be used in uncovering fraudulent automobile claim activity. This work is important because it provides a unique method of automating the automobile claim fraud detection process at Utica National Insurance Group (UNIG). Striving for new and different ways to automate this process sets the stage for more efficient and effective fraud detection both reactively and proactively. The study shows that Benford’s Law can detect number irregularities within first-party automobile physical damage claim payments. With further research and development, Benford’s Law has the potential to become a widely used and respected tool to detect insurance claim fraud. However, additional work must be completed before it will be effective enough to deploy industry wide. Several valuable lessons were learned, and common obstacles recognized, in the process of this research. The project should serve as a “road map” for future research in the field of digital analysis, and more specifically, Benford’s Law.
Introduction
One of the main objectives for the Internal Audit Department (IAD) at Utica National Insurance Group (UNIG) is to detect fraudulent activity within any function of the company. During 2003, the IAD was involved in an investigation of automobile salvage fraud. The investigation consisted of manually reviewing upwards of one hundred claim files in an attempt to gather concrete evidence that would prove the suspected fraudulent claim activity. As the investigation continued, it became more complicated. From the onset of the initial salvage fraud investigation, the IAD realized that a more efficient way to identify fraudulent claim activity would improve its success in detecting fraud. Based on this, the IAD began to brainstorm for ideas on how to make the fraud detection role more efficient and effective. The investigation had literally “snowballed,” necessitating company-wide audits of automobile material damage and salvage claim handling processes to assess and control weaknesses identified during the salvage investigation. After approximately a year of investigation on the suspected salvage fraud claims, along with attempting to conduct company-wide
automobile material damage and salvage claim audits, the IAD decided to use Benford’s law to review property and casualty claim data. The IAD was faced with the difficulty of auditing the property and casualty claim departments for fraudulent activity committed by employees. Internal fraud, especially automobile physical damage claim fraud, can be extremely difficult to identify on a proactive basis, because of the training and expertise required to recognize potential fraud. Also, those who possess training and expertise in material damage, i.e. body shops or appraisers, know how to hide the fraud, or argue for the additional payments that make up the fraud. Depending on the experience level of persons involved in the fraud, it can become so complicated that only a blatant mistake, a tipster with proof, or excessive greed on the part of the perpetrator will expose the fraud.
The purpose of the research described in this article was to provide a unique way to automate the internal fraud detection and improve the claim file sample selection process, reviewing only files that displayed anomalies, a more targeted approach. It was hoped that doing so would allow the IAD to become more efficient and effective in detecting internal fraud, specifically first party automobile property and casualty insurance claim fraud. By analyzing data using Benford’s Law, the IAD can become more efficient in both their reactive and proactive approaches to fraud detection. Benford’s Law
Benford’s Law is used to determine the normal level of number duplication in data sets, which in turn makes it possible to identify abnormal digit and number occurrences. Such an occurrence may indicate an error or fraudulent activity. Benford’s Law states that the digits 1 through 9, because 0 can never be a leading number, occur by certain percentages in most data sets of numbers. These data sets can be as random as stock prices from the New York Stock Exchange, every number mentioned on the front page of the New York Times, or a report showing automobile physical damage payments for a certain time frame. The general principle is that the number 1 most often occurs as the leading number within data sets. The leading digits decrease in frequency from 1 to 9, with the number 1 being the most frequent number and the number 9 being the least. If the general rule of Benford’s Law, analysis on strictly the first leading digit in the data, does not apply because of real-life consideration, then the law can be manipulated by applying additional tests in order to analyze data. Advanced analysis using Benford’s Law basically expands the analysis past the first digit and can implement combinations of digits, such as the first 2-digits, last 2-digits, etc. Computer applications are used for data analysis, bridging the gap between the general rule of Benford’s Law and the more advanced uses of the law needed for a detailed analysis. To complete the more detailed reviews
necessary for auditing the property and casualty sector of an insurance company, the Benford’s Law tests need to be expanded beyond the first digit test to review different digit combinations, looking for number irregularities. The fact is human choices are not random in nature; they are deliberately chosen. Therefore, invented numbers, such as those created by a fraudster, are unlikely to follow Benford’s Law in its general sense. Fraudulent insurance claim data would technically not be random in nature; the fraudster intentionally changes it. Having said that, more often than not, a detailed analysis using Benford’s Law will need to be conducted to obtain the highest probability of detecting fraud within property and casualty insurance claim data.
Also, simple non-conformity to Benford’s Law may be enough of an indicator that something just is not right. For example, if the data runs completely opposite of Benford’s Law, and 7s, 8s, and 9s are the most frequent first digits, this anomaly may warrant further investigation. (AICPA, 1999)
The Problem
The Internal Audit Department at Utica National Insurance Group was looking for a unique and effective way to conduct its claim file audits and investigations of fraudulent claims regarding the property and casualty lines of business. Traditionally, the audit or investigation is conducted “reactively”’ based on a concern brought forth by an employee or management. A scheduled audit would be considered a proactive approach taken by the IAD to detect internal automobile insurance claim fraud. The implementation of Benford’s Law, via ACL software, provided the initial step in adding a new approach to the fraud detection role when reviewing property and casualty claim files from both a reactive and a proactive standpoint. ACL software is a data analysis software package. It does not allow the editing of data once it is in the database, but it does allow the manipulation of data in order to detect illogical relationships that are occurring. If such a relationship is detected, an auditor or investigator can conduct a more focused, efficient, and effective investigation into that relationship. This research project shows that Benford’s Law can be applied to property and casualty insurance claim data in order to identify number irregularities. Ultimately, looking beyond this research, the hope is to expand the use of Benford’s Law to detect fraudulent activity in other departments, as well.
Theoretical Framework for the Study In order to understand the framework on which this research was based, it is necessary to explain how ACL assisted in proving the theory that Benford’s Law can be applied to property and casualty insurance claim data to identify number irregularities. A description follows regarding the rules for obtaining a Benford’s set of numbers, along with the tests to show conformity or non-conformity to the law. An explanation of the ACL results is provided post-analysis. A data set should conform to four basic rules in order to apply Benford’s Law. First, the data set should describe similar phenomena, meaning they should all be dollar values, or lengths, or counts. Second, the data should have no fixed minimum or maximum. Third, the data should not consist of assigned numbers; they need to be random in nature. And last, the data set should include more small items than bigger ones. (Using ACL to Apply Benford’s Law, 2001) This last criterion reflects the fact that in randomly occurring data there are, for example, more towns than cities, more small companies than giant Intels or General Electrics, and more small lakes than big lakes. (Nigrini, 2000) Research has shown that the numbers in data sets should have four or more digits for a good fit with Benford’s Law. However, if this requirement is violated the whole ship does not sink. When the numbers have fewer than four digits, there is a slightly larger bias in favor of the lower digits. Unless users are working with nothing but single- or double-digit numbers, the bias is not severe enough to merit an adjustment to the expected digit frequencies. (Nigrini, 2000)
In creating a Benford Set, which is a data set that will conform to Benford’s Law, a data set must be large for a close fit to the Benford’s distribution. For instance, the expected proportion for the first digit to be a “9”’ is .0457574906, rounded to 10 decimal places. If the data set has only 100 observations there can be only from 0 to 100 occurrences of a specified first digit. This will end up being an integer percentage (e.g. 5 percent or 30 percent). None of the expected percentages in Benford’s Law are integer values. A small sample cannot hit the Benford percentages on the nail, and can cause deviations in Benford’s Law. As a data set increases in size, it becomes more feasible to get the expected digit frequencies of Benford’s Law. (Nigrini, 2000) Once a Benford Set is obtained, there are five major digital tests that are used to determine whether data sets actually conform. The tests determine the relative frequency of (1) first digits, (2) second digits, (3) first two digits, (4) first three digits, and (5) last two digits. The first major digital analysis is the first-digits test. It can be compared to the view of the countryside from an airplane window. It is a high-level test, and you will not spot anything unless it is very blatant. Auditors should not use this test to select audit targets.
The second-digit test, which tests just the second digit, is the second high-level test of reasonableness. The second- digit tests are also not used to select audit targets. Any set of audit targets selected from the second-digit test would be a relatively large sample and the test is, therefore, quite inefficient as an audit sampling mechanism. The First-Two-Digit (F2D) Test is more focused than the previous test. It was originally designed to select audit targets. The first two digits of a number are the leftmost two digits, excluding zeros. The test is performed to find anomalies in the data that are not readily apparent from either the first or second digits when viewed on their own. For data under 10,000 observations, the test can generate audit target samples that are cost-effective by providing manageable data sets. This can save on manpower hours and network time used to produce the results of the analysis. With larger data sets the number of targets becomes too great, and, therefore, not cost-effective. The first three digits of a number are the leftmost three digits excluding zeros. The First-Three-Digit (F3D) Test is a highly focused test that gives the auditor relatively small samples. Whereas the F2D test tends to pick up broad categories of abnormality, the F3D test, with its greater precision, tends to pick up abnormal duplications. The fifth test is the Last-Two-Digit (L2D) Test. The objective of the L2D Test is to find invented numbers and rounded numbers. This test may give a small enough sample to select an audit target effectively, if the data sets are under 10,000 observations. (Nigrini, 2000) ACL version 7.2.1 does not have the capability to perform all of these tests, but it can provide an analysis using 1-6 leading digits. In each case the actual results are compared to the expected value in relation to a specific data set. This is called a “My Law” analysis of data because the auditor is applying the Benford’s Law number duplication test, but looking for an abnormal reoccurrence of numbers that are specific to the data set. “My Law” analyses are considered more detailed than the traditional first digit Benford Law analyses. A thorough analysis will often begin with 1 digit, to assess the overall fit of the data to Benford, then move to 2 or even 3 digit combinations in order to select specific targets for further review. The Benford’s Law feature of ACL also lets the user apply bounds to a data set. Bounds are calculated based on the total number of records in the data set and the number of digit combinations to be analyzed. The space between the upper and lower bound for a specific digit shows the actual proportions corresponding to a Z-statistic of less than 1.96. A Z-statistic of 1.96 is the baseline indicating no significance of abnormality in the number. The upper and lower bounds are placed so that, on average, no more than one of the resulting data would lie outside of them purely by chance. If several data exceed the bounds, this
suggests a non-random variation that should be investigated. (Using ACL to Apply Benford’s Law, 2001) After each Benford’s command is executed, ACL shows the user the actual and expected value, a Z-statistic (Z-stat), and upper and lower bounds. ACL will also warn the user if the population is possibly too small for the test they are performing, stating the warning textually in the command log window. The Z-stat measures how far a particular result is from the expected value. It is expressed in standard deviation, so that a Z-stat of 0.500 represents one-half of a standard deviation, which is a very common result and therefore not significant. (Using ACL to Apply Benford’s Law, 2001) When the Z-stat exceeds 1.96 it means that the difference between the actual proportion and the expected proportion is significant at the 0.05 level. There is only a 5 percent (1/20) probability that the difference is due to chance alone. However, such differences are actually a common occurrence in digital analysis. Bear in mind that the Z-stat for each digit is calculated separately, and there are nine first digits. If each digit has a 1-in-20 chance of having a Z-stat of 1.96 or greater, then the chance that at least one of the nine will do so is about 37 percent. In performing a dozen first-digit analyses, encountering “significant” deviations in four or five cases is expected. Such deviations would typically be purely random, with no practical audit significance. (Nigrini, 2000) The important thing to recognize and understand when using the Z-stat is what kind of number should indicate the need for further investigation. The significance of the Z-stat is dependent on the size of the sample and how many times a possible high Z-stat shows up within that sample. For the purpose of this article, it is not necessary to fully comprehend the mathematics behind the Z-stat or standard deviation, but it is important to understand their importance in the analysis process.
Hypothesis and Expectations The use of the Benford’s command in ACL will prove that property and casualty insurance claim data will conform to Benford’s Law. The detection of number irregularities within the claim data after applying Benford’s Law will provide the proof of this hypothesis. The reason for this expectation is the data from the lines of business to which Benford’s Law will be applied meet all of the requirements needed for conformity. The insurance claim data (explained in detail in the Results section) will be of similar phenomenon, there is no fixed minimum and virtually no fixed maximum (except for policy limits, which are rarely reached), the numbers are random, not assigned, and there will be more small numbers versus large numbers.
The expectation for Benford’s Law beyond this project is that it will prove useful as a fraud detection tool across most lines of business within the insurance industry. It will also provide the auditor or investigator with a unique and powerful approach to fraud detection. Methodology This research study has expanded the use of Benford’s Law in the insurance industry by applying it to first party automobile physical damage claim payments. First party automobile physical damage claim payments were reviewed for a particular office to determine if the payments being made during a pre-determined time frame conformed to Benford’s Law. The supposition was that irregularities might lead to a number of scenarios, or situations. Some scenarios may include inexperienced adjusters overpaying claims or experienced adjusters making inflated claim payments for kickbacks. In order to complete the project, the review was restricted to first-party automobile insurance claim payments for one of UNIG’s Regional Offices (RO). The time period was from April 1, 2002 through April 30, 2003. One of the obstacles of the study was that the version of ACL utilized by UNIG only has the capability to conduct digital analysis on the first six digits of a number. The version employed does not have the capability to perform some of the more complex analyses that were mentioned previously. The more complex analysis may have provided a more complete and accurate determination of the applicability of Benford’s Law to first party automobile insurance claim data. In addition, the data used for analysis had to be properly “cleaned” so it would not negatively affect the results. The “cleaning” ensured that all of the data was from first-party claims only, that all records were at the correct dollar threshold, and that the company standard deductible was added back into the payment in order to get an accurate analysis. Procedures
Several preliminary steps needed to be complete in order to conduct the research. First, the author had to increase his knowledge of the ACL software used to conduct the research. The author had not used ACL prior to conducting this research. Having said that, not only were the skills to use ACL for general data analysis needed, but the ability to learn and understand the Benford’s Law commands available within the software was essential. Second, the type of data needed for the Benford’s analysis had to be decided upon. There has not been much work done using Benford’s Law on property and casualty insurance claim data, so there were no limits regarding the uniqueness
of the project. On the other hand, the author needed to be careful not to take on an impossible task given the time frame for the completion of the project. Third, once the population was selected, the help of a co-worker was solicited to run the reports needed to obtain the data for the analysis. The size of the data set obtained was also a key factor in the population selection. The data set had to be large enough to get an accurate assessment of the applicability of Benford’s Law to the data chosen. The desired data set had to consist of greater than one thousand records, but less than ten thousand records for optimal conformity to Benford’s Law. Fourth, the successful exportation of records from the database reports into ACL was verified to ensure that all records were present. After the importation of data into ACL, there was some preliminary analysis needed to filter out the unwanted records, keeping only the records desired for the Benford’s analysis. The filtering was based on the line of business, issue date of the transaction, and type of payment made. Lastly, the Benford’s Law analysis was performed on the selected data to prove that it can be applied to property and casualty insurance claim data. It took two different types of analysis to complete this step. It was necessary to extend the Benford’s analysis past the first digit, to the second digit, in order to obtain the most accurate analysis that could be clearly explained to the reader, and that ACL version 7.2.1 could provide. Research Population or Sample Claim payments from the Regional Office during the date range of April 1, 2002 through April 30, 2003 were reviewed for the purpose of this project. The parameter for the review was all payments made on first party (insured) automobile claims for physical damage to the vehicles. The company standard deductible of $200.00 had to be added back into the indemnity paid to date figure to eliminate records that previously would have fallen below the established minimum dollar amount. Including exceptionally low payment amounts for this particular review would negatively affect the results of the digital analysis. This study focused on finding irregularities in automobile physical damage claim payments amounts, which should not include very low payment amounts. Low dollar amounts would not be excluded in every Benford’s analysis. A high volume of low payments may uncover a potential problem in the processing of transactions. An example would be discovering a vendor that is issued multiple payments per month. It may be financially beneficial to put the vendor on a bulk-payment schedule, or a monthly payment schedule, to avoid the costs of processing multiple payments to them.
Instrumentation The instrumentation employed to provide verification of the results of this research is in the form of “screen prints.” Step-by-step views were captured while conducting the digital analysis using ACL software. The three ACL windows captured by screen-printing are the default view, the command log, and graphs that are created by ACL. The default view within ACL provides a visual of the actual data that is used for the analysis. The data was displayed pre-analysis and post-analysis for each action taken while using ACL. This included the actual Benford’s tests, as well as any preliminary commands needed to prepare the data for review. The command log feature of ACL serves several functions. The command log explains what has been done, and the results of every action taken by the user in a text format. The command log functions as an audit trail so the auditor or investigator can verify the results of his or her data analysis for validation purposes during an investigation. It can also be useful as a set of instructions to save the auditor or investigator time on a subsequent analysis if the analyses are similar. For the purpose of this project, the command log provided the explanation behind the results. The last screen prints included are views of the graphed results of the Benford’s analysis. From the command log within ACL, some of the results can be graphed. In the command log window the user will see a text line stating that the data from a particular analysis is graphable. The user simply double clicks on the text stating this fact, and ACL provides a graph based on the results of the analysis. Providing screen prints of the ACL created graphs will also aid in the understanding of the analysis. Data The data came from reports created using Utica National’s claim transaction database. This database provides information on all disbursements (payments) regarding any claim file. It shows both the indemnity and expense payments related to a claim, depending on what the user is looking for. The IAD usually creates these reports based on broad criteria, and this allows the actual user to filter down the large file into a more manageable one, depending on the scope and intent of their project or assignment. The information needed to complete this project was obtained from routine reports that the IAD can access. The information in these reports has been cleared for use in this project because it contains no personal information regarding insureds, claimants, agents or vendors.
Results When using digital analysis as a tool to analyze data there are typically several steps the user must complete to prepare the data for the actual analysis. The user must first familiarize himself with the data and then validate it. In some cases the user will obtain a more comprehensive report than is needed, and will be responsible for filtering out only the records useful for the unique analysis, in this case, a Benford’s Law analysis. Therefore, there must be an understanding of the original data obtained, and a vision to be able to filter, or “drill down,” to extract only what is needed. Validation can usually be accomplished by visually scanning the data set, or records, to ensure the data obtained is consistent with what is anticipated or expected. Given the importance of the pre-Benford analysis to prepare the data, an explanation of some of the most common commands executed, and screen prints of these ACL commands, are included here to give the reader a visual and textual understanding of how the data was prepared for the actual Benford’s analysis. There are three main windows within ACL that do most of the work. These include the overview window, the default view window and command log window. For the purpose of this project the default view window and the command log window are used to explain the work performed. The default view window shows the data arranged in columns and rows, similar to a spreadsheet. ( Figure 1) The command log window keeps a textual record of the activities performed in ACL. ( Figure 1a) (Using ACL to Apply Benford’s Law, 2001) The original data consisted of first-party automobile physical damage claim payments from UNIG’s RO; it included all payments for the years 2001 and 2002, and through April 30, 2003. First- party, or payment to the insured, automobile physical damage payments consist of collision (1641) and comprehensive (1631) payments. Both expense and indemnity payments were included in the original data set. The result of this report was 13,596 records (Figure 1). This data set had to be filtered for two reasons. First, it contained records, such as expense payments, that were not appropriate for the Benford’s Law analysis. Second, the data set was too large (13,596 records) for the Benford analysis envisioned for this project.
In an effort to become more familiar with the data, two additional ACL commands were performed: the statistics command and the stratify command. Both provide useful information to conduct informal “reasonableness” tests on the data prior to the actual analysis. The information provided allows the user to make an educated decision concerning whether the results of these commands make sense given what the user knows about the data. The statistics command shows the five highest scores, the five lowest scores, and the average score. (Figure 2) The stratify command gives the user the total record count and percent of records within a specified range of numbers. (Figure 3) This type of information can help to focus the user’s analysis to a particular set of numbers, whether it is the range with the most numbers, or the range with the least. Stratify also provides the highest and lowest records encountered. This can pinpoint the outliers, or the numbers that are located outside of the highest and lowest records in the data set.
Once a confidence level that the data in the original data set was ”reasonable,” ased on what was known about the data and what it was expected to look like, b
was reached, the next step was to begin filtering and extracting. The first filter applied to the original data isolated only the records with the Indemnity Paid value of $20,000.00 or less and records with an Issue Date greater than April 1, 2002. This was accomplished in ACL using the expression box to build the filter needed. (Figure 4) Once this filter command was executed, the results were extracted and saved as a separate file, so that a second filter could be performed, as ACL does not allow multiple filters to be performed on the same file unless the results are saved to a separate file. Figure 4. View of expression box showing the Indemnity_Paid filter
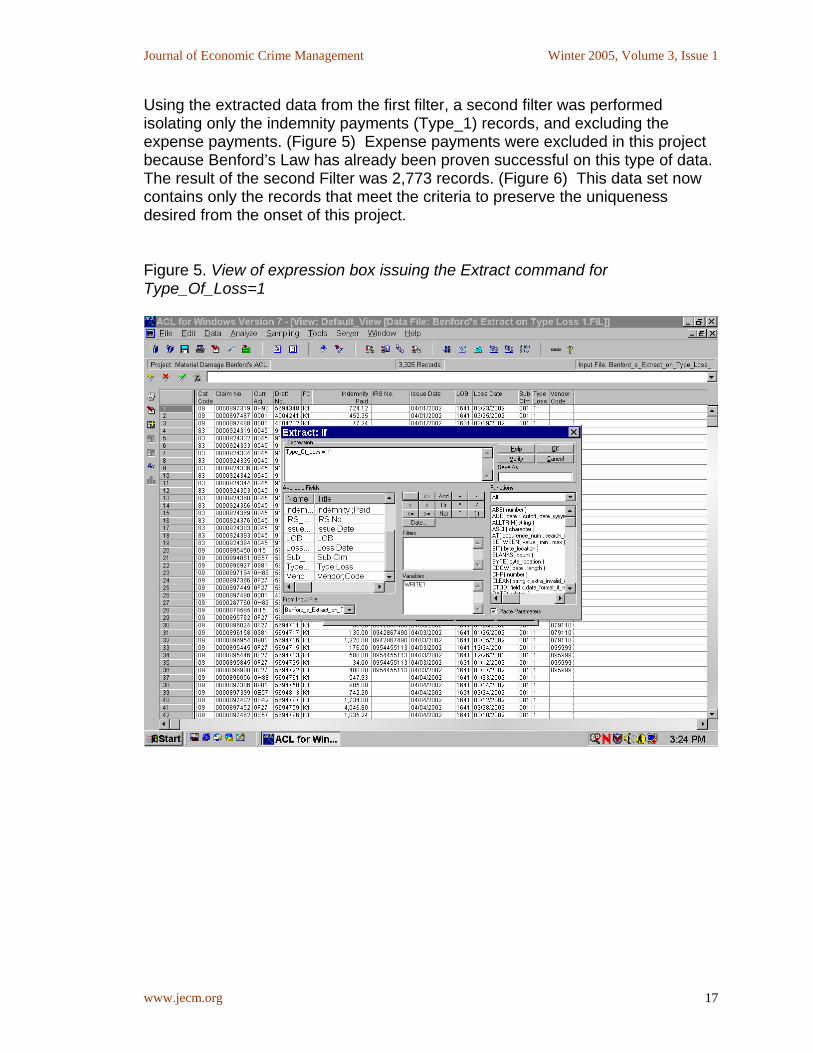
Using the extracted data from the first filter, a second filter was performed isolating only the indemnity payments (Type_1) records, and excluding the expense payments. (Figure 5) Expense payments were excluded in this projecbecause Benford’s Law has already been proven successful on this type of dThe result of the second Filter was 2,773 records. (Figure 6) This data set now contains only the records that meet the criteria to preserve the uniqueness desired from the onset of this project. Figure 5. View of expression box issuing the Extrac
Figure 6. Default_View of final record count to be analyzed using Benford’s
Law
bstacle had to be overcome prior to conducting the Benford’s analysis. The
First, for the purpose of this project it would not be beneficial to include low-ollar figures in the data set for review. Not including the deductibles creates this roblem. In regards to automobile physical damage payments, genuinely low alue amounts may reflect a mis-coded payment for example, which is a valuable nding, but would not be relevant to the ultimate mission of fraud detection. econd, if payments were reviewed with the deductibles removed, this would not e an accurate reflection of the total amount of damage, and would skew the
In an attempt to obtain the correct parameters for the data set, one more onumbers found in the Indemnity Paid column reflect the amount of damage to the ehicles, less the insured’s deductible. This scenario presents two problems. v
results of the Benford’s analysis. Simply, the analysis would not include the total
In order to remedy this, and present the most accurate Benford analysis possible, amount of damage if the deductibles were excluded.
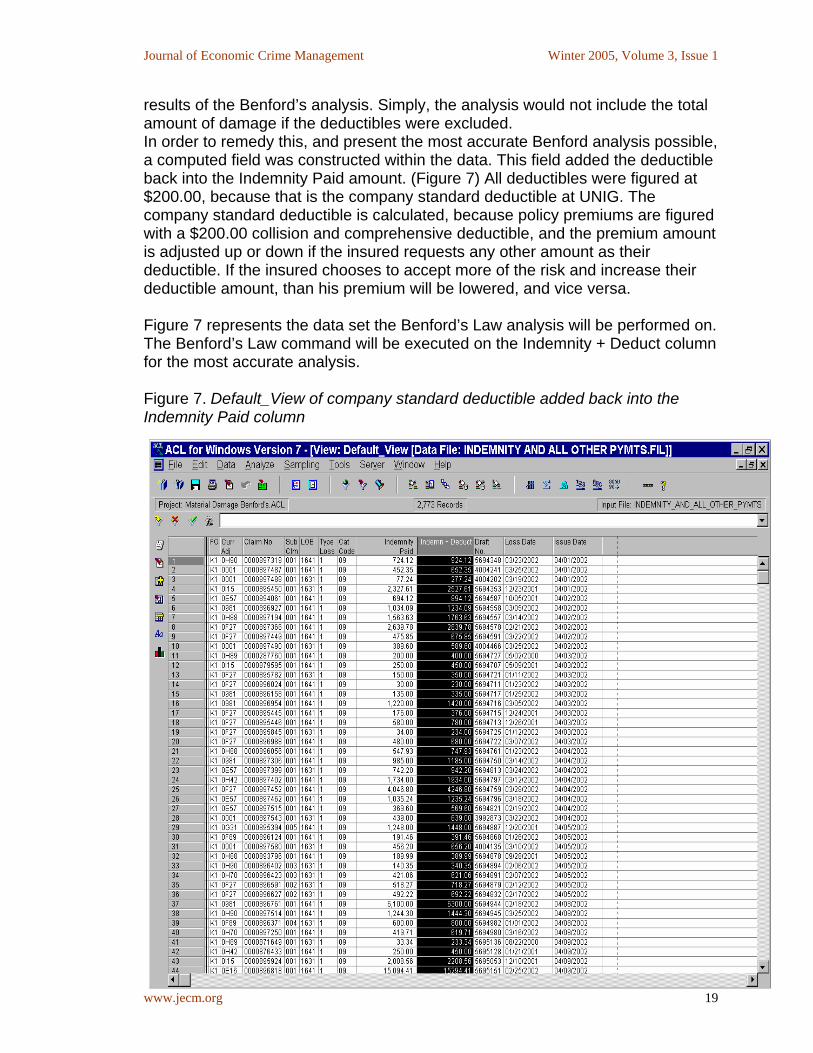
a computed field was constructed within the data. This field added the deductible back into the Indemnity Paid amount. (Figure 7) All deductibles were figured at $200.00, because that is the company standard deductible at UNIG. The company standard deductible is calculated, because policy premiums are figured with a $200.00 collision and comprehensive deductible, and the premium amount is adjusted up or down if the insured requests any other amount as their deductible. If the insured chooses to accept more of the risk and increase their deductible amount, than his premium will be lowered, and vice versa. Figure 7 represents the data set the Benford’s Law analysis will be performed on. The Benford’s Law command will be executed on the Indemnity + Deduct column for the most accurate analysis. Figure 7. Default_View of company standard deductible added back into the Indemnity Paid column
One Leading Digit Analysis The first Benford’s test on the data set was conducted using 1 leading digit, included upper and lower bounds, and executed the command on the Indemnity + Deductible column. (Figure 8) The result of this analysis is displayed in the command log window. (Figure 9) Limiting the Benford’s command to the fidoes not produce an efficient analysis. Using 1 leading digit is considered a high level test (unfocused), and should not be used to select audit targets for follow up. (Nigrini, 2000) Further proof that the first digit analysis is ineffective wapparent when the results of the analysis were reviewed and the author tried to isolate the records the Benford’s command identified as needing furthe
rst digit
as
r review ased on the highest Z-stats. The isolation of the highest Z-stat numbers
31, produced 619 records for review.
st seen in the graph of the first digit analysis results.
(Figure 10) If the data follows the traditional Benford’s Law, that is, the first digit frequencies run in descending order from 1-9, then the user can be comfortable that his data relatively conforms to Benford’s Law. Once that determination is made, the user can then proceed with the more detailed analysis. As seen in Figure 10, the data does appear to conform to Benford’s Law. Therefore, the project can proceed onto the second and final analysis. The Benford’s Law command will be executed using the first 2 leading digits (F2D), including the upper and lower bounds. For several reasons, it was decided to end the project after the first F2D analysis of Benford’s Law. First, to execute analyses beyond the F2D would detract from the understanding of the results. Multiple digit analyses would provide too much information and would create a problem in trying to explain the results effectively. Second, based on a conversation with an expert in the field of Benford’s Law, and the research completed, analyzing the F2Ds using Benford’s Law is the most effective analysis based on the data for this project. (B. Busta, personal communication, August 16, 2003) The reason behind this statement is that the numbers rarely extend beyond 5 places before the decimal. Last, in conjunction with providing too much information, it is important to discuss the further analysis needed to “drill down deeper”’ into the isolated records identified by using Benford’s Law.
bproduced far too many records to review, thus defeating the purpose of using Benford’s Law. For example, the isolation of the records with the leading digit of ‘1’, which showed a Z-stat of 5.9 The first digit test is effective in reasonably determining if the data conforms toBenford’s Law. This is be
Figure 8. View of expression box used to issue the ”‘Benford” command. Analysis of one leading digit was used and “Benford’s” was applied to Indemn_Deduct
Figure 10. Graphed results of the one leading digit Benford’s analysis
wo Leading Digit Analysis
T
sing the Benford command box, the command on the Indemnity + Deductible olumn was issued using the F2D, and including upper and lower bounds.
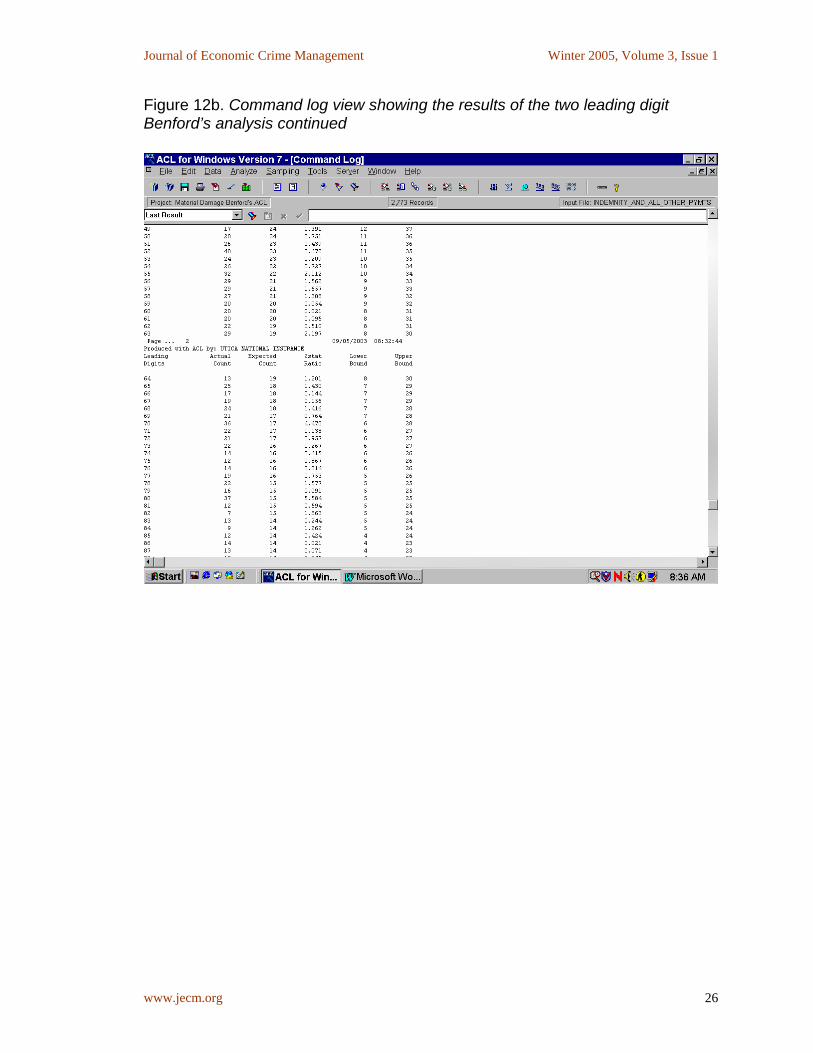
(Figure 11) The result of this analysis can be seen in the command log window. (Figure 12a,b, c) The F2D analysis resul d in six 2-digit numbers with significant Z-stats. All six of them were greater than 3.4. Two out of the six numbers actually fell below the lower bound, and four werbound. Numbers located below the lowenumbers located above the upper bound when attempting to detect fraud. Both of
ese sets of numbers are considered outliers, or significantly higher or lower than the expected upper most or lower most tolerated numbers.
The numbers identified as needing further review by using the Benford’s ommand are as follows: “45,” “52,” “70,” and “80’’ and are located above the
upper bound; “13”’ and “19” are located below the lower bound. The results of the nalysis are displayed in Figure 13.
Uc
te
e significantly higher than the upper r bound can be just as important as
Figure 13. Graphed results of the two leading digit Benford’s analysis
Oanalys
nce the “target groups,” or the 2-digit numbers identified by the Benford is, are determined, the next step is to isolate each 2-digit number into
dividual data sets so further analysis can be conducted. Administering a filter ilter dialogue box (Figure 14) completes
e task of isolating these figures. The LEADING function allows the user to + Deductible), number of leading digits,
nd the specific digits (ex. “45”’) he wants to isolate. After the LEADING function the next logical step is for the user to
xtract the data and save it to a separate file. Saving the isolated data to a ty to perform further analysis, working
ward the ultimate goal of reducing the records to a workable number in order to
inusing the LEADING function within the fthdetermine what variable (ex. Indemnity ais run and the wanted records are isolated, eseparate file affords the user the abilitoidentify fraudulent transactions.
The F2D analysis provided more useful “target groups” than the 1-digit analysis. The six “target group” numbers that were isolated into individual data sets ranged
data sets re much more manageable for a review, they still need more filtering. If all of the
ies.
0% of t
from a low record count of 36 records, to a high of 62. Although these arecords identified by the Benford’s analysis were reviewed, the amount would be 273 records; a number too cumbersome to review efficiently. Figure 14. Expression box showing the filter used to extract the target group having ”‘45”’ as the two leading digits
Post-Benford’s Analysis It is not enough to identify specific data sets of records that show the anomalFurther analysis has to be conducted on those records in order to assess their value in the overall fraud detection process. Further analysis is also necessary to reduce the number of records in the target groups. The Benford’s analysis was able to reduce the number of records from 2,773 to 273, or approximately 1the analyzed data set. The 273 records were extracted into six different targe
groups based on the leading 2-digits. At this point, the individual target groups are ready for further review. Although reviewing 273 records is much better than 2,773 records, in the scope of reviewing automobile physical damage insurance claim files, it is still almost impossible to review 273 files thoroughly and in an acceptable timeframe. Therefore, the user must visually inspect the target group data and decide what further analysis is needed to obtain only the important or suspect records. The
rther analysis conducted will be subjective in nature. Based on his intent and
The post-Benford’s analysis was somewhat disappointing. It revealed some
ith the 2 leading digits of “45” showed 30 out of 52 records being exactly 50.00. Exact dollar amount in automobile physical damage claim payments,
s, are rare, especially in the volume that was present in ese three groups of numbers. However, further review of the records with the
fuperceptions, the user will determine the most effective analysis.
additional shortcomings related to deploying the Benford’s Law analysis on the data chosen for this project. Some form of further analysis was performed on each target group (Leading 2-digits of “13,” “19,” “45,” “52,” “70,” and “80”) identified by the Benford’s Law analysis. Although 273 records in total were isolated for further review, a spot-check of the records identified by the further analysis resulted in no significant findings. It is important to reiterate that not all records were reviewed and suspect or fraudulent transactions may be residing in the data that was not reviewed, and therefore may remain undetected. The first test conducted was to filter transactions by the current adjuster code and review the amount of payments made by that adjuster. The theory behind this analysis was to detect adjusters that may be making the majority of payments just below their authority level, or splitting large payments to ensure they fall below their authority level. If the payments are below the adjuster’s authority level, the adjuster does not need a supervisor’s approval to make the payment, and has a much better chance of hiding a fraudulent payment. This review did not reveal any significant findings. The majority of transactions reviewed were well below the authority level of the adjuster making the payment, and the transactions that were above the adjuster’s authority had the proper authorization. Splitting of payments to avoid supervisor approval was also not found. Three of the six target groups showed excessive records that contained exact dollar amounts. For example, the target group with the 2 leading digits of “80” showed 20 out of 26 records being 800.00. The target group with the 2 leading digits of “70” showed 20 out of 36 records being 700.00, and the target group w4other than total loss claimthexact dollar amounts showed a major shortcoming in the data that was being reviewed.
The records within the target groups with the 2 leading digits of “45” and “70” should have not been in those groups in the first place. These transactions werthe reimbursement of the insured’s deductible as a result of subrogation. (Subrogation is the process w
e
here an insured uses their own physical damage overage to pay for damage to the insured vehicle, even though another party is
get
cessful in
covering the money from the at-fault party, the insured is issued their
set. l
nother integrity problem that was overlooked when setting the criteria and n
igger a
.
ble t. These transactions were placed
an incorrect target group because of the deductible scenario, but more
om the above mentioned three targets ould most likely still have caused anomalies during the Benford’s Law analysis,
e t-y
damage to the insured vehicle. This additional damaged was not noted on the
cat fault for the loss.) Therefore, adding the company standard deductible back into the initial transaction is incorrect. By adding the company standard $200.00deductible to the payments made, the records were actually moved to a targroup in which they did not belong. The 2 leading digits of “45” should have actually been “25,” and so forth. The company then attempts to collect, or subrogate, the at-fault party to recoup the money they paid to repair the insuredvehicle, along with the insured’s deductible. If the company is sucredeductible back based on the amount and percentage of recovery. The transactions identified in these two groups were a result of successful subrogation. In addition, the subrogation issue creates an integrity problem within the dataIn short, the transactions in the two groups were not actually first party physicadamage payments and should not be included in the data set for this project based on the criteria chosen for the records to review. Achoosing the records for review was found in relation to the records residing inthe target group with 2 leading digits of “80.” Twenty out of twenty-six records ithis target group were exactly 800.00, which was suspicious enough to trcloser look. As it turns out, these records were the result of rental car expensesthat were paid on behalf of the insureds while their vehicles were in for repairThe actual payment amounts were 600.00, which is the maximum amount of therental coverage, but they became 800.00 when the company standard deductiwas mistakenly added into the payment amouninimportantly, should have not been reviewed because they are not physical damage payments. To restate the obvious, the transactions frwbut at different 2 leading digit numbers (“25” instead of “45,” etc.). None of thestransactions should have been included in the review because they are not firsparty automobile physical damage payments. This problem was unanticipated bthe author, and not easily overcome. The entire further analysis and spot checking records that were identified as target groups resulted in one record, or claim file, that may be suspicious. The claim file contained a large supplement (additional payment) for additional
original appraisal, and therefore, the legitimacy of the payment becomes questionable. The adjuster did not identify whom the supplement was sent by,
titled
some
nt cted data,
confident that the data set remaining after all of the pre-analysis ork was complete, was as close to the ideal data set as possible, with no
ave author for this project.
hese payments are both made under the collision (1641) and comprehensive not
at fact, and
to remove the company standard deductible from these ansactions. Removing the deductible amounts from these transactions would
nford’s analysis identifies target groups quiring further review, but does not eliminate the need for multiple individual
y. t
body shop or insured, and the insured stated that they sold the vehicle to a dealership after the accident before any repairs were completed. In this case, neither the insured nor the dealership that bought the insured vehicle is ento any additional payment. The combination of unsupported supplement and thevehicle being sold prior to repair certainly brings this file into an unfavorable light. Discussion Although the results of this research were not as successful as anticipated,very valuable lessons were learned regarding the use of digital analysis to reviewfirst-party automobile physical damage claim payments. Truly “knowing” the data intended for review is probably the most importalessoned learned. Prior to deploying the Benford’s analysis on the selethe author waswextraneous data. As it turns out, that was not the case. Deductible reimbursements, as a result of subrogation efforts, and rental reimbursement payments were both included in the review. Neither of these records should hbeen reviewed based on the criteria established by the T(1631) lines of business, which were part of the criteria, and therefore, were filtered out during the pre-analysis work. The reason that they are paid under these lines of business is that they both result from an automobile physical damage claim. The subrogation recoveries are due to reimbursement from the at-fault party involved in an accident, and the rental car payments are made based on temporary transportation needed by the insured while their vehicle is being repaired after an accident. The best way to handle this problem is to spot-check the exact dollar amount payments to ensure they are a result of one of these two problems, note thand move forward with the review. It would be too difficult, time consuming,not important enoughtronly move the records to the correct first 2-digit groups and show anomalies within those groups, but would not provide substantial benefit to the analysis. Another significant lesson learned is that using Benford’s Law on first-party automobile physical damage claim payments does not provide an outcome as specific as the author anticipated. A Bereclaim file reviews to prove or disprove the presence of fraudulent claim activitThe author was hopeful that the samples identified by the analysis would consis
of smaller, more manageable data sets than the sets that resulted. TherefoBenford’s analysis did not limit individual claim file reviews to the extent expected. The strength in conducting the Benford analysis was demonstrated by its abto reduce the number of records in the original data set from 2,773 to 273 identified as needing further review. The ability of reducing the sample size by a focused, analytical analysis using Benford’s Law could be crucial to an effective audit or investigation. Some of the more common ways used to decrease sample
re, the
ility
ize would include: random sampling using a pre-determined number of records, stricting the time-frame of the review, or setting dollar amounts on the records
d. All of these tools may be effective in reducing the number of cords in a sample, but Benford’s Law accomplishes the reduction in records by
elevant way to reduce ample size.
the s had to be
o
it w
re e
remely time consuming, it is necessary to btain accurate results.
the ”
sults would help to focus the analysis to an individual or office. (B.
m
sreto be reviewereisolating irregularities in the data. In essence, Benford’s Law reduces sample size by identifying records that are suspicious because of their irregularities compared to the rest of the data, which provides a more rs The other advantage of this project is the knowledge that was gained regarding the complexity involved when conducting a digital analysis. The analysis on the selected data did not conclude with the deployment of Benford’s Law. After Benford’s analysis was complete, the records identified as anomalieextracted to individual files based on the leading 2-digits in order to perform filters on that data. Next, for the further analysis portion, the data had to be filtered by adjuster code to detect any suspicious patterns or problems per individual adjuster regarding claim payments. Then, the adjuster’s authority level needed tbe verified. This was necessary because if the adjuster was suspected of makingpayments just below this level to avoid a supervisory review of the payments, could be proven. Last, if a potential problem arose, it was necessary to reviethe individual claim file remarks and documentation to finalize the investigation. As this example shows, a digital analysis consists of multiple steps both befodeploying the actual type of analysis chosen and after the analysis. While the prand post analysis work can be exto Having said that, more detailed work within the target groups identified by the Benford’s analysis may have been advantageous to the fraud detection mission of this project. Common characteristics within a target group could uncover suspect activity or improper claim handling. A generic example of this type of activity would be if a particular adjuster, or office, proved to be responsible formajority of payments related to one of the target groups identified. This “paringdown of the reBusta, personal communication, October, 3 2003) This research provides a good starting point for a company looking for a uniquetool to assist with the automation of their automobile, or possibly any other, clai
file review for possible fraudulent activity. The criteria chosen to obtain the data set is certainly not the only criteria that can be implemented when using Benford’s Law. As a matter of fact, the challenges encountered relating to subrogation reimbursements, and rental car reimbursements may have pthat first-pa
roven rty automobile insurance claim payments are among the least
ffective records to use when implementing Benford’s Law.
bile
gh
ly will appear as target payments when actually they are not.
.
d at Utica National.
e Additional areas of insurance claim payments, other than first-party automophysical damage, should be researched to determine the effectiveness of using Benford’s Law to identify number irregularities and ultimately fraudulent claim activity. This project proved that Benford’s Law identified number irregularities in the data set analyzed, and therefore, the law may be as applicable, if not more so, to other areas of insurance claim payments. To conclude, the advantage of utilizing Benford’s Law is that it provides an expected distribution to make a comparison to with the selected data. The problems associated with reviewing the selected data are policy limits and hinumbers of duplication with payments such as rental or tow payments that, if coded incorrect
Busta, B. & Weinberg, R. (1998). Using Benford’s Law and Neural Networks as a
Review Procedure.
Nigrini, M.J. (2002). An Assessment of the Change in the Incidence of EarnManagement After the Enron/Andersen Episode. Retrieved May 29, 2003from http://www.nigrini.com/images/VersionForNigriniCom.html
ings ,
igrini, M.J. (2000). Digital Analysis Using Benford’s Law. Tests & Statistics for NAuditors. Vancouver, BC: Global Audit Publications.