Bentham Wholesale Syndicated Loan Fund Annual fund profile – 30 June 2014 Page 1 of 4 Investment style The Bentham Wholesale Syndicated Loan Fund (the Fund) is actively managed and focused on generating stable investment income. The Fund provides investors diversified exposure to the global syndicated loan market, with an active allocation to investments in different industries, issuers and geographies. Investment objective The Fund aims to achieve investment returns above the Credit Suisse Leveraged Loan Index over the suggested investment time frame. The Fund’s investment performance is also compared with the Bloomberg AusBond Bank Bill Index. Primarily investing in the US syndicated loan market, the Fund seeks to add value through loan and security selection and industry rotation, while maintaining a highly diversified portfolio. The Fund will be as close to fully currency hedged into AUD as is practicable. A NZD hedged equivalent of the Fund is also available. Management team Bentham is a specialist fixed interest and credit investment manager. Bentham actively manages a number of high yielding funds with varying risk profiles. The portfolios are designed to generate income while diversifying risk in global credit markets. Bentham’s goal is to deliver higher income to investors than can generally be achieved in traditional fixed interest and equity markets. Prior to the establishment of Bentham, the founders worked together as part of the Credit Investments Group of Credit Suisse Alternative Capital Inc, which continues to provide exclusive sub‑advisory investment management services for the Fund. Bentham has seven investment staff located in Australia and the Credit Investments Group has 28 investment staff based in New York and London. The Australian team have a strong track record of managing global diversified fixed interest portfolios and are well resourced with market leading risk portfolio systems. Fund facts Fund name Bentham Wholesale Syndicated Loan Fund Investment Manager Bentham Asset Management Responsible Entity Fidante Partners Services Limited Fund aim To provide investors with a diversified exposure to the global syndicated loan market with an active allocation to investments in different industries, issuers and geographies Portfolio managers Tom Flannery and Richard Quin Inception date 16 August 2004 APIR code CSA0046AU Fund size AUD3,090 million as at 30 June 2014 Ongoing costs* 0.84% Buy/sell spread +0.40%/–0.40% (reviewed periodically) Entry and exit fees Nil Pricing frequency Daily unit pricing Initial investment A$10,000 minimum Other classes NZD hedged equivalent available ASX mFund ASX Class available via mFund code BAM02 * Inclusive of management fee and estimated reimbursable expenses (%p.a.) Fund features • Access to senior secured syndicated loans which are not generally available to direct retail investors • Monthly income distributions • High running yield with low interest rate risk • Australian domiciled trust with a 10 year track record • Loans are valued to market prices daily – with daily unit pricing • Access to a global investment universe.
Transcript
Bentham Wholesale SyndicatedLoan Fund
Annual fund profile – 30 June 2014
Page 1 of 4
Investment styleThe Bentham Wholesale Syndicated Loan Fund (the Fund) is actively managed and focused on generating stable investment income.
The Fund provides investors diversified exposure to the global syndicated loan market, with an active allocation to investments in different industries, issuers and geographies.
Investment objectiveThe Fund aims to achieve investment returns above the Credit Suisse Leveraged Loan Index over the suggested investment time frame. The Fund’s investment performance is also compared with the Bloomberg AusBond Bank Bill Index.
Primarily investing in the US syndicated loan market, the Fund seeks to add value through loan and security selection and industry rotation, while maintaining a highly diversified portfolio.
The Fund will be as close to fully currency hedged into AUD as is practicable. A NZD hedged equivalent of the Fund is also available.
Management teamBentham is a specialist fixed interest and credit investment manager. Bentham actively manages a number of high yielding funds with varying risk profiles. The portfolios are designed to generate income while diversifying risk in global credit markets. Bentham’s goal is to deliver higher income to investors than can generally be achieved in traditional fixed interest and equity markets.
Prior to the establishment of Bentham, the founders worked together as part of the Credit Investments Group of Credit Suisse Alternative Capital Inc, which continues to provide exclusive sub‑advisory investment management services for the Fund.
Bentham has seven investment staff located in Australia and the Credit Investments Group has 28 investment staff based in New York and London. The Australian team have a strong track record of managing global diversified fixed interest portfolios and are well resourced with market leading risk portfolio systems.
Fund factsFund name Bentham Wholesale Syndicated Loan Fund
Fund aim To provide investors with a diversified exposure to the global syndicated loan market with an active allocation to investments in different industries, issuers and geographies
* Calculated as the CPU distribution at month end divided by the ex‑distribution NAV at the start of the month. Past distributions are no indication of future distributions. **Annual distribution return = Fund total return minus growth return. Total returns are calculated using pre‑distribution month end withdrawal unit price and assumes all income is reinvested in additional units. Growth returns equals the percentage change in the unit price.
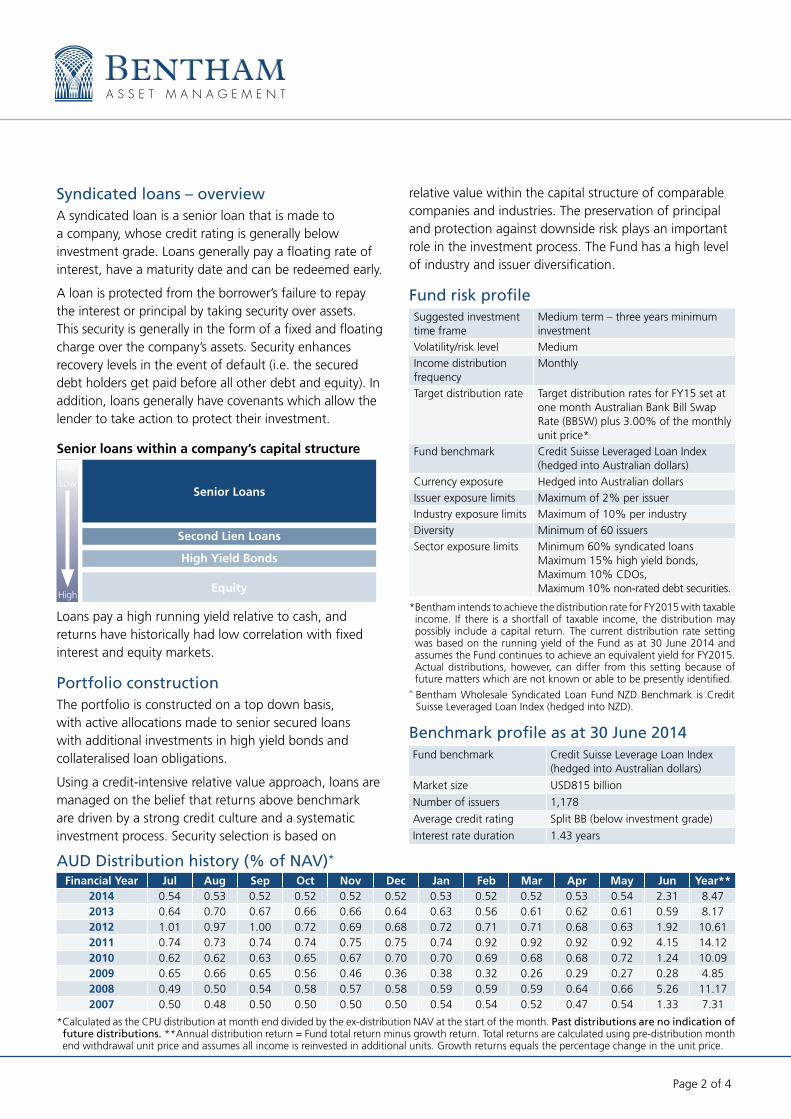
Syndicated loans – overviewA syndicated loan is a senior loan that is made to a company, whose credit rating is generally below investment grade. Loans generally pay a floating rate of interest, have a maturity date and can be redeemed early.
A loan is protected from the borrower’s failure to repay the interest or principal by taking security over assets. This security is generally in the form of a fixed and floating charge over the company’s assets. Security enhances recovery levels in the event of default (i.e. the secured debt holders get paid before all other debt and equity). In addition, loans generally have covenants which allow the lender to take action to protect their investment.
Senior loans within a company’s capital structure
Senior Loans
Second Lien Loans
High Yield Bonds
Equity
Risk
Low
High
Loans pay a high running yield relative to cash, and returns have historically had low correlation with fixed interest and equity markets.
Portfolio constructionThe portfolio is constructed on a top down basis, with active allocations made to senior secured loans with additional investments in high yield bonds and collateralised loan obligations.
Using a credit‑intensive relative value approach, loans are managed on the belief that returns above benchmark are driven by a strong credit culture and a systematic investment process. Security selection is based on
relative value within the capital structure of comparable companies and industries. The preservation of principal and protection against downside risk plays an important role in the investment process. The Fund has a high level of industry and issuer diversification.
Fund risk profileSuggested investment time frame
Medium term – three years minimum investment
Volatility/risk level Medium
Income distribution frequency
Monthly
Target distribution rate Target distribution rates for FY15 set at one month Australian Bank Bill Swap Rate (BBSW) plus 3.00% of the monthly unit price*
Fund benchmark Credit Suisse Leveraged Loan Index (hedged into Australian dollars)
Currency exposure Hedged into Australian dollars
Issuer exposure limits Maximum of 2% per issuer
Industry exposure limits Maximum of 10% per industry
Diversity Minimum of 60 issuers
Sector exposure limits Minimum 60% syndicated loansMaximum 15% high yield bonds, Maximum 10% CDOs,Maximum 10% non‑rated debt securities.
* Bentham intends to achieve the distribution rate for FY2015 with taxable income. If there is a shortfall of taxable income, the distribution may possibly include a capital return. The current distribution rate setting was based on the running yield of the Fund as at 30 June 2014 and assumes the Fund continues to achieve an equivalent yield for FY2015. Actual distributions, however, can differ from this setting because of future matters which are not known or able to be presently identified.
^ Bentham Wholesale Syndicated Loan Fund NZD Benchmark is Credit Suisse Leveraged Loan Index (hedged into NZD).
Benchmark profile as at 30 June 2014Fund benchmark Credit Suisse Leverage Loan Index
(hedged into Australian dollars)
Market size USD815 billion
Number of issuers 1,178
Average credit rating Split BB (below investment grade)
Interest rate duration 1.43 years
Page 3 of 4
Long-term correlation of asset class returns#^
Loans as an asset class have historically had a low correlation to equities and a negative correlation to government bonds as shown in the table below. An allocation to loans may improve the diversity of a balanced portfolio and has historically improved the risk and return outcome.
1 January 1992 to 30 June 2014
Australian
Bank Bills
Global Govt
Bonds
Australian Fixed
Interest
Australian ILBs
US IG Corporates
US Leveraged
Loans
US High Yield
World Equities
(Unhedged)
Australian Equities
US Preferred Securities
Emerging Market Bonds
Australian Property
Australian Bank Bills 1.00 0.20 0.29 0.16 –0.05 –0.24 –0.18 –0.06 –0.10 –0.09 0.01 –0.11
Australian Property –0.11 0.14 0.21 0.24 0.36 0.41 0.42 0.36 0.59 0.17 0.38 1.00 # Period of years: 22.5 to 30‑6‑2014. Past performance is no indication of future performance.
Risk and returnLoans have historically generated returns above the BBSW over the medium to long term. Syndicated loans as an asset class typically have a level of intermediate risk as characterised in the risk return chart below. For specific and current return data please refer to the current monthly fact sheets or quarterly commentaries.
0% 2.5% 5% 7.5% 10% 12.5% 15%
2%
4%
6%
8%
10%
12%
14%
Historical returns versus historical risk (as at 30 June 2014)^
Historical standard deviation of returns (22.5 to 30 June 2014)
His
toric
al a
nnua
l ret
urn
Emerging MarketBonds
AustralianEquities
AustralianProperty Trusts
Australian Bank Bills
Australian Inflation
AustralianFixed Interest
GlobalGovt Bonds
US High Yield Bonds
US IG Corporates
US Syndicated Loans
Australian ILBs
Intermediate risk High riskLow risk
Historical volatility of returns (22.5 to 30 June 2014)
Prospective yield versus historical risk (as at 30 June 2014)^*
0% 2.5% 5% 7.5% 10% 12.5% 15%
2%
4%
6%
8%
10%
12%
14%
Pros
pect
ive
yiel
d to
mat
urity
Emerging MarketBonds
Australian Equities
AustralianProperty Trusts
World Equities(Unhedged AUD)
US Preferred Hybrid Securities
AustralianBank Bills Australian
Fixed Interest
GlobalGovt Bonds
US IG Corporate Bonds
Australian ILBs
Intermediate risk High riskLow risk
World Equities(Unhedged AUD)
US Preferred Hybrid Securities
US High Yield Bonds
US SyndicatedLoans
0% 2.5% 5% 7.5% 10% 12.5% 15%
2%
4%
6%
8%
10%
12%
14%
Historical returns versus historical risk (as at 30 June 2014)^
Historical standard deviation of returns (22.5 to 30 June 2014)
His
toric
al a
nnua
l ret
urn
Emerging MarketBonds
AustralianEquities
AustralianProperty Trusts
Australian Bank Bills
Australian Inflation
AustralianFixed Interest
GlobalGovt Bonds
US High Yield Bonds
US IG Corporates
US Syndicated Loans
Australian ILBs
Intermediate risk High riskLow risk
Historical volatility of returns (22.5 to 30 June 2014)
Prospective yield versus historical risk (as at 30 June 2014)^*
0% 2.5% 5% 7.5% 10% 12.5% 15%
2%
4%
6%
8%
10%
12%
14%
Pros
pect
ive
yiel
d to
mat
urity
Emerging MarketBonds
Australian Equities
AustralianProperty Trusts
World Equities(Unhedged AUD)
US Preferred Hybrid Securities
AustralianBank Bills Australian
Fixed Interest
GlobalGovt Bonds
US IG Corporate Bonds
Australian ILBs
Intermediate risk High riskLow risk
World Equities(Unhedged AUD)
US Preferred Hybrid Securities
US High Yield Bonds
US SyndicatedLoans
^ Sources: Barclay’s Capital, Bentham, Bloomberg, BoA Merrill Lynch, Credit Suisse, JP Morgan, Morgan Stanley and UBS. Overseas returns (except World Equities) are fully hedged into Australian dollars. US Preferred Securities return data is only available from Feb‑1997.
* Prospective fixed interest yields are hedged into AUD assuming an estimated duration matched interest rate differential. The Australian Equities and World Equities (unhedged) yields represent the Bloomberg estimated earnings yield. For the prospective equity yield we have used the earnings yield and added an additional 2.5% growth (roughly equivalent to GDP). The earning yield ratio is the inverse of the price‑to‑earnings ratio. The historical standard deviation shown for these equity asset classes is based on the total return for the relevant index. Actual returns will comprise of both income and capital movements and as a result could vary substantially from those shown above. The outcomes shown above may be affected by known or unknown risks and uncertainties that cannot presently be identified. Accordingly actual outcomes may differ from those shown above. Past performance is not a reliable indicator of future performance.
Asset Class definitions; Australian Cash is Bloomberg AusBond Bank Bill Index, Global Govt Bonds is JP Morgan GBI, Australian Fixed Interest is Bloomberg AusBond Composite Bond Index, US IG Corporates is Barclay’s US Corporates, US Leveraged Loans is Credit Suisse Leveraged Loans Index, US High Yield Bonds is Credit Suisse High Yield Bond Index, World Equities (Unhedged) is Morgan Stanley MSCI Index (Developed), Australian Equities is S&P/ASX200 Accumulation Index, US Hybrid Securities is Merrill Lynch BoA Preferred Hybrids Index, Emerging Market Bonds is JP Morgan EMBI+, and Australian Property Trusts is S&P/ASX200 Accumulation A‑REIT Index. Overseas index returns (except World Equities) are fully hedged into Australian dollars.
Page 4 of 4
1769
1/C
G93
8/11
14
Morningstar Awards 2014 (c). Morningstar, Inc. All Rights Reserved. Awarded to Bentham Asset Management for Fixed Interest Category Winner in the Morningstar Awards 2014.
The Professional Planner | Zenith Fund Awards are determined using proprietary methodologies. Fund Awards and ratings are solely statements of opinion and do not represent recommendations to purchase, hold, or sell any securities or make any other investment decisions. Ratings are subject to change.
The Zenith Investment Partners (‘Zenith’) Australian Financial Services License No. 226872 rating (assigned February 2014) referred to in this document is limited to ‘General Advice’ (as defined by the Corporations Act 2001) for Wholesale clients only. This advice has been prepared without taking into account the objectives, financial situation or needs of any individual. It is not a specific recommendation to purchase, sell or hold the relevant product(s). Investors should seek independent financial advice before making an investment decision and should consider the appropriateness of this advice in light of their own objectives, financial situation and needs. Investors should obtain a copy of, and consider the PDS or offer document before making any decision and refer to the full Zenith Product Assessment available on the Zenith website. Zenith usually charges the product issuer, fund manager or a related party to conduct Product Assessments. Full details regarding Zenith’s methodology, ratings definitions and regulatory compliance are available on our Product Assessment’s and at http://www.zenithpartners.com.au/RegulatoryGuidelines
The information in this document is current as at October 2014 unless otherwise specified and is provided by Fidante Partners Services Limited ABN 44 119 605 373 and AFSL No. 320 505. Fidante Partners is the responsible entity and issuer of interests in the Bentham Wholesale Syndicated Loan Fund ARSN 110 077 159 (Fund). Fidante Partners Limited ABN 94 002 835 592 and AFSL No. 234 668 (Fidante Partners) is the responsible entity of and issuer of interests in the Bentham Wholesale Syndicated Loan Fund NZD ARSN 165 696 300. This information is intended as general information only and not as financial product advice and has been prepared without taking into account any person’s objectives, financial situation or needs. Because of this each person should, before acting on any such information, consider its appropriateness, having regard to their objectives, financial situation and needs. Each person should also obtain a copy of the product disclosure statement (PDS) and any additional information brochure (AIB) and consider the information in those documents (including the information about risks) before making any investment decisions. If you acquire or hold an investment in the Fund we will receive the fees and other benefits disclosed in the PDS and any AIB for the Fund. We and our employees do not receive any specific remuneration for any advice provided to you. However, financial advisers may receive fees or commissions if they provide advice to you or arrange for you to invest in the Fund. Some or all of the Fidante Partners related companies and their directors may benefit from fees, commissions and other benefits received by another Fidante Partners related company. Neither Fidante Partners nor any related party of Fidante Partners nor any investment manager nor any sub‑adviser guarantees the repayment of your capital or the performance of the Fund or any particular taxation consequence of investing. Past performance is not a reliable indicator of future performance. A copy of the PDS and any AIB can be obtained from your financial adviser, our Investor Services team on 13 51 53 or on our website: www.fidante.com.au.
Fidante PartnersFidante Partners Services Limited is the responsible entity of the Fund and issues units in it. Fidante Partners has appointed Bentham Asset Management Pty Limited as the Fund’s investment manager. A related entity of Fidante Partners holds a partial equity stake in Bentham.