23
Benthic Analysis: Mr. Ingle’s Pond X Group Tarah Johnson McClure Tosch Stephen Wells Lance Keller
| Date post: | 19-Dec-2015 |
| Category: |
Documents |
| View: | 220 times |
| Download: | 1 times |

Benthic Analysis: Mr. Ingle’s Pond
X GroupTarah JohnsonMcClure ToschStephen WellsLance Keller

Overview
• Objectives
• Study Area
• Materials & Methods
• Results
• Conclusions
• Summary
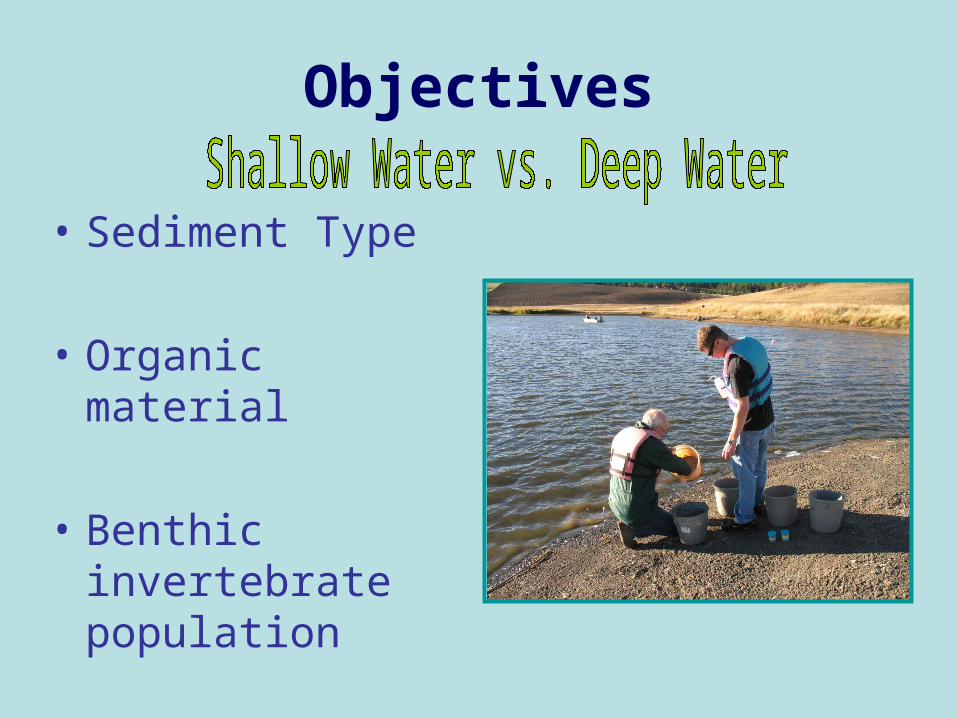
Objectives
• Sediment Type
• Organic material
• Benthic invertebrate population

Study Area
• Deep: 9’2”• Shallow: 3’ 5”

Methods
• Assessment was split into two parts:
– Benthic sampling for macro invertebrates
• Eckman Dredge• 15 cm x 15 cm
– Weight sampling for sediment loading and organic concentration
• KB corer• 2 inches in diameter

Methods
• Both assessments were taken in triplicate totaling 6 samples each– Deep
• 3 Eckman Dredge samples• 3 Core samples
– Shallow• 3 Eckman Dredge samples• 3 Core samples
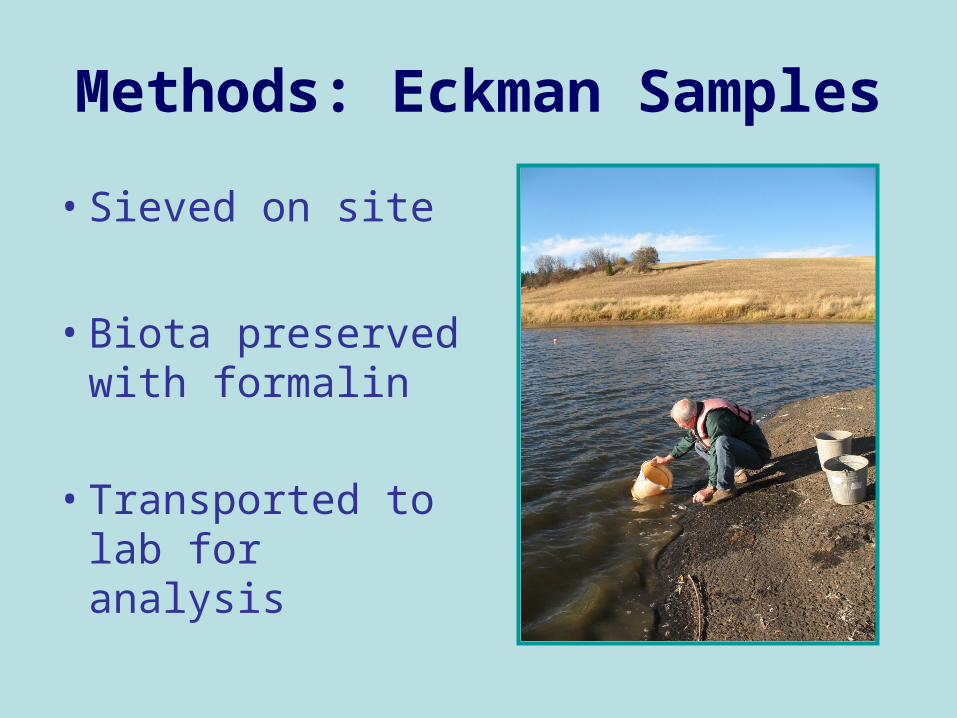
Methods: Eckman Samples
• Sieved on site
• Biota preserved with formalin
• Transported to lab for analysis

Methods: Eckman Samples
• Filtered to wash off formalin– 80 micrometer (μm) sieve
• Large samples– Sub-sampled when needed
• Observed under dissecting scope – Counted and identified to family
• T-test and an ANOVA – Difference in count and composition

Methods: Core Samples
• Core samples were sectioned on site
– 2cm sub-sample to 10cm
• Wet weight– Crucible weight
(zeroed out)– Crucible +
sediment sample
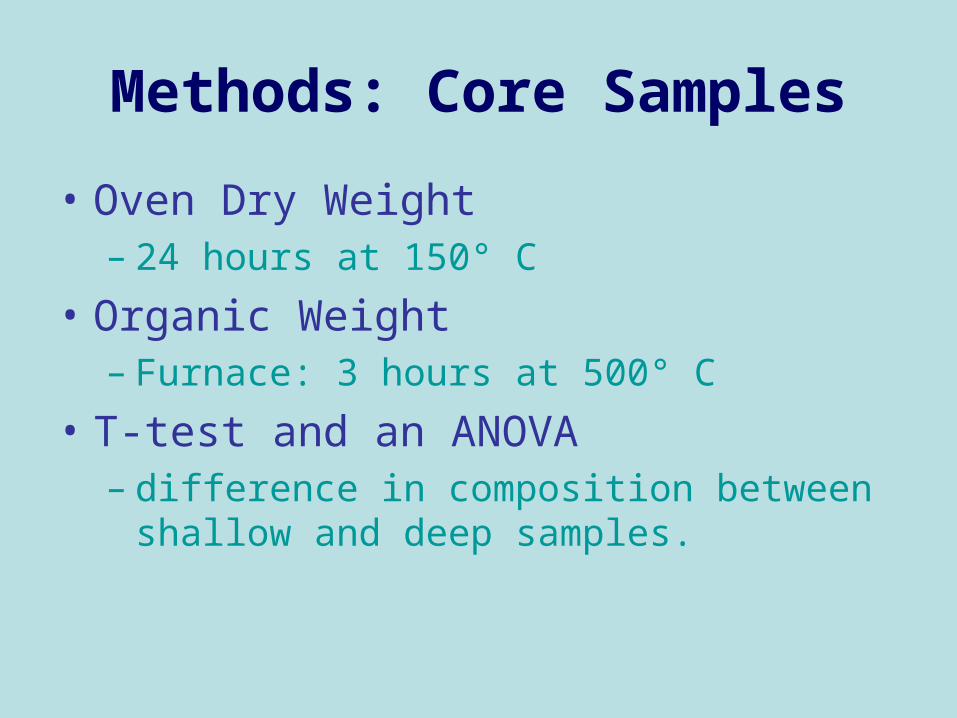
Methods: Core Samples
• Oven Dry Weight– 24 hours at 150° C
• Organic Weight– Furnace: 3 hours at 500° C
• T-test and an ANOVA – difference in composition between shallow
and deep samples.

Results: Profiles
0
0.5
1
1.5
2
2.5
0 5 10 15 20
Temperature (°C); O2 (mg/L); pH
Dept
h (m
)
h
Temp (°C)02 pH
0
0.5
1
1.5
2
2.5
0 200 400 600 800 1000
Light (µmol/m2/s)
Dept
h (m
)
(m)
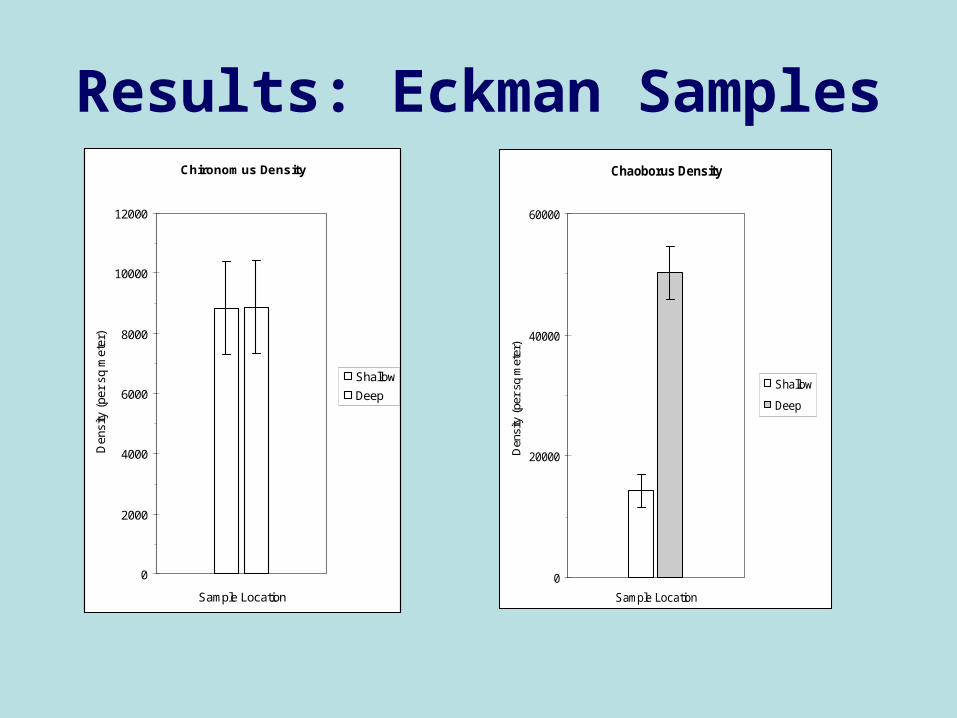
Results: Eckman SamplesChironomus Density
0
2000
4000
6000
8000
10000
12000
Sample Location
Den
sity
(pe
r sq
met
er)
Shallow
Deep
Chaoborus Density
0
20000
40000
60000
Sample Location
Den
sity
(pe
r sq
met
er)
Shallow
Deep

Results: Eckman Samples
• Greater Diversity in shallow samples
• Shallow samples were more even distributed
• Shallow samples had more taxa
Shannon's Diversity Index (log 10)
0.0
0.1
0.2
0.3
0.4
0.5
Sample Location
Sha
nnon
's H
'
Shallow
Deep

Results: Eckman Samples
• Major Taxa Found
- Chaoboridae
- Chironomus
• Minor Taxa Found
- Ceratopogonidae
- Oligochaeta

Results: Core Samples
0
2
4
6
8
10
12
40 50 60 70 80 90
Percent Moisture
Mea
n D
epth
in c
m
Shallow
Deep
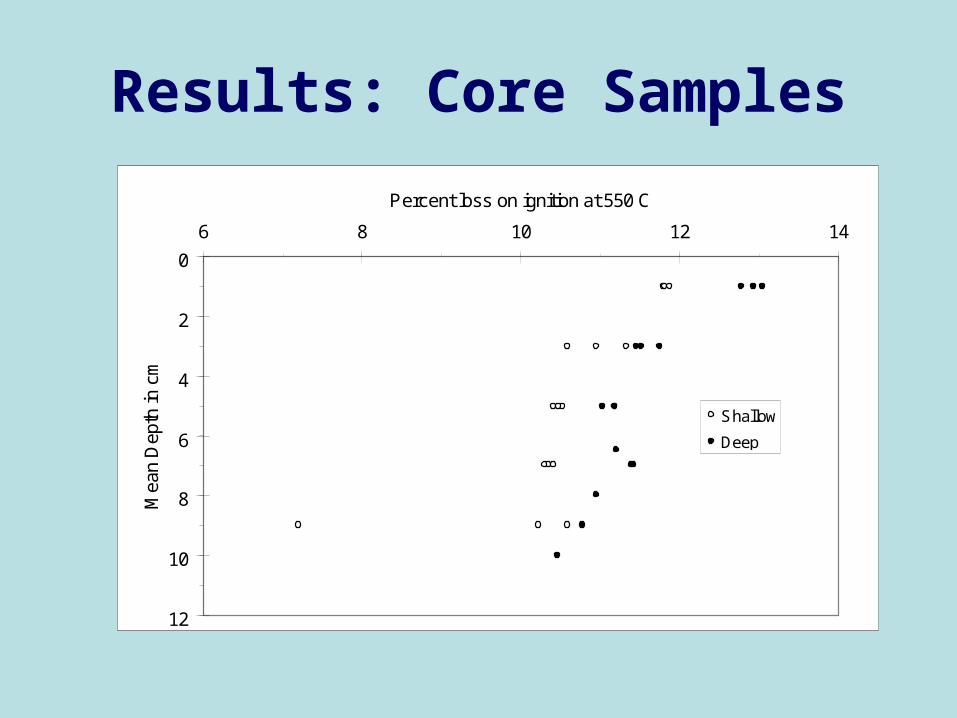
Results: Core Samples
0
2
4
6
8
10
12
6 8 10 12 14
Percent loss on ignition at 550 C
Mea
n D
epth
in c
m
Shallow
Deep

Results: Core Samples
• There was no difference in moisture content
• There was a difference in percent organic
• The sediment is mainly composed of silt

Conclusions
• Fish feed on Chaoboridae and Chironomus larvae (Sweetman 2006).
• Chironomus larvae suggest highly eutrophic pond (Saether 1979)
• Chaoboridae larvae specifically Chaoborus migrate vertically to avoid predation(Sweetman 2006).

Conclusions
• The percent water content suggests a silt/clay sediment
• Dr. McDaniel concluded the sediment was mostly silt
• The difference in percent organic might be from differences in Chaoboridae numbers.

Summary
• The high Chaoboridae and Chironomus populations are good fish food but might not be available to eat.
• There is a difference in organic soil content between deep and shallow probably due to Chaoboridae pop.
• There was no difference in sediment loads between the shallow and deep end of the lake.

Acknowledgments
• Mr. Ingle
• Picture Credits– iodeweb5.vliz.be/.../
AndersonBook/SampEquip.htm – Dr. Wilhelm
• Other Credits– X Group Bathometric Group– X Group Light and Temperature Profiles

References
• Jon N. Sweetman , a, and John P. Smola Reconstructing fish populations using Chaoborus (Diptera: Chaoboridae) remains – a review Paleoecological Environmental Assessment and Research Laboratory (PEARL), Department of Biology, Queen's University, Kingston, Ont., Canada K7L 3N6
• Saether, O.A. 1979. Chironomid communities as water quality indicators. – Holarct Ecol. 2: 65-74

Questions?


