93
Südzucker Group, page 1 Berenberg Food Ingredients and Chemicals Conference 16-17 September 2020 Nikolai Baltruschat (Head of Investor Relations)

Südzucker Group, page 1
Berenberg Food Ingredients andChemicals Conference16-17 September 2020
Nikolai Baltruschat (Head of Investor Relations)

Südzucker Group, page 2
FINANCIAL TRANSPARENCY
Agenda1. Overview and strategy page 3
2. Current highlights page 12
3. Financial Highlights Q1 2020/21 page 17
4. Capital Market and Financing page 25
5. Development non-sugar-activities page 30
6. Development segment sugar page 54
7. Outlook 2020/21 page 63
8. Appendix Long-term development and key figures page 69 Additional information page 77

Südzucker Group, page 3
FINANCIAL TRANSPARENCY
Südzucker Group at a glance
Global operating German food group with long-standing corporate history and diversified business model: 1837: Foundation of first sugar company 1926: Foundation of Süddeutsche Zucker-AG ~ 100 production facilities ~ 19.200 employees, worldwide
Majority shareholder / Key shareholders: SZVG: 59 % Zucker Invest GmbH: 10 %
Stock exchange listing in Germany SDAX-member Trading volume*: ~ 0.7 mn shares/day
Sustainable investment grade rating
* Financial year 2019/20
Sugar(38%) Fruit
(18 %)
Group Revenues 6.7 bn €*
Sugar(34 %)
Non-sugar-activities
(66 %)
Special Products (36 %)
Fruit(18 %)
CropEnergies(12 %)

Südzucker Group, page 4
FINANCIAL TRANSPARENCY
Revenues 6.7 bn €
EBITDA 478 mn €
Op. 116 mn €Result
Südzucker Group: Key ratios 2019/20
Sugar: 2.3 bn €Non-Sugar: 4.4 bn €
Sugar: -75 mn €Non-Sugar: 553 mn €
Sugar: -236 mn €Non-Sugar: 352 mn €
Cash flow
Equity ratio
372 mn €
1,570 mn €
44 %
Net Financial Debt

Südzucker Group, page 5
FINANCIAL TRANSPARENCY
Return on Capital Employed (RoCE)
2012/13 2013/14 2014/15 2015/16 2016/17 2017/18 2018/19 2019/20 Ø 8 years
Sugar 22.4 % 13.7 % 0.2 % -2.6 % 2.3 % 4.2 % -9.0 % -8.4 % 2.9 % Non-sugar 9.5 % 6.9 % 6.4 % 11.6 % 12.4 % 9.1 % 7.8 % 9.9 % 9.2 % Special Products 9.5 % 6.3 % 8.7 % 11.9 % 12.2 % 7.7 % 7.3 % 8.4 % 9.0 % CropEnergies 17.3 % 6.4 % -2.2 % 17.7 % 20.4 % 15.9 % 7.2 % 23.1 % 13.2 % Fruit 5.0 % 8.1 % 8.4 % 7.5 % 8.3 % 9.0 % 9.3 % 6.8 % 7.8 %
RoC
EG
roup
5,9505,873 5,877
5,791
6,012
6,650
6,072
6,388
6,077
10.6 % 3.1 % 4.2 % 7.1 % 6.7 % 0.4 % 1.8 %16.3 % 6.2 %
Capital Employed
(mn €)
RoCE (%)

Südzucker Group, page 6
FINANCIAL TRANSPARENCY
Group strategy
advancediversificationsynergy usage
take benefit ofmegatrends
support andstipulate
employees
strengthenmarketposition
focus on corecompetences
increaseshareholder
value
continue solid financing
strategy / target value-oriented investments
actsustainable

Südzucker Group, page 7
FINANCIAL TRANSPARENCY
Synergy example: Zeitz site- five composite factories
CO2-Liquefaction
Starchfactory
Bioethanolfactory
Sugar factoryNeutral alcohol
factory

Südzucker Group, page 8
FINANCIAL TRANSPARENCY
Portfolio benefits from long-term megatrends…
18,000
58,000
98,000
138,000
178,000
218,000
2,000
4,000
6,000
8,000
tmn
Sources: United Nations, F.O. Licht, ERS International Macroeconomic Data Set
population growth worldwide
sugar consumption worldwide
,0
4,000
8,000
12,000
USD
per capita income
Source: ERS International Macroeconomic Data Set
emerging markets
worldwide
0
20
40
60
80
100
120
0
20
40
60
80
100
120
USD / barrelmn barrel / day
Source: BP, EIA
oil consumption
crude oil price,200
,400
,600
,800
1,000
mn t
Source: USDA
global animal feed production

Südzucker Group, page 9
FINANCIAL TRANSPARENCY
… with volatile and cyclical market conditions and …
400450500550600650700750800850
Ethanol (€ / m³)
0
50
100
150
Brent (USD/barrel)
1,00
1,10
1,20
1,30
1,40
1,50
1,60
1,70EUR/USD
-1,0
0,0
1,0
2,0
3,0
4,0
5,0
6,0 3M-Euribor (%)
150
250
350
450
550
650White sugar (€/t)
50
100
150
200
250
300
350Wheat / Maize (€/t)

Südzucker Group, page 10
FINANCIAL TRANSPARENCY
…environment influenced by political decisions
Brasil Change of government
RenovaBio program
Currency development
EU Coupled payment
for beet growing Prohibition of
Neonicotinoids RED II (renewable
energy directive) Brexit
Global trade WTO
NAFTA
CETA
TTIP
Mercosur
Corona Pandemic

Südzucker Group, page 11
FINANCIAL TRANSPARENCY
Agenda1. Overview and strategy page 3
2. Current highlights page 12
3. Financial Highlights Q1 2020/21 page 17
4. Capital Market and Financing page 25
5. Development non-sugar-activities page 30
6. Development segment sugar page 54
7. Outlook 2020/21 page 63
8. Appendix Long-term development and key figures page 69 Additional information page 77

Südzucker Group, page 12
FINANCIAL TRANSPARENCY
Executive Summary 2019/20 (I) – targets achieved
Revenues
Outlook 2019/20 Reported 2019/20
EBITDA
OperatingResult
6.7-7.0 bn € 6.7 bn €
430-490 mn € 478 mn €
70-130 mn € 116 mn €
< 379 mn € 335 mn €
> 5 % 5.6 %Cash flow/Revenues
6.8 bn €
353 mn €
27 mn €
379 mn €
5.6 %
Reported 2018/19
Capex

Südzucker Group, page 13
FINANCIAL TRANSPARENCY
Executive Summary 2020/21 (II) – deleverage phase started
Cost saving measures implemented in segment sugar Successful implementation of “restructuring plan 2019” Cost savings effective from H2 FY 2020/21 Additionally identified optimization potential in administration costs should be
implemented in a socially acceptable way
Solid financing Strong sustainable liquidity position Balanced maturity profile – refinancing needs beyond 2023
2020/21 marks starting point for sustainable deleverage 2020/21 with significant net financial debt decrease as
earnings significantly increase Sustainable capex reduction (maintenance and expansion capex) Continued disciplined M&A policy

Südzucker Group, page 14
FINANCIAL TRANSPARENCY
Executive Summary 2020/21 (III) – significant earnings improvement
Outlook 2020/21 Revenues: 6.9 to 7.2 bn € EBITDA: 660 to 760 mn € Operating result: 300 to 400 mn €
Corona pandemic The outlook is still hindered by the ongoing corona pandemic. Our diversified robust portfolio with respective strong cash flow base can
potentially more than compensate for the possible temporary burden. In any case – with or without corona effects – we expect a significant
earnings increase Overall successful start into business year 2020/21

Südzucker Group, page 15
FINANCIAL TRANSPARENCY
EBITDASugar
2018/19 2020/21e
EBITDANon-Sugar
EBITDAGroup
Capex
-102
455
379 ~ 300
Executive Summary 2020/21* (IV) – Structural Cash flow(in mn €)
2019/20
-75
553
353 660 to 760478
335
* Effects in regard to the corona pandemic – negative and positive - are not included in the outlook
Deleverage phase initiated in 2020/21

Südzucker Group, page 16
FINANCIAL TRANSPARENCY
Agenda1. Overview and strategy page 3
2. Current highlights page 12
3. Financial Highlights Q1 2020/21 page 17
4. Capital Market and Financing page 25
5. Development non-sugar-activities page 30
6. Development segment sugar page 54
7. Outlook 2020/21 page 63
8. Appendix Long-term development and key figures page 69 Additional information page 77

Südzucker Group, page 17
FINANCIAL TRANSPARENCY
(mn €) 2020/21 2019/20 +/- in %Revenues 1.669 1.680 -0,6EBITDA 134 117 14,8
EBITDA margin 8,0% 6,9%Depreciation -73 -70 4,0Operating result 61 47 31,1
Operating margin 3,7% 2,8%Restructuring costs/special items 1 -6 -Result from companies consolidated at equity 3 -4 -EBIT 65 37 74,0Net earnings attributable to shareholders 26 -7 -Earnings per share (€) 0,12 -0,04 -Cash flow 118 88 33,2Investments in fixed assets* 52 72 -27,2Net financial debt 1.431 1.240 15,4Employees 18.904 20.150 -6,2
1st quarter
Group income statement
* Including intangible assets

Südzucker Group, page 18
FINANCIAL TRANSPARENCY
Financial Highlights – Q1 2020/21
Revenues
EBITDA
Operating Result
-1 % to 1,669 (1,680) mn €
+15 % to 134 (117) mn €
+31 % to 61 (47) mn €
Cash flow
Earnings per share
Net financial debt
+33 % to 118 (88) mn €
0.12 (-0.04) €
1,431 (1,240) mn €

Südzucker Group, page 19
FINANCIAL TRANSPARENCY
Overview segments Q1 2020/21
Sugar
SpecialProducts
CropEnergies
Fruit
Group
(mn €) 2020/21 2019/20 abs. %1st quarter
Revenues 565 581 -16 -2,8EBITDA 6 -16 22 -Operating result -15 -36 21 -58,7
Revenues 638 602 36 6,1EBITDA 84 75 9 11,3Operating result 52 46 6 12,5
Revenues 162 185 -23 -12,6EBITDA 18 26 -8 -29,7Operating result 8 15 -7 -46,7
Revenues 304 312 -8 -2,5EBITDA 26 32 -6 -17,5Operating result 16 22 -6 -26,6
Revenues 1.669 1.680 -11 -0,6EBITDA 134 117 17 14,8Operating result 61 47 14 31,1
Non-SugarRevenues 1.104 1.099 5 0,5EBITDA 128 133 -5 -3,8Operating result 76 83 -7 -8,4

Südzucker Group, page 20
FINANCIAL TRANSPARENCY
Segment Sugar: Development Q1 2020/21
Revenues: Revenues decline driven by significantly lower sales volume. On the one hand lower sugar production from campaign 2019. On the other hand in the course lower demand from industrial customers against short term positive effects of hording in retail sector at the beginning of the fiscal year.
Operating result: Improvement mainly driven by higher sugar sales revenues due to price increases since the beginning of SMY 2019/20, which more than offset lower sales volumes and higher production costs.
(mn €) 2020/21 2019/20 +/- in %
Revenues 565 581 -2,8EBITDA 6 -16 -
EBITDA margin 1,0% -2,8%Depreciation -21 -20 1,9Operating result -15 -36 -58,7
Operating margin -2,7% -6,3%
1st quarter

Südzucker Group, page 21
FINANCIAL TRANSPARENCY
Segment Special Products: Development Q1 2020/21
Revenues: Increase mainly driven by capacity extension in divisionstarch. Measures to slow the spread of the coronapandemic had various impacts depending on the productcategory.
Operating result: In addition to higher volumes overall, lower raw material costs in some areas contributed to the increase, while salesrevenues in other categories, such as ethanol, were lowerthan last year.
(mn €) 2020/21 2019/20 +/- in %
Revenues 638 602 6,1EBITDA 84 75 11,3
EBITDA margin 13,1% 12,5%Depreciation -32 -29 9,4Operating result 52 46 12,5
Operating margin 8,2% 7,7%
1st quarter

Südzucker Group, page 22
FINANCIAL TRANSPARENCY
Segment CropEnergies: Development Q1 2020/21
Revenues: Fuel demand distortions due to mobility restrictions caused by the Corona pandemic led to a decline in both volumes and sales revenues. The decline could only be partially offset by significantly higher demand for ethanol to produce disinfectants.
Operating result: Despite decline better than expected. Reduced by-product revenues, particularly for protein-based products, were more than offset by lower raw material prices. Production volume was maintained at the previous year's level, despite scheduled maintenance shutdown in Wanze.
(mn €) 2020/21 2019/20 +/- in %
Revenues 162 185 -12,6EBITDA 18 26 -29,7
EBITDA margin 11,2% 14,0%Depreciation -10 -11 -5,6Operating result 8 15 -46,7
Operating margin 5,0% 8,2%
1st quarter

Südzucker Group, page 23
FINANCIAL TRANSPARENCY
Segment Fruit: Development Q1 2020/21
Revenues: Higher sales revenues were offset by lower volumes for both fruit preparations and fruit juice concentrates.
Operating result: Significant earnings decrease. Lower volumes due partly to a weaker harvest and partly to measures related to combatting the Corona virus, as well as lower margins because of higher costs, weighed on the result.
(mn €) 2020/21 2019/20 +/- in %
Revenues 304 312 -2,5EBITDA 26 32 -17,5
EBITDA margin 8,6% 10,1%Depreciation -10 -10 3,1Operating result 16 22 -26,6
Operating margin 5,3% 7,0%
1st quarter

Südzucker Group, page 24
FINANCIAL TRANSPARENCY
Income statement (I)
Result from companies consolidated at equity: The result was generated almost exclusively by the sugar -1 (-8) mn € and
special products 4 (4) mn € segments. Financial result:
Financial result -8 (-9) mn €; comprises net interest result of -6 (-6) mn € and other financial result of -2 (-3) mn €.
(mn €) 2020/21 2019/20 +/- in %
Revenues 1.669 1.680 -0,6Operating result 61 47 31,1Restructuring costs/special items 1 -6 0,0Result from companies consolidated at equity 3 -4 -Result from operations 65 37 74,0Financial result -8 -9 -11,1Earnings before income taxes 57 28 > 100
1st quarter

Südzucker Group, page 25
FINANCIAL TRANSPARENCY
Income statement (II)
Taxes on income: -14 (-17) mn €. Especially effect of losses in segment sugar for which there
was no recognition of deferred taxes. Minority interests:
Mainly attributable to the co-owners of AGRANA Group and CropEnergiesGroup
Earnings per share (EPS): 0.12 € (-0.04 €)
(mn €) 2020/21 2019/20 +/- in %
Earnings before income taxes 57 28 > 100Taxes on income -14 -17 -15,1Net earnings for the year 43 11 > 100of which attributable to Südzucker AG shareholders 26 -7 -of which attributable to hybrid capital 3 3 -3,0of which attributable to minority interests 14 15 -5,3
Earnings per share (€) 0,12 -0,04 -
1st quarter

Südzucker Group, page 26
FINANCIAL TRANSPARENCY
(mn €) 2020/21 2019/20 +/- in %Cash flow 118 88 33,2Increase (-)/ Decrease (+) in working capital 104 16 > 100Investments in fixed assets*Sugar segment 18 19 -6,6Special products segment 20 38 -47,5CropEnergies segment 10 5 > 100Fruit segment 4 10 -59,4Total investments in fixed assets -52 -72 -27,2Investments in financial assets/acquisitions -11 -5 > 100Total investments -63 -77 -17,0
Dividends paid -5 -5 -2,1
1st quarter
Cash flow statement
* incl. investments in intangible assets
Cash flow: Cash flow at 118 (88) mn € and came in at 7.0 (5.3) % of revenues.
Working Capital: The seasonal cash inflow of 104 mn € from reduced working capital was primarily due to the
selloff of sugar inventories, which was partially compensated by the settlement of trade payables. Previous year’s cash inflow was 16 mn €.
Investments in fixed assets: Continuation of already communicated projects

Südzucker Group, page 27
FINANCIAL TRANSPARENCY
Balance sheet
Net financial debt: Increase by 191 mn € against previous year. Reduction by 139 mn € against 29
February 2020. Total investments of 63 mn € and the 5 mn € earnings distribution were fully financed from cash flow of 118 mn € and the cash inflow of 104 mn € due to the reduction of the working capital.
(mn €) 31 May 2020 31 May 2019 +/- in %
AssetsNon-current assets 4.471 4.584 -2,5Current assets 3.693 3.594 2,8Total assets 8.164 8.178 -0,2
Liabil ities and shareholders' equityShareholders' equity 3.790 3.960 -4,3Non-current liabilities 2.731 2.532 7,8Current liabilities 1.643 1.686 -2,5Total l iabilities and shareholders ' equity 8.164 8.178 -0,2
Net financial debt 1.431 1.240 15,4Equity ratio 46,4% 48,4%Net financial debt in percent of equity (gearing) 37,8% 31,3%

Südzucker Group, page 28
FINANCIAL TRANSPARENCY
Agenda1. Overview and strategy page 3
2. Current highlights page 12
3. Financial Highlights Q1 2020/21 page 17
4. Capital Market and Financing page 25
5. Development non-sugar-activities page 30
6. Development segment sugar page 54
7. Outlook 2020/21 page 63
8. Appendix Long-term development and key figures page 69 Additional information page 77

Südzucker Group, page 29
FINANCIAL TRANSPARENCY
Three strong anchors in the capital market
* Süddeutsche Zuckerrübenverwertungs-Genossenschaft eG** Z&S Zucker und Stärke Holding AG (~50% Südzucker, ~50% ZBG (Zucker-Beteiligungsgesellschaft m.b.H.))
Market Cap
3.5 bn €
SZVG* (5 %)
Freefloat (31 %)
SZVG* (59 %)
Zucker Invest GmbH (10 %)
Südzucker (69 %)
Freefloat (26 %)
Südzucker direct (3 %)
Z&S** (78 %)
Freefloat (19 %)
Südzucker indirectvia Z&S** (39 %)
Market Cap
1.0 bn €
Market Cap
1.1 bn €
Südzucker AG
CropEnergies AGAGRANA Beteiligungs-AG

Südzucker Group, page 30
FINANCIAL TRANSPARENCY
Investment Grade Rating
Rating agency Long-term rating Short-term rating
BBB- *Negative Outlook **
Baa3 ***Negative Outlook ****
A – 3 *
P – 3 ***
* since 18 January 2019** since 24 May 2019
*** since 12 December 2018**** since 5 April 2018

Südzucker Group, page 31
FINANCIAL TRANSPARENCY
Continued high liquidity
(mn €) 28.02.2017 28.02.2018 28.02.2019 29.02.2020
Net financial debt -413 -843 -1.129 -1.570
Cash & Cash equivalents / securities 725 730 499 484
Gross financial debt -1.138 -1.573 -1.627 -2.054
Long-term financial debt -914 -1.117 -1.126 -1.332
Short-term financial debt -224 -456 -501 -596
Leasing 0 0 0 -126
Bank credit l ines: 786 814 849 767undrawn 464 470 351 242
Syndicated loan facility 600 600 600 600undrawn 600 600 600 600
Syndicated loan facility Agrana 450 450 450 450undrawn 450 450 375 370
Commercial paper program 600 600 600 600undrawn 600 600 370 270
= Total l iquidity reserves 2.839 2.850 2.195 1.966

Südzucker Group, page 32
FINANCIAL TRANSPARENCY
111 83
500300
100
80
40
2020 2021 2022 2023 2024 2025 2026
Bulletloans
EUR-Bond1.25 %
EUR-Bond1.00 %
AGRANApromissorynotesCommercial Paper Programm 600 mn € (permanent)
Maturity profile of main financial liabilities(mn € as of 31 July 2020)
Syndicated loans 1,050 mn € *
Hybrid Bond 700 mn € (perpetual)variable coupon: 3M-Euribor + 310 bp;
2.697 % p.a. for 30.06.2020 – 30.09.2020 (excluded); payout quarterly
* Maturity: June 2021/300 mn €, August 2022/150 mn €, July 2025/600 mn €

Südzucker Group, page 33
FINANCIAL TRANSPARENCY
Agenda1. Overview and strategy page 3
2. Current highlights page 12
3. Financial Highlights Q1 2020/21 page 17
4. Capital Market and Financing page 25
5. Development non-sugar-activities page 30
6. Development segment sugar page 54
7. Outlook 2020/21 page 63
8. Appendix Long-term development and key figures page 69 Additional information page 77

Südzucker Group, page 34
FINANCIAL TRANSPARENCY
Non-sugar-activities (I): Strong market position in growing business areas…
Functional FoodRevenues ~ 600 mn €
Global megatrend functional food; ongoing above average growth potential
Positioning as world market leader in main product categories
PortionPackRevenues >100 mn €
European market leader in food and non-food portion packs Growth options outside of Europe
StarchRevenues ~ 900 mn €
Successful growth strategy in specialty starches Growth opportunities secured via investment program
FruitRevenues >1 bn €
World market leader in fruit preparations Sustainable growth and stable margins
PizzaRevenues ~1 bn €
Market leader in Europe and USA in private label business High potential in USA private label business
Bioethanol(mainly CropEnergies)Revenues ~1 bn €
Market leader in Europe Further market potential secured in EU until 2030 (RED II)

Südzucker Group, page 35
FINANCIAL TRANSPARENCY
Non-sugar-activities (II): …growth secured via projects
Functional FoodRevenues ~ 600 mn €
Capacity extension, respectively preparation at all BENEO sites Enlargement of product range
PortionPackRevenues >100 mn €
Integration of acquisition CustomPack, UK Market entry South Africa
StarchRevenues ~ 900 mn €
Investments 2013 to 2020 (~400 mn €) in Aschach, Gmünd, Pischelsdorf and Zeitz through new and extended facilities
Acquisition of bio distribution company Marroquin, USA
FruitRevenues >1 bn €
Market entry India / second fruit preparation factory China Participation in fruit preparation producer in Algeria Cost cutting program
PizzaRevenues ~1 bn €
Acquisition Richelieu Foods, USA, high market potentialvia development of private label share
Bioethanol(mainly CropEnergies)Revenues ~1 bn €
Further factory optimization and capacity flexibility leads to higher yearly average production volume

Südzucker Group, page 36
FINANCIAL TRANSPARENCY
Segment Special Products
(mn €) 2019/20 2018/19Revenues 2.409 2.294 115 5 %EBITDA 306 268 38 14 %EBITDA-Margin 12,7% 11,7%Depreciation -116 -112 -4 4 %Operating Result 190 156 34 22 %Operating Margin 7,9% 6,8%Restructuring and special items 0 -51 51 -Result from companies consolidated at equity 17 17 0 -1 %Result from operations 207 122 85 69 %
Investments 152 172 -20 -12 %Fixed Assets 150 165 -15 -9 %Financial Assets / Acquisitions 2 7 -5 -74 %
Capital Employed 2.267 2.133 135 6 %RoCE 8,4% 7,3%
Δ

Südzucker Group, page 37
FINANCIAL TRANSPARENCY
Special Products segment: Overview
* incorporates AGRANA bioethanol and starch activities
Pizza39 %
Functional Food22 %
PortionPack5 %
Starch*34 % 2,409
mn €
Leading market positions in all four divisions Sustainably high cash flow quality High depreciation level in light of
internal/external growth Very sound fundamental development Growth based on global megatrends:
unchanged trend to alternative andfunctional food ingredients
further increase in demand forconvenience products
unbroken global demand growth foranimal feed (e.g. Gluten)
Continuous capacity adjustment followsmarket growth
171 184158 156
190
2015/16 2016/17 2017/18 2018/19 2019/20
Revenue split 2019/20
Operating Result (mn €)

Südzucker Group, page 38
FINANCIAL TRANSPARENCY
Special Products segment: Division Functional Food
Offstein
Sales OfficesRegional CentersProduction facility
BENEO bundles functional food activities 5 production sites globally and international
distribution network Main product categories:
Prebiotic fibres from chicory roots: Core productsInulin and Oligofructose
Functional carbohydrates from sugar beet: Core products Isomalt (sole sugar replacer made out of sugar) and Palatinose™ (functional sugar withprolonged energy allocation)
Functional ingredients from rice: e.g. ricestarches, rice flours and rice proteins
Distribution of functional wheat protein (Gluten), produced in Südzucker Group
World market leader for functional chicory- and rice products as well as for Isomalt/Palatinose™
Ongoing global increase in demand for functionalfood ingredients
Increasing awareness for healthy nutrition and growing per-capita income (emerging markets)

Südzucker Group, page 39
FINANCIAL TRANSPARENCY
6 production sites and distribution within EU Main product categories:
Starch products: Specialty starches for paper, textile-, cosmetics-, pharmaceutical andconstruction industries; focus on organic andGM-free starches for food industries
Bioethanol production: Bioethanol production fromgrain and production of by-products (food andanimal feed)
Leading market position in main product categories Ongoing growth for speciality starches Worldwide strongly growing demand for animal feed Mandatory ethanol blending within EU
High investment volume (~ 400 mn €) in current cycle: New starch factory Pischelsdorf (2013) New starch factory Zeitz (2016) Extension starch factory Aschach (2017) Extension starch factory Pischelsdorf (2019)
Acquisition bio distribution company Marroquin, USA
Special Products segment: Division Starch*
Zeitz
* incorporates AGRANA bioethanol and starch activities
Production starch
Gmünd (A)Pischelsdorf (A)Aschach (A)
Szabadegyhaza (HU)Tandarei (RO)
Production bioethanol
Zeitz (DE)

Südzucker Group, page 40
FINANCIAL TRANSPARENCY
Special Products segment: Division Pizza
11 production sites in EU (6) and in USA (5); distribution in EU and USA
Main product categories: Deep frozen and chilled pizza
Pasta dishes
Snacks & baguettes
Pourables
Mostly private label business forfood retailing („B2B“)
Market leader private label pizza market in Europe and USA Employees: ~ 3,500 Pizzas per day: ~ 3.5 mn Revenues: ~ 1 bn €
Strong platform for further growth
# 1 Europe
# 1 USA
Public Warehouses – PourablesPublic Warehouses – PizzaProduction facility

Südzucker Group, page 41
FINANCIAL TRANSPARENCY
Special Products segment: Division PortionPack
Oud Beijerland (NL)
Landgraaf (NL)
La Llagosta
PragueHerentals (B)
Oud-Beijerland (NL)
Nuremberg
Telford
Vienna
Production facility in EU Trading companies
6 production sites in EU and 1 in South Africa Main product categories:
Coffee supplies (sugar, milk…) Biscuits Chocolates Breakfast Seasoning Sweets & Snacks Fruit purees Other unit packed products (e.g. for hotels, etc.)
European market leader for portion packs for foodindustry
Unchanged trend for unit packed products and„out-of-home“ consumption
September 2018, Acquisition CustomPack, Telford/Great Britain
Acquisition majority stake Collaborative Packing Solutions (South Africa)

Südzucker Group, page 42
FINANCIAL TRANSPARENCY
Special Products
Special Products segment (I): Strategy
expand customerrelationships using
innovative products andapplication consulting
continue to expand our market position on the basis of the existing
product portfolio as well as innovative
concepts
work closely with our customers to take advantage
of the rising consumer interestin plant-based ingredients with
positive technologicalfunctionality and nutritional
and physiologicalcharacteristics
further strengthenleading position in
organic starches and GMO-free starches
categories
focus on highly refined specialty
products
invest in capacity expansions and projects
to improve cost and energy efficiency

Südzucker Group, page 43
FINANCIAL TRANSPARENCY
differentiate fromcompetitors: productfocus is on quality, sustainability and
innovation
Special Products
Special Products segment (II): Strategy
expand market leadershipposition for portion packs in the European out-of-home
consumption sector and seizemarket opportunities outside
Europe
further strengthen European market position by enhancing
customer relationships, innovations and targeted
investments
innovation leadership: develop new product
concepts in the “portion solutions” area
take advantage of market growth in the United States
and strengthen marketposition through further
investmentsfurther improve costefficiency across the
entire value chain

Südzucker Group, page 44
FINANCIAL TRANSPARENCY
Special Products segment: Outlook 2020/21
Further increase of production and sales volumes Fundamental further positive ethanol market environment Support via improved sugar market environment
Revenues
Operating Result Earnings on high prior year’s level (previous year: 190 mn €)
Slightly higher revenues (previous year: 2,409 mn €)
CoronaPandemic
Possible positive impulses(e.g. divisions Freiberger, BENEO)
Possible negative impulses (e.g. division PortionPack)

Südzucker Group, page 45
FINANCIAL TRANSPARENCY
Segment CropEnergies
(mn €) 2019/20 2018/19Revenues 819 693 126 18 %EBITDA 146 72 74 > 100EBITDA-Margin 17,8% 10,4%Depreciation -42 -39 -3 7 %Operating Result 104 33 71 > 100Operating Margin 12,7% 4,7%Restructuring and special items 0 10 -10 -Result from companies consolidated at equity 0 0 0 0 %Result from operations 104 43 61 > 100
Investments 30 13 17 > 100Fixed Assets 30 13 17 > 100Financial Assets / Acquisitions 0 0 0 -
Capital Employed 450 456 -6 -1 %RoCE 23,1% 7,2%
Δ

Südzucker Group, page 46
FINANCIAL TRANSPARENCY
AmsterdamRotterdam
ZeitzWanzeLoon-Plage
Wilton
Santiago de Chile
CropEnergies segment: Overview
Production facility Tank storage Distribution
4 production sites in EU; offices/distribution sites in EU and South America
Main product categories: Bioethanol as fuel and traditional applications
(1.3 mn m³ p.a.) Food and animal feed (>1 mn t p.a.) Disinfectants
EU market leader Megatrend renewable energies
More renewable energy in transport in 2030(RED II: 14 % (max. 7 % 1G)
Reduction of greenhouse gas emissions Higher independency from imported oil
Sustainable raw materials from European agricultureand complete utilization

Südzucker Group, page 47
FINANCIAL TRANSPARENCY
CropEnergies segment: Market environment (I)
Ethanol prices in Q1 High volatility due to Corona Historic low in March: crude oil negative,
ethanol 350 €/m3
Average*: 490 (595) €/m3
As per June 2020: approx. 570 €/m3
Feedstock markets 2020/21 Grain prices**: 190 (185) €/t EU27 grain harvest: 287 mn t (-2 %)
exceeds consumption of 260 mn t
European ethanol prices €/m3
* Ethanol T2 FOB Rdam, rounded ** wheat (Euronext Paris), next date of expiry, rounded
Euronext Paris Wheat €/t
400
500
600
700
800
03 05 07 09 11 01 03
FY 18/19 FY 19/20 FY 20/21
100
150
200
250
03 05 07 09 11 01 03
FY 18/19 FY 19/20 FY 20/21

Südzucker Group, page 48
4,570 4,736 5,037 4,430
1,323 1,420 1,417 1,900855 860 870 800
6,748 7,016 7,324 7,130
0
2.500
5.000
7.500
2017 2018 2019 2020Fuel Industrial Potable
,
,
,
Ethanol market in the EU27 & UK in 2020 (in million m³) Consumption: 7.8 -6 %
(4.8 fuel | 3.0 non-fuel) Production: 7.2 -4 %
(4.7 fuel | 2.5 non-fuel) Corona crisis 2020: fuel drops, disinfectants
(industrial) increase
Mobility and modal split change due to Corona Sharp drop in mobility and in fuel consumption
mid of March Petrol consumption decreased in April in
Germany by almost 35 % Increase of mobility in May and June with
higher use of cars
CropEnergies segment: Market environment (II)
EU27: ethanol sales (mn m3)
Source: F.O. Licht (2020)
Source: Apple, EU Commission (2020)* number of requests made to Apple Maps for directions, data sets
compared to reflect changes in volume of people driving, etc.
1
1,2
1,4
1,6
-100 %
-50 %
0 %
50 %
100 %
Germany mobility data 2020drivingpublic transportprice 95 RON €/l
Germany mobility data* 2020

Südzucker Group, page 49
0.7 0.7 0.7
2.8 2.3 2.1
3.43.0 2.7
0.30
1
2
3
4
Diesel Gasoline PremiumE10
Ethanol
combustion upstream
Segment CropEnergies: Climate protection perspective EU targets in transport 2020
GHG emissions in fuels -6 %; 10 % renewables
EU: on the way to climate neutrality in 2050 Currently: 40 % less GHG,
thereof non-ETS (e.g. transport): -30 % „Green Deal“: EU-climate target 2030 to be increased
to at least -50 % GHG RED II 2030: mandatory higher share of renewables,
min. 14 % in transport
Germany: climate protection law and “Brennstoffemissionshandels-Gesetz” / trading of Co2 emissions from fuels Legal GHG limit in transport: 95 (150) mn t
CO2eq. 2030 (2020) CO2 pricing of fossil fuels: from 25 €/t (2021)
to 55 €/t (2025)
Germany: GHG emissions [mn t CO2eq.]
GHG emissions from fuels (kg CO2eq./liter)
162
150
95
197
197
133
311
280
175
196
186
140
866 813
543
375
0
300
600
900
Actual 2018 Target 2020 Target 2030 Target 2040
IndustryEnergyother non-ETSTransport

Südzucker Group, page 50
FINANCIAL TRANSPARENCY
CropEnergies
seize market opportunitiesarising from growing efforts to
reduce greenhouse gas emissions and the associated
increased demand
diversify productportfolio
strengthen R&D activities, develop solutions for
challenges surroundingclimate change
expand logisticsinfrastructure
optimize loading, raw material use, cost structure
and energy efficiency ofproduction sites
CropEnergies segment: Strategy

Südzucker Group, page 51
FINANCIAL TRANSPARENCY
CropEnergies segment: Outlook 2020/21
Operating result in range 110 to 140 mn € expected(previous year: 104 mn €)
Revenues in range 790 to 840 mn € expected(previous year: 819 mn €)
Fundamental further positive ethanol market environment mainlydriven by fundamental climate debate
Revenues
Operating Result
CoronaPandemic
Since March 2020 europeanwide restricted mobility hasled to significant ethanol price decrease; therefore Q1 significantly burdened; but strong recovery since Q2
Increased usage of ethanol as disinfectants source haspotential to partially offset sales volume decrease in fuel sector

Südzucker Group, page 52
FINANCIAL TRANSPARENCY
Segment Fruit
(mn €) 2019/20 2018/19Revenues 1.185 1.179 6 1 %EBITDA 101 115 -14 -12 %EBITDA-Margin 8,5% 9,8%Depreciation -43 -38 -5 14 %Operating Result 58 77 -19 -25 %Operating Margin 4,9% 6,6%Restructuring and special items -2 0 -2 -Result from companies consolidated at equity 0 0 0 -Result from operations 56 77 -21 -28 %
Investments 53 62 -9 -15 %Fixed Assets 52 56 -4 -8 %Financial Assets / Acquisitions 1 6 -5 -91 %
Capital Employed 855 830 25 3 %RoCE 6,8% 9,3%
Δ

Südzucker Group, page 53
FINANCIAL TRANSPARENCY
27 production sites globally; distribution in more than80 countries
World market leader in fruit preparations (market share >30 %)
Main customer groups: Dairy companies Ice cream producers Bakeries Food service industry
Unique global structure for sourcing, production and distribution
Fruit segment: Fruit preparations
Production facility

Südzucker Group, page 54
FINANCIAL TRANSPARENCY
15 production sites in Europe and one in China
Main product categories: Fruit juice concentrates Beverage compounds Fruit wines Flavouring NFC-Juices
European market leader for fruit juice concentrates
Trend towards fruit juices and bio-products unchanged
Fruit segment: Fruit juice concentrates
Production facility

Südzucker Group, page 55
FINANCIAL TRANSPARENCY
Fruitsecure and strengthenmarket position throughorganic growth as well as acquisitions and acquiring stakes in other companies
Effizienzsteigerung in den Werken
expand presence globally, follow international customers
into new markets and grow faster than the market
expand presence globally, follow international customers
into new markets and grow faster than the market
customer and market focused global growth
Fruit segment: Strategy

Südzucker Group, page 56
FINANCIAL TRANSPARENCY
Fruit segment: Outlook 2020/21
Revenues
Operating Result
Fruit preparations with revenues increase via capacityutilization and diversification into non-dairy business
Fruit juice concentrates with significant revenues increase Moderate revenues increase (previous year: 1,185 mn €)
Moderate earnings increase (previous year: 58 mn €)
Fruit preparations with increase based on higher marginsand lower cost increase
Fruit juice concentrates with earnings decrease Cost cutting program
CoronaPandemic
Especially in segment fruit with global production siteseffects are particularly difficult to measure

Südzucker Group, page 57
FINANCIAL TRANSPARENCY
Agenda1. Overview and strategy page 3
2. Current highlights page 12
3. Financial Highlights Q1 2020/21 page 17
4. Capital Market and Financing page 25
5. Development non-sugar-activities page 30
6. Development segment sugar page 54
7. Outlook 2020/21 page 63
8. Appendix Long-term development and key figures page 69 Additional information page 77

Südzucker Group, page 58
FINANCIAL TRANSPARENCY
Segment Sugar
(mn €) 2019/20 2018/19Revenues 2.258 2.588 -330 -13 %EBITDA -75 -102 27 -26 %EBITDA-Margin -3,3% -3,9%Depreciation -161 -137 -24 17 %Operating Result -236 -239 3 -1 %Operating Margin -10,4% -9,2%Restructuring and special items -17 -769 752 -Result from companies consolidated at equity -66 5 -71 -Result from operations -319 -1.003 684 -68 %
Investments 113 147 -34 -22 %Fixed Assets 103 145 -42 -28 %Financial Assets / Acquisitions 10 2 8 > 100
Capital Employed 2.815 2.653 162 6 %RoCE -8,4% -9,0%
Δ

Südzucker Group, page 59
FINANCIAL TRANSPARENCY
Package of measures - sugar
„Restructuring plan 2019“ implemented Successful implementation of “restructuring plan 2019” Closure of 5 factories; structural sugar production reduction of 700,000 tonnes Reduction: Administration structure and costs, fix costs, maintenance and
investment requirements Focus on EU Cost reductions effective from H2 FY 2020/21
Cost savings pro rata (~100 mn € p.a.)
Additional optimization potential identified Additionally identified administration structure optimization potential shall be
implemented in a socially acceptable way Cost savings (~30 mn € p.a.)
Ongoing assessment of further improvement measures

Südzucker Group, page 60
FINANCIAL TRANSPARENCY
Sugar balance world*
* F.O. Licht estimates, August 2020
2018/19: Balanced market; significant decrease in production
2019/20e: Market in significant deficit(-5.3 mn t); further reduction in production below further growingconsumption EU below previous year‘s level
Brasil: Sugar production increase againstdecrease in ethanol production
India/Thailand:Significant production decrease
2020/21e: Market with further deficit(-2.4 mn t); despite expected increase in production, further decrease in endingstock
174,2 179,6194,2
184,7178,1 183,5179,6 180,2 182,6 183,0 181,3 184,4
71,3 69,278,9 79,0 73,7 71,3
2015/16 2016/17 2017/18 2018/19 2019/20e 2020/21e
39,7%* 38,4%* 43,2%* 43,2%* 40,6%* 38,7%*
Production Consumption Ending Stock * Stocks to use ratio

Südzucker Group, page 61
FINANCIAL TRANSPARENCY
Sugar price development: Supply and demand as main drivers
* World market price ex works: without transportation and other costs
0
100
200
300
400
500
600
700
800
2007 2008 2009 2010 2011 2012 2013 2014 2015 2016 2017 2018 2019 2020
World market price* EU price ex works
€/t

Südzucker Group, page 62
FINANCIAL TRANSPARENCY
Sugar balance EU* (in mn t)
* EU-Commission on basis SMY∎ Prod. (from beet) ∎ Prod. (from maize) ∎ Import ∎ Consumption ∎ Export ∎ Ending stocks
20.2 19.3 18.5 19.6 19.0 18.7
1.51.4
1.4
3.41.7
1.0
0
5
10
15
20
25
19.5
14.916.8
21.3
17.6 17.4
0.8
0.8
0.8
0.6
0.6 0.6
2.8
2.9
2.5
1.3
1.9 2.0
4.01.9 2.2 2.5 1.8 2.0
SMY 2017/18 Record harvest led to high
export surplus Increasing price pressure
during year burdenedannual contracts 2018/19
SMY 2018/19 Drought related lower
harvest leads to decrease in exports and lower inventory level
Spot price increase to import parity level
SMY 2019/20e Cultivation restriction and
drought lead to almost stable production and balanced market
Price increase for open annual contracts 2019/20
2014/15 2015/16 2016/17 2017/18 2018/19 2019/20e

Südzucker Group, page 63
FINANCIAL TRANSPARENCY
300
350
400
450
500
550
Average EU sugar price increases gradually
Campaign 2019e: Restricted cultivation area Sugar production ~ 17 mn t Gradual price increase
Campaign 2018: Drought, bad harvest Sugar production 17.6 mn t Lower exports, inventory decrease Price increase spot market Too late for contractual market EU net importer since campaign 2018
EU Spot PricesEU Price Reporting
Campaign 2020e: Further cultivation area decrease Sugar production 17-18 mn t Continued price increase EU remains also beyond
October 2020 net importer

Südzucker Group, page 64
FINANCIAL TRANSPARENCY
Sugar
optimum utilization of our multipurpose productionnetwork and our logistics network to reliably supply
customers with high-quality products
focus on European customers
strengthen market andcompetitive position through cost savings in production, logistics and administration
high loading of production capacities
through longcampaigns
market orientedorganization
maintain ourstrong relationships
with farmers
Sugar segment: Strategy

Südzucker Group, page 65
FINANCIAL TRANSPARENCY
Sugar segment: Outlook 2020/21
Again significant sales volume decrease Higher sales revenues
H1 with further loss Sales revenues increase in October in stable market
environment and first material cost savings fromrestructuring plan
Operating result in range -40 to +60 mn € (previous year: -236 mn €)
Significant revenue increase (previous year: 2,258 mn €)Revenues
Operating Result
If and to what extent the corona pandemic will impact H1 and our expectations for 2020/21 is currently not foreseeable
CoronaPandemic

Südzucker Group, page 66
FINANCIAL TRANSPARENCY
Agenda1. Overview and strategy page 3
2. Current highlights page 12
3. Financial Highlights Q1 2020/21 page 17
4. Capital Market and Financing page 25
5. Development non-sugar-activities page 30
6. Development segment sugar page 54
7. Outlook 2020/21 page 63
8. Appendix Long-term development and key figures page 69 Additional information page 77

Südzucker Group, page 67
FINANCIAL TRANSPARENCY
Outlook 2020/21 (I): Revenues and Operating result
Sugar
Revenues (€)
2019/20Operating result (€)
2020/21e
Special Products
CropEnergies
Fruit
Group
2019/20 2020/21e
2.3 bn -236 mn -40 to +60 mn
2.4 bn
819 mn
1.2 bn
6.7 bn
790 to 840 mn
6.9 to 7.2 bn
190 mn
104 mn
58 mn
116 mn
110 to 140 mn
300 to 400 mn

Südzucker Group, page 68
FINANCIAL TRANSPARENCY
Outlook 2020/21 (II): Other key figures
EBITDA
2019/20 2020/21e
Depreciation
InvestmentsFixed Assets
Net Financial Debt
478 mn € 660 to 760 mn €
362 mn € ~ prev. year
335 mn € ~ 300 mn €
1,570 mn € < prev. year

Südzucker Group, page 69
FINANCIAL TRANSPARENCY
Outlook 2020/21 (III): Other key figures
RoCE
2019/20 2020/21e
Cash flow/ Revenues
Equity ratio
1.8 %
5.6 % > 5 %
43.6 % > prev. year

Südzucker Group, page 70
FINANCIAL TRANSPARENCY
Summary (I) Expected difficult transition years concluded H2 2020/21 with earnings improvement in light of price increase from
October 2020 and cost savings FY 2020/21e: Operating result -40 to +60 mn € (prev. year: -236 mn €)
FY 2020/21e: Moderate revenues and operating result increase(operating result prev. year: 58 mn €)
Further increase in production and sales volumes FY 2020/21e: Operating result on high prior year‘s level
(prev. year: 190 mn €); high cash flow quality
Fundamental further positive ethanol market environment FY 2020/21e: Operating result 110 to 140 mn € (prev. year: 104 mn €)
Well diversified portfolio High cash flow quality and solid financial key figures Overall successful start into 2020/21 Sustainable deleverage phase started Significant earnings improvement expected with and without corona effects
Sugar
Special Products
CropEnergies
Fruit
Group

Südzucker Group, page 71
FINANCIAL TRANSPARENCY
EBITDASugar
2018/19 2020/21e
EBITDANon-Sugar
EBITDAGroup
Capex
-102
455
379 ~ 300
Summary (II)(in mn €)
2019/20
-75
553
353 660 to 760478
335
Deleverage phase initiated in 2020/21

Südzucker Group, page 72
FINANCIAL TRANSPARENCY
Agenda1. Overview and strategy page 3
2. Current highlights page 12
3. Financial Highlights Q1 2020/21 page 17
4. Capital Market and Financing page 25
5. Development non-sugar-activities page 30
6. Development segment sugar page 54
7. Outlook 2020/21 page 63
8. Appendix Long-term development and key figures page 69 Additional information page 77

Südzucker Group, page 73
FINANCIAL TRANSPARENCY
(mn €) 2010/11 2011/12 2012/13 2013/14 2014/15 2015/16 2016/17 2017/18 2018/19 2019/20 2020/21e
Revenues 6.161 6.992 7.879 7.533 6.778 6.387 6.476 6.983 6.754 6.671 6.9-7.2 bnEBITDA 775 1.015 1.246 889 453 518 709 758 353 478 660-760
EBITDA-Margin 12,6% 14,5% 15,8% 11,8% 6,7% 8,1% 10,9% 10,8% 5,2% 7,2%Operating Result 521 751 972 622 181 241 426 445 27 116 300-400
Operating Margin 8,5% 10,7% 12,3% 8,3% 2,7% 3,8% 6,6% 6,4% 0,4% 1,7%Income from operations (EBIT) 513 759 955 554 159 277 441 467 -761 48Earnings before income taxes (EBT) 443 660 866 491 127 227 407 426 -784 9Net earnings 346 515 734 387 74 181 312 318 -805 -55
thereof to SZ AG shareholders 252 377 592 280 20 109 214 205 -844 -122
Market capitalization 3.768 4.117 6.850 4.114 2.782 3.834 4.921 3.014 2.625 2.873Closing price on February 28/29 19,90 21,75 33,55 20,15 13,63 13,88 24,10 14,76 12,86 14,07Earnings per share (€) 1,33 1,99 3,08 1,37 0,10 0,53 1,05 1,00 -4,14 -0,60Dividend per share (€) 0,55 0,70 0,90 0,50 0,25 0,30 0,45 0,45 0,20 0,20
Cash flow 606 823 996 697 389 480 634 693 377 372Investments total 251 286 521 399 387 371 493 793 394 348 ~300
Capital Employed 5.314 5.707 5.950 5.873 5.877 5.791 6.012 6.650 6.072 6.388 ~ prev. yearRoCE 9,8% 13,2% 16,3% 10,6% 3,1% 4,2% 7,1% 6,7% 0,4% 1,8%
Total Assets 7.260 8.289 8.806 8.663 8.474 8.133 8.736 9.334 8.188 8.415Equity 3.687 3.970 4.731 4.625 4.461 4.473 4.888 5.024 4.018 3.673Equity Ratio 50,8% 47,9% 53,7% 53,4% 52,6% 55,0% 56,0% 53,8% 49,1% 43,6% > prev. yearNet Financial Debt (NFD) 854 791 464 536 593 555 413 843 1.129 1.570 < prev. yearGearing (NFD/Equity) 23,2% 19,9% 9,8% 11,6% 13,3% 12,4% 8,4% 16,8% 28,1% 42,7%NFD/Cash flow 1,4x 1,0x 0,5x 0,8x 1,5x 1,2x 0,7x 1,2x 3,0x 4,2x
Long-term development (I): Group
* Investments in Fixed Assets
*
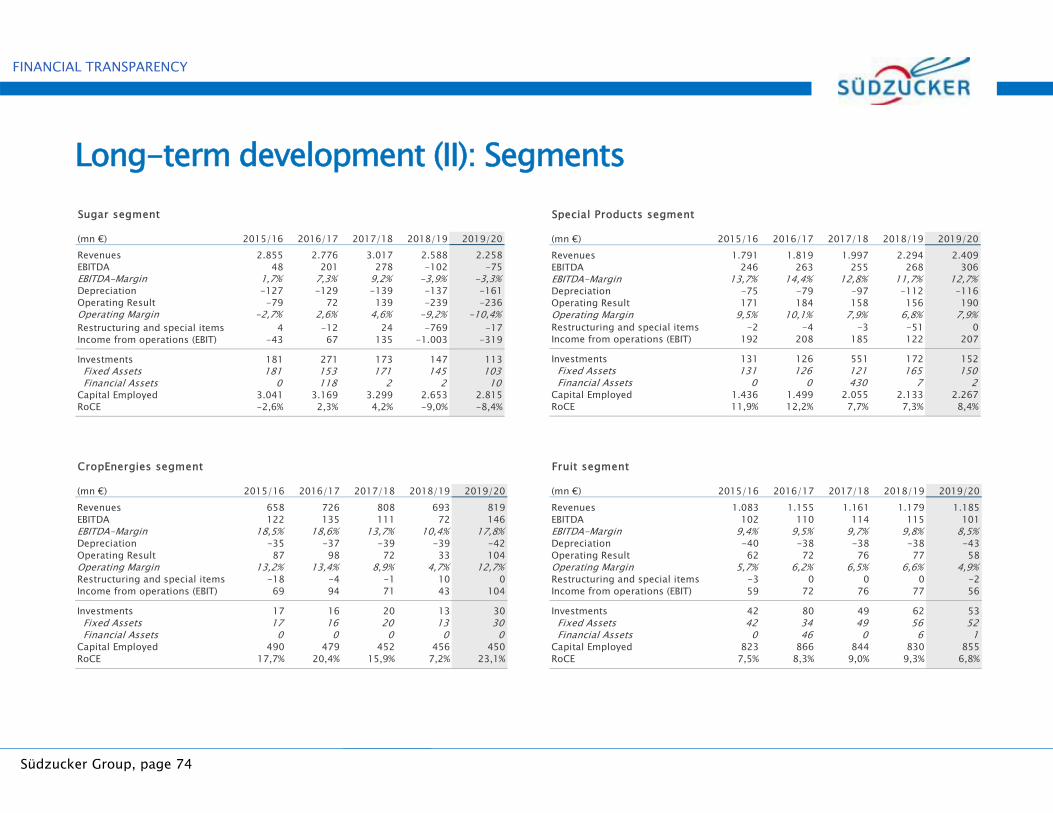
Südzucker Group, page 74
FINANCIAL TRANSPARENCY
Long-term development (II): SegmentsSugar segment
(mn €) 2015/16 2016/17 2017/18 2018/19 2019/20Revenues 2.855 2.776 3.017 2.588 2.258EBITDA 48 201 278 -102 -75EBITDA-Margin 1,7% 7,3% 9,2% -3,9% -3,3%Depreciation -127 -129 -139 -137 -161Operating Result -79 72 139 -239 -236Operating Margin -2,7% 2,6% 4,6% -9,2% -10,4%Restructuring and special items 4 -12 24 -769 -17Income from operations (EBIT) -43 67 135 -1.003 -319
Investments 181 271 173 147 113Fixed Assets 181 153 171 145 103Financial Assets 0 118 2 2 10
Capital Employed 3.041 3.169 3.299 2.653 2.815RoCE -2,6% 2,3% 4,2% -9,0% -8,4%
Special Products segment
(mn €) 2015/16 2016/17 2017/18 2018/19 2019/20Revenues 1.791 1.819 1.997 2.294 2.409EBITDA 246 263 255 268 306EBITDA-Margin 13,7% 14,4% 12,8% 11,7% 12,7%Depreciation -75 -79 -97 -112 -116Operating Result 171 184 158 156 190Operating Margin 9,5% 10,1% 7,9% 6,8% 7,9%Restructuring and special items -2 -4 -3 -51 0Income from operations (EBIT) 192 208 185 122 207
Investments 131 126 551 172 152Fixed Assets 131 126 121 165 150Financial Assets 0 0 430 7 2
Capital Employed 1.436 1.499 2.055 2.133 2.267RoCE 11,9% 12,2% 7,7% 7,3% 8,4%
CropEnergies segment
(mn €) 2015/16 2016/17 2017/18 2018/19 2019/20Revenues 658 726 808 693 819EBITDA 122 135 111 72 146EBITDA-Margin 18,5% 18,6% 13,7% 10,4% 17,8%Depreciation -35 -37 -39 -39 -42Operating Result 87 98 72 33 104Operating Margin 13,2% 13,4% 8,9% 4,7% 12,7%Restructuring and special items -18 -4 -1 10 0Income from operations (EBIT) 69 94 71 43 104
Investments 17 16 20 13 30Fixed Assets 17 16 20 13 30Financial Assets 0 0 0 0 0
Capital Employed 490 479 452 456 450RoCE 17,7% 20,4% 15,9% 7,2% 23,1%
Fruit segment
(mn €) 2015/16 2016/17 2017/18 2018/19 2019/20Revenues 1.083 1.155 1.161 1.179 1.185EBITDA 102 110 114 115 101EBITDA-Margin 9,4% 9,5% 9,7% 9,8% 8,5%Depreciation -40 -38 -38 -38 -43Operating Result 62 72 76 77 58Operating Margin 5,7% 6,2% 6,5% 6,6% 4,9%Restructuring and special items -3 0 0 0 -2Income from operations (EBIT) 59 72 76 77 56
Investments 42 80 49 62 53Fixed Assets 42 34 49 56 52Financial Assets 0 46 0 6 1
Capital Employed 823 866 844 830 855RoCE 7,5% 8,3% 9,0% 9,3% 6,8%

Südzucker Group, page 75
FINANCIAL TRANSPARENCY
NFD/CF 3.2x 1.9x 1.4x 1.0x 1.5x 1.2x 0.7x 1.2x 0.7x 1.2x 3.0x 4.2x
Equity Ratio 42 % 47 % 51 % 48 % 54 % 53 % 53 % 55 % 56 % 54 % 49 % 44 %
1,632
1,065
854791
464536
593 555
413
843
1,129
1,570
504553
606
823
996
697
389480
634693
377 372
mn
€
Net Financial Debt
Cash flow
Financial key figures

Südzucker Group, page 76
FINANCIAL TRANSPARENCY
Maturity profile of main financial liabilities(as of31 July 2020)
Hybrid Bond 2005/perpetual, 700 mn € Issuer call right since 30 June 2015 at the earliest. Pursuant to § 6 (5) and (6) of conditions of issue
the exercise of the call right is subject to having issued, within the twelve months preceding the redemption becoming effective, replacement capital (parity and/or junior securities and/or shares) against issue proceeds at least equal to the amounts payable upon redemption.
Perpetual
Commercial Paper-Program, permanent, 600 mn € Drawn lines: 155 mn €
Bullet loans, 220 mn €
1.25 % Bond 2016/2023, 300 mn €
AGRANA promissory notes, 200 mn €
1.00 % Bond 2017/2025, 500 mn €
Syndicated loans, 1.050 mn € Drawn lines: 170 mn €2021/22/25
Nov 2022/25/26
Nov 2023
2024/26/29
Nov 2025
Perpetual
Perpetual

Südzucker Group, page 77
FINANCIAL TRANSPARENCY
Hybrid bond: Cash flow covenant
Options for hybrid bond 2005 (depending on continuous financial planning): Since 30 June 2015: quarterly variable interest payment, 3M Euribor plus 3.10 % p.a. Period from 30 June 2020 to 30 September 2020 (excl.), rate of remuneration fixed at 2.697 % p.a. Since 30 June 2015, bond can be called and redeemed on quarterly basis at nominal value
(according to § 6 (5) & (6) of the terms and conditions) Precondition to use issuer call right is replacement through new hybrid or equity capital
within 12 months A bond repurchase – also partially – is possible at any time Still preferred option: No call of hybrid bond
(mn €) 2010/11 2011/12 2012/13 2013/14 2014/15 2015/16 2016/17 2017/18 2018/19 2019/20 2020/21e
Revenues 5,718 6,161 6,992 7,879 7,533 6,778 6,387 6,476 6,983 6,671 6.9-7.2
Cash flow / Revenues 9.8% 11.8% 12.6% 9.3% 5.7% 7.5% 9.8% 9.9% 5.6% 5.6% > 5%

Südzucker Group, page 78
FINANCIAL TRANSPARENCY
Liquidity profile end of period(mn €) Q1 2020/21 Q4 2019/20 Q3 2019/20 Q2 2019/20 Q1 2019/20
Net financial debt -1.431 -1.570 -1.359 -1.226 -1.240
Cash & Cash equivalents / securities 494 484 511 557 552
Gross financial debt -1.925 -2.054 -1.870 -1.783 -1.791
Long-term financial debt -1.325 -1.332 -1.344 -1.310 -1.121
Short-term financial debt -470 -596 -402 -344 -539
Leasing -130 -126 0 0 0
Bank credit l ines 797 767 752 751 811undrawn 251 242 323 305 298
Syndicated loan 600 600 600 600 600undrawn 450 600 600 600 600
Syndicated loan Agrana 450 450 450 450 450undrawn 430 370 405 385 340
Commercial paper program 600 600 600 600 600undrawn 515 270 360 470 370
Bank credit l ines (undrawn) 251 242 323 305 298+ Cash & cash equivalents / securities 494 484 511 557 552+ Syndicated loan (undrawn) 880 970 1.005 985 940+ Commercial paper (undrawn) 515 270 360 470 370= Total l iquidity reserves 2.140 1.966 2.200 2.317 2.160

Südzucker Group, page 79
FINANCIAL TRANSPARENCY
Group balance sheet
(mn €)Intangible assets 1.001 11,9% 1.001 12,2%Fixed assets 3.061 36,4% 2.951 36,0%Shares in companies consolidated at equity 313 3,7% 390 4,8%Other investments and loans 20 0,2% 23 0,3%Securities 20 0,2% 19 0,2%Receivables and other assets 15 0,2% 13 0,2%Deferred tax assets 74 0,9% 75 0,9%Non-current assets 4.504 53,5% 4.471 54,6%
Inventories 2.176 25,9% 1.977 24,1%Trade receivables and other assets 1.242 14,8% 1.230 15,0%Current tax receivables 28 0,3% 31 0,4%Securities 268 3,2% 332 4,1%Cash and cash equivalents 197 2,3% 148 1,8%Current assets 3.911 46,5% 3.717 45,4%
Total assets 8.415 100,0% 8.188 100,0%
29.02.2020 28.02.2019 (mn €)Equity attributable to shareholders of SZ AG 2.127 25,3% 2.476 30,2%Hybrid capital 654 7,8% 654 8,0%Other minority interest 892 10,6% 889 10,9%Shareholder's equity 3.673 43,6% 4.018 49,1%
Provisions for pensions and similar obligations 1.002 11,9% 832 10,2%Other provisions 242 2,9% 246 3,0%Financial liabilities 1.429 17,0% 1.126 13,8%Other liabilities 10 0,1% 14 0,2%Tax liabilities 13 0,2% 23 0,3%Deferred tax liabilities 146 1,7% 159 1,9%Non-current liabilities 2.842 33,8% 2.398 29,3%
Other provisions 120 1,4% 148 1,8%Financial liabilities 625 7,4% 501 6,1%Trade payables and other liabilities 1.140 13,6% 1.104 13,5%Current tax liabilities 15 0,2% 18 0,2%Current liabilities 1.900 22,6% 1.771 21,6%
Total liabilities and shareholders' equity 8.415 100,0% 8.188 100,0%
29.02.2020 28.02.2019

Südzucker Group, page 80
FINANCIAL TRANSPARENCY
Agenda1. Overview and strategy page 3
2. Current highlights page 12
3. Financial Highlights Q1 2020/21 page 17
4. Capital Market and Financing page 25
5. Development non-sugar-activities page 30
6. Development segment sugar page 54
7. Outlook 2020/21 page 63
8. Appendix Long-term development and key figures page 69 Additional information page 77

Südzucker Group, page 81
FINANCIAL TRANSPARENCY
Revenues by region 2019/20Germany
(22 %)
EU 28(53 %)
Rest of world(25 %)
6,671 mn €
Revenues share financial year 2019/20 by region in %:EU 28: EU-members (excl. Germany, incl. Great Britain)Rest of the world: Europe (outside EU), America, Africa, Asia, Oceania

Südzucker Group, page 82
FINANCIAL TRANSPARENCY
‐15
‐10
‐5
0
5
10
15
0
50
100
150
200
250
Surplus/Defict (right scale) Total Production (left scale) Consumption (left scale)
World sugar market – unchanged sustainable growth*
* Source: F.O. Licht

Südzucker Group, page 83
Only countries with deficits/surpluses above 500k tonnes are marked (2020/21e)
Global sugar market: Supply and demand
Egypt-1.4
Brasil+26.4
Canada-1.2
USA-3.1
Mexico+1.3
Guatemala+2.1
Colombia+0.6
Surplus areas/countries
Deficit areas/countries
Marocco-0.6
Nigeria-1.8
Australia+3.5
Sudan-1.2
Japan-1.2
S. Korea-1.6
Algeria-2.0
Syria-0.6
Saudi Arabia-1.3
Bangla-desh-2.5 Malaysia
-1.8 Indonesia-5.4
China-4.7
Israel-0.6
Thailand+4.6
Taiwan-0.6
India+5.0
France+2.5
Italia-1.7
Germany+1.1
U.K.-0.6 Poland
+0.8
Kenia-0.7
Cuba+0.7
Source: F.O. Licht
Vietnam-0.7
Pakistan-1.0
Chile-0.5
Netherlands+0.5
Russia+1.1
Swaziland+0.8
South Africa+0.7
Spain-1.1

Südzucker Group, page 84
FINANCIAL TRANSPARENCY
EU sugar balance
mn t 09/10 10/11 11/12 12/13 13/14 14/15 15/16 16/17 17/18 18/19 Ø 10years 19/20e
Production EU 18.2 16.2 19.4 18.1 17.6 20.3 15.7 17.6 21.9 18.2 18.3 18.0
• from beet 17.5 15.4 18.7 17.4 16.8 19.5 14.9 16.8 21.3 17.6 17.6 17.4
• from maize 0.7 0.7 0.7 0.7 0.7 0.8 0.8 0.8 0.6 0.6 0.7 0.6
Import 2.5 3.6 3.5 3.7 3.2 2.8 2.9 2.5 1.3 1.9 2.8 2.0
• Import whitesugar 0.6 1.1 0.8 1.0 0.8 0.7 0.7 0.8 0.3 0.6 0.7 n.a.
• EU refining ofimported rawsugar
1.9 2.5 2.7 2.7 2.4 2.1 2.2 1.7 1.0 1.3 2.1 n.a.
Export 2.2 0.8 2.1 1.4 1.4 1.5 1.4 1.4 3.4 1.7 1.7 1.0
Consumption 18.9 19.4 19.6 19.6 20.0 20.2 19.3 18.5 19.6 19.0 19.4 18.7
Ending stock 1.6 1.2 2.4 3.2 2.6 4.0 1.9 2.2 2.5 1.8 2.3 2.0
Source: EU-Commission

Südzucker Group, page 85
FINANCIAL TRANSPARENCY
Ranking global sugar market (I)
Top-producer 2020/21ein mn t
2020/21ein %
∅ 10 years in mn t Top-consumer 2020/21e
in mn t2020/21e
in %∅ 10 years
in mn t
Brazil 37.8 20.4 37.0 India 28.5 15.4 27.0
India 34.0 18.4 29.6 EU 16.4 8.8 16.8
EU 17.3 9.4 16.9 China 16.2 8.7 16.2
China 11.5 6.2 11.8 Brazil 11.7 6.3 11.9
USA 8.0 4.4 8.0 USA 11.1 6.0 10.9
Thailand 7.6 4.1 11.0 Indonesia 8.0 4.3 7.0
Russia 7.0 3.8 6.2 Russia 6.4 3.5 6.2
Mexico 5.8 3.1 6.2 Pakistan 6.2 3.3 5.4
Pakistan 5.3 2.9 5.9 Mexico 4.5 2.4 4.7
Australia 4.4 2.6 4.6 Egypt 4.3 2.3 3.7
Others 45.7 24.7 44.2 Others 72.2 38.9 69.1
Total 184.7 100 181.4 Total 185.5 100 178.9
Source: F.O. Licht

Südzucker Group, page 86
FINANCIAL TRANSPARENCY
Ranking global sugar market (II)
Top-net-exporter 2020/21ein mn t
2020/21ein %
∅ 10 years in mn t Top-net-importer 2020/21e
in mn t2020/21e
in %∅ 10 years
in mn t
Brazil 26.4 52.1 25.1 Indonesia 5.4 10.8 4.4
India 5.0 9.9 2.2 China 4.7 9.3 4.4
Thailand 4.6 9.1 7.6 USA 3.1 6.1 3.0
Australia 3.5 6.9 3.4 Bangladesh 2.5 5.0 2.2
Guatemala 2.1 4.1 2.0 Algeria 2.0 4.0 1.6
Mexico 1.3 2.6 1.5 Malaysia 1.8 3.7 1.8
Russia 1.1 2.2 -0.1 Nigeria 1.8 3.5 1.6
EU* 0.9 1.8 -0.3 Korea, South 1.6 3.2 1.5
South Africa 0.7 1.5 0.2 Egypt 1.4 2.8 1.3
Cuba 0.7 1.3 0.8 Saudi Arabia 1.3 2.6 1.2
Others 4.4 8.6 - Others 24.5 49.0 -
Total 50.7 100 - Total 50.0 100 -
Source: F.O. Licht*incl. import/export of processed goods

Südzucker Group, page 87
FINANCIAL TRANSPARENCY
Sugar segment: Production and Distribution*
* Display financial year 2019/20
Distribution activitiesBeet sugar factoriesSugar refineries
Poland
France
Germany
Spain
Portugal
Greece
Italy
Autstria
CzechRepublic
RomaniaHungary
SlovakiaMoldova
Bulgaria
Ireland
Great Britain
Bosnia/Herze-govina
Nether-lands
Belgium
Israel

Südzucker Group, page 88
FINANCIAL TRANSPARENCY
Participation in ED&F Man offers a global footprint Participation ~ 35 % Long standing history (founded 1783) Truely global footprint (~ 5,500 employees
in more than 50 countries) Beneficiary of long-term growth in global
sugar demand One of the largest sugar trader with significant
presence in Central and South America, Far East, South East Asia and Africa
Global agribusiness with leadership positions in the merchanting of sugar, coffee, animal feed, pulses, molasses and liquid products (MLP). Further activities in brokerage / financial services.
Proposition alongside of supply chain, like sourcing, processing, logistics of agricultural products
Focus on core trading businesses and supply chain assets, divestent of non core businesses

Südzucker Group, page 89
FINANCIAL TRANSPARENCY
Segment Sugar: Campaign
09/10 10/11 11/12 12/13 13/14 14/15 15/16 16/17 17/18 18/19 19/20
Beet acreage 401,000 388,000 412,000 422,000 396,000 405,000 350,000 385,000 445,000 434,000 391,000
Sugar factories (incl. refineries) 32 32 32 32 32 32 31 31** 31** 31** 30**
Beet processing* 28.4 26.1 31.3 28.7 27.2 34.0 23.7 28.6 36.0 29.3 28.4
Campaignduration 116 103 123 112 102 127 89 107 133 115 114
Sugar production* 4.8 4.2 5.4 4.9 4.7 5.3 4.1 4.7 5.9 4.7 4.5
thereof from beets* 4.4 3.9 4.9 4.5 4.3 5.0 3.8 4.4 5.7 4.6 4.3
thereof raw sugar raffination*
0.4 0.3 0.5 0.4 0.5 0.3 0.4 0.2 0.2 0.1 0.2
*in mn t**incl. 2 refineries

Südzucker Group, page 90
FINANCIAL TRANSPARENCY
Price development for raw and white sugar (ICE US, LIFFE)
100
200
300
400
500
600
700
Jan-
14
May
-14
Sep-
14
Jan-
15
May
-15
Sep-
15
Jan-
16
May
-16
Sep-
16
Jan-
17
May
-17
Sep-
17
Jan-
18
May
-18
Sep-
18
Jan-
19
May
-19
Sep-
19
Jan-
20
May
-20
Sep-
20
Quo
tatio
n fo
r sug
ar in
€ /
ton
White sugar contract No. 5 LIFFE London (Future contract switching upon expiry)
Raw sugar contract No. 11 ICE US (Future contract switching upon expiry)
100
200
300
400
500
600
700
Feb-
11
Feb-
12
Feb-
13
Feb-
14
Feb-
15
Feb-
16
Feb-
17
Feb-
18
Feb-
19
Feb-
20
Quo
tatio
n fo
r sug
ar in
€ /
ton

Südzucker Group, page 91
FINANCIAL TRANSPARENCY
Price development wheat and maize (Euronext)
100
120
140
160
180
200
220
240
260
280
300
Jan-
14
May
-14
Sep-
14
Jan-
15
May
-15
Sep-
15
Jan-
16
May
-16
Sep-
16
Jan-
17
May
-17
Sep-
17
Jan-
18
May
-18
Sep-
18
Jan-
19
May
-19
Sep-
19
Jan-
20
May
-20
Sep-
20
€ /
ton
Wheat price (Future contract switching upon expiry)Price for maize (Future contract switching upon expiry)
100
120
140
160
180
200
220
240
260
280
300
Feb-
11
Feb-
12
Feb-
13
Feb-
14
Feb-
15
Feb-
16
Feb-
17
Feb-
18
Feb-
19
Feb-
20
€ /
ton

Südzucker Group, page 92
FINANCIAL TRANSPARENCY
This presentation contains forward looking statements. The statements are based on current assumptions and estimates made by the executive board and information currently available to its members. The forward looking statements are not to be viewed as guarantees of the future developments and results presented therein. Future developments and results are in fact dependent on a variety of factors and are subject to various risks and imponderables. They are based on assumptions that could in fact prove to be invalid. The risk management report in the 2019/20 annual report on pages 92 to 101 presents an overview of the risks. We assume no obligation to update the forward-looking statements made in this presentation.
This presentation includes percentage and number rounding. Typing and printing errors reserved.
Written and visual value statements are standardized as follows:
Disclaimer
± 1%stable
/± 4-10%moderate
/> ± 10%significant
/± 1-4%slight

Südzucker Group, page 93
FINANCIAL TRANSPARENCY
Contact
Nikolai BaltruschatHead of Investor RelationsTel.: +49 (621) 421 – [email protected]
Bernhard JuretzekManager Investor RelationsTel.: +49 (621) 421 – [email protected]
Sandra KochnerAssistantTel.: +49 (621) 421 – [email protected]
Südzucker AGMaximilianstrasse 1068165 Mannheim, [email protected]
Financial calender
8 October 2020Q2 – 1st half year report 2020/21
14 January 2021Q3 – Quarterly Statement 2020/21
22 April 2021Preliminary figures financial year 2020/21
20 May 2021Press and analysts‘ conference fiscal 2020/21
8 July 2021Q1 – Quarterly Statement 2021/22
15 July 2021Annual general meeting for fiscal 2020/21
Investor Relations


