37
Berkshire Weekly COVID-19 Briefing 6 th October 2021 The information included in this briefing is correct at 6 th October 2021 10 am Berkshire East Public Health Hub
Berkshire Weekly COVID-19 Briefing
6th October 2021
The information included in this briefing is correct at
6th October 2021 10 am
Berkshire East Public Health Hub
Berkshire Weekly COVID-19 Briefing
This briefing has been produced to share the latest local COVID-19 information with a wider audience and includes:- Current information and surveillance- Key messages from the Directors of Public Health in Berkshire and the six
local authorities
Berkshire East Public Health Hub

Local information and communications
Berkshire East Public Health Hub
Latest News

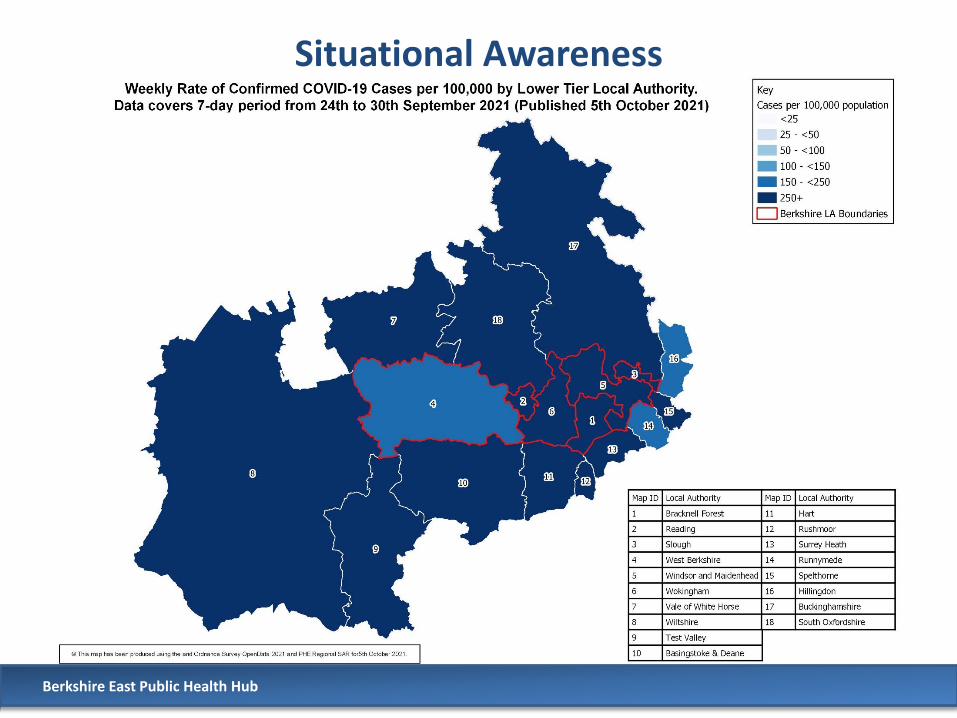
Situational Awareness
The latest Public Health England (PHE) Situational Awareness Report shows weekly case rates are increasing, with four of the six Berkshire LAs seeing an increase over the last week, reflecting most of the South East Region.
Situational Awareness indicators from 24th September to 30th September * in comparison to previous 7-day period
Source: PHE Regional South East Situational Awareness Report (5th October 2021)* Dates and figures refer to specimen date
The RAG ratings shown below reflect PHE’s thresholds for positivity and case rates. More information on these thresholds can be found at the end of this Briefing (slide 38).
Berkshire East Public Health Hub

Situational awarenessBerkshire’s current weekly rate is 303.7 per 100,000 population (24th – 30th September). This is a 3% increase on the week before and a 32% increase the week prior to that.
There has been a total of 97,852 confirmed cases of COVID-19 in Berkshire. 68% (67,017) of these cases have occurred since the beginning of January 2021.
Weekly rate of confirmed COVID-19 cases per 100,000 population (7-day rolling average)Data from the most recent 4 days have been excluded from the charts as these will be incomplete
Source: PHE Second Generation Surveillance System (SGSS)
Berkshire East Public Health Hub
Situational Awareness
Berkshire East Public Health Hub

Epidemiology of cases in Berkshire local authoritiesWeekly rate of confirmed COVID-19 cases per 100,000 population (7-day rolling average)Data from the most recent 4 days have been excluded from the charts as these will be incomplete
Source: PHE Second Generation Surveillance System (SGSS)
Berkshire East Public Health Hub

Epidemiology of cases in Berkshire local authoritiesOver the last 14 days (22nd September to 5th October 2021) there were 5,403 cases confirmed for Berkshire residents:• 4% of cases were confirmed through Pillar 1 testing and 96% through Pillar 2 testing• 54% were female and 46% male• Of the cases with an ethnicity recorded - 75% were from a White background and 25% were
from a BAME group• 51% of Berkshire cases were from people aged under 18, 10% in the 18 to 34 age group and
33% were from those aged 35 to 64. 5% were aged 65 and over.
Age breakdown of confirmed COVID-19 cases over the last 14 days (22nd September to 5th October 2021)
Source: PHE Second Generation Surveillance System (SGSS)
Berkshire East Public Health Hub
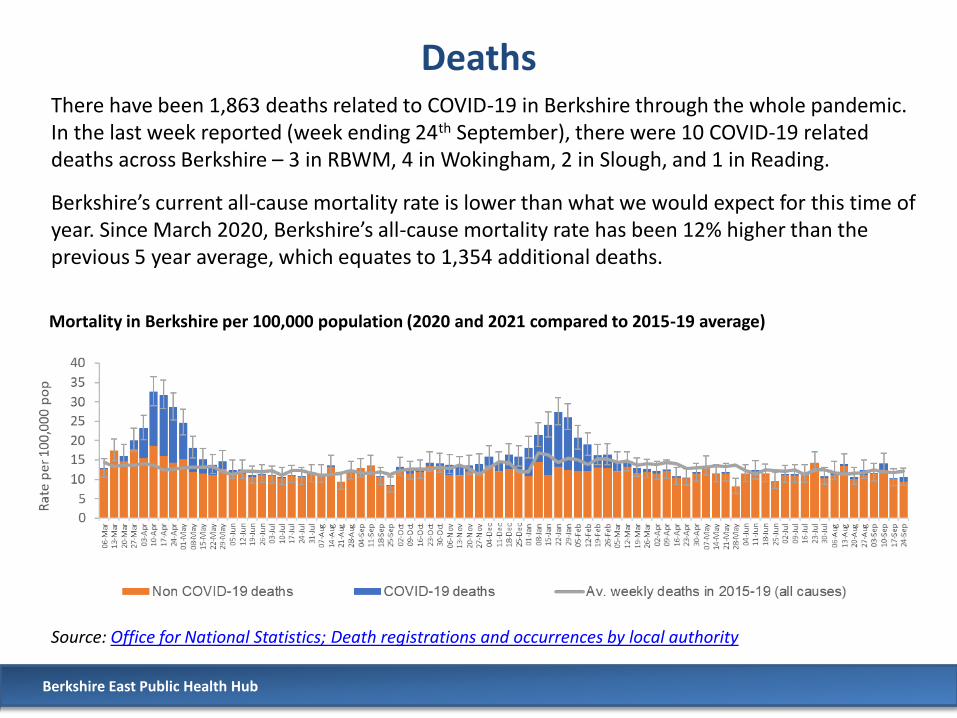
DeathsThere have been 1,863 deaths related to COVID-19 in Berkshire through the whole pandemic. In the last week reported (week ending 24th September), there were 10 COVID-19 related deaths across Berkshire – 3 in RBWM, 4 in Wokingham, 2 in Slough, and 1 in Reading.
Berkshire’s current all-cause mortality rate is lower than what we would expect for this time of year. Since March 2020, Berkshire’s all-cause mortality rate has been 12% higher than the previous 5 year average, which equates to 1,354 additional deaths.
Mortality in Berkshire per 100,000 population (2020 and 2021 compared to 2015-19 average)
Source: Office for National Statistics; Death registrations and occurrences by local authority
Berkshire East Public Health Hub
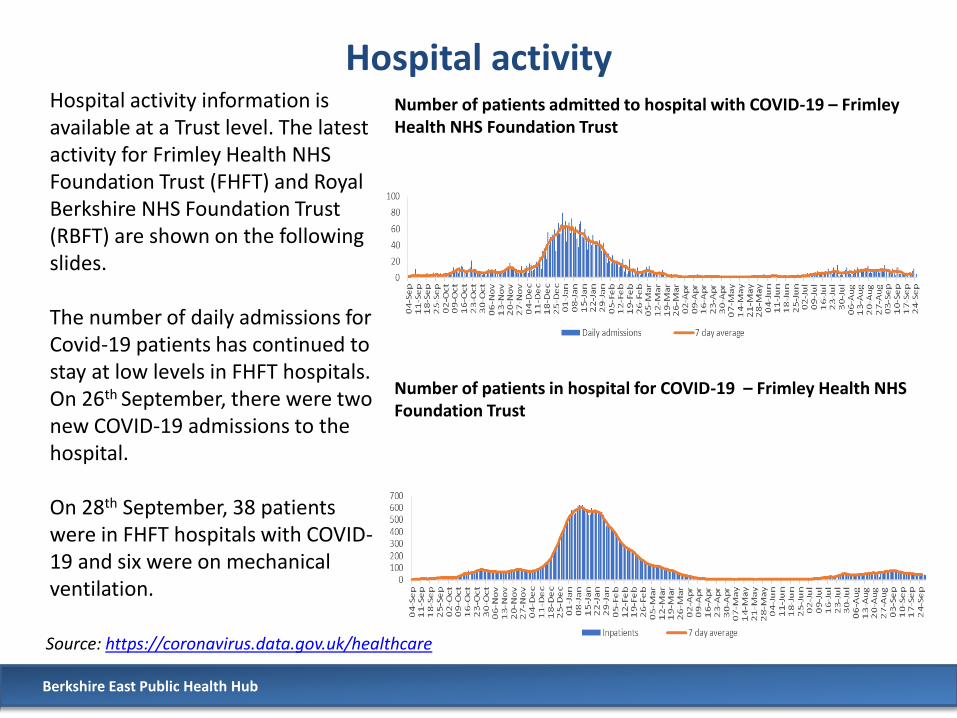
Hospital activityNumber of patients admitted to hospital with COVID-19 – Frimley Health NHS Foundation Trust
Number of patients in hospital for COVID-19 – Frimley Health NHS Foundation Trust
Source: https://coronavirus.data.gov.uk/healthcare
Hospital activity information is available at a Trust level. The latest activity for Frimley Health NHS Foundation Trust (FHFT) and Royal Berkshire NHS Foundation Trust (RBFT) are shown on the following slides.
The number of daily admissions for Covid-19 patients has continued to stay at low levels in FHFT hospitals. On 26th September, there were two new COVID-19 admissions to the hospital.
On 28th September, 38 patients were in FHFT hospitals with COVID-19 and six were on mechanical ventilation.
Berkshire East Public Health Hub
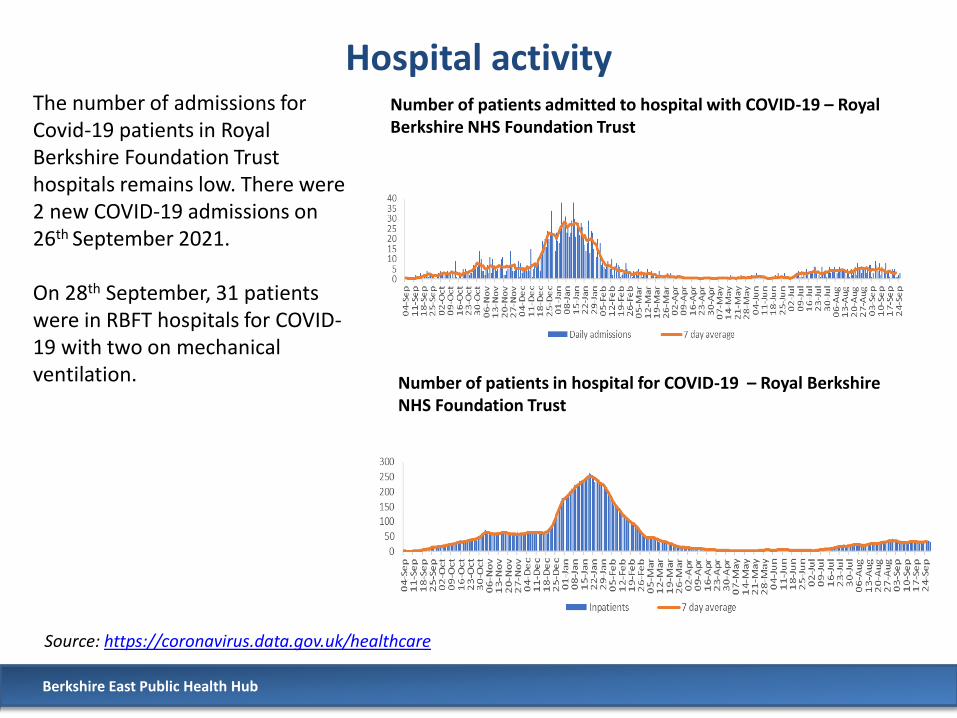
Hospital activityThe number of admissions for Covid-19 patients in Royal Berkshire Foundation Trust hospitals remains low. There were 2 new COVID-19 admissions on 26th September 2021.
On 28th September, 31 patients were in RBFT hospitals for COVID-19 with two on mechanical ventilation.
Number of patients admitted to hospital with COVID-19 – Royal Berkshire NHS Foundation Trust
Number of patients in hospital for COVID-19 – Royal BerkshireNHS Foundation Trust
Source: https://coronavirus.data.gov.uk/healthcare
Berkshire East Public Health Hub
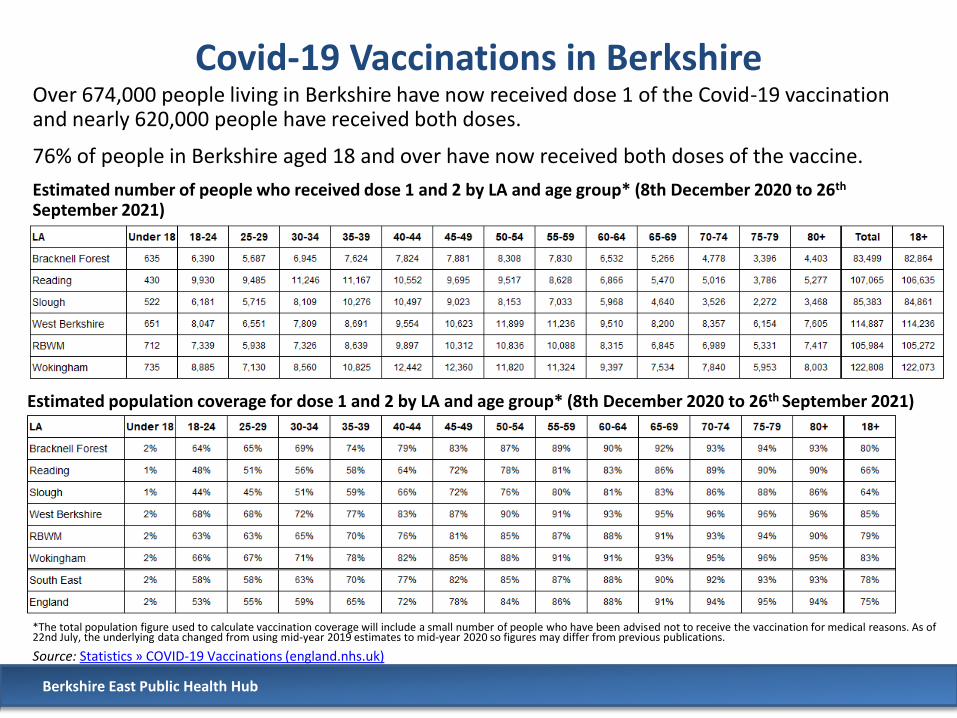
*The total population figure used to calculate vaccination coverage will include a small number of people who have been advised not to receive the vaccination for medical reasons. As of 22nd July, the underlying data changed from using mid-year 2019 estimates to mid-year 2020 so figures may differ from previous publications.
Source: Statistics » COVID-19 Vaccinations (england.nhs.uk)
Over 674,000 people living in Berkshire have now received dose 1 of the Covid-19 vaccination and nearly 620,000 people have received both doses.
76% of people in Berkshire aged 18 and over have now received both doses of the vaccine.
Estimated number of people who received dose 1 and 2 by LA and age group* (8th December 2020 to 26th
September 2021)
Covid-19 Vaccinations in Berkshire
Berkshire East Public Health Hub
Estimated population coverage for dose 1 and 2 by LA and age group* (8th December 2020 to 26th September 2021)

Bracknell Forest
Cases Bracknell Forest has had 12,761 confirmed cases of COVID-19 so far. Over the last 7 days (24th – 30th September) there has been 369 new cases of COVID-19.
The current weekly rate is 297.2 per 100,000 population, which is a 11% increase on the week before and a 53% increase on the week prior to that.
Bracknell Forest’s rate for people aged 60 and over has increased to 82.4 per 100,000 population over the last week.
Additional information by age and Electoral Ward are shown on the following slides.
Deaths There have been 197 COVID-19 related deaths during the pandemic. There were no new COVID-19 deaths recorded in the last week (week ending 24th
September 2021) for Bracknell Forest.
Since March 2020, Bracknell Forest’s all-cause mortality rate has been 9% higher than the previous 5 year average, which equates to 141 additional deaths.
Berkshire East Public Health Hub
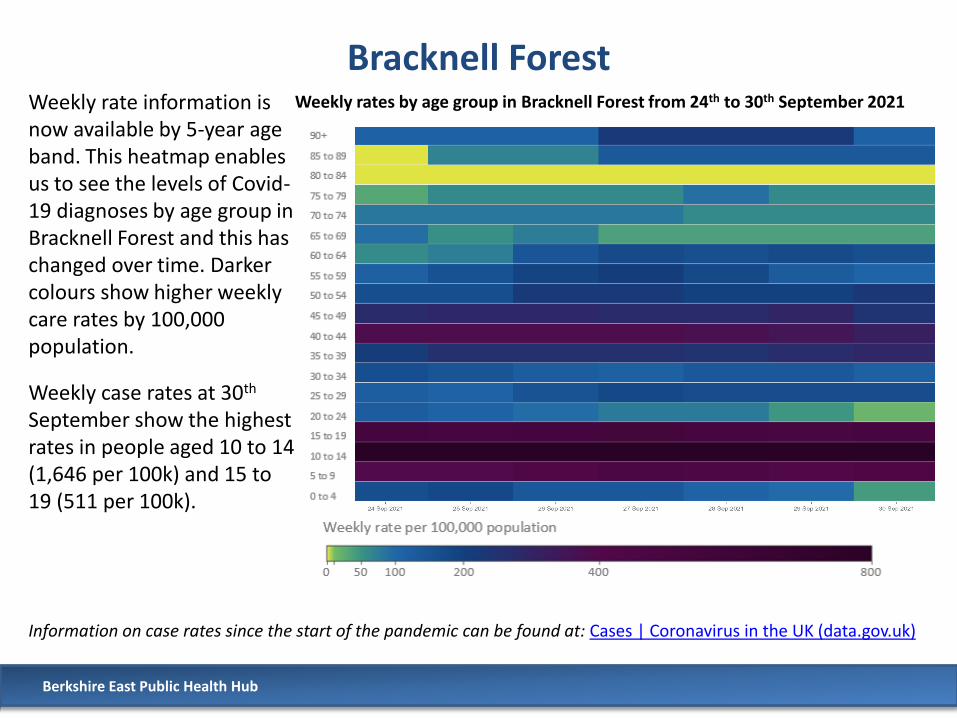
Bracknell ForestWeekly rate information is now available by 5-year age band. This heatmap enables us to see the levels of Covid-19 diagnoses by age group in Bracknell Forest and this has changed over time. Darker colours show higher weekly care rates by 100,000 population.
Weekly case rates at 30th
September show the highest rates in people aged 10 to 14 (1,646 per 100k) and 15 to 19 (511 per 100k).
Information on case rates since the start of the pandemic can be found at: Cases | Coronavirus in the UK (data.gov.uk)
Weekly rates by age group in Bracknell Forest from 24th to 30th September 2021
Berkshire East Public Health Hub

Bracknell Forest
To see case, rate and trend information at an MSOA-level, go to https://coronavirus.data.gov.uk/details/interactive-map
Berkshire East Public Health Hub
Reading
Cases Reading has had 19,217 confirmed cases of COVID-19 so far. Over the last 7 days (24th – 30th September) there has been 518 new cases of COVID-19.
The current weekly rate is 323.1 per 100,000 population, which is a 11% increase from last week and a 17% increase on the week before that.
Reading’s rate for people aged 60 and over has increased to 105.6 per 100,000 population over the last week.
Additional information by age and Electoral Ward are shown on the following slides.
Deaths There have been 337 COVID-19 related deaths during the pandemic. There was one new COVID-19 death recorded in the last week (week ending 24th
September 2021) in Reading.
Since March 2020, Reading’s all-cause mortality rate has been 19% higher than the previous 5 year average, which equates to 301 additional deaths. The highest excess mortality rate in Berkshire.
Berkshire East Public Health Hub

ReadingWeekly rate information is now available by 5-year age band. This heatmap enables us to see the levels of Covid-19 diagnoses by age group in Reading and this has changed over time. Darker colours show higher weekly care rates by 100,000 population.
Weekly case rates at 30th
September show the highest rates in people aged 10 to 14 (1,405 per 100k) and 15 to 19 (616 per 100k).
Information on case rates since the start of the pandemic can be found at: Cases | Coronavirus in the UK (data.gov.uk)
Weekly rates by age group in Reading from 24th to 30th September 2021
Berkshire East Public Health Hub

Reading
Cases and weekly rate per 100,000 population for the latest week (24th to 30th September 2021)
Total cases and total rates per 100,000 population (since Mar-20)
Source: PHE Second Generation Surveillance System (SGSS)
Berkshire East Public Health Hub
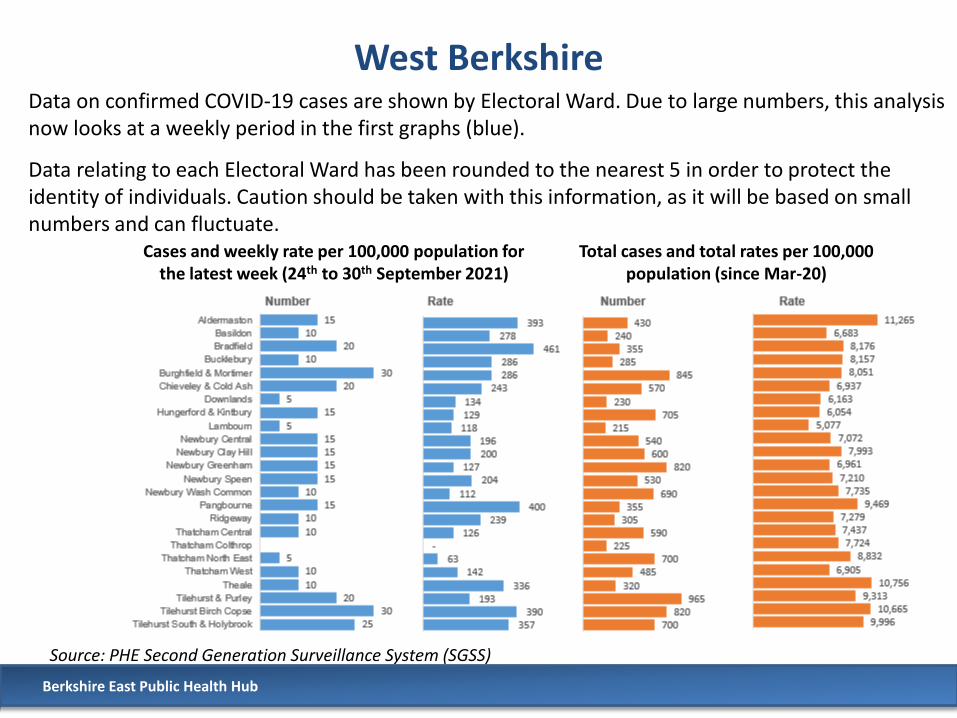
Data on confirmed COVID-19 cases are shown by Electoral Ward. Due to large numbers, this analysis now looks at a weekly period in the first graphs (blue).
Data relating to each Electoral Ward has been rounded to the nearest 5 in order to protect the identity of individuals. Caution should be taken with this information, as it will be based on small numbers and can fluctuate.

Reading
To see case, rate and trend information at an MSOA-level, go to https://coronavirus.data.gov.uk/details/interactive-map
Berkshire East Public Health Hub
Slough
Cases Slough has had 21,766 confirmed cases of COVID-19 so far. Over the last 7 days (24th – 30th September) there has been 462 new cases of COVID-19.
The current weekly rate is 308.9 per 100,000 population, which is a 4% increase from last week and a 24% increase on the week before that.
Slough’s rate for people aged 60 and over has decreased to 128.4 per 100,000 population over the last week.
Additional information by age and Electoral Ward are shown on the following slides.
Deaths There have been 369 COVID-19 related deaths during the pandemic. There was two new COVID-19 death recorded in the last week (week ending 24th
September 2021) in Slough.
Since March 2020, Slough’s all-cause mortality rate has been 16% higher than the previous 5 year average, which equates to 222 additional deaths.
Berkshire East Public Health Hub
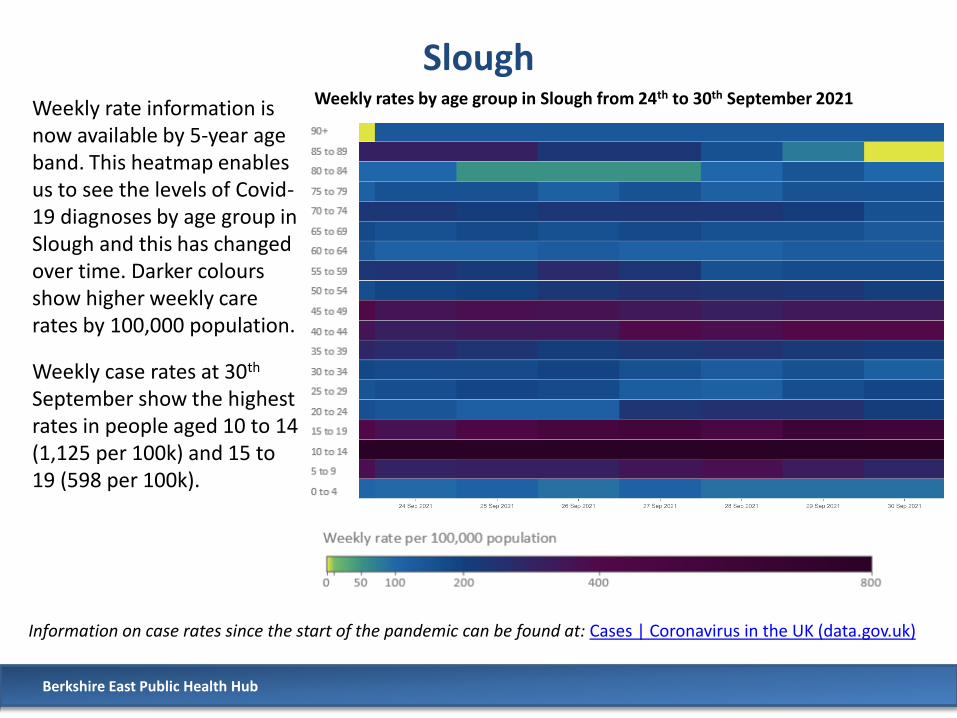
SloughWeekly rate information is now available by 5-year age band. This heatmap enables us to see the levels of Covid-19 diagnoses by age group in Slough and this has changed over time. Darker colours show higher weekly care rates by 100,000 population.
Weekly case rates at 30th
September show the highest rates in people aged 10 to 14 (1,125 per 100k) and 15 to 19 (598 per 100k).
Information on case rates since the start of the pandemic can be found at: Cases | Coronavirus in the UK (data.gov.uk)
Weekly rates by age group in Slough from 24th to 30th September 2021
Berkshire East Public Health Hub
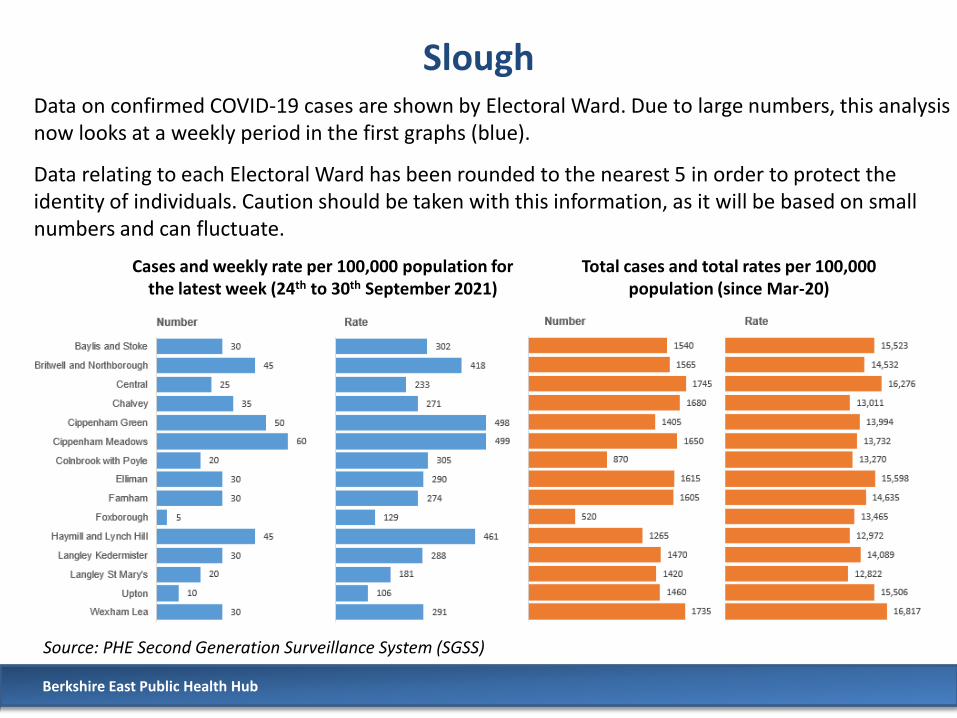
Slough
Cases and weekly rate per 100,000 population for the latest week (24th to 30th September 2021)
Total cases and total rates per 100,000 population (since Mar-20)
Source: PHE Second Generation Surveillance System (SGSS)
Berkshire East Public Health Hub
Data on confirmed COVID-19 cases are shown by Electoral Ward. Due to large numbers, this analysis now looks at a weekly period in the first graphs (blue).
Data relating to each Electoral Ward has been rounded to the nearest 5 in order to protect the identity of individuals. Caution should be taken with this information, as it will be based on small numbers and can fluctuate.

Slough
To see case, rate and trend information at an MSOA-level, go to https://coronavirus.data.gov.uk/details/interactive-map
Berkshire East Public Health Hub

West Berkshire
Cases West Berkshire has had 12,677confirmed cases of COVID-19 so far. Over the last 7 days (24th – 30th September) there has been 339 new cases of COVID-19.
The weekly rate is currently at 213.9 per 100,000 population, which is a 13% decrease from last week and a 38% increase on the week before that.
West Berkshire’s rate for people aged 60 and over has decreased to 68.3 per 100,000 population over the last week.
Additional information by age and Electoral Ward are shown on the following slides.
Deaths There have been 262 COVID-19 related deaths during the pandemic. No new COVID-19 related deaths have been recorded in the last week (week ending 24th September 2021) in West Berkshire.
Since March 2020, West Berkshire’s all-cause mortality rate has been 16% higher than the previous 5 year average, which equates to 296 additional deaths.
Berkshire East Public Health Hub

West BerkshireWeekly rate information is now available by 5-year age band. This heatmap enables us to see the levels of Covid-19 diagnoses by age group in West Berkshire and this has changed over time. Darker colours show higher weekly care rates by 100,000 population.
Weekly case rates at 30th
September show the highest rates in people aged 10 to 14 (935 per 100k) and 15 to 19 (329 per 100k). There were no cases in people aged 90 and over.
Information on case rates since the start of the pandemic can be found at: Cases | Coronavirus in the UK (data.gov.uk)
Weekly rates by age group in West Berkshire from 24th to 30th September 2021
Berkshire East Public Health Hub
West Berkshire
Cases and weekly rate per 100,000 population for the latest week (24th to 30th September 2021)
Total cases and total rates per 100,000 population (since Mar-20)
Source: PHE Second Generation Surveillance System (SGSS)
Berkshire East Public Health Hub
Data on confirmed COVID-19 cases are shown by Electoral Ward. Due to large numbers, this analysis now looks at a weekly period in the first graphs (blue).
Data relating to each Electoral Ward has been rounded to the nearest 5 in order to protect the identity of individuals. Caution should be taken with this information, as it will be based on small numbers and can fluctuate.

West Berkshire
To see case, rate and trend information at an MSOA-level, go to https://coronavirus.data.gov.uk/details/interactive-map
Berkshire East Public Health Hub
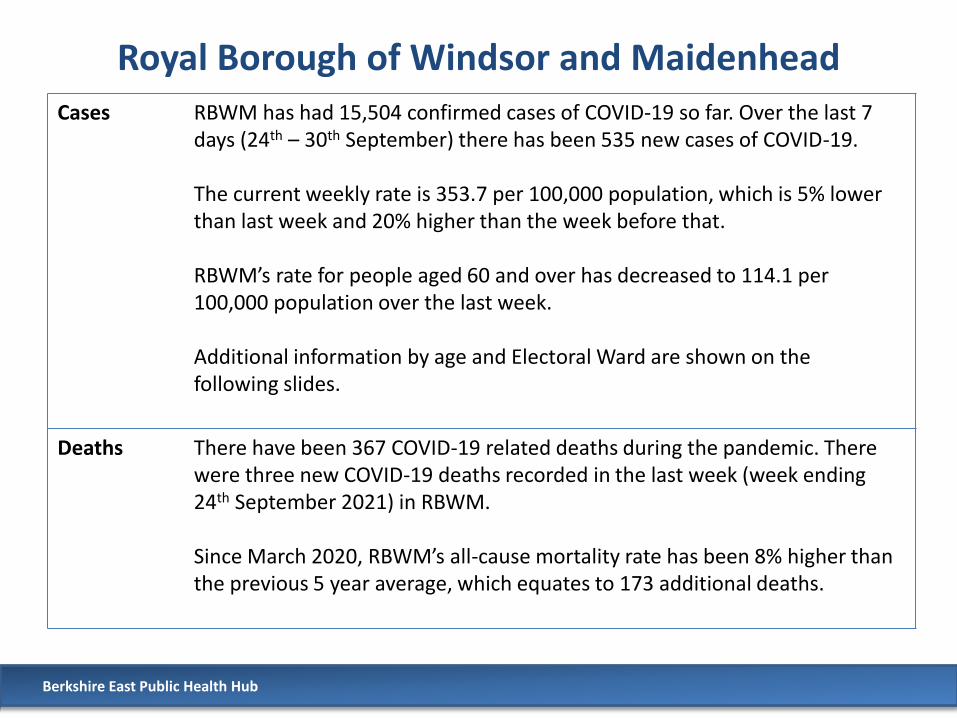
Royal Borough of Windsor and MaidenheadCases RBWM has had 15,504 confirmed cases of COVID-19 so far. Over the last 7
days (24th – 30th September) there has been 535 new cases of COVID-19.
The current weekly rate is 353.7 per 100,000 population, which is 5% lower than last week and 20% higher than the week before that.
RBWM’s rate for people aged 60 and over has decreased to 114.1 per 100,000 population over the last week.
Additional information by age and Electoral Ward are shown on the following slides.
Deaths There have been 367 COVID-19 related deaths during the pandemic. There were three new COVID-19 deaths recorded in the last week (week ending 24th September 2021) in RBWM.
Since March 2020, RBWM’s all-cause mortality rate has been 8% higher than the previous 5 year average, which equates to 173 additional deaths.
Berkshire East Public Health Hub
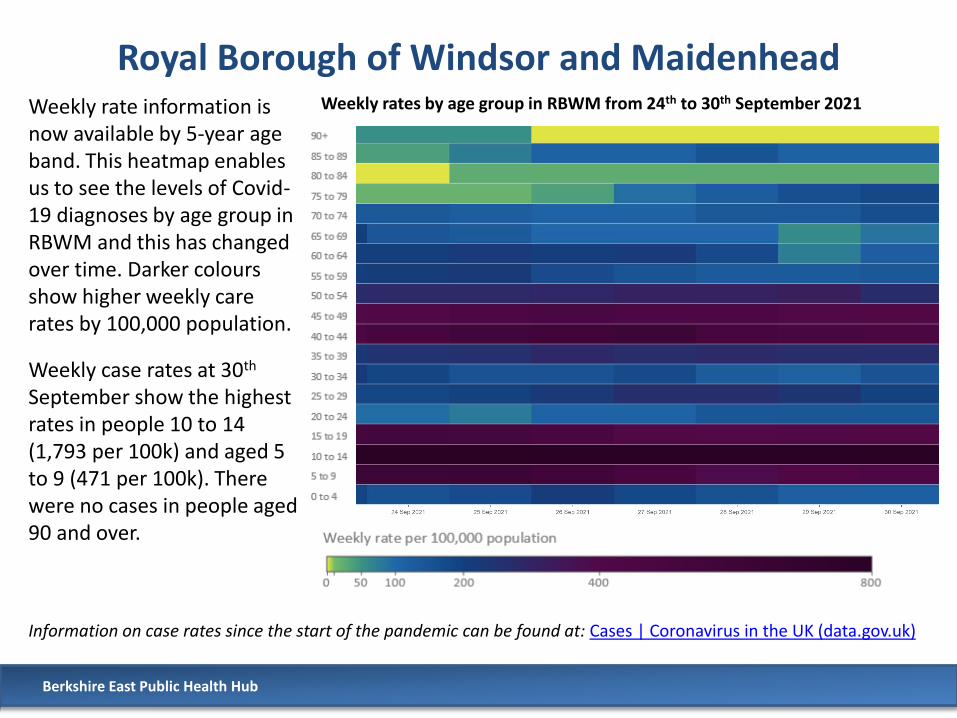
Royal Borough of Windsor and MaidenheadWeekly rate information is now available by 5-year age band. This heatmap enables us to see the levels of Covid-19 diagnoses by age group in RBWM and this has changed over time. Darker colours show higher weekly care rates by 100,000 population.
Weekly case rates at 30th
September show the highest rates in people 10 to 14 (1,793 per 100k) and aged 5 to 9 (471 per 100k). There were no cases in people aged 90 and over.
Information on case rates since the start of the pandemic can be found at: Cases | Coronavirus in the UK (data.gov.uk)
Weekly rates by age group in RBWM from 24th to 30th September 2021
Berkshire East Public Health Hub

Royal Borough of Windsor and Maidenhead
Cases and weekly rate per 100,000 population for the latest week (24th to 30th September 2021)
Total cases and total rates per 100,000 population (since Mar-20)
Source: PHE Second Generation Surveillance System (SGSS)
Berkshire East Public Health Hub
Data on confirmed COVID-19 cases are shown by Electoral Ward. Due to large numbers, this analysis now looks at a weekly period in the first graphs (blue).
Data relating to each Electoral Ward has been rounded to the nearest 5 in order to protect the identity of individuals. Caution should be taken with this information, as it will be based on small numbers and can fluctuate.
Royal Borough of Windsor and Maidenhead
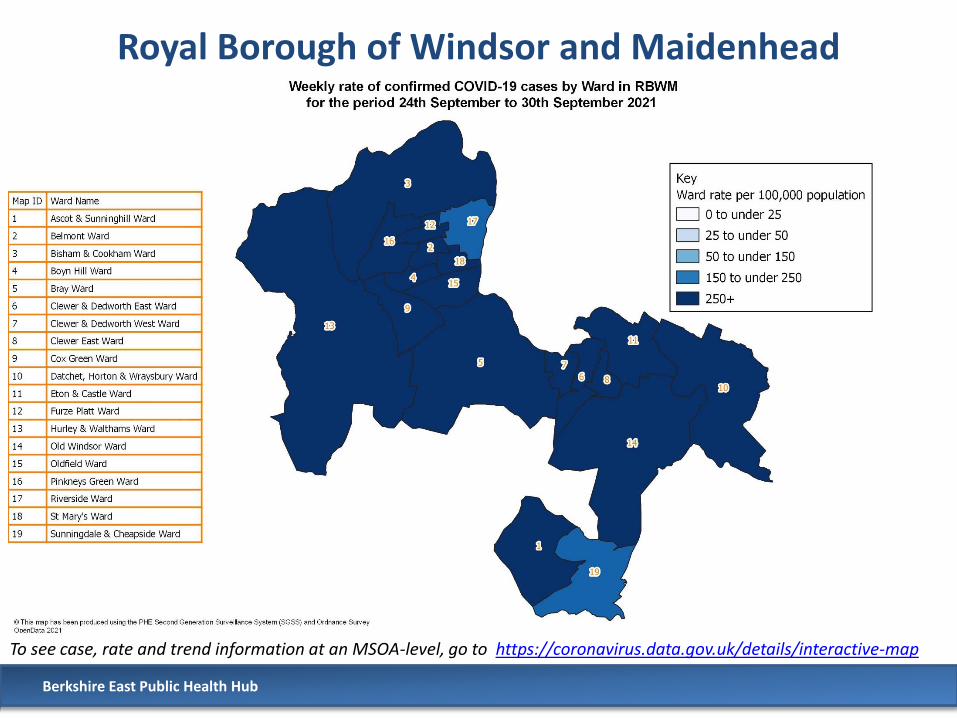
To see case, rate and trend information at an MSOA-level, go to https://coronavirus.data.gov.uk/details/interactive-map
Berkshire East Public Health Hub

WokinghamCases Wokingham has had 15,927 confirmed cases of COVID-19 so far. Over the last
7 days (24th – 30th September) there has been 564 new cases of COVID-19.
The current weekly rate is 324.2 per 100,000 population, which is a 10% increase on last week and a 54% increase on the week before that.
Wokingham’s rate for people aged 60 and over has increased to 144.1 per 100,000 population over the last week.
Additional information on cases by Electoral Ward are shown on the next slide.
Deaths There have been 331 COVID-19 related deaths during the pandemic. There were four new COVID-19 related deaths recorded in the last week (week ending 24th September 2021) in Wokingham.
Since March 2020, Wokingham’s all-cause mortality rate has been 3% higher than the previous 5 year average, which equates to 184 additional deaths. This is the lowest level of excess mortality in Berkshire since the beginning of the pandemic.
Berkshire East Public Health Hub

WokinghamWeekly rate information is now available by 5-year age band. This heatmap enables us to see the levels of Covid-19 diagnoses by age group in Wokingham and this has changed over time. Darker colours show higher weekly care rates by 100,000 population.
Weekly case rates at 30th
September show the highest rates in people aged 10 to 14 (1,494per 100k) and 15 to 19 (657 per 100k).
Information on case rates since the start of the pandemic can be found at: Cases | Coronavirus in the UK (data.gov.uk)
Weekly rates by age group in Wokingham from 24th to 30th September 2021
Berkshire East Public Health Hub

Wokingham
To see case, rate and trend information at an MSOA-level, go to https://coronavirus.data.gov.uk/details/interactive-map
Berkshire East Public Health Hub

Summary at 28th September 2021
• Weekly case rates are increasing with four of the six Berkshire LAs seeing an increase over the last week. This reflects most of the South East Region.
• All Berkshire local authorities are seeing the highest rates in the population aged 10 to 14. The second highest rates are 15 to 19 age group and one in the 5 to 9 age group.
• In the last week reported (week ending 24th September), there were 10 COVID-19 related deaths across Berkshire – 3 in RBWM, 4 in Wokingham, 2 in Slough and 1 in Reading.
• Over 674,000 people living in Berkshire have now received dose 1 of the Covid-19 vaccination and nearly 620,000 people have received both doses.
76% of people in Berkshire aged 18 and over have now received both doses of the vaccine.
• From 4am Monday 4th October 2021, the rules for international travel to England will change from the red, amber, green traffic light system to a single red list of countries and simplified travel measures for arrivals from the rest of the world. The rules for travel from countries and territories not on the red list will depend on your vaccination status. For more information see the Gov.uk website.
Berkshire East Public Health Hub

Data thresholds
Data thresholds included in PHE’s Situational Awareness Report:
Positivity rateThis includes all individuals with a valid test result from a specimen taken in the 7-day period shown. This includes Pillar 1 and Pillar 2 test.
Weekly rate per 100,000 population (all ages)
Weekly rate per 100,000 population (aged 60 and over)
Red: >7.5% Amber: 4% to 7.5% Green: <4%
Maroon: >250 Dark Red: 151 to
250Red: 51 to 150 Amber: 25 to 50 Green: <25
Maroon: >150 Dark Red: 101 to
150Red: 51 to 100 Amber: 25 to 50 Green: <25
Berkshire East Public Health Hub

For more informationFor the latest Berkshire COVID-19 data (cases, NHS 111 triages and deaths) please visit our website: https://www.berkshirepublichealth.co.uk/
Additional information on national, regional and neighbourhood-level data can also be found at the main government website: https://coronavirus.data.gov.uk/
Berkshire East Public Health Hub


