36
Bernard L. Weinstein, Ph.D. Presentation to ISM-Dallas January 10, 2008 A Falling Dollar, $100 Oil, and the Sub-Prime Mess: Is a Recession Inevitable?
| Date post: | 28-Dec-2015 |
| Category: |
Documents |
| Upload: | betty-wade |
| View: | 213 times |
| Download: | 0 times |
Bernard L. Weinstein, Ph.D.
Presentation to ISM-Dallas
January 10, 2008
A Falling Dollar, $100 Oil, and the Sub-Prime Mess: Is
a Recession Inevitable?
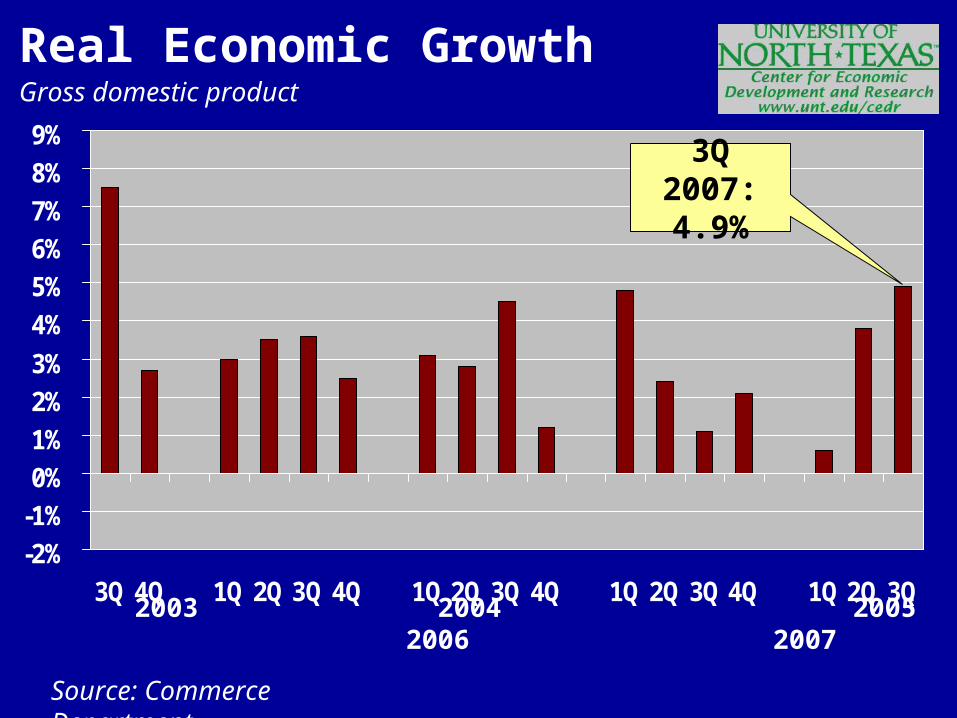
Gross domestic product
Source: Commerce Department
Real Economic Growth
-2%
-1%
0%
1%
2%
3%
4%
5%
6%
7%
8%
9%
3Q 4Q 1Q 2Q 3Q 4Q 1Q 2Q 3Q 4Q 1Q 2Q 3Q 4Q 1Q 2Q 3Q 2003 2004 2005 2006 2007
3Q 2007:4.9%
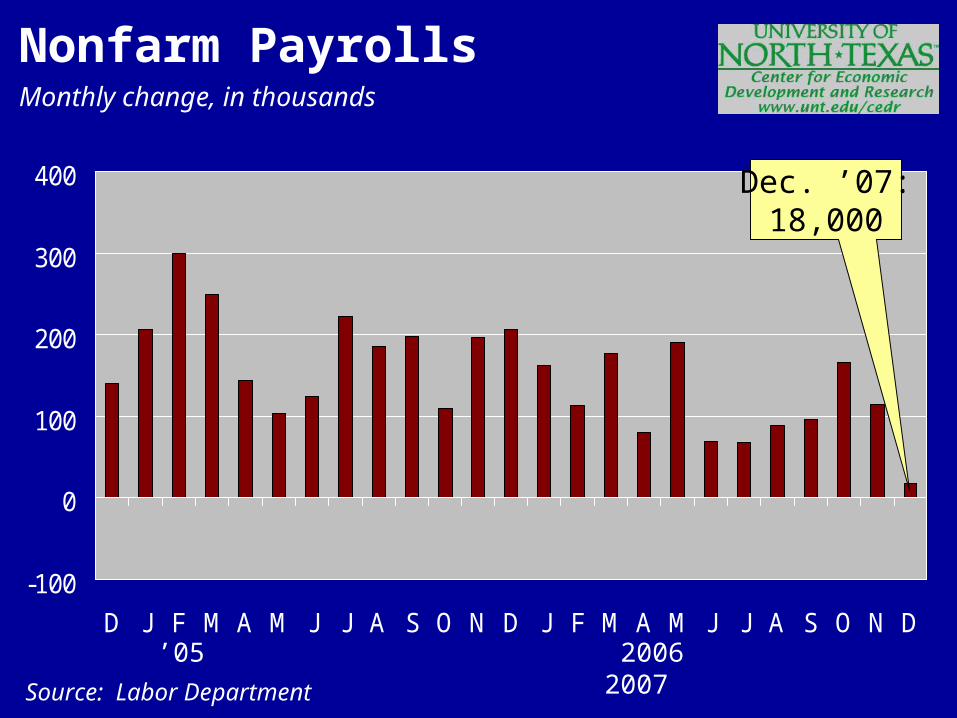
Monthly change, in thousands
-100
0
100
200
300
400
D J F M A M J J A S O N D J F M A M J J A S O N D
Source: Labor Department
Dec. ’07:18,000
’05 2006 2007
Nonfarm Payrolls
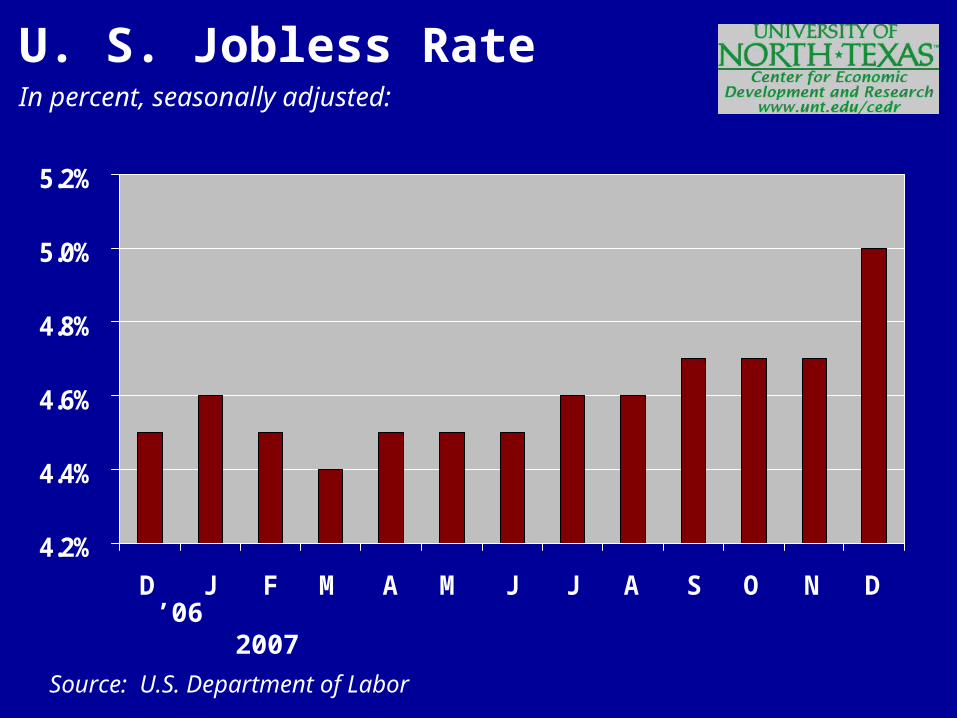
In percent, seasonally adjusted:
4.2%
4.4%
4.6%
4.8%
5.0%
5.2%
D J F M A M J J A S O N D
Source: U.S. Department of Labor
’06 2007
U. S. Jobless Rate
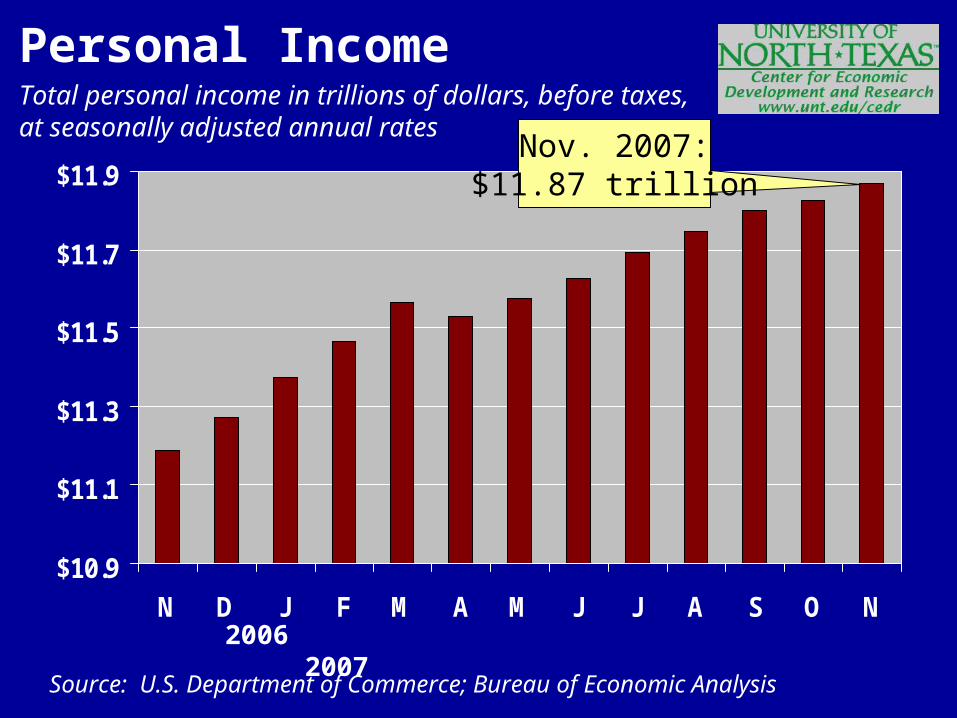
Total personal income in trillions of dollars, before taxes, at seasonally adjusted annual rates
$10.9
$11.1
$11.3
$11.5
$11.7
$11.9
N D J F M A M J J A S O N
Source: U.S. Department of Commerce; Bureau of Economic Analysis
Nov. 2007:$11.87 trillion
2006 2007
Personal Income
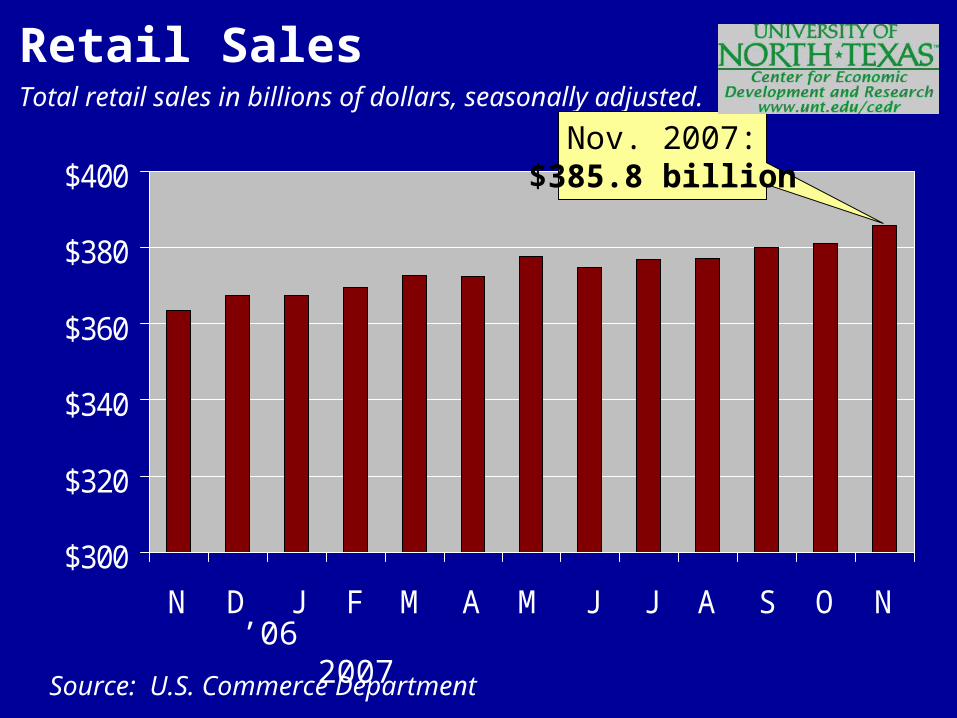
Total retail sales in billions of dollars, seasonally adjusted.
$300
$320
$340
$360
$380
$400
N D J F M A M J J A S O N
Source: U.S. Commerce Department
Nov. 2007:$385.8 billion
’06 2007
Retail Sales
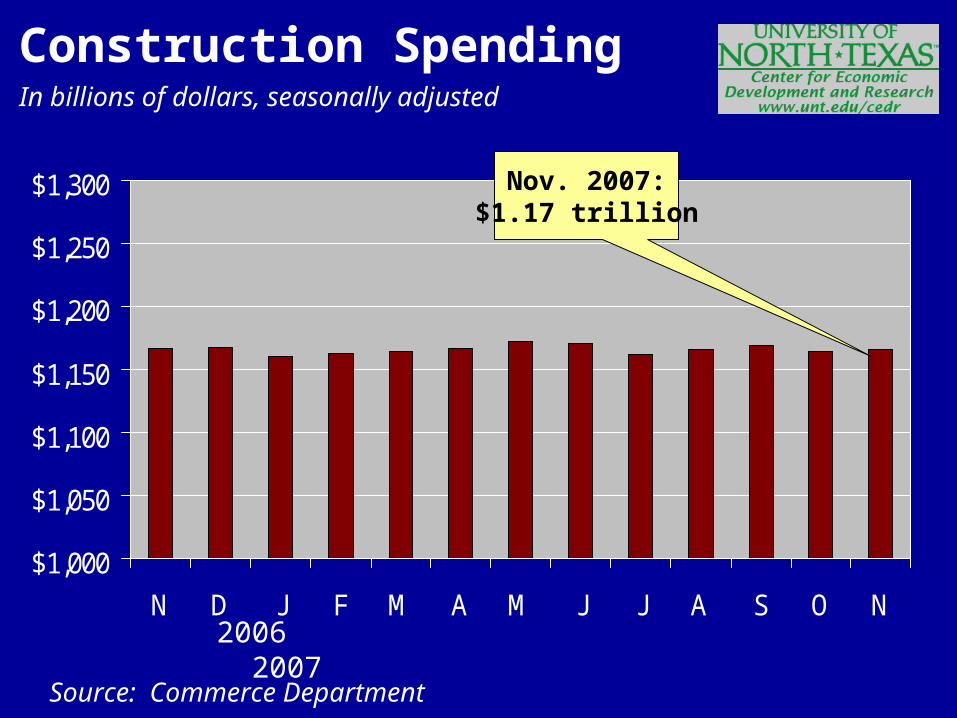
In billions of dollars, seasonally adjusted
Source: Commerce Department
Construction Spending
$1,000
$1,050
$1,100
$1,150
$1,200
$1,250
$1,300
N D J F M A M J J A S O N 2006 2007
Nov. 2007:$1.17 trillion
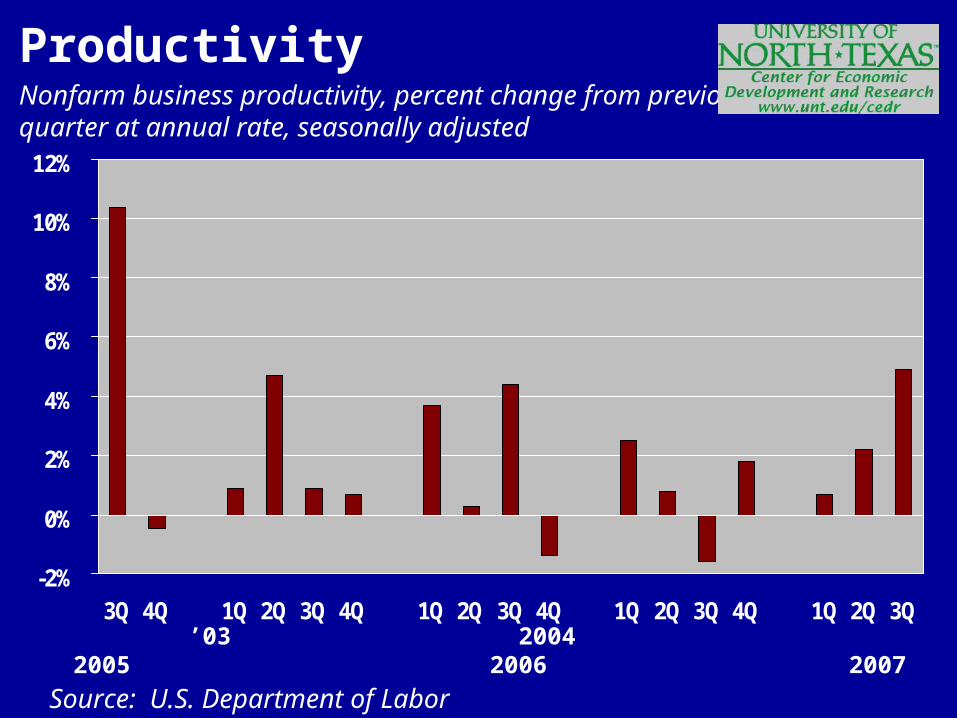
Nonfarm business productivity, percent change from previous quarter at annual rate, seasonally adjusted
Source: U.S. Department of Labor
’03 2004 2005 2006 2007
Productivity
-2%
0%
2%
4%
6%
8%
10%
12%
3Q 4Q 1Q 2Q 3Q 4Q 1Q 2Q 3Q 4Q 1Q 2Q 3Q 4Q 1Q 2Q 3Q

Oiloholics
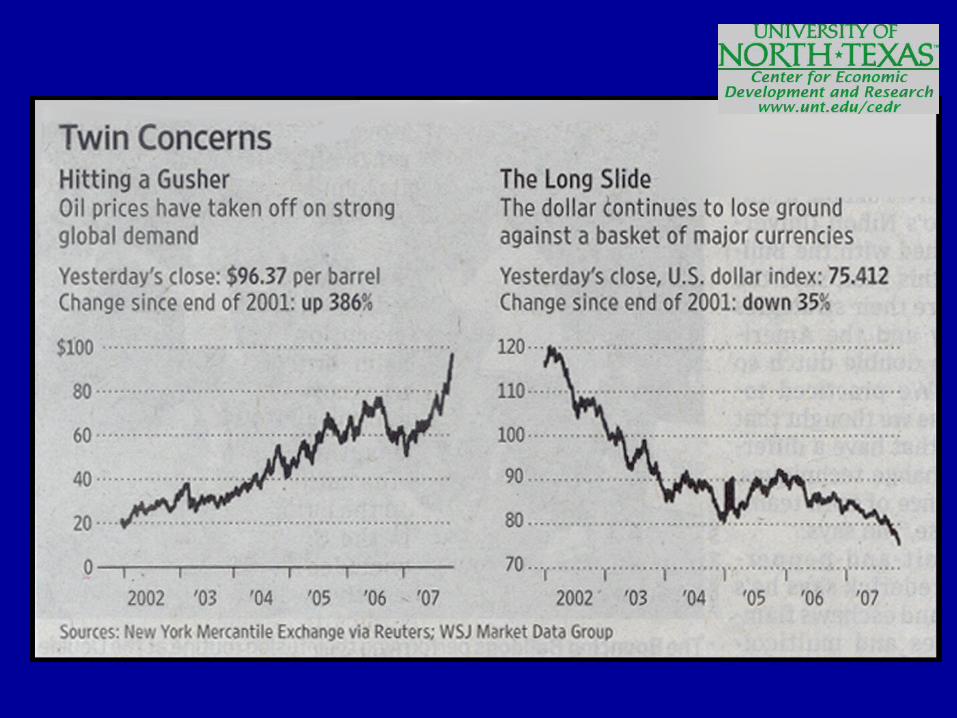
Twin Concerns
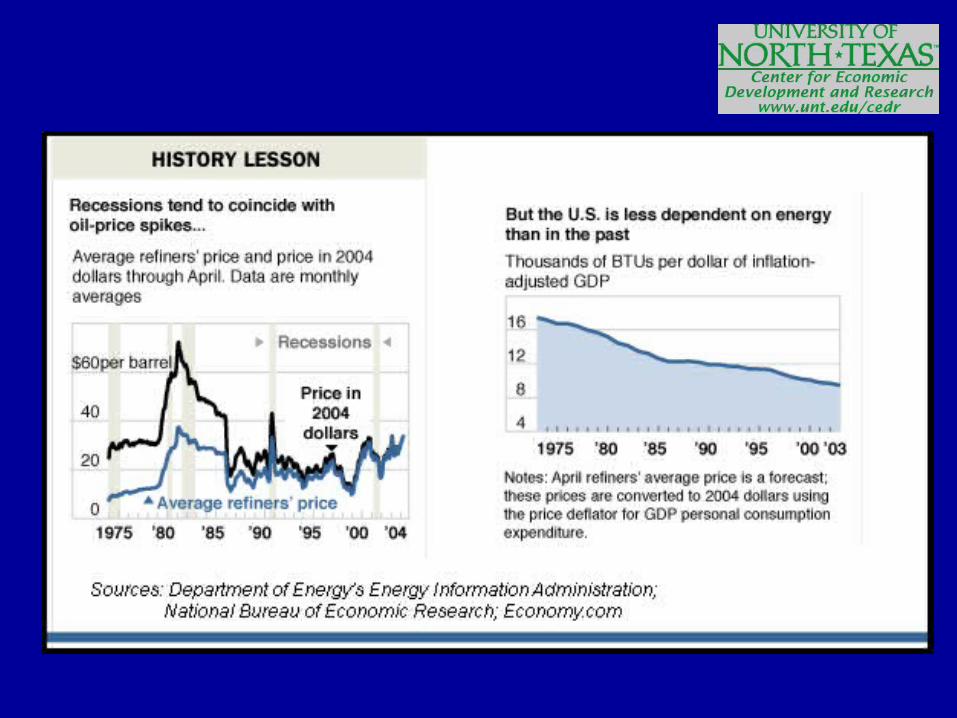
History Lesson
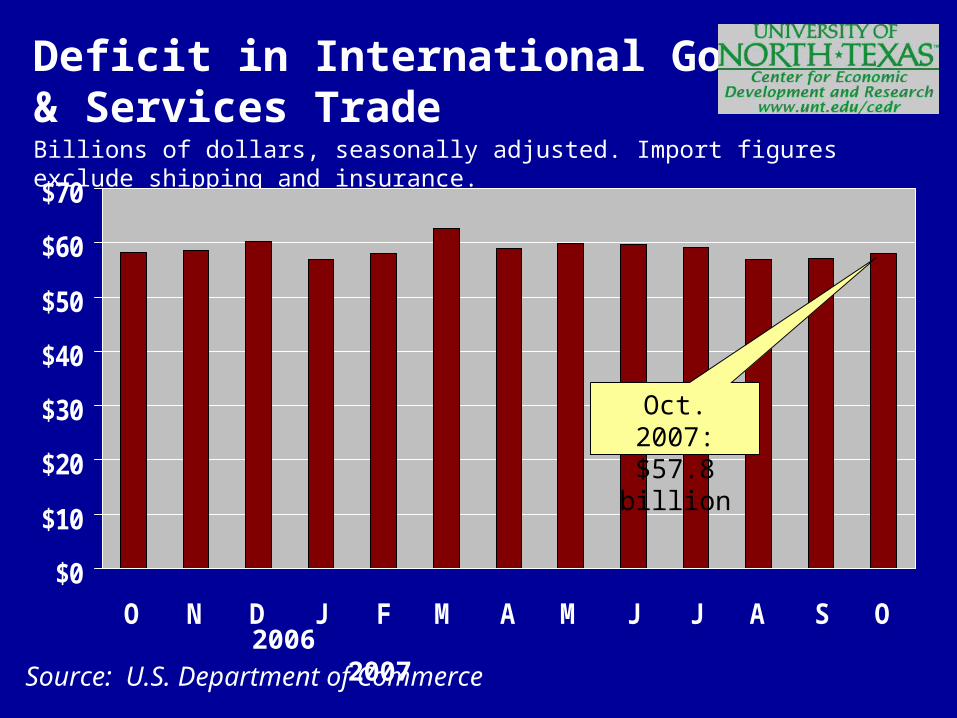
Source: U.S. Department of Commerce
Deficit in International Goods & Services TradeBillions of dollars, seasonally adjusted. Import figures exclude shipping and insurance.
$0
$10
$20
$30
$40
$50
$60
$70
O N D J F M A M J J A S O 2006 2007
Oct. 2007:$57.8 billion
100
105
110
115
2005 2006 2007
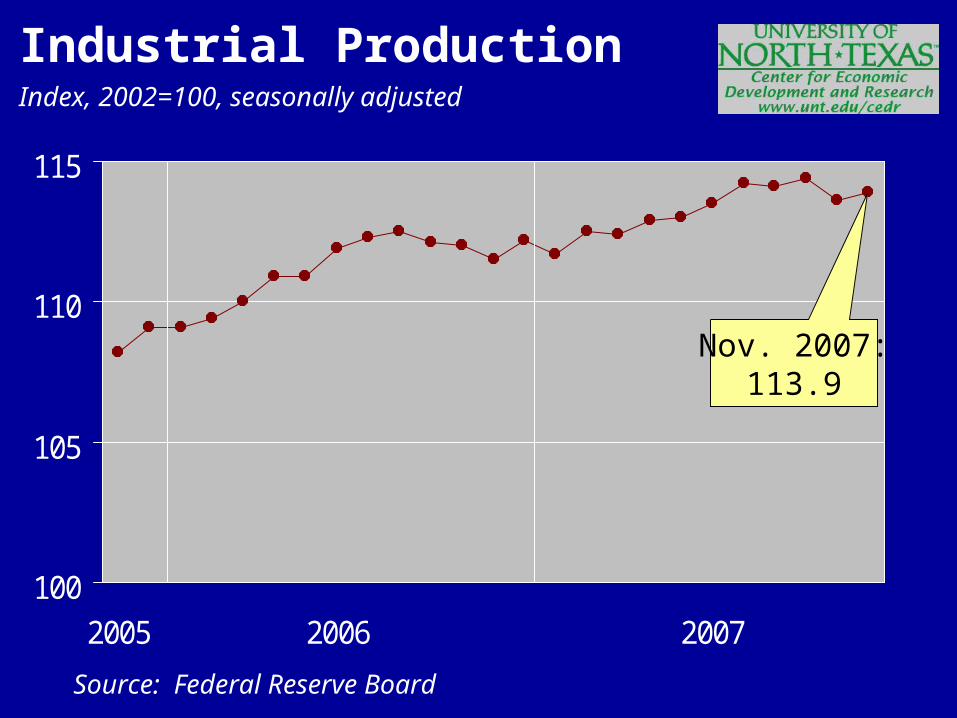
Index, 2002=100, seasonally adjusted
Source: Federal Reserve Board
Industrial Production
Nov. 2007:113.9
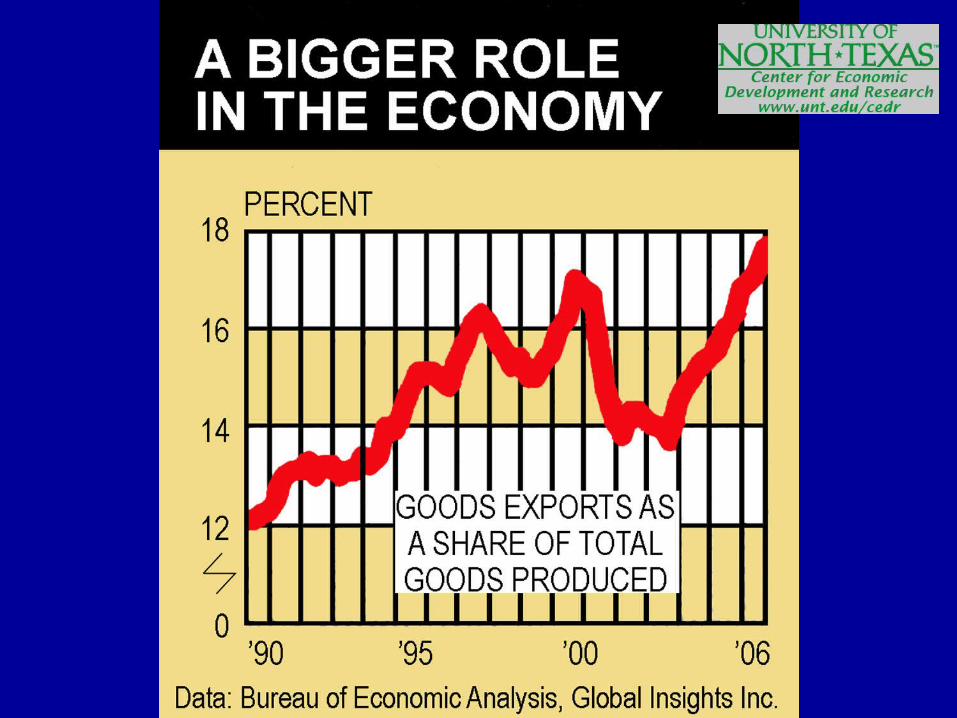
Bigger Role in Economy
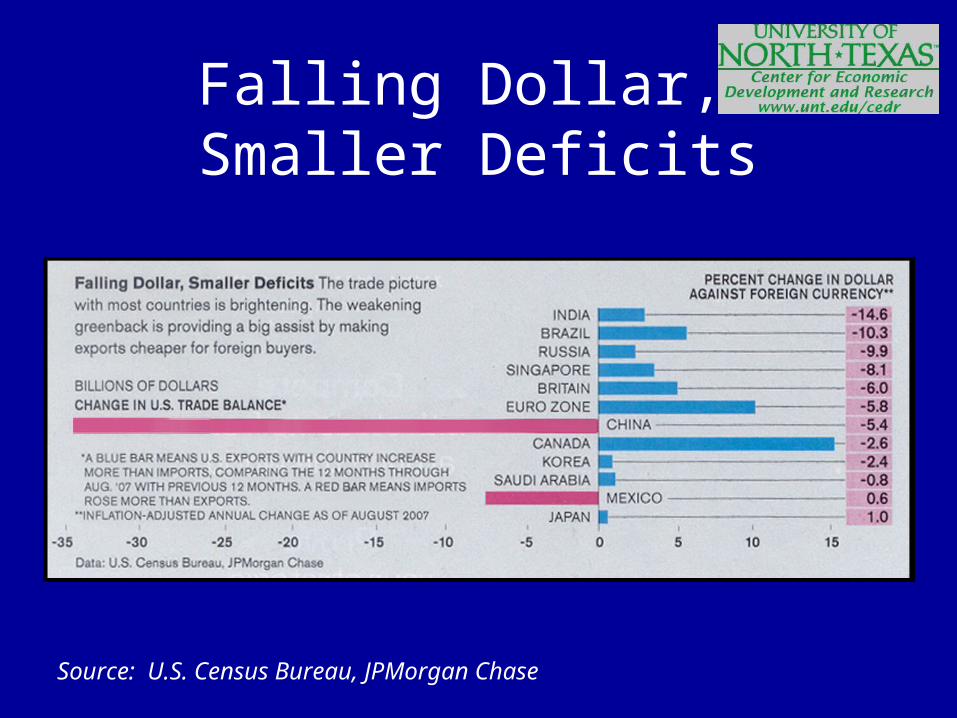
Falling Dollar, Smaller Deficits
Source: U.S. Census Bureau, JPMorgan Chase

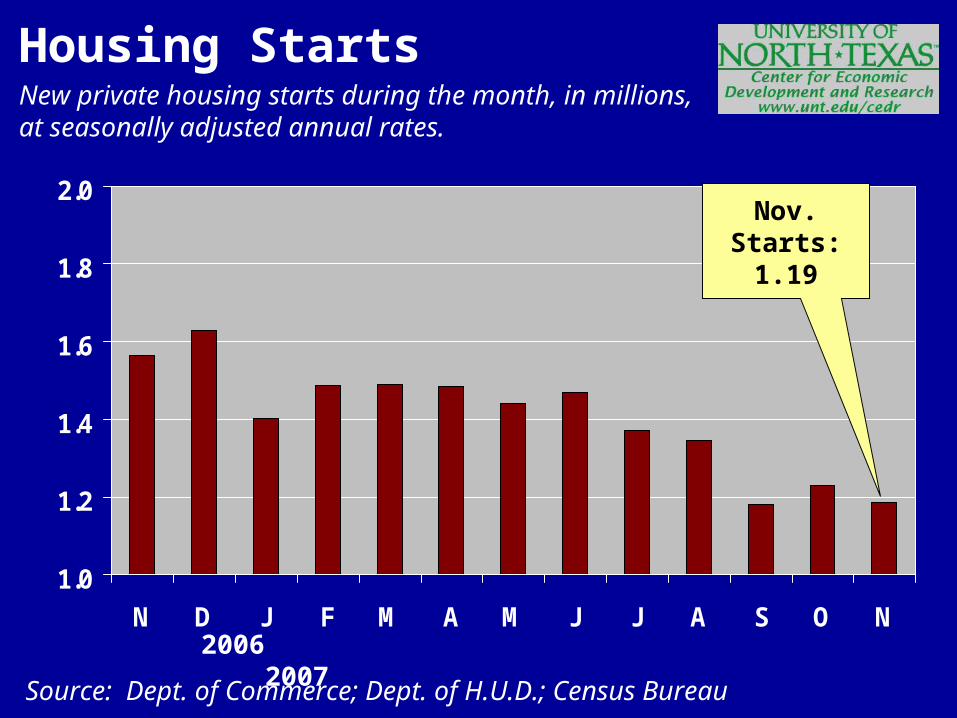
New private housing starts during the month, in millions, at seasonally adjusted annual rates.
Source: Dept. of Commerce; Dept. of H.U.D.; Census Bureau
Housing Starts
1.0
1.2
1.4
1.6
1.8
2.0
N D J F M A M J J A S O N 2006 2007
Nov. Starts:1.19
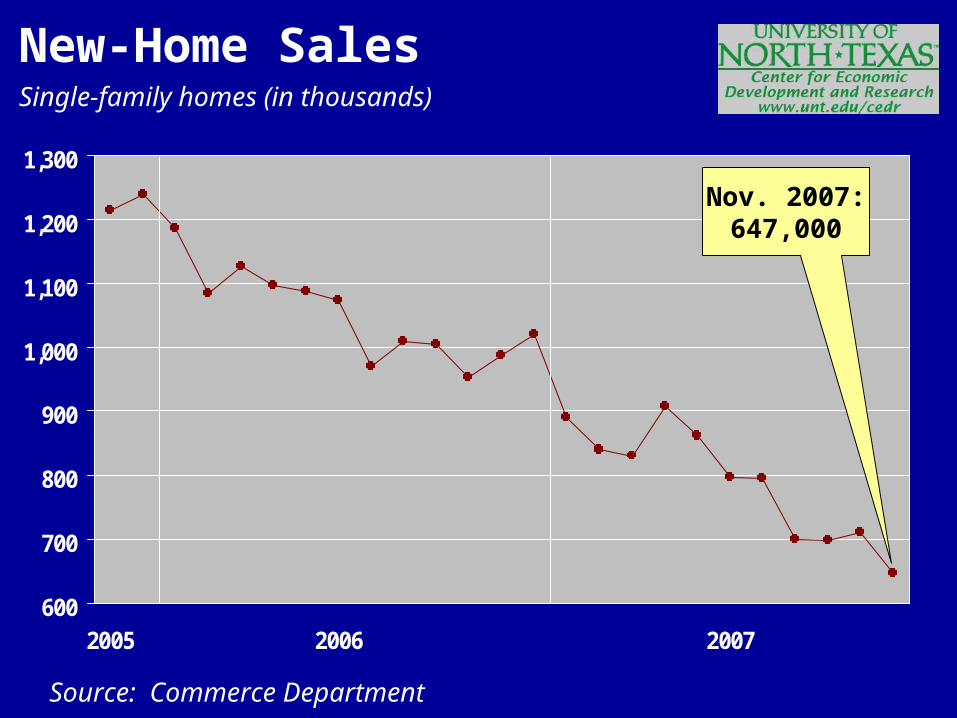
Single-family homes (in thousands)
600
700
800
900
1,000
1,100
1,200
1,300
2005 2006 2007
Source: Commerce Department
New-Home Sales
Nov. 2007:647,000
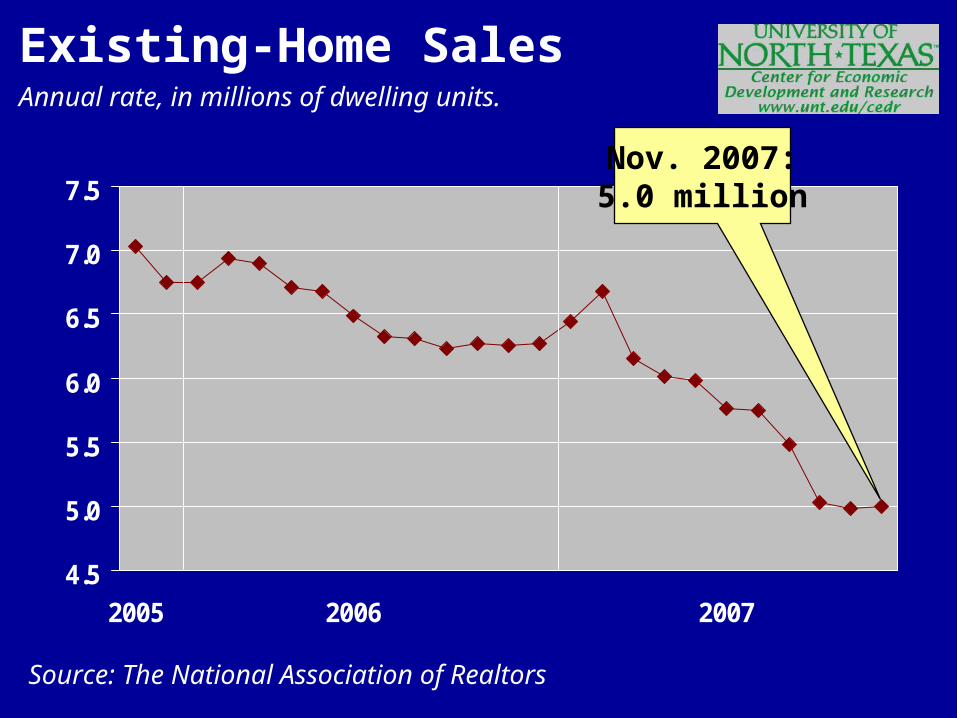
Annual rate, in millions of dwelling units.
Source: The National Association of Realtors
Existing-Home Sales
4.5
5.0
5.5
6.0
6.5
7.0
7.5
2005 2006 2007
Nov. 2007:5.0 million
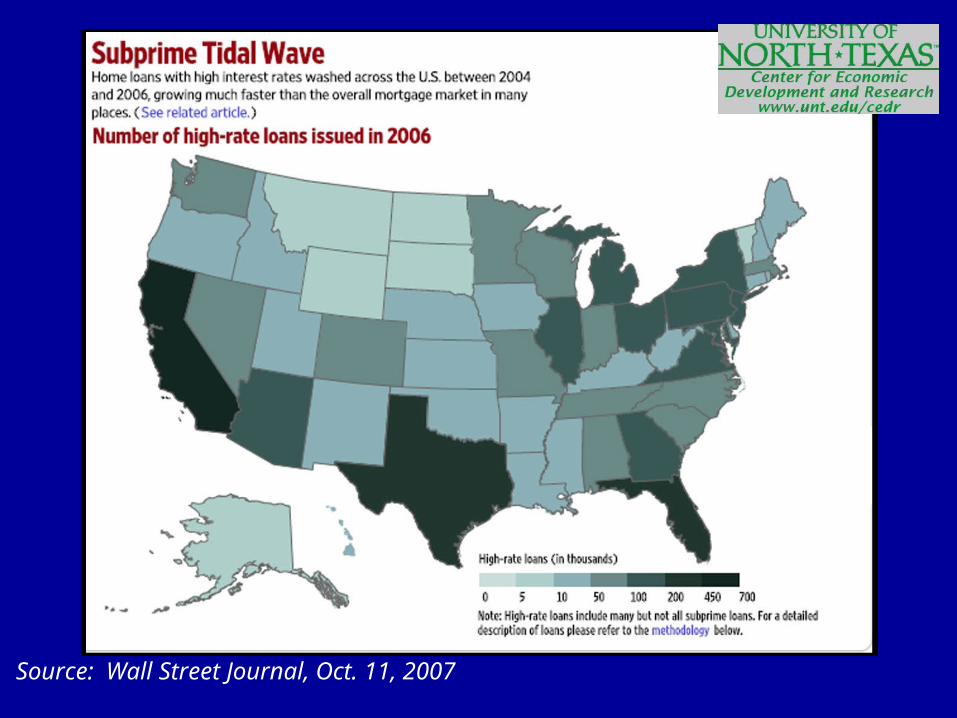
Source: Wall Street Journal, Oct. 11, 2007
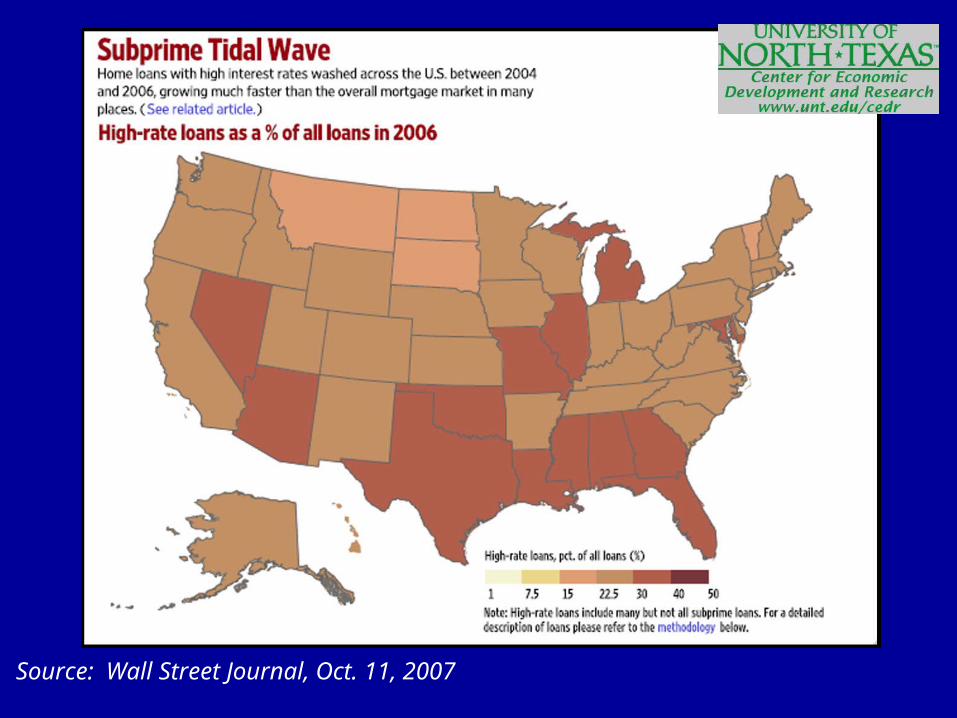
Source: Wall Street Journal, Oct. 11, 2007
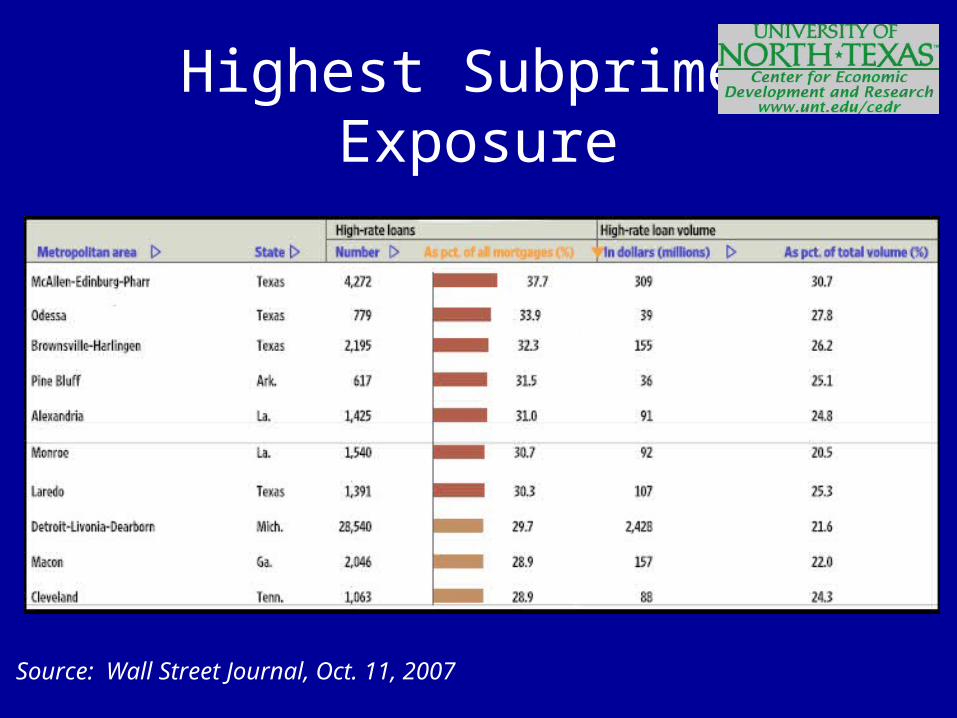
Highest Subprime Exposure
Source: Wall Street Journal, Oct. 11, 2007
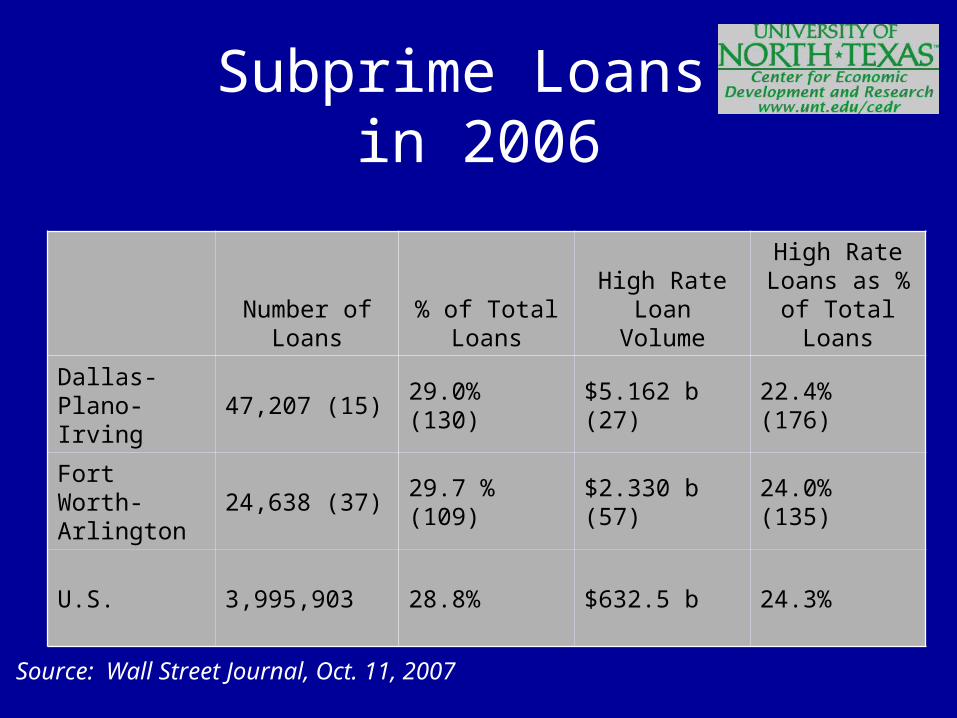
Subprime Loans in 2006
Source: Wall Street Journal, Oct. 11, 2007
Number of Loans
% of Total Loans
High Rate Loan Volume
High Rate Loans as % of
Total Loans
Dallas-Plano-Irving
47,207 (15) 29.0% (130) $5.162 b (27) 22.4% (176)
Fort Worth-Arlington
24,638 (37) 29.7 % (109) $2.330 b (57) 24.0% (135)
U.S. 3,995,903 28.8% $632.5 b 24.3%
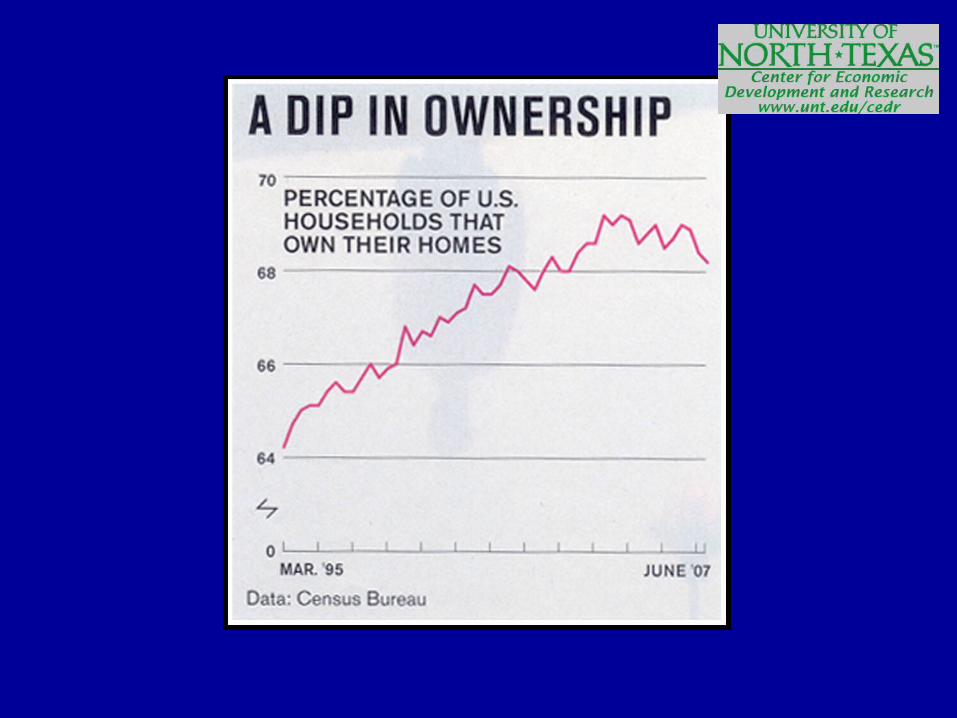
Dip in Household Ownership

Home Value Decline
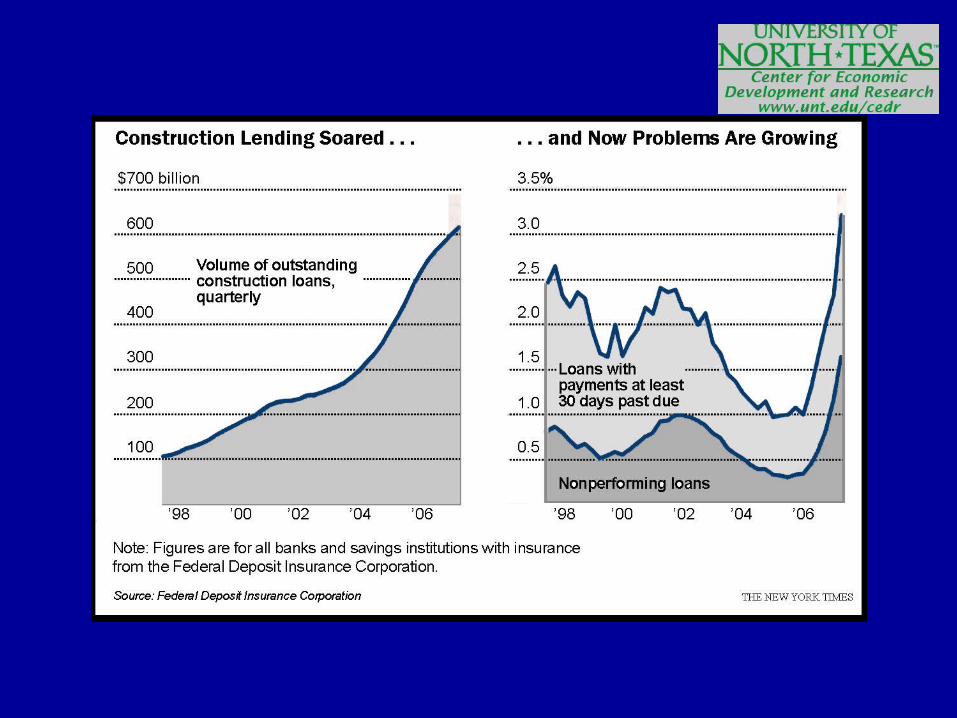
Construction Lending And Sub Prime Loans
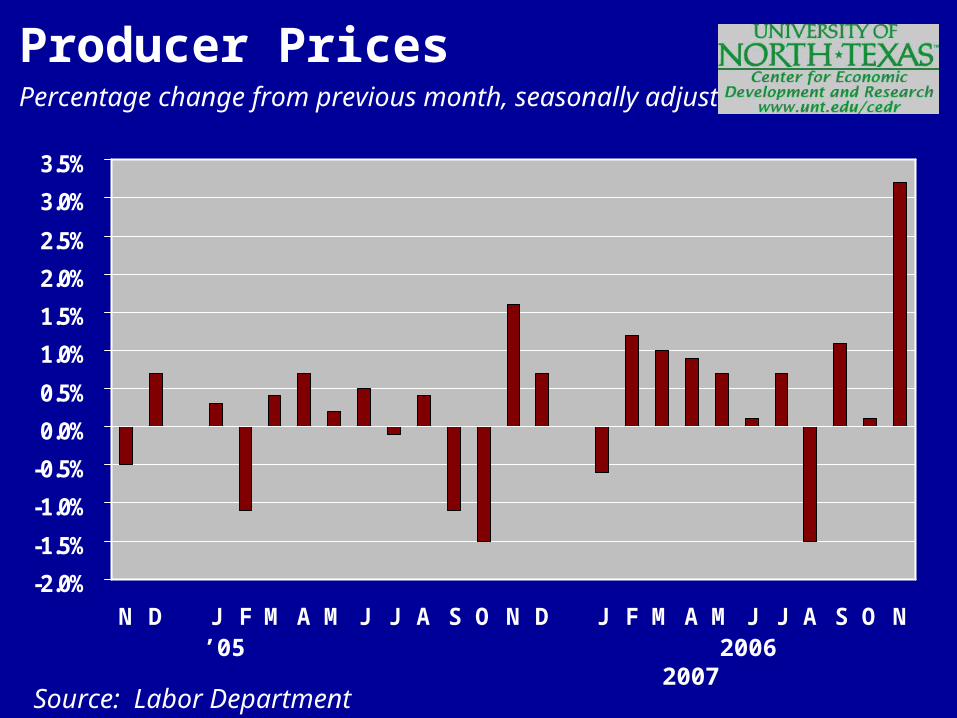
Percentage change from previous month, seasonally adjusted.
Source: Labor Department
Producer Prices
-2.0%
-1.5%
-1.0%
-0.5%
0.0%
0.5%
1.0%
1.5%
2.0%
2.5%
3.0%
3.5%
N D J F M A M J J A S O N D J F M A M J J A S O N
’05 2006 2007
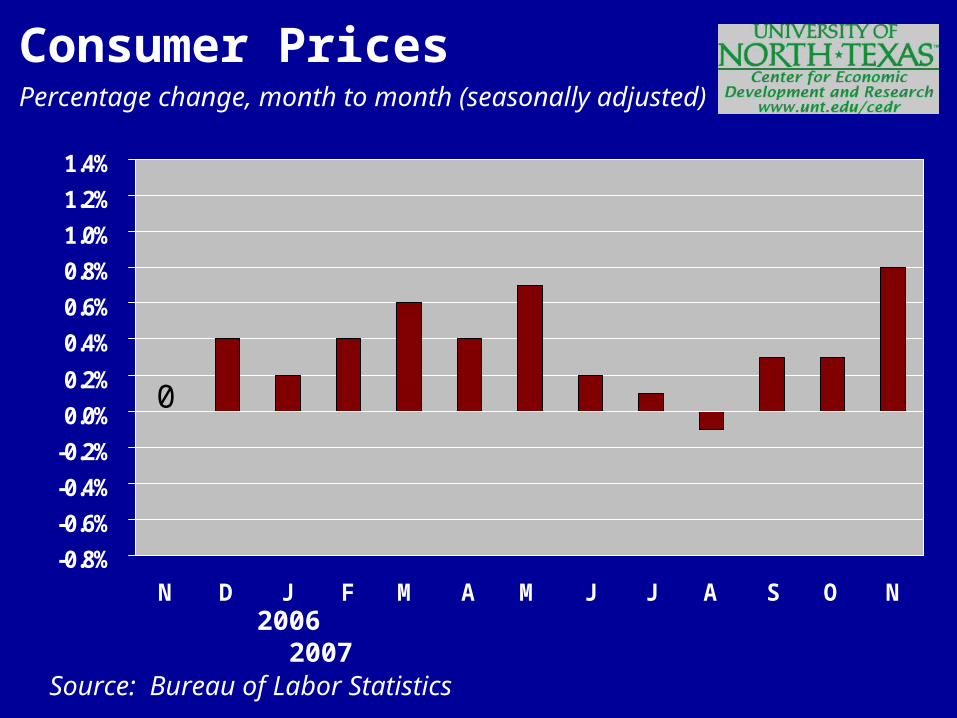
Percentage change, month to month (seasonally adjusted)
Source: Bureau of Labor Statistics
Consumer Prices
-0.8%
-0.6%
-0.4%
-0.2%
0.0%
0.2%
0.4%
0.6%
0.8%
1.0%
1.2%
1.4%
N D J F M A M J J A S O N
2006 2007
0
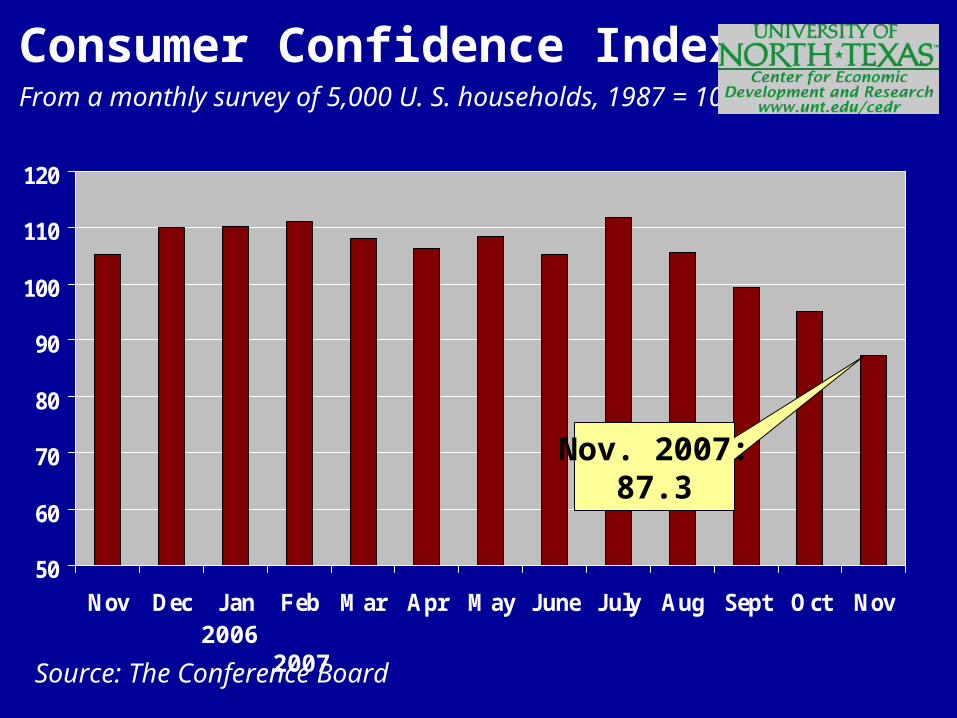
From a monthly survey of 5,000 U. S. households, 1987 = 100
Source: The Conference Board
Consumer Confidence Index
2006 2007
50
60
70
80
90
100
110
120
Nov Dec Jan Feb Mar Apr May June July Aug Sept Oct Nov
Nov. 2007:87.3
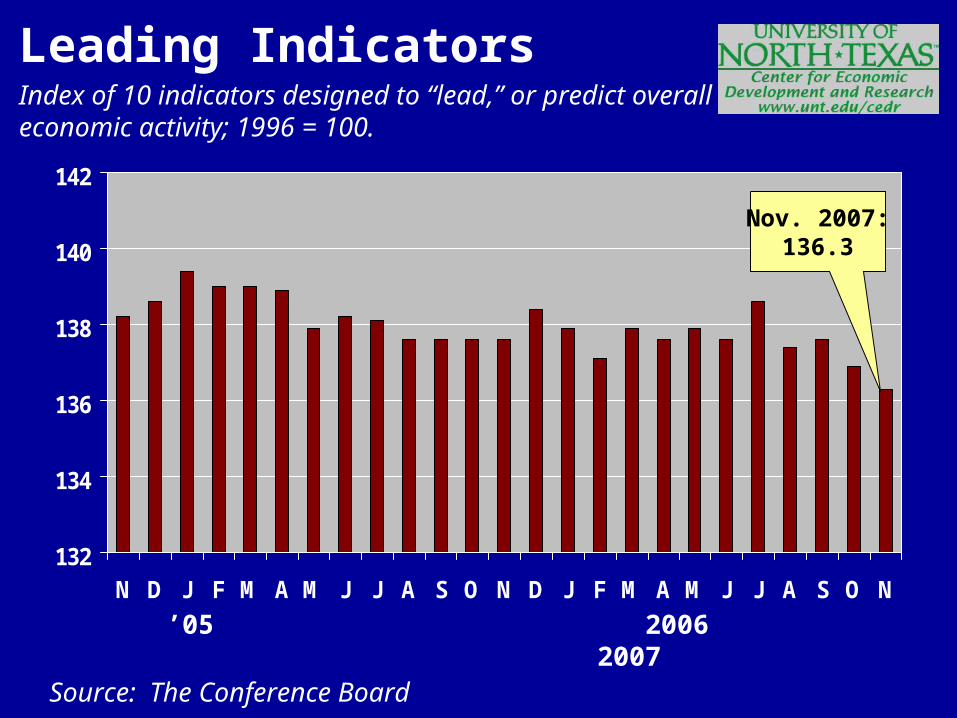
Index of 10 indicators designed to “lead,” or predict overall economic activity; 1996 = 100.
Source: The Conference Board
Leading Indicators
132
134
136
138
140
142
N D J F M A M J J A S O N D J F M A M J J A S O N
Nov. 2007:136.3
’05 2006 2007
Source: Texas Workforce Commission
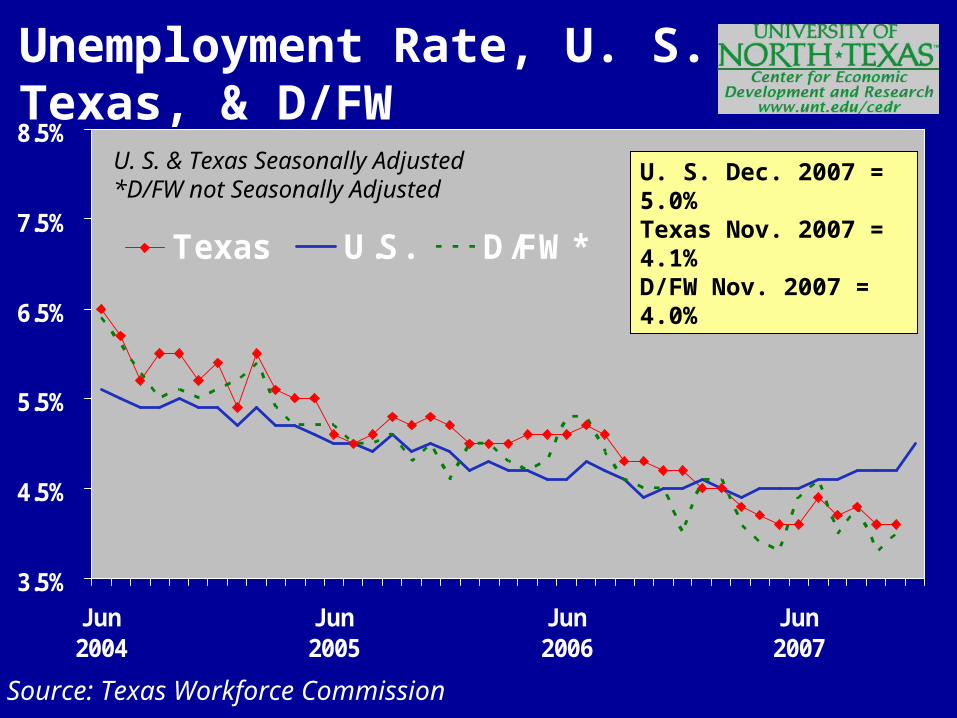
Unemployment Rate, U. S., Texas, & D/FW
3.5%
4.5%
5.5%
6.5%
7.5%
8.5%
Jun2004
Jun2005
Jun2006
Jun2007
Texas U.S. D/FW*
U. S. Dec. 2007 = 5.0%Texas Nov. 2007 = 4.1%D/FW Nov. 2007 = 4.0%
U. S. & Texas Seasonally Adjusted *D/FW not Seasonally Adjusted
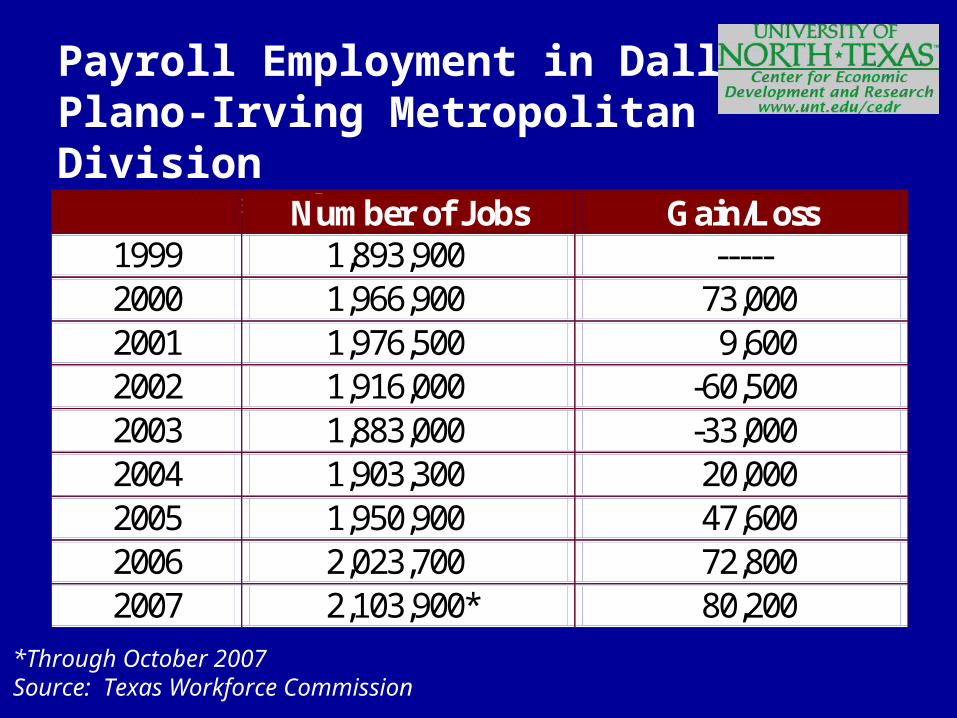
Payroll Employment in Dallas-Plano-Irving Metropolitan Division1999-2006 (annual averages)
*Through October 2007Source: Texas Workforce Commission
Number of Jobs Gain/Loss 1999 1,893,900 ----- 2000 1,966,900 73,000 2001 1,976,500 9,600 2002 1,916,000 -60,500 2003 1,883,000 -33,000 2004 1,903,300 20,000 2005 1,950,900 47,600 2006 2,023,700 72,800 2007 2,103,900* 80,200