144
Lemmens Bernd Wächter, Friedhelm Maiworm (eds.) English-Taught Programmes in European Higher Education ACA Papers on International Cooperation in Education The State of Play in 2014

This is the third study on English-medium instruction of the Academic Cooperation Association (ACA). Like its predecessors, this report maps the provision of English-taught Bachelor and Master programmes in non-English-speaking European countries. Using the results of its predecessor publications as historical references, the present study is able to trace the quantitative – and, to an extent, qualitative – devel-opment of English-medium instruction over a 12-year period.
The number of English-taught Bachelor and Master programmes has risen by almost 1,000% in the period since 2002. Growth in student enrolment in these programmes has been far more moderate, however. Furthermore, there remain huge differ-ences between individual countries, especially in the form of a North-South divide. As in our earlier re-ports, the Nordic countries and the Netherlands are the leading providers. The runners-up are the Baltic States. Southern European countries are still largely ‘abstentious’. The bulk of the provision of English-medium instruction is concentrated in programmes at the Master level.
ISBN 978-3-86856-017-6
Lemmens
Bernd Wächter, Friedhelm Maiworm (eds.)
English-Taught Programmes in European Higher Education
ACA Papers on International Cooperation in Education
The State of Play in 2014
Bern
d W
ächt
er,
Frie
dhel
m M
aiw
orm
(eds
.) En
glis
h-Ta
ught
Pro
gram
mes
in E
urop
ean
High
er E
duca
tion

Bernd Wächter, Friedhelm Maiworm (eds.)
English-Taught Programmes in European Higher Education
The State of Play in 2014

ACA Papers on International Cooperation in Education
Bernd Wächter, Friedhelm Maiworm (eds.)
English-Taught Programmes in European Higher Education
The State of Play in 2014
Lemmens

Die Deutsche Bibliothek – CIP-EinheitsaufnahmeEnglish-Taught Programmes in European Higher Education. The State of Play in 2014/Bernd Wächter, Friedhelm Maiworm (eds.) – Bonn: Lemmens Medien GmbH, 2014 (ACA Papers on International Cooperation in Education) ISBN 978-3-86856-017-6
NE: ACA Papers
© Copyright 2014 Lemmens Medien GmbH, Bonn Alle Rechte vorbehalten
Address: Matthias-Grünewald-Straße 1-3 D-53175 Bonn Telefon: +49 228 4 21 37-0 Telefax: +49 228 4 21 37-29 E-Mail: [email protected] Internet: www.lemmens.de
Printing: Kössinger AG, Schierling
This publication reflects the views only of the authors, and the Commission cannot be held responsible for any use which may be made of the informati-on contained therein.

5
Contents
Contents
Acknowledgements (Bernd Wächter) ...........................................................13
Executive summary (Queenie K.H. Lam, Bernd Wächter) ...............................15
Part I – The big picture (Friedhelm Maiworm, Bernd Wächter)
1. Objectives and methods ........................................................................ 25
2. Status quo and quantitative trends in the provision of ETPs ...................37
3. Drivers and reasons for introducing ETPs ................................................50
Part II – Traits and daily operation of ETPs (Irina Ferencz, Friedhelm Maiworm, Marija Mitic)
1. Age of programmes – year of introduction ...............................................63
2. ETPs by study levels ................................................................................65
3. Subject areas covered by ETPs ...............................................................66
4. Duration and admission requirements .....................................................70
5. Marketing channels ..................................................................................75
6. Programme size and number of applicants .............................................79
7. Classroom composition – regional origin of students ..............................82
8. Characteristics of the curriculum .............................................................86
9. Challenges ............................................................................................... 94
Part III – English in the classroom and beyond (Queenie K.H. Lam, Friedhelm Maiworm)
1. Language proficiency .............................................................................. 98
2. Language problems in ETPs ..................................................................103
3. Language support ..................................................................................107
Part IV – Impact of ETPs (Irina Ferencz, Friedhelm Maiworm)
1. Impact on institutional policies and administrative procedures .............119
2. Benefits of ETPs .....................................................................................124
3. ETPs and the development of student support services in English .......125
Postscript (Bernd Wächter) ..........................................................................131
What is ACA? .............................................................................................133
ACA Papers ................................................................................................135
6
English-Taught Programmes in European Higher Education
List of tables
Table I.1Higher education institutions addressed in the Institutional Survey, respondents and return rates in % – by country ....................................................... 34
Table I.2ETPs addressed in the Programme Survey, respondents and return rates in % – by country ................................................................................................................. 35
Table I.3 Indicators for the quantitative importance of ETPs – by region (%) .......................... 38
Table I.4 Indicators for the quantitative importance of ETPs – by region and country (%) ..... 40
Table I.5 Higher education institutions offering ETPs – by country (absolute numbers and %) ........................................................................................ 42
Table I.6 Overall number of programmes and number of ETPs – by country (absolute numbers and %) ........................................................................................ 43
Table I.7 Overall number of all students in 2012 and of students enrolled in ETPs in the academic year 2013/14 – by country (absolute numbers and %) ................... 45
Table I.8 Ranks of individual countries by three different criteria measuring the provision of ETPs ................................................................................................ 47
Table I.9 ETPs identified in 2007 and 2014 – by region in which the institutions are located (absolute numbers) ................................................................................. 48
Table I.10 ETPs identified in 2007 and 2014 – by region (%) .................................................... 49
Table I.11 ETPs offered at higher education institutions – by type of institution (%) ................ 50
Table I.12 ETPs offered at Bachelor or Master level – by number of students enrolled (%) ..... 51
Table I.13 ETPs offered at Bachelor or Master level – by % of foreign students enrolled ......... 52
Table I.14 Important reasons of Institutional Coordinators and Programme Directors for the introduction of ETPs (%*) ............................................................................... 54
7
List of tables
7
Table I.15 Important reasons of Programme Directors for the introduction of ETPs – by region (%*) ........................................................................................................... 56
Table I.16 Important reasons of Institutional Coordinators for the introduction of ETPs – by region (%*) ............................................................................................................ 58
Table I.17 Important reasons of Programme Directors for the introduction of ETPs – by degree awarded at the end of the programme (%*) ............................................. 60
Table II.1 Year of introduction of the ETPs – by region (%) ...................................................... 64
Table II.2 Degree awarded at the end of the ETPs – by region (%) .......................................... 65
Table II.3 Degree awarded at the end of the ETPs – by year of introduction of the programme (%) ............................................................................................... 66
Table II.4 Subject areas to which the ETPs mainly belong – by year of introduction of the programme (%) ............................................................................................... 67
Table II.5 Subject areas to which the ETPs mainly belong – by degree awarded at the end of the programme (%) .............................................................................. 68
Table II.6 Subject areas to which the ETPs mainly belong - by region (%) .............................. 69
Table II.7 Standard period of study of the ETPs – by degree awarded at the end of the programme (%) ............................................................................................... 70
Table II.8 Selection amongst the applicants qualified for entry – by degree awarded at the end of the programme (%) .............................................................................. 71
Table II.9 Important criteria for selecting students for the programme – by degree awarded at the end of the programme (%*) .............................................................. 72
Table II.10 Information/measures taken into account for the selection of students – by degree awarded at the end of the programme (%) .............................................. 72
Table II.11 Minimum score to be reached by students in language tests – by degree awarded at the end of the programme (Mean) .......................................................... 73

Table II.12 Information/measures taken into account for the selection of students – by region (%) ............................................................................................................. 74
Table II.13 Kind of marketing activities used – by degree awarded at the end of the programme (%, multiple replies possible) ....................................................... 75
Table II.14 Kind of marketing activities used – by target groups (%, multiple replies possible) .................................................................................... 77
Table II.15 Kind of marketing activities used – by region (%, multiple replies possible) ............ 78
Table II.16 Number of students enrolled in the ETPs in the academic year 2013/14 – by degree awarded at the end of the programme (%) .............................................. 79
Table II.17 Relation of applicants and first year students of ETPs in the academic year 2013/14 – by degree awarded at the end of the programme (%) ............................. 80
Table II.18 Relation of applicants and first year students of ETPs in the academic year 2013/14 – by region (%) ............................................................................................ 80
Table II.19Significant difficulties which affected the running of the ETPs – by region (%*) ....... 82
Table II.20 Proportion of foreign students enrolled in ETPs in 2013/14 – by region (% and mean) ............................................................................................................ 83
Table II.21 Characteristics of the curriculum of the ETPs – by degree awarded at the end of the programme (%, multiple replies possible) ..................................... 87
Table II.22 Characteristics of the curriculum of the ETPs – by main subject area (%, multiple replies possible) .................................................................................... 89
Table II.23 Characteristics of the curriculum of the ETPs – by region (%, multiple replies possible) .................................................................................... 92
Table II.24 Significant difficulties which affected the running of the ETPs – by region (%*, multiple replies possible) ................................................................................... 95
Table III.1 Positive rating (good or very good) of the proficiency in English of students enrolled in the ETPs – by degree awarded at the end of the programme (%*) ......... 99
English-Taught Programmes in European Higher Education
8

9
List of tables
Table III.2 Positive rating of the proficiency in English of students enrolled in the ETPs – by main subject area (%*) ....................................................................................... 100
Table III.3 Positive rating of the proficiency in English of students, academic and administrative staff members involved in ETPs – by country (%*) ................... 100
Table III.4 Positive rating of the proficiency in English of students, academic and administrative staff members involved in ETPs – by region (%*) ..................... 103
Table III.5 Offer of language training especially tailored for students enrolled in ETPs – by region (%, multiple replies possible)................................................................... 109
Table III.6 Offer of language training especially tailored for students enrolled in ETPs – by country (%, multiple replies possible) ................................................................ 111
Table III.7 Employment of specific means to ensure and/or enhance the English proficiency of academic staff involved in the ETPs – by region (%, multiple replies possible) .... 113
Table III.8 Employment of specific means to ensure and/or enhance the English proficiency of academic staff involved in the ETPs – by country (%, multiple replies possible) .. 114
Table III.9 Consequences, if academic staff members involved in English-Language-Taught Programmes do not have a sufficient level of English – by country (%) ................. 115
Table III.10 Employment of specific means to ensure and/or enhance the English proficiency of administrative staff involved in the ETPs – by region (%, multiple replies possible) .................................................................................. 117
Table III.11 Employment of specific means to ensure and/or enhance the English proficiency of administrative staff involved in the ETPs – by country (%, multiple replies possible) .................................................................................. 118
Table IV.1 Changes of institutional policies and administrative procedures caused by the introduction and running of English-Taught Programme(s) – by highest degree awarded by the institution (%*) ................................................. 120
Table IV.2 Changes of institutional policies and administrative procedures caused by the introduction and running of English-Taught Programme(s) – by region (%*) .. 121
English-Taught Programmes in European Higher Education
10
Table IV.3 Changes of institutional policies and administrative procedures caused by the introduction and running of English-Taught Programme(s) – by country of institution (%*) ................................................................................... 123
Table IV.4 Documents relevant for foreign students that are provided in English – by highest degree awarded at the institution (%, multiple replies possible) ........... 126
Table IV.5 Documents relevant for foreign students that are provided in English – by region (%, multiple replies possible)................................................................... 127
Table IV.6Documents relevant for foreign students that are provided in English – by country (%, multiple replies possible) ................................................................ 129
List of charts
Chart II.1Proportion of newly introduced ETPs – by year of introduction of programme (%) ... 64
Chart II.2 Home country/region of students enrolled in the ETPs in the academic year 2013/14 – by country (%) .......................................................................................... 85
Chart III.1Significant problems encountered with language proficiency – by type of respondents (%*) ................................................................................................. 104
Chart III.2Offer of language training especially tailored for students enrolled in ETPs – by type of respondent (%, multiple replies possible) ................ 107
11
Abbreviations
Abbreviations
ACA Academic Cooperation Association
EMI English-Medium Instruction
ETP(s) English-Taught Programme(s)
GES Gesellschaft für Empirische Studien (Group of Experts for Empirical Studies)
AT Austria
BE Belgium
BG Bulgaria
CH Switzerland
CY Cyprus
CZ Czech Republic
DE Germany
DK Denmark
EE Estonia
ES Spain
FI Finland
FR France
GR Greece
HR Croatia
HU Hungary
IS Iceland
IT Italy
LT Lithuania
LV Latvia
NL The Netherlands
NO Norway
PL Poland
PT Portugal
RO Romania
SE Sweden
SI Slovenia
SK Slovak Republic
TR Turkey

English-Taught Programmes in European Higher Education
12
Country Groups in the Study
Baltic: − EE Estonia − LT Lithuania − LV Latvia
Central East Europe: − CZ Czech Republic − HU Hungary − PL Poland − SI Slovenia − SK Slovak Republic
Central West Europe: − AT Austria − BE Belgium − CH Switzerland − DE Germany − NL The Netherlands
Nordic: − DK Denmark − FI Finland − IS Iceland − NO Norway − SE Sweden
South East Europe: − BG Bulgaria − CY Cyprus − GR Greece − CR Croatia − RO Romania − TR Turkey
South West Europe: − ES Spain − FR France − IT Italy − PT Portugal
13
Acknowledgements
Acknowledgements
Bernd Wächter (ACA)
This is the third study which the Academic Cooperation Association (ACA) is devoting to the theme of English-medium instruction in Europe. Like the first two reports, this one is the result of a cooperative effort between ACA and the Group of Experts for Empirical Studies (GES), a German company for empirical research in the field of higher education. For the first time, however, a third institutional partner was involved – StudyPortals BV, a Dutch start-up company specialising in online information tools on a wide range of aspects of the internationalisation of European higher education.
As in the past, the editors of the present study are Bernd Wächter and Fried-helm Maiworm. But they are just the tip of the iceberg. Considerable parts of the study have been written by Irina Ferencz and Queenie K.H. Lam of ACA. StudyPortals BV in general and Joran van Aart and Tiina Niemi in particular, have supported the project in a major way by contacting the Programme Directors of English-Taught Programmes across Europe. The research team also had great support from Marija Mitic, who worked at the ACA Secretariat in 2014 and provided highly welcome help in the final phase of writing up this study.
However, these three organisations, to whom the authors of this study belong, are by no means the only fathers and mothers of the present study. Many contributed considerably to the present publication. First among these is a network of renowned experts on higher education in general and English-medium instruction in particular, who formed the Quality Council of the pro-ject. This body was chaired and steered by Ulrich Teichler (Kassel, Germany), whose impartial, thorough and at any time very robust advice was invaluable. We are further indebted to the other members of the Quality Council, who likewise put considerable time and energy into advising the team of authors on the basic design as well as on the draft study. These were: Gordon Cheung (Hong Kong), Michael Gaebel (Brussels), Christian Mossmann (Exeter), Sabine Pendl (Graz), Rok Primožic (Brussels), Stefan Jahnke (Brussels), Leasa We-imer (Jyväskylä), and, last but not at all least, Karen M. Lauridsen (Aarhus).
Karen M. Lauridsen and many of her colleagues in Europe who cooperate in the framework of the IntlUni Project also supported the researcher team by providing highly important contextual information about linguistic and inter-cultural issues in the ‘international classroom’. We are further indebted to col-leagues in national ministries for education and to researchers into higher ed-ucation from all over Europe for providing us with information about the legal and regulatory framework for English-medium instruction in their countries.
English-Taught Programmes in European Higher Education
14
But first and foremost, it is Europe’s higher education institutions and the directors of English-Taught Programmes that the authors owe thanks. With-out their willingness to provide information and data on their English-Taught Programmes, this study would not be available.
Bernd Wächter (on behalf of the research team)
Brussels, November 2014

15
Executive summary
Executive summary
Queenie K.H. Lam, Bernd Wächter (ACA)
The present study was produced between October 2013 and November 2014 by the Academic Cooperation Association (ACA), in collaboration with the Gesellschaft für Empirische Studien (GES) and StudyPortals BV. The study was made possible by a grant from the Lifelong Learning Programme (Ac-companying Measures) of the European Commission’s Directorate General for Education and Culture.
History
The present study is the third one which maps and analyses the provision of English-Taught Programmes (ETPs) in Europe. The earlier studies1 appeared in 2002 and 2008. The 2002 study was the first ever attempt to investigate systematically the phenomenon of ETPs in non-English-speaking countries in Europe, i.e. in countries where English is not the domestic language. Its results were based on two large-scale surveys (the Institutional Survey and Programme Survey) of almost 1,600 higher education institutions in 19 Euro-pean countries. From among a total of 821 institutions which responded to the survey, 725 programmes taught in English were identified and their char-acteristics described. For the first time, some hard facts were made avail-able to inform and turn more rational a heated debate going on at the time on the provision of ETPs in non-English-speaking European countries. Five years later, in 2007, ACA and GES repeated the surveys to keep track of the development of ETPs and investigate both the quantitative and qualita-tive aspects of such programmes. The geographical coverage of the second study was expanded to 27 countries2 and the definition of ETPs narrowed to include only programmes taught fully in English. The 2007 surveys addressed 2,218 higher education institutions and identified 2,389 ETPs. This indicated substantial growth in ETP provision when compared with the earlier study, although such provision remained the exception and outside the mainstream. In 2007, only between 2.1% and 6.8% of all programmes were taught in English; and enrolment in ETPs amounted to just between 0.7% and 1.4% of
1 The two previous studies being: ETPs in European Higher Education. The Picture in 2007.Wächter, Bernd & Maiworm, Friedhelm. Bonn: Lemmens, 2008. ISBN 978-3-932306-89-1.English-Language-Taught Degree Programmes in European Higher Education.Friedhelm Maiworm, Bernd Wächter. Bonn: Lemmens 2002. ISBN 3-932306-47-3.2 The 27 EU member states at the time (minus the United Kingdom, Ireland, Malta and Luxem-bourg), the four European Free Trade Association (EFTA) countries (minus Liechtenstein), plus Turkey.
English-Taught Programmes in European Higher Education
16
enrolment in all programmes. Besides, the earlier findings showing that the provision of ETPs was largely concentrated in Central West Europe (with the Netherlands and, Germany in the lead) and the Nordic countries, and that there was a visible North-South divide were both confirmed in 2007.
In order to guarantee comparability with the results of the earlier studies and be able to create a time series, the design of the present study and, in par-ticular, the questionnaires used in the main surveys, was purposely kept, to the greatest extent possible, similar to that of the previous two studies. ‘Eu-rope’ this time consists of 28 countries3 with the addition of Croatia, a new EU member state since 2013. The Institutional Survey 2014 addressed a total of 2,637 higher education institutions in the 28 countries. Among them 1,155 responded, accounting for a response rate of 43.8%, which is lower than the 52.7% in our 2001 Institutional Survey but higher than the 38.4% in the one carried out in 2007. Comparatively speaking, the response rate of the 2014 Programme Survey, at 16.2%, is much lower than that in the two predecessor studies. However, in absolute terms, the number of programmes responded to the survey remains high at 1,154, largely due to the record high number of ETPs identified, which is 8,089 in 2014.
Volume and country distribution as in 2014
The big picture
In short, the numbers of identified ETPs went up from 725 programmes in 2001, to 2,389 in 2007 and to 8,089 in the present study. Although we have reasons to believe that the exponential growth since 2001 might be a com-bined result of actual growth over the years and possible undercounts in the earlier studies, there is now little doubt that a critical mass of ETPs is on offer across non-English-speaking Europe.
The largest absolute number of ETPs was identified in the Netherlands (1,078), whose growth (39.3%) is still below the European average. Closely following the Netherlands is Germany (1,030). Sweden follows in third place (822), ahead of France (499) and Denmark (494). It is interesting to note that some countries with relatively low numbers of programmes in the earlier studies, such as Poland (405), have seen above average growth rates. The same goes for Estonia, where 18 ETPs were identified in 2007 compared with 59 in 2014. These figures indicate that while traditional ETP leaders in Central West Europe and Nordic countries continue to consolidate their positions, new players from Central East Europe and, in particular, the Baltic states are catching up fast.
3 The same 27 countries surveyed in 2007, plus Croatia a new EU member state added in 2013.
17
Executive summary
Despite the remarkable growth of ETPs, only a small proportion of students across Europe are enrolled in ETPs (1.3% of total student enrolment in the countries covered, which translates into an estimate of 290,0004 students in the academic year 2013/14). Overall, 27% of the higher education institutions addressed in the study5 offered at least one ETP and about 6% of all study programmes estimated are provided exclusively in English6. Even fewer of these programmes enrolled only domestic students (5% of ETPs responded to the survey) or primarily domestic students (20%).
Having said that, one must note that there are considerable regional differ-ences in the spread of ETPs and size of enrolment. Most common are ETPs in the Nordic region where 61% of institutions offer Bachelor and/or Master programmes completely taught in English, 20% of all programmes fall into this category and 5% of all students are enrolled in ETPs. Central West Eu-rope and the Baltic states follow with a substantial proportion of institutions offering ETPs (44.5% and 38.7% respectively), a share of ETPs at about 10% of all study programmes and an enrolment share of about 2%. In all other regions at most one fifth of institutions are running ETPs, at most 5% of all programmes are ETPs and not more than 1% of students are enrolled. The North-South divide observed in the previous two studies clearly remains.
Leading ETP providers in non-English-speaking Europe
In order to identify the ‘leaders’ in ETP provision, a ‘league table’ was cre-ated, based on three indicators. These are the share of higher education insti-tutions in a country offering ETPs at all, the share of ETPs of all programmes, and the enrolment in ETPs as a share of total enrolment of a country. Coun-tries were ranked on each of these indicators, their rank values added up and divided by three. The country with the lowest value is on top, the one with the highest at the bottom. The Netherlands, Denmark and Sweden, in that order, are the European leaders in the provision of higher education provided in English, followed by Finland, Cyprus, Switzerland, Lithuania and Latvia. Countries such as Hungary and Germany form a middle group, while South Europe (with the notable exception of Cyprus) very much lags behind.
Overall, it is remarkable that all five Nordic countries, as well as all three Baltic ones, are amongst the first twelve countries. The Nordics have consistently been on upper ranks in our earlier studies. The new runners up are clearly the Baltics. Lithuania and Latvia are in the top 10 group and Estonia is slightly
4 Of these, the far largest numbers are found in the Netherlands (57,000), in Denmark (34,000), Germany (30,500), and Sweden (20,100) (see Table I.7). 5 Calculated on the basis of information provided by StudyPortals BV and responses to the Institutional Survey6 Calculated on the basis of information gathered with the help of the Institutional Survey
English-Taught Programmes in European Higher Education
18
below, in 12th place. The overall ranking also confirms the 2001 and 2007 pat-tern of a ‘north-south divide’.
Institutional context
Not surprisingly, PhD-awarding universities with a large student population and a wide subject range offer the highest number of English-Taught pro-grammes. The same was found in the previous two studies.
The vast majority of the respondents in the study named not only one single but several reasons as crucial for the introduction of ETPs. The two most frequently stated reasons are student-oriented a) to remove language obsta-cles for the enrolment of foreign students and b) to improve the international competences of domestic students. Another important motive is the pos-sible contribution of ETPs to the sharpening of the international profile of the institution, interestingly not only for fostering partnerships with institutions from other countries but also for sharpening their profile in comparison with other institutions in their own country. Also not a big surprise, the intention to create ‘brain gain’, in terms of the attraction of future PhD students, in-ternational faculty and foreign students who could contribute to the future work force of their own country, turns out to be another highly cited reason. Overall, revenue generation is the least often stated reason, whereas altruistic motives – for example in the area of development cooperation – still play an astonishingly strong role.
What deserves some thought and attention in this study are the substan-tial regional differences in the reasons for introducing and running ETPs ob-served between institutions located in the Nordic region and Central West Europe on the one hand and institutions located in South and East Europe on the other hand. The largest difference is in the role of ETPs for the compensa-tion of shortages of the institutions, i.e. for improving the income base of the institution through tuition fees gathered from foreign students and for coun-terbalancing a lack of enrolment of domestic students. These aspects are far more often a motive for institutions from the Baltic States, from Central East Europe and from South East Europe than for institutions from other regions. Institutions from South European countries most often stated the improve-ment of international competences of domestic students as the major goal.
The reasons associated with the offer of ETPs further differ between the Bachelor and the Master level. Programme Directors of Master programmes more frequently highlighted the importance of removing language obstacles for the enrolment of foreign students (82% in comparison to 68%) and to at-tract top talents like future PhD students (74% compared to 40%). Directors of Bachelor programmes on the other hand put more emphasis than directors
19
Executive summary
of Master programmes on the role of ETPs for the improvement of interna-tional competences of domestic students, the sharpening of the international profile of the institution and the compensation of shortages of the institution.
As for reasons not to offer ETPs, they mainly concern the lack of language proficiency of the staff, the lack of confidence that the programme will meet any demand from the students and the lack of funding in general and of hu-man resources in particular. Some considered it ‘unnecessary’ to offer ETPs as they can also attract some foreign students for study in the domestic language. This was stated more frequently by respondents from more widely spoken language communities, such as German, French or Spanish. In some countries, external constraints, of a legal or regulatory sort, hinder the spread of ETPs. In a number of countries in Central East Europe, but also in countries with more than one domestic language, there is the requirement to double an ETP with one in the domestic language.
Operational aspects of ETPs
Characteristics of ETPs
ETPs in Europe are predominantly offered in the second cycle (Master level). Four fifths of all programmes (80%) belong to this category. Only 20% are Bachelor programmes. These figures are identical with those found in 2007. The dominance of Master programmes is strongest in Central West Europe (91%), South West Europe (91%) and the Nordic countries (82%). On the contrary, ETPs in South East Europe (61%), Central East Europe (42%) and the Baltics (34%) lead more often to a Bachelor degree than on the European average.
How old are ETPs? This is not only of interest to historians, but it also dis-plays ‘growth curve’. The years 2009 and 2010 saw a peak in the creation of new ETPs. Since then, growth has continued, but at lower rates. Whether this is indicative of a future stagnation at a high level remains to be seen. As was already the case in the predecessor studies, the ‘age’ of ETPs differs between countries. A comparable high proportion of programmes starting in recent years, i.e. since 2011, could be found in South West and Central East Europe (respectively 37% and 35%) and the Baltics (33%).
In terms of duration, the completion of a second-cycle degree (Master) re-quires two years in the majority of Master programmes (67%). Only 18% offer a Master degree within only one year and 10% have a standard period of 1.5 years. Long university programmes of four or more years leading to a Master equivalent degree are a clear minority. It is interesting to note that short Mas-ter programmes of less than two years’ duration are most common in Spain
English-Taught Programmes in European Higher Education
20
(85% of the respective programmes), Switzerland (65%), Latvia (55%) and the Netherlands (51%).
According to the ISCED 2011 classification of broad groups and fields of education, the highest proportion of ETPs covered by the survey is offered in social sciences, business and law (35%), followed by sciences (23%) and engineering, manufacturing and construction (18%). All other subject areas remain below 10%, although a large variety of subjects are available as ETPs in Europe as indicated in StudyPortals' database.
The overall distribution across disciplines differs by levels of study. The sub-ject area group of social sciences, business and law is the clear leader in undergraduate (Bachelor-level) programmes (42%). Programmes in natural sciences, on the other hand, tend to be offered more often at the Master level (26% as compared to 11% at the Bachelor level).
Student enrolment
Bachelor programmes are considerably larger than Master programmes in terms of programme size. In the academic year 2013/14 about two thirds of all Bachelor programmes (66%) have an enrolment of above 50 students, while the respective proportion of Master programmes is only about one quarter (26%). The smaller programme size of Master programmes is not country specific, but the rule throughout all regions.
With regard to selectivity, a comparison of the number of applicants with the number of first year students shows, on average, a demand six times higher than the offer (places available). Admission in Bachelor programmes taught in English is not as selective as that in Master programmes (31% success rate compared to 14%). In contrast, the number of applicants for Master programmes is often three or more times higher than the number of first year students admitted.
In terms of student mix, on the European average about 54% of all students enrolled in ETPs are foreign students. In the 2007 surveys, their proportion was considerably higher, at 65%, and in 2002 only slightly higher, at 60%. Most ETPs now have a mix of foreign and domestic students. Only 5% of the ETPs surveyed reported that only domestic students are enrolled in their programmes. On the other hand, 10% of ETPs stated that all students are from outside their own country. Comparatively speaking, ETPs in the Baltics and in South East Europe tend to enrol domestic students, while those in the Nordic region and Central West Europe foreign students. The proportion of foreign students in Master programmes is on average substantially higher than in Bachelor programmes (57% as compared to 39%).
21
Executive summary
The enrolment of domestic and foreign students in ETPs differs substan-tially by country. Domestic students have a share of more than three quarters in Lithuania (97%), Latvia (92%), Romania (90%) and Turkey (84%). On the other hand, the proportion of foreign students from non-EU/EFTA countries is highest in Poland (54%), Belgium (54%), Finland (54%) and Germany (51%).
Student admission practice
The most important criteria for selecting students for both Bachelor and Mas-ter programmes are the academic and intellectual potential of the applicants (92% of the programmes apply these selection criteria) and the proficiency in English (88%). Following that, personality, social and cultural competences are more often a selection criterion for Bachelor programmes whereas practi-cal experience plays a more important role in Master programmes. Altogeth-er, only a few programmes rely solely on educational credentials like grades or certificates for the selection of students (7%).
More specifically, the requirement of an English test is most frequent in the Nordic countries (85%) and Central West Europe (80%), whereas only 41% of institutions in the Baltics have this requirement in place. It is also interesting to note that access to ETPs without the requirement to fulfil any specific cri-teria or passing tests is easiest in the Baltic countries (37%) and Central East Europe (23%). The Nordic, Central and South West countries have a very low proportion (9-10%) of institutions without any admission requirements.
Language matters
Language proficiency
The large majority of Programme Directors rated the proficiency in English of students enrolled in their ETPs as good or very good. The competences of domestic students were however more positively assessed than that of foreign students, at 80% with a good or very good command of English compared to 73%. The only exceptions are Spain, France, Italy and Turkey, where the profi-ciency of foreign students was rated higher than that of the domestic students.
The English proficiency of students also differs by subject area and study level. Students in social sciences, business and law, both foreign and do-mestic, were reported to be better prepared to learn in English than those in engineering, manufacturing and construction as well as in sciences. By level of study, both the English proficiency of Master-level foreign students (75% compared to 64%) and of domestic students (81% compared to 78%) was reported to be higher than those in Bachelor programmes. Correspondingly, regions where there has been high growth in the number of Bachelor pro-
English-Taught Programmes in European Higher Education
22
grammes taught in English (e.g. Central East Europe and the Baltics) are also more likely to have enrolled students with lower English proficiency.
Among all the six regions compared in this study, Central East Europe, which provides over one third of the ETPs at Bachelor level responded to this sur-vey, reported the biggest concern over the English proficiency of foreign Bachelor students. Only 55% of the Programme Directors rated the English skills of these students positively.
As was found in the previous studies, the English proficiency of academic staff involved in the teaching of ETPs continues to be perceived positively across Europe. Almost all Programme Directors rated the English proficiency of aca-demic staff teaching in ETPs as good or very good (95%). Respondents from Spain were most critical of the English proficiency of their teaching staff (88%).
Contradictory to the nearly perfect picture presented above, the English proficiency of administrators was reportedly the least impressive among all those involved in ETPs, particularly in new growth countries (e.g. Turkey) and the south (e.g. Spain). This may not be a surprise though, considering that ETPs are a rather new phenomenon in these regions and that they are much more likely to enrol domestic students who are able to communicate in the domestic language.
Language problems
By and large, the command of English of both domestic students and foreign students appears to be more than sufficient according to the Institutional Co-ordinators and Programme Directors, but the ‘heterogeneity’ in the command of English of the students in the classroom was viewed as a problem. What has not changed over the years is the unmet expectation of the mastery of the domestic language by foreign students. This remains the most important language-related problem in the eyes of Institutional Coordinators.
In relation to the key language problem in classroom teaching – ‘heteroge-neity’ in the command of English, the main language-related challenge en-countered by teaching staff is their ability (or the lack of it) to deal with such diversity in addition to their mastery of the language itself.
Beyond the classroom, problems found among administrative staff were the most frequently reported in this study. The English proficiency of adminis-trative staff, especially those in central administration (such as the registry, financial office, housing office, student service centre, etc.), was regarded as least satisfactory by the survey respondents. Some Programme Directors pointed out that the administrative staff are not only unprepared to deal with students in English, but also unwilling to do so.

23
Executive summary
Language support measures
Corresponding to the perceived lack of domestic language skills among for-eign students, training in the domestic language for foreign students was more often mentioned than English language training for domestic or foreign students. Overall, less than one third of all responding programmes and insti-tutions provide no language training element at all (29% of the programmes and 27% of the institutions). More than half offer support for improving the command of the domestic language (55% and 58%), about half offer training in English for domestic students (48% and 51%) and foreign students (49% and 43%). With regard to training in the domestic language, South West Eu-rope, specifically France (71%) and Italy (68%), is the most active in this re-spect. This is followed by the Nordic and Baltic regions, as well as South East Europe, where the emphasis is placed on the Bachelor students.
By study level, English language training is more often a characteristic of first-cycle, Bachelor programmes. This corresponds to the reportedly lower English proficiency of students enrolled in Bachelor programmes. Specifi-cally, Bachelor students, both foreign and domestic, in South West Europe and South East Europe are more likely to receive English support than those in other regions.
In Central East Europe, where there is a large share of English-taught Bach-elor programmes and a serious problem perceived in the English proficiency of foreign Bachelor students, the emphasis has been placed on foreign Bach-elor students. On the contrary, in the Baltic region, and in particular Lithu-ania (79%), English language support has been primarily offered to domestic students since ETPs in this region attract predominantly domestic students (over 90% of students enrolled in ETPs).
Relating to the English skills of academic staff, about half of the Master pro-grammes and 70% of Bachelor programmes that responded to the survey reported that English proficiency is an important selection criterion for the recruitment of new academic staff. Denmark, Turkey and Belgium are the countries where two thirds of ETPs reported that English is a selection cri-terion for new staff recruitment. On the contrary, mandatory English courses for academic staff are rather rare (19% for Bachelor and 11% for Master pro-grammes). However, there are country differences. In Belgium and the Neth-erlands, 59% and 42% of all the programme respondents reported that it is mandatory for academic staff to improve their English. Less so, but still one third of the programmes in Hungary and Lithuania reported the same. Except the Netherlands, such a mandatory measure appears to be more commonly adopted by the ‘rising stars’ than those that are established providers (e.g. Norway and Sweden where no programme reported such a measure).

English-Taught Programmes in European Higher Education
24
As to administrative staff, the introduction of English proficiency as a selec-tion criterion was mentioned by 50% of the Programme Directors of Bachelor programmes and 43% of the Directors of Master programmes. This crite-rion was most frequently found in Austria (62%), the Czech Republic (62%), Hungary (61%), Switzerland (60%) and France (60%). Although mandatory measures to improve the English proficiency of administrative staff are rarely taken, nearly one fifth of the programmes in the Netherlands, Romania and Italy reported to have requested their staff to undergo such training.
Impact of ETPs
The most frequently mentioned effects of ETPs are an improved international profile/awareness of the institutions (84%), the strengthening of cooperation with foreign partner universities/institutions (81%) and the improvement of assistance/guidance/advice for foreign students (71%) which includes the provision of information and services in English. Furthermore, as a result of ETPs, 56% of respondents declared to attribute higher importance to mar-keting and promotion in general, as well as to the ‘targeted recruitment of students’ in particular (54%). Further effects are the increased offers for Eng-lish language training (51%) and a higher flexibility in the admission of foreign students (50%). Among the countries compared, we again observed a pat-tern that mature ETP providers, i.e. the Nordic countries and Central West Europe experienced less of the effects than the newcomers, i.e. the Baltic States, South East and South West Europe. This is new but not surprising as the young ones tend to change also faster.

25
Part I – The big picture
Part I – The big picture
Friedhelm Maiworm (GES), Bernd Wächter (ACA)
1 Objectives and methods
1.1 Background and aims
To increase the international mobility of students has been one of the most widely shared objectives of higher education policy in Europe in the past two or three decades. This goes for temporary (credit) mobility, which was boosted by the ERASMUS Programme started in 19877, but also for degree mobility, i.e. the study of a full degree programme in another country. In the policy discourse, international mobility is almost exclusively positively con-noted. It is viewed as resulting in a wide range of benefits, amongst them
– increasing international understanding (or, in Europe, the building of a Eu-ropean identity),
– educating future ‘ambassadors’ for the host country and the country of origin,
– learning ‘from contrast’
– enhancing education opportunities for students from low and middle in-come countries (including ‘developing’ countries)
– securing a steady inflow of talented students who would later become young researchers in the host countries and thus strengthen the higher education and research system,
– increasing labour market opportunities ‘abroad’ by providing graduates with an international experience and internationally valued competences (‘employability’ at home and abroad), and
– generating income by means of tuition fees in those countries where the latter can be charged.
Therefore, one of the policy priorities in Europe – and increasingly elsewhere in the world, too – has been to remove or to reduce barriers possibly pre-venting students from becoming internationally mobile. Efforts to remove
7 ERASMUS marked in many, though not in all European countries, the onset of large-scale student mobility. Some countries, such as Germany, had already had prior to ERASMUS, a con-siderable number of scholarship programmes both for outgoing and incoming mobility.

English-Taught Programmes in European Higher Education
26
mobility obstacles have included a systematic collaboration between study programmes in different countries to ease transition from one programme to another, the introduction of a ‘common exchange currency’ for study abroad in the form of the ECTS (both started in the context of the ERASMUS Pro-gramme and aiming at facilitating credit mobility), the creation of a ‘welcome culture’ for foreign students and the introduction of an array of student ser-vices, and even the introduction of a common (or, at any rate, very similar) degree architecture in Europe through the Bologna Process, which was be-lieved to facilitate mobility across country borders.
One major ‘mobility obstacle’ was obviously the language of instruction, which was, with very few exceptions, the domestic language (or one of them in multilingual countries) until the end of the last century. This posed an ‘ac-cess problem’ almost everywhere in Europe. But while countries with widely spoken languages, such as France or Germany, still were accessible for a larger number of foreign students, the problem in countries with more rarely spoken languages was severe. How could Iceland, Finland, Hungary or even the Netherlands ever hope of attracting considerable number of foreign stu-dents (credit and degree mobile students alike) if they continued to exclu-sively teach in their own language? One obvious strategy to overcome the ‘linguistic disadvantage’ was to revert to the most widely taught language in secondary education world-wide, i.e. English. This strategy appeared all the more promising since, from about the year 2000 onwards, an increasing number of European governments started to try to attract non-European stu-dents into their higher education institutions and mounted major marketing campaigns for this purpose. This group of foreign students could be even less expected to master (or even try to learn) the domestic language in their European host country. In addition, teaching in English and in a multi-national learner group was believed to be an attractive option for an internationalised education of domestic students, too.
However, the emerging trend to ‘go English’ was not greeted by all parties alike. When at the beginning of the present century this trend to offer ETPs in non-English-speaking countries set in8, it produced a controversial and at times highly emotional debate. There were signs that this debate would finally calm down. In our last book on ETPs published in 2008 (surveys conducted in 2007), we came to the conclusion that there was “normalcy, at last”. The authors have since developed second thoughts on this. Be that as it may, at the beginning of the century there were two camps when it came to English-
8 Some English-Taught Programmes were started in the 1990s and even the 1980s. Hungary started to offer even under a Communist government programmes in Medicine and Dentistry, and a number of countries provided programmes for students from developing countries in Eng-lish. But these were far and few between.

27
Part I – The big picture
medium instruction. Its proponents, who did not all claim there were no lan-guage issues at all, saw no alternative to the introduction of ETPs, given the ‘linguistic disadvantage’ of countries with small language communities ad-dressed earlier. The camp of the critics, on the other hand, painted a picture of gloom and doom. They predicted the death of many smaller languages as a medium of scientific expression (strangely ignoring the point that English-Medium Instruction, or EMI, is about education, and not - mainly - research and the publication of its results, which had switched to English quite some time earlier). Further claims were that EMI was incompatible with the national mission of higher education institutions to first and foremost educate their own citizens. Further, the allegation was that teaching and learning in a for-eign language would unavoidably lower the quality of education provided. Sometimes, claims went so far to suggest that in ETPs, students who did not understand English were taught by staff unable to speak and write the language properly. The heat of these discussions stood in remarkable con-trast to the very modest body of empirical knowledge available on the issue. At the turn of the millennium, there was not a single publication providing a comprehensive and systematic overview of the extent and the nature of the phenomenon in European higher education. Anybody could claim whatever – or the opposite – and get away with it. It was time to try to change this.
The predecessor studies
In this less than satisfactory situation, the Academic Cooperation Association (ACA) decided in the year 2000 to systematically investigate the phenomenon of ETPs in Europe. The outcome of this decision was the publication, in 2002, of English-Language-Taught Degree Programmes in European Higher Educa-tion: Trends and Success Factors, which ACA had produced in collaboration with the Gesellschaft für Empirische Studien (GES, Kassel, Germany). The study was based on the findings of two large-scale surveys of a total of 1,558 higher education institutions in 19 European countries.9 The study identified 725 programmes taught in English from among a total of 821 institutions which responded in the survey. These programmes represented between roughly two and four percent of all programmes on offer in the 19 countries and they enrolled between 0.2% and 0.5% of all students studying in the said countries. In other words, in 2001, when the surveys were carried out, English-medium instruction was a rare phenomenon. This applied to any country in Europe, even though most of the offer was concentrated in the Nordic countries and the Netherlands and southern Europe was largely ‘ETP free’. However, growth was fast.
9 The at that time 15 European Union member states with the exception of the UK, Ireland and Luxembourg, the four member states of EFTA excluding Liechtenstein, and four countries at the time in accession to the EU, the Czech Republic, Hungary, Poland and Slovakia.
English-Taught Programmes in European Higher Education
28
In order to keep track of developments, ACA and GES repeated the sur-veys five years later. The result was the publication ETPs in European Higher Education. The Picture in 2007, which appeared in 2008 but was based on surveys carried out in 2007. This time, the number of countries covered was 27.10 Unlike the first study, this one did no longer include programmes partly taught in English. This – and a few other but minor – changes apart, the de-sign of the study remained very much the same, which made comparisons with the results of the first surveys possible. The 2007 surveys addressed 2,218 higher education institutions and identified 2,389 ETPs. On average, between 2.1 and 6.8% of all programmes were taught in English, a clear rise on the earlier study. In terms of enrolment, between 0.7% and 1.4% of all programmes were in ETPs. Again, the Netherlands and the Nordic countries were amongst the leaders in offering such programmes.
Team, structure of the publication and issues covered
As was the case with the studies published in 2002 and 2008, the present publication was the result of a cooperative effort between ACA and GES. However, for the first time, the consortium also entailed the Dutch company StudyPortals BV, whose online database of ETPs proved to be very helpful for the production of this report. Further, the team was supported by Ulrich Teichler (Kassel, Germany), who acted as the head of an expert group, the External Quality Council, which advised on important aspects of methodol-ogy as well as on the substance of the publication itself.
Like the earlier studies, the present one tries to give a detailed account of the volumes as well as the nature of the European offer of ETPs. In this attempt, it addresses the following issues, amongst others:
What are the volumes of ETPs in Europe in 2014? Has growth continued since 2007, and has perhaps even a ‘critical mass’ been reached, exceeding the modest levels reached earlier? Have there been any marked changes in the European ‘ETP league table’, or is the north and the north-west of Europe still in the lead, as was the case earlier? The answers to these questions are addressed in Sub-section 2, which follows right onto this methodological section. Both sections are part of Part I of this publication.
So is Sub-section 3, which explores which kinds of higher education insti-tutions are offering ETPs and which not. Is the offer concentrated in large, research-focused universities, or are ETPs more common in smaller and spe-cialised institutions offering programmes up to the Master level? Are com-prehensive institutions (in terms of disciplinary focus) more likely to provide
10 The 27 EU member states at the time, minus the UK, Ireland, Malta and Luxembourg, the four EFTA countries minus Liechtenstein, plus Turkey.
29
Part I – The big picture
ETPs than their specialised counterparts? Sub-section 3 also deals with the reasons of institutions for offering ETPs – or not offering them.
Part II, which is made up of nine sections, deals with key features and as-pects of the daily operation of ETPs. While Part I deals, by and large, with the institutional level, the focus of Part II is on the ETPs as such. We address questions such as the age (year of creation) of ETPs, the level (Bachelor or Master) at which they are offered, and the subject areas they cover. Likewise, we are addressing questions related to the means and channels of market-ing, programme size and number of applicants, the regional origin of ETP stu-dents, characteristics of the curriculum beyond the fact that the programmes are taught in English, and, last but not least, the main challenges encountered in the operation of ETPs.
Part III focusses on issues of language quality. This means first and foremost the level of mastery of English of students, as well as of teaching (and, to a smaller degree, administrative) staff. However, Part III also addresses the de-gree of proficiency of ETP students in the domestic language.
Part IV, the final one, consists of three sections, which explore the wider in-stitutional impact of ETPs on institutional policies and administrative pro-cedures, the benefits of ETPs for participating students and the institution as such, and also look into the development of student services in English (potentially) as a result of ETPs.
The book ends with an outlook on the future of English-medium instruction in Europe.
1.2 Definitions
Which types of higher education programmes does this study cover, and which not? There was a need for definition concerning three main issues.
– Geographical coverage, or to put it differently, which countries are covered by the present study?
– Institutional eligibility: how was the sample of institutions which were ad-dressed in our surveys defined?
– ETPs: what exactly were the requirements for a programme to qualify as an English-Taught Programme?
The geographical coverage of the study is Europe. For the purposes of this study, “Europe” consists of the following 28 countries:

English-Taught Programmes in European Higher Education
30
– The member states of the European Union, which had grown from 27 to 28 since the 2007 surveys (with Croatia as the additional member state), except the United Kingdom, Ireland and Malta, where English is the (or a) standard medium of instruction, as well as Luxembourg (because of size). These are 24 countries.
– The countries making up the European Free Trade Association (EFTA), with the exception of Liechtenstein, which is a case similar to that of Luxem-bourg. These are Iceland, Liechtenstein and Norway.
– Turkey.
To increase comparability and be able to more clearly sketch the bigger pic-ture, the 28 countries have been grouped in 6 regions, the results being pre-sented both by country and by region (when interesting). This is a novelty compared to the 2002 and 2008 studies.
The 28 European countries covered in the study by region
Baltic: Nordic: EE Estonia DK Denmark LT Lithuania FI Finland LV Latvia IS Iceland NO Norway SE Sweden
Central East Europe: South East Europe: CZ Czech Republic BG Bulgaria HU Hungary CY Cyprus PL Poland GR Greece SI Slovenia HR Croatia SK Slovak Republic RO Romania TR Turkey
Central West Europe: South West Europe: AT Austria ES Spain BE Belgium FR France CH Switzerland IT Italy DE Germany PT Portugal NL The Netherlands
In these 28 countries, any higher education institution was included in the sam-ple which held a so-called “ERASMUS Charter” in the academic year 2012/13. Like in the predecessor studies, there were two sets of reasons for this “eligibil-
31
Part I – The big picture
ity criterion”, one pragmatic, the other substantive. The pragmatic reason was that we had access to the electronic addresses of all “Institutional ERASMUS Coordinators” of institutions with an “ERASMUS Charter”. This provided the project team with a “port of entry” in all institutions concerned, which is ex-tremely helpful in the case of a large-scale survey. One of the substantive rea-sons for the “ERASMUS charter” criterion was that universities and colleges able to participate in ERASMUS are chosen by the government of their country, and are therefore ‘recognised institutions’. At the same time, the policy of most countries for nominating institutions able to participate in ERASMUS is not se-lective, in the sense that only particularly high-performing institutions would be nominated. In other words, countries would only eliminate non-accredited insti-tutions. Therefore, the institutions addressed are fairly identical with the entirety of Europe's higher education institutions.11 The application of the above selec-tion criterion resulted in a total of 2,637 higher education institutions and thus over 400 more than in the surveys carried out in 2007.
Three criteria were applied to define an “English-taught” Programme.
– Programmes had to be either at Bachelor or Master level (or an equivalent of the latter). This had already been the case in our 2008 publication, though not in the first study of 2002. In accordance with the Bologna requirements, a Bachelor programme is defined as a first-cycle programme of at least three years’ duration. A Master programme is a second-cycle programme of at least one year’s duration and requiring, as a minimum entry qualifica-tion, a Bachelor degree, or a single-cycle ‘pre-Bologna’ qualification, of a minimum duration of four years. The study thus excluded, as already did the previous one, ‘short-cycle’ sub-Bachelor qualifications of under three years, but also PhD studies.
– In order to qualify, programmes had to be 100% taught in English. In other words, the study excluded “mixed” programmes taught predominantly, but not entirely in English. This approach had already been applied in our 2007 surveys, but not in the initial 2001 ones (where 21% of programmes identi-fied were ‘mixed-mode’).
– Like in the two predecessor studies, programmes in which English is (part of) the object of study, were excluded. Programmes in the area of English language and literature or in American Studies, to name only two examples, were not eligible.
We would like to let the reader know that in this study, like in our last one on the issue, we are using the terms English Taught Programmes and English-
11 Only in France and in Spain did we eliminate a number of institutions with an ERASMUS Char-ter from the list, because these offered only programmes at the sub-Bachelor level (ISCED 5).
English-Taught Programmes in European Higher Education
32
Medium Instruction synonymously. The same applies to the abbreviations for these terms, ETPs and EMI.
1.3 Methods
This study was carried out mainly with the help of four surveys, two smaller and two larger ones. These information and data sources were complement-ed by a review of relevant literature, internet searches and official legal or regulatory documentation.
The first of the two smaller surveys addressed a selection of the members of the IntlUni project (coordinated by Aarhus University in Denmark), which is an ERASMUS Academic Network addressing “the challenges of the multilin-gual and multicultural learning space of the international university”. In order to develop more targeted questions for the Institutional and the Programme Survey, the partners of this network were asked to detail quality challenges, particularly in the field of (English) language command of staff and students. The feedback from this small-scale survey consisting exclusively of open questions helped immensely to enrich and to better focus the questionnaires for the Institutional and Programme Surveys.
The second small-scale survey – again following mainly an open question ap-proach – was directed at staff of education ministries and other knowledge-able persons and sought to find out about legal and regulatory restrictions for the offer of ETPs, but also supporting measures, in the 28 countries covered by this study. The results of this survey, like those of the first one, are not separately presented in this study. But they have provided important contex-tual information, which has helped to interpret the quantitative and qualitative findings of the Institutional and the Programme Surveys.
Institutional Survey
The Institutional Survey addressed a total of 2,637 higher education institu-tions in the 28 countries covered by the study12. An Institutional Question-naire was sent to the ERASMUS Institutional Coordinators. Its prime purpose was to find out if these institutions offered ETPs or not, as well as to gather information and data on the institution which would be helpful in contextual-ising the findings of this study. The questionnaire also contained questions on the experiences made in the introduction and operation of ETPs at the in-stitutional level. The majority of questions were ‘closed’, but the Institutional Survey still contained more open questions than those of 2007, particularly
12 The original size of the sample was 3,042 higher education institutions of which 405 could not be contacted due to invalid e-mail addresses of our contact points, i.e. the ERASMUS Institu-tional Coordinators.
33
Part I – The big picture
on issues of (English) language quality. The questionnaire also asked institu-tions to provide the names and contact details of up to 10 ETPs per institu-tion. Since we intended to rely, in the Programme Survey, on the coordinators of programmes in StudyPortals’ database of ETPs in Europe, this information was intended to open the possibility of a “Plan B”, in case the return rate from contact persons in the StudyPortals’ database would be below expectations.
The Institutional Survey was carried out between February and June 2014. Three rounds of reminder e-mails were sent to unresponsive addressees. This way, 1,155 higher education institutions filled in the Institutional Ques-tionnaire. The return rate across Europe was 43.8% (Table I.1). This compares with a return rate of 52.7% in our 2001 Institutional Survey, and 38.4% in the one carried out in 2007.
Programme Survey
The Programme Survey was carried out between April and July 2014. The original addressees were the Programme Directors of StudyPortals’ data-base on ETPs. It became soon clear that response rates would be low, de-spite concerted efforts to increase it, which is why ‘Plan B’ was soon acti-vated. This meant additionally addressing the Programme Directors identified through the Institutional Survey. Overall, 8,089 programmes taught in English could be identified with the help of StudyPortals’ database and the informa-tion provides by Institutional Coordinators.
However, not all of these programmes were addressed in the Programme Sur-vey. It turned out that, in the majority of cases, the contact persons for the StudyPortals’ database were not identical with the Programme Directors, but they were persons responsible for a larger number of ETPs – in some cases all of them – at their institutions. In order not to overburden these persons, they were asked to provide the necessary information for a maximum of 10 ETPs per institution. This way, the number of ETPs from StudyPortals’ database actu-ally addressed dropped to 6,009. By adding the 1,094 programmes additionally identified with the help of the Institutional Survey the sample for the survey consisted of 7,103 programmes. Even after a number of reminder rounds (for both the addressees responsible for StudyPortals-listed programmes and those identified through the Institutional Survey), the return rate remained very mod-est indeed. All in all, there were 1,154 respondents to the Programme Survey. This constituted 16.2% of all Programme Directors addressed. Countries with the highest response rates in 2014 were Estonia (34.8%), Slovakia (34.0%), countries with only one-digit response volumes were Bulgaria (6.3%), Slovenia (8.1%), Norway (8.2%), and Denmark (8.7%). Response patterns shifted from the earlier studies, where – with exceptions – the countries north of the Alps had high and southern European countries low response rates (Table I.2).
English-Taught Programmes in European Higher Education
34
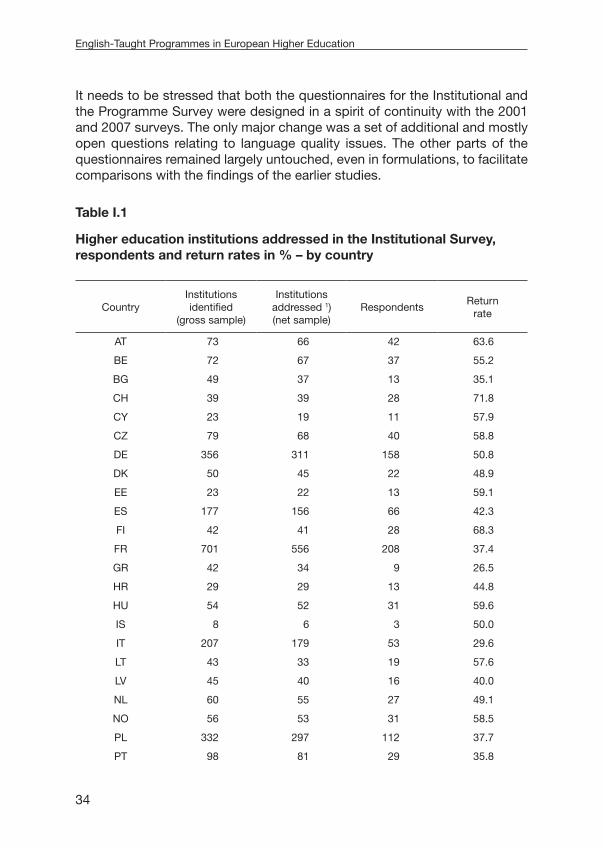
It needs to be stressed that both the questionnaires for the Institutional and the Programme Survey were designed in a spirit of continuity with the 2001 and 2007 surveys. The only major change was a set of additional and mostly open questions relating to language quality issues. The other parts of the questionnaires remained largely untouched, even in formulations, to facilitate comparisons with the findings of the earlier studies.
Table I.1
Higher education institutions addressed in the Institutional Survey, respondents and return rates in % – by country
CountryInstitutions identified
(gross sample)
Institutions addressed 1) (net sample)
RespondentsReturn
rate
AT 73 66 42 63.6
BE 72 67 37 55.2
BG 49 37 13 35.1
CH 39 39 28 71.8
CY 23 19 11 57.9
CZ 79 68 40 58.8
DE 356 311 158 50.8
DK 50 45 22 48.9
EE 23 22 13 59.1
ES 177 156 66 42.3
FI 42 41 28 68.3
FR 701 556 208 37.4
GR 42 34 9 26.5
HR 29 29 13 44.8
HU 54 52 31 59.6
IS 8 6 3 50.0
IT 207 179 53 29.6
LT 43 33 19 57.6
LV 45 40 16 40.0
NL 60 55 27 49.1
NO 56 53 31 58.5
PL 332 297 112 37.7
PT 98 81 29 35.8

35
Part I – The big picture
CountryInstitutions identified
(gross sample)
Institutions addressed 1) (net sample)
RespondentsReturn
rate
RO 77 65 23 35.4
SE 42 41 21 51.2
SI 70 65 27 41.5
SK 33 30 20 66.7
TR 162 150 55 36.7
Total 3,042 2,637 1,155 43.8
Source: Database of ERASMUS Institutional Coordinators of the European Commission 20131) 405 institutions could not be reached because of invalid e-mail addresses of ERASMUS Institutional Coordinators
Table I.2
ETPs addressed in the Programme Survey, respondents and return rates in % – by country
Country ETPs identified 1)
(gross sample)
ETPs addressed 1) (net sample)
Respondents Return rate
AT 225 222 36 16.2
BE 202 196 47 24.0
BG 32 32 2 6.3
CH 236 230 29 12.6
CY 102 73 9 12.3
CZ 202 199 57 28.6
DE 1,030 1,001 185 18.5
DK 494 392 34 8.7
EE 59 46 16 34.8
ES 417 359 48 13.4
FI 395 347 84 24.2
FR 499 485 87 17.9
GR 24 24 4 16.7
HR 12 12 3 25.0
HU 183 159 45 28.3
IS 33 33 7 21.2
IT 307 281 70 24.9

English-Taught Programmes in European Higher Education
36
Country ETPs identified 1)
(gross sample)
ETPs addressed 1) (net sample)
Respondents Return rate
LT 187 171 25 14.6
LV 99 90 21 23.3
NL 1,078 797 80 10.0
NO 187 183 15 8.2
PL 405 377 51 13.5
PT 139 138 40 29.0
RO 85 80 14 17.5
SE 822 666 93 14.0
SI 99 99 8 8.1
SK 77 53 18 34.0
TR 459 358 26 7.3
Total 8,089 7,103 1,154 16.2
Source: StudyPortals’ database on ETPs in addition with ETPs identified with the help of the Institutional Survey1) Per contact person the number of ETPs included in the sample was limited to a maximum of 10 ETPs.
As explained earlier, the study had been designed in such a way that the data necessary to answer our questions would become available through two sourc-es: a) the Institutional Survey and b) the data bases of StudyPortals, a leading web platform for the provision of information about study programmes at higher education institutions in European countries but also beyond Europe. Especially through the cooperation with StudyPortals, the information base on the number of institutions offering ETPs and the number of ETPs is much more comprehen-sive than it was in the previous ACA studies published in 2002 and 2008. On the other hand, there are downsides. The very strong growth of ETPs observed since the first survey in 2001 might be slightly misleading. The numbers went up from the originally 725 programmes identified in 2001, to 2,389 in 2007 and to 8,089 in the present study. The authors have no reason to mistrust the data of the present study, but it could easily be that our earlier studies produced an undercount of ETPs, since the StudyPortals database did not yet exist, and the 2001 and 2007 surveys might have failed to identify a considerable number of ETPs.
The number of students enrolled in ETPs became available solely through the Institutional Survey. Since a substantial number of institutions did either not return the Institutional Questionnaire at all, or did not answer the questions on enrolment, the body of data on enrolment is more incomplete (and thus slimmer), which obviously entails that the conclusions derived from the enrol-ment information should be looked at with some reservations.

37
Part I – The big picture
2 Status quo and quantitative trends in the provision of ETPs
Before presenting detailed findings about institutions offering ETPs and ma-jor characteristics of this kind of study programmes, the authors found it use-ful to provide an overview of the main quantitative trends with regard to three questions. First, is ETPs a sizeable phenomenon at all? Second, which of the 28 European countries included in the study are the ‘leaders’ in the provision of such education, and which offer few or none of these programmes? Third, in which way has the offer of programmes taught in English changed during the past thirteen years?
As described in detail in Sub-section 1, the study had been designed in a way that the data necessary to answer these questions would become available through three sources: a) the Institutional Survey, b) the Programme Survey and c) the ETP database of StudyPortals.
To remind readers we would like to recall some key findings contained in Ta-ble I.1 and I.2 in the previous section:
The total number of ETPs identified (not of those addressed, see earlier sec-tion) in all countries covered by the 2014 surveys was 8,089. This is an enor-mous growth on the number of programmes identified in 2007 (2,389). In percentage terms, growth in this period amounts to 239%.
The leading country with the highest offer of ETPs in terms of absolute numbers – which, we know, favour countries with large populations and higher education systems and are in this section always presented together with ‘weighted’ val-ues expressed in percentages – is the Netherlands (1,078 programmes) closely followed by Germany (1,030 programmes). Sweden is now at the third place, at 882 ETPs, ahead of France (499) and Denmark (494) (Table I.2).
2.1 Spread of ETPs and size of enrolment
In order to draw a realistic picture of the relative importance of ETPs, three particular questions needed to be answered:
– How many higher education institutions offer ETPs, and what is their pro-portion of all higher education institutions addressed in the study?
– How many ETPs are there, and what is their proportion of all programmes taught at the higher education institutions addressed in the study?
– How many students are enrolled in ETPs, and what is their proportion of

English-Taught Programmes in European Higher Education
38
all students enrolled in the higher education institutions addressed in the study?
Overall, 27% of higher education institutions addressed in the study offer ETPs and about six percent of all study programmes are provided in English. Despite these remarkable figures, the small proportion of students enrolled in ETPs (1.3%) makes it clear that ETPs are still a rare option for the student population as a whole (Table I.3).
Table I.3
Indicators for the quantitative importance of ETPs – by region (%)
Region Total
Nordic Baltic Central West
Europe
Central East
Europe
South West
Europe
South East
Europe
Proportion of higher education institutions offering ETPs 60.6 38.7 44.5 19.9 17.2 18.3 26.9
Proportion of study pro-grammes fully provided in English 19.9 10.3 9.9 5.0 2.8 2.1 5.7
Proportion of students enrolled in ETPs in the academic year 2013/14 5.3 1.7 2.2 1.0 0.5 0.8 1.3
Sources: Institutional Survey, Programme Survey, StudyPortals, EUROSTAT
A comparison by region13 shows considerable differences in the spread of ETPs and size of enrolment (see Table I.3). Most common are ETPs in the Nordic region where 61% of institutions offer Bachelor and/or Master pro-grammes completely taught in English, where ETPs make up 20% of all pro-grammes, and where five percent of total enrolment is in ETPs. Central West Europe and the Baltic states follow with a substantial proportion of institu-tions offering ETPs (44.5% and 38.7% respectively), a share of ETPs at about 10% of all study programmes and an enrolment share of about two percent. In all other regions at most one fifth of institutions are running ETPs, at most
13 The countries covered by this study were allocated to the following regions: Baltic region (Es-tonia, Latvia, Lithuania), Central East Europe (Czech Republic, Hungary, Poland, Slovenia, Slo-vak Republic), Central West Europe (Austria, Belgium, Germany, Switzerland, the Netherlands), Nordic region (Denmark, Finland, Iceland, Norway, Sweden), South East Europe (Bulgaria, Croa-tia, Cyprus, Greece, Romania, Turkey), and South West Europe (France, Italy, Portugal, Spain).
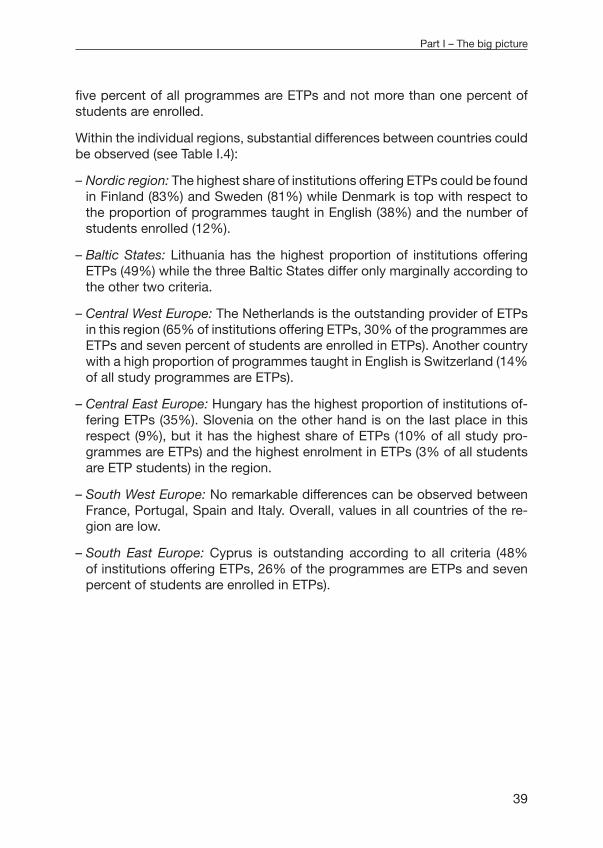
39
Part I – The big picture
five percent of all programmes are ETPs and not more than one percent of students are enrolled.
Within the individual regions, substantial differences between countries could be observed (see Table I.4):
– Nordic region: The highest share of institutions offering ETPs could be found in Finland (83%) and Sweden (81%) while Denmark is top with respect to the proportion of programmes taught in English (38%) and the number of students enrolled (12%).
– Baltic States: Lithuania has the highest proportion of institutions offering ETPs (49%) while the three Baltic States differ only marginally according to the other two criteria.
– Central West Europe: The Netherlands is the outstanding provider of ETPs in this region (65% of institutions offering ETPs, 30% of the programmes are ETPs and seven percent of students are enrolled in ETPs). Another country with a high proportion of programmes taught in English is Switzerland (14% of all study programmes are ETPs).
– Central East Europe: Hungary has the highest proportion of institutions of-fering ETPs (35%). Slovenia on the other hand is on the last place in this respect (9%), but it has the highest share of ETPs (10% of all study pro-grammes are ETPs) and the highest enrolment in ETPs (3% of all students are ETP students) in the region.
– South West Europe: No remarkable differences can be observed between France, Portugal, Spain and Italy. Overall, values in all countries of the re-gion are low.
– South East Europe: Cyprus is outstanding according to all criteria (48% of institutions offering ETPs, 26% of the programmes are ETPs and seven percent of students are enrolled in ETPs).

English-Taught Programmes in European Higher Education
40
Table I.4
Indicators for the quantitative importance of ETPs – by region and country (%)
Proportion of higher education institutions
offering ETPs
Proportion of study programmes
provided in English
Proportion of students enrolled in ETPs in the academic year
2013/14
Nordic countries 60.6 19.9 5.3
DK 48.0 38.0 12.4
FI 83.3 23.2 2.9
IS 50.0 3.3 1.6
NO 41.1 8.1 2.4
SE 81.0 24.2 4.4
Baltic countries 38.7 10.3 1.7
EE 30.4 9.1 1.5
LT 48.8 11.0 1.5
LV 33.3 9.9 2.2
Central West Europe 44.5 9.9 2.2
AT 46.6 9.4 1.8
BE 29.2 7.5 1.1
CH 48.7 13.9 2.1
DE 43.3 5.9 1.0
NL 65.0 29.9 7.2
Central East Europe 19.9 5.0 1.0
CZ 27.8 6.3 1.5
HU 35.2 5.5 2.0
PL 17.8 4.9 0.7
SI 8.6 9.9 2.7
SK 21.2 2.3 0.8
South West Europe 17.2 2.8 0.5
ES 20.3 2.3 0.3
FR 16.1 3.4 0.7
IT 19.8 2.9 0.5
PT 14.3 3.0 0.5
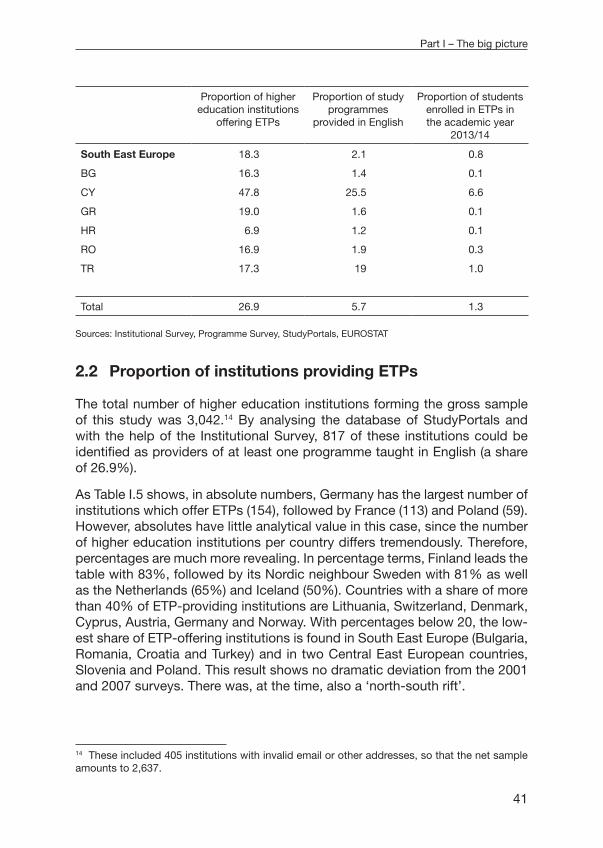
41
Part I – The big picture
Proportion of higher education institutions
offering ETPs
Proportion of study programmes
provided in English
Proportion of students enrolled in ETPs in the academic year
2013/14
South East Europe 18.3 2.1 0.8
BG 16.3 1.4 0.1
CY 47.8 25.5 6.6
GR 19.0 1.6 0.1
HR 6.9 1.2 0.1
RO 16.9 1.9 0.3
TR 17.3 19 1.0
Total 26.9 5.7 1.3
Sources: Institutional Survey, Programme Survey, StudyPortals, EUROSTAT
2.2 Proportion of institutions providing ETPs
The total number of higher education institutions forming the gross sample of this study was 3,042.14 By analysing the database of StudyPortals and with the help of the Institutional Survey, 817 of these institutions could be identified as providers of at least one programme taught in English (a share of 26.9%).
As Table I.5 shows, in absolute numbers, Germany has the largest number of institutions which offer ETPs (154), followed by France (113) and Poland (59). However, absolutes have little analytical value in this case, since the number of higher education institutions per country differs tremendously. Therefore, percentages are much more revealing. In percentage terms, Finland leads the table with 83%, followed by its Nordic neighbour Sweden with 81% as well as the Netherlands (65%) and Iceland (50%). Countries with a share of more than 40% of ETP-providing institutions are Lithuania, Switzerland, Denmark, Cyprus, Austria, Germany and Norway. With percentages below 20, the low-est share of ETP-offering institutions is found in South East Europe (Bulgaria, Romania, Croatia and Turkey) and in two Central East European countries, Slovenia and Poland. This result shows no dramatic deviation from the 2001 and 2007 surveys. There was, at the time, also a ‘north-south rift’.
14 These included 405 institutions with invalid email or other addresses, so that the net sample amounts to 2,637.

English-Taught Programmes in European Higher Education
42
Table I.5
Higher education institutions offering ETPs – by country (absolute numbers and %)
Country All Institutions 1) ETP-offering Institutions 2)
Share of ETP-offering institutions of all institutions (%)
AT 73 34 46.6
BE 72 21 29.2
BG 49 8 16.3
CH 39 19 48.7
CY 23 11 47.8
CZ 79 22 27.8
DE 356 154 43.3
DK 50 24 48.0
EE 23 7 30.4
ES 177 36 20.3
FI 42 35 83.3
FR 701 113 16.1
GR 42 8 19,0
HR 29 2 6,9
HU 54 19 35,2
IS 8 4 50.0
IT 207 41 19.8
LT 43 21 48.8
LV 45 15 33.3
NL 60 39 65.0
NO 56 23 41.1
PL 332 59 17.8
PT 98 14 14.3
RO 77 13 16.9
SE 42 34 81.0
SI 70 6 8.6
SK 33 7 21.2
TR 162 28 17.3
Total 3,042 817 26.9
1) Database of the European Commission on higher education institutions awarded an ERASMUS Charter2) Identified with the help of the data base of StudyPortals and the Institutional Survey
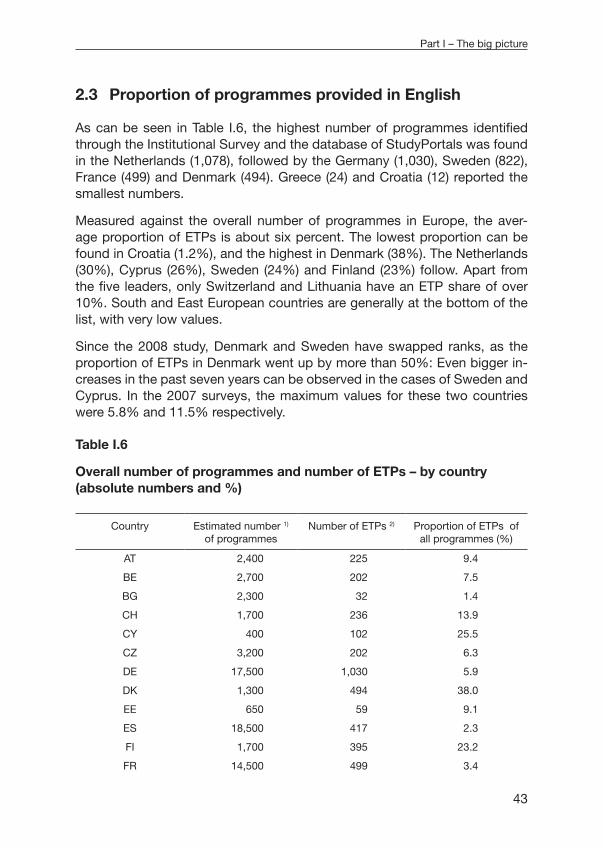
43
Part I – The big picture
2.3 Proportion of programmes provided in English
As can be seen in Table I.6, the highest number of programmes identified through the Institutional Survey and the database of StudyPortals was found in the Netherlands (1,078), followed by the Germany (1,030), Sweden (822), France (499) and Denmark (494). Greece (24) and Croatia (12) reported the smallest numbers.
Measured against the overall number of programmes in Europe, the aver-age proportion of ETPs is about six percent. The lowest proportion can be found in Croatia (1.2%), and the highest in Denmark (38%). The Netherlands (30%), Cyprus (26%), Sweden (24%) and Finland (23%) follow. Apart from the five leaders, only Switzerland and Lithuania have an ETP share of over 10%. South and East European countries are generally at the bottom of the list, with very low values.
Since the 2008 study, Denmark and Sweden have swapped ranks, as the proportion of ETPs in Denmark went up by more than 50%: Even bigger in-creases in the past seven years can be observed in the cases of Sweden and Cyprus. In the 2007 surveys, the maximum values for these two countries were 5.8% and 11.5% respectively.
Table I.6
Overall number of programmes and number of ETPs – by country (absolute numbers and %)
Country Estimated number 1) of programmes
Number of ETPs 2) Proportion of ETPs of all programmes (%)
AT 2,400 225 9.4
BE 2,700 202 7.5
BG 2,300 32 1.4
CH 1,700 236 13.9
CY 400 102 25.5
CZ 3,200 202 6.3
DE 17,500 1,030 5.9
DK 1,300 494 38.0
EE 650 59 9.1
ES 18,500 417 2.3
FI 1,700 395 23.2
FR 14,500 499 3.4
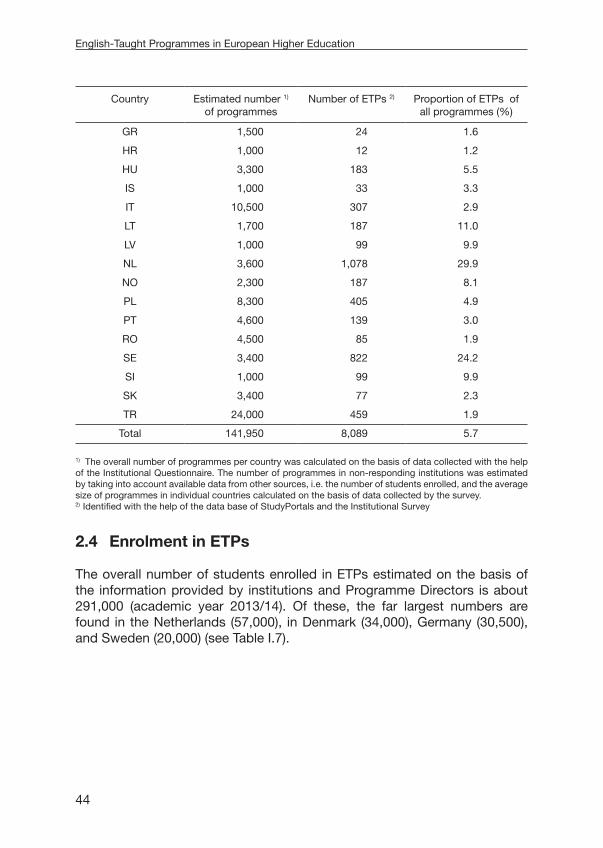
English-Taught Programmes in European Higher Education
44
Country Estimated number 1) of programmes
Number of ETPs 2) Proportion of ETPs of all programmes (%)
GR 1,500 24 1.6
HR 1,000 12 1.2
HU 3,300 183 5.5
IS 1,000 33 3.3
IT 10,500 307 2.9
LT 1,700 187 11.0
LV 1,000 99 9.9
NL 3,600 1,078 29.9
NO 2,300 187 8.1
PL 8,300 405 4.9
PT 4,600 139 3.0
RO 4,500 85 1.9
SE 3,400 822 24.2
SI 1,000 99 9.9
SK 3,400 77 2.3
TR 24,000 459 1.9
Total 141,950 8,089 5.7
1) The overall number of programmes per country was calculated on the basis of data collected with the help of the Institutional Questionnaire. The number of programmes in non-responding institutions was estimated by taking into account available data from other sources, i.e. the number of students enrolled, and the average size of programmes in individual countries calculated on the basis of data collected by the survey.2) Identified with the help of the data base of StudyPortals and the Institutional Survey
2.4 Enrolment in ETPs
The overall number of students enrolled in ETPs estimated on the basis of the information provided by institutions and Programme Directors is about 291,000 (academic year 2013/14). Of these, the far largest numbers are found in the Netherlands (57,000), in Denmark (34,000), Germany (30,500), and Sweden (20,000) (see Table I.7).

45
Part I – The big picture
Table I.7
Overall number of all students in 2012 and of students enrolled in ETPs in the academic year 2013/14 – by country (absolute numbers and %)
Country Total number of students 1)
Estimated number of ETP students 2)
Share of ETPs of all students (%)
AT 376,500 6,750 1.8
BE 477,700 5,350 1.1
BG 285,000 350 0.1
CH 269,600 5,700 2.1
CY 31,800 2,100 6.6
CZ 440,200 6,500 1.5
DE 2,939,500 30,500 1.0
DK 275,000 34,000 12.4
EE 67,600 1,000 1.5
ES 1,965,800 5,500 0.3
FI 308,900 9,000 2.9
FR 2,296,300 15,000 0.7
GR 663,700 400 0.1
HR 157,300 150 0.1
HU 380,800 7,600 2.0
IS 19,100 300 1.6
IT 1,925,900 10,500 0.5
LT 175,100 2,600 1.5
LV 97,000 2100 2.2
NL 793,700 57,000 7.2
NO 238,200 5,600 2.4
PL 2,007,200 13,200 0.7
PT 390,300 1,900 0.5
RO 705,300 2,000 0.3
SE 453,300 20,100 4.4
SI 104,000 2,800 2.7
SK 221,200 1,850 0.8
TR 4,353,500 41,500 1.0
Total 22,419,500 291,350 1.3
1) Source: EUROSTAT student numbers for the year 2012.2) The data were collected with the help of the Institutional and the Programme Questionnaire. The number of students in ETPs which did not provide numbers was estimated on the basis of the available information about the median number of students per ETP in the respective country.

English-Taught Programmes in European Higher Education
46
Looking at the steep growth curve of English-Medium Instruction in Europe since our first publication in 2002, there is only one thing that prevents us from talking of a critical mass which has now been achieved: the very low enrolment rates. On a European average, 1.3% of total enrolment is in ETPs. There are only few countries with a share of students in ETPs above two percent. With 12%, Denmark leads, followed by the Netherlands and Cyprus with seven percent each, and Sweden with four percent.
2.5 Leading countries in the provision of ETPs
In order to arrive at an overall (average) ranking of the individual countries as providers of ETPs, the three indicators used above were transformed into one single value. This was calculated by making the sum of each country’s rank rank (in relative, not in absolute, terms) for the three indicators, i.e.
– institutions offering ETPs
– study programmes fully taught in English, and
– student enrolment in those programmes
and by dividing the sum by three. The overall ranking gives an indication which countries are the leaders in the provision of study programmes pro-vided in English, and which ones score poorly.
The Netherlands, Denmark and Sweden, in that order, are the European lead-ers in the provision of higher education provided in English, followed by Fin-land, Cyprus, Switzerland, Lithuania and Latvia. Countries such as Hungary and Germany form a middle group, while South Europe very much lags be-hind (see Table I.8).
Overall, it is remarkable that all five Nordic countries, as well as all three Baltic ones, are amongst the first twelve countries. The Nordics have consistently been on top ranks in our earlier studies. The new runner ups are clearly the Baltics.

47
Part I – The big picture
Table I.8
Ranks of individual countries by three different criteria measuring the provision of ETPs
Institutions offering ETPs
Programmes taught
in English
Enrolment of students in ETPs
Country Rank Rank Rank Mean value Rank
NL 3 2 2 2.3 1
DK 7 1 1 3.0 2
SE 2 4 4 3.3 3
FI 1 5 5 3.7 4
CY 8 3 3 4.7 5
CH 6 6 9 7.0 6
LT 5 7 13 8.3 7
LV 13 8 8 9.7 8
AT 9 10 11 10.0 9
NO 11 12 7 10.0 9
IS 4 19 12 11.7 11
EE 14 11 13 12.7 12
HU 12 16 10 12.7 12
SI 27 8 6 13.7 14
DE 10 15 17 14.0 15
CZ 16 14 13 14.3 16
BE 15 13 16 14.7 17
PL 21 17 20 19.3 18
SK 17 22 19 19.3 18
IT 19 21 22 20.7 20
FR 25 18 20 21.0 21
TR 22 24 17 21.0 21
ES 18 22 24 21.3 23
PT 26 20 22 22.7 24
RO 23 24 24 23.7 25
GR 20 26 26 24.0 26
BG 24 27 26 25.7 27
HR 28 28 26 27.3 28
Source: Own calculations.

English-Taught Programmes in European Higher Education
48
The overall ranking confirms the 2002 and 2008 pattern of a ‘north-south divide’. The Netherlands is still on the top place and Sweden and Denmark have moved further to the top. The Baltics have moved up the list as Table I.8 shows. Lithuania and Latvia are in the top 10 group and Estonia is slightly below, in 12th place.
2.6 Change from 2007 to 2014
In the period since the last study in 2007, substantial growth in the number of ETPs could be observed in Europe. From 2,389 programmes identified in 2007 we have arrived to 8,089 programmes in 2014, i.e. the number has more than trebled in the past seven years. As Table I.9 shows, the growth rates were highest in South West Europe (866%) and in the Baltic States (516%). While most South European countries are still at the bottom of the ranking list - despite the impressive growth rates – the Baltic States have climbed up significantly during the past seven years. The pioneers in the implementation and running of ETPs, i.e. the countries in the Nordic region and in Central West Europe, are characterised by growth rates below the average. This is of course no surprise, given their leading role, where further growth becomes more and more difficult.
Table I.9
ETPs identified in 2007 and 2014 – by region in which the institutions are located (absolute numbers)
Region Total
Nordic Baltic Central West
Europe
Central East
Europe
South West
Europe
South East
Europe
ETPs identified in 2007 508 56 1,307 204 141 173 2,389
ETPs identified in 2014 1,931 345 2,771 966 1,362 714 8,089
Growth rates from 2007 to 2014 (%) 280 516 112 374 866 313 239
Sources: 2007: Institutional Survey and national databases on ETPs; 2014: StudyPortals and Institutional Survey
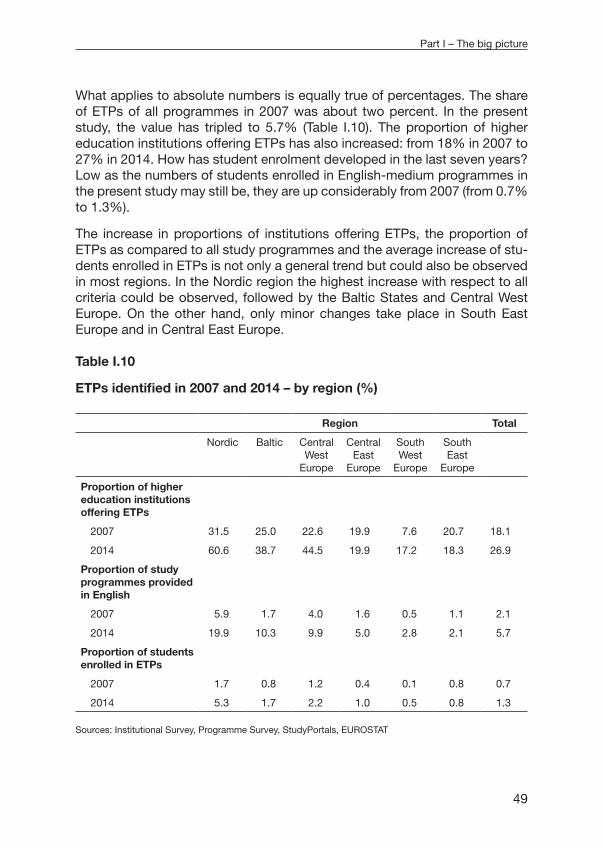
49
Part I – The big picture
What applies to absolute numbers is equally true of percentages. The share of ETPs of all programmes in 2007 was about two percent. In the present study, the value has tripled to 5.7% (Table I.10). The proportion of higher education institutions offering ETPs has also increased: from 18% in 2007 to 27% in 2014. How has student enrolment developed in the last seven years? Low as the numbers of students enrolled in English-medium programmes in the present study may still be, they are up considerably from 2007 (from 0.7% to 1.3%).
The increase in proportions of institutions offering ETPs, the proportion of ETPs as compared to all study programmes and the average increase of stu-dents enrolled in ETPs is not only a general trend but could also be observed in most regions. In the Nordic region the highest increase with respect to all criteria could be observed, followed by the Baltic States and Central West Europe. On the other hand, only minor changes take place in South East Europe and in Central East Europe.
Table I.10
ETPs identified in 2007 and 2014 – by region (%)
Region Total
Nordic Baltic Central West
Europe
Central East
Europe
South West
Europe
South East
Europe
Proportion of higher education institutions offering ETPs
2007 31.5 25.0 22.6 19.9 7.6 20.7 18.1
2014 60.6 38.7 44.5 19.9 17.2 18.3 26.9
Proportion of study programmes provided in English
2007 5.9 1.7 4.0 1.6 0.5 1.1 2.1
2014 19.9 10.3 9.9 5.0 2.8 2.1 5.7
Proportion of students enrolled in ETPs
2007 1.7 0.8 1.2 0.4 0.1 0.8 0.7
2014 5.3 1.7 2.2 1.0 0.5 0.8 1.3
Sources: Institutional Survey, Programme Survey, StudyPortals, EUROSTAT
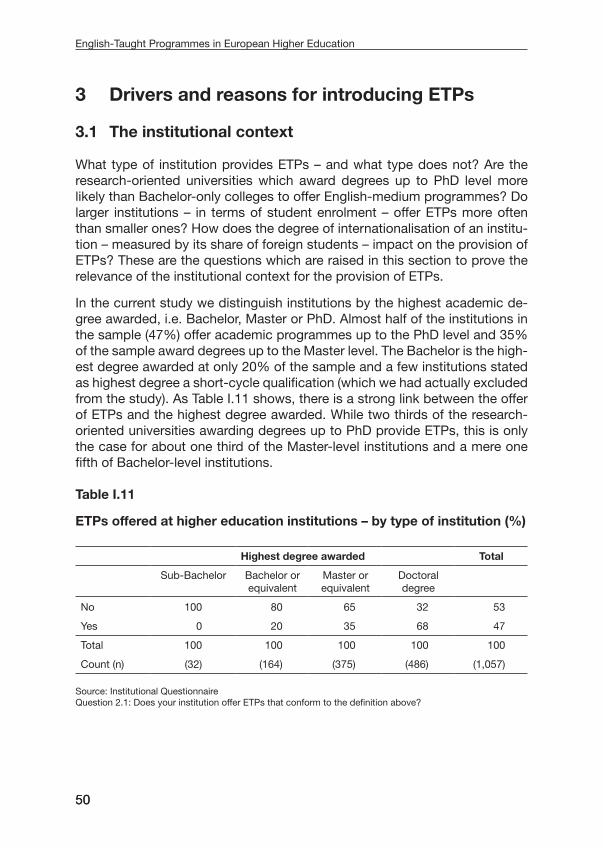
English-Taught Programmes in European Higher Education
5050
3 Drivers and reasons for introducing ETPs
3.1 The institutional context
What type of institution provides ETPs – and what type does not? Are the research-oriented universities which award degrees up to PhD level more likely than Bachelor-only colleges to offer English-medium programmes? Do larger institutions – in terms of student enrolment – offer ETPs more often than smaller ones? How does the degree of internationalisation of an institu-tion – measured by its share of foreign students – impact on the provision of ETPs? These are the questions which are raised in this section to prove the relevance of the institutional context for the provision of ETPs.
In the current study we distinguish institutions by the highest academic de-gree awarded, i.e. Bachelor, Master or PhD. Almost half of the institutions in the sample (47%) offer academic programmes up to the PhD level and 35% of the sample award degrees up to the Master level. The Bachelor is the high-est degree awarded at only 20% of the sample and a few institutions stated as highest degree a short-cycle qualification (which we had actually excluded from the study). As Table I.11 shows, there is a strong link between the offer of ETPs and the highest degree awarded. While two thirds of the research-oriented universities awarding degrees up to PhD provide ETPs, this is only the case for about one third of the Master-level institutions and a mere one fifth of Bachelor-level institutions.
Table I.11
ETPs offered at higher education institutions – by type of institution (%)
Highest degree awarded Total
Sub-Bachelor Bachelor or equivalent
Master or equivalent
Doctoral degree
No 100 80 65 32 53
Yes 0 20 35 68 47
Total 100 100 100 100 100
Count (n) (32) (164) (375) (486) (1,057)
Source: Institutional Questionnaire Question 2.1: Does your institution offer ETPs that conform to the definition above?
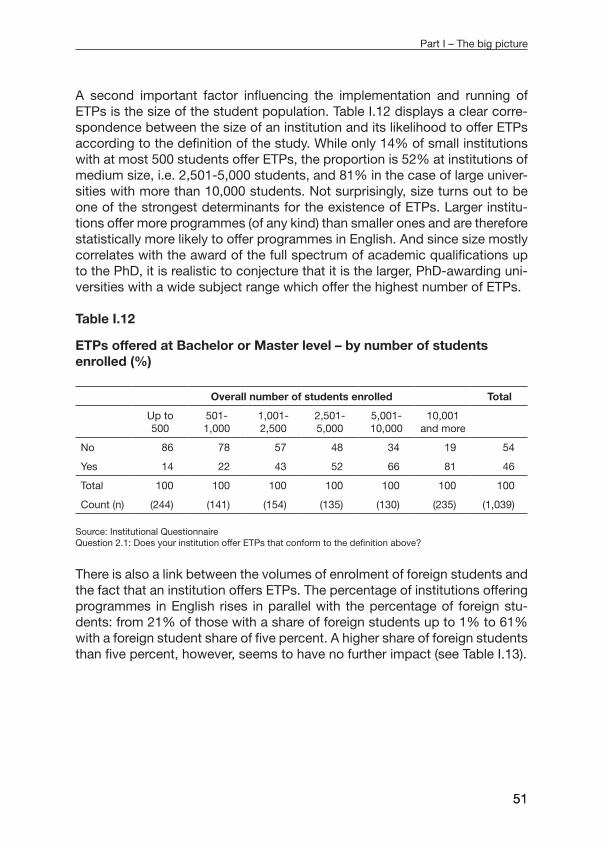
51
Part I – The big picture
51
A second important factor influencing the implementation and running of ETPs is the size of the student population. Table I.12 displays a clear corre-spondence between the size of an institution and its likelihood to offer ETPs according to the definition of the study. While only 14% of small institutions with at most 500 students offer ETPs, the proportion is 52% at institutions of medium size, i.e. 2,501-5,000 students, and 81% in the case of large univer-sities with more than 10,000 students. Not surprisingly, size turns out to be one of the strongest determinants for the existence of ETPs. Larger institu-tions offer more programmes (of any kind) than smaller ones and are therefore statistically more likely to offer programmes in English. And since size mostly correlates with the award of the full spectrum of academic qualifications up to the PhD, it is realistic to conjecture that it is the larger, PhD-awarding uni-versities with a wide subject range which offer the highest number of ETPs.
Table I.12
ETPs offered at Bachelor or Master level – by number of students enrolled (%)
Overall number of students enrolled Total
Up to 500
501-1,000
1,001-2,500
2,501-5,000
5,001-10,000
10,001 and more
No 86 78 57 48 34 19 54
Yes 14 22 43 52 66 81 46
Total 100 100 100 100 100 100 100
Count (n) (244) (141) (154) (135) (130) (235) (1,039)
Source: Institutional Questionnaire Question 2.1: Does your institution offer ETPs that conform to the definition above?
There is also a link between the volumes of enrolment of foreign students and the fact that an institution offers ETPs. The percentage of institutions offering programmes in English rises in parallel with the percentage of foreign stu-dents: from 21% of those with a share of foreign students up to 1% to 61% with a foreign student share of five percent. A higher share of foreign students than five percent, however, seems to have no further impact (see Table I.13).
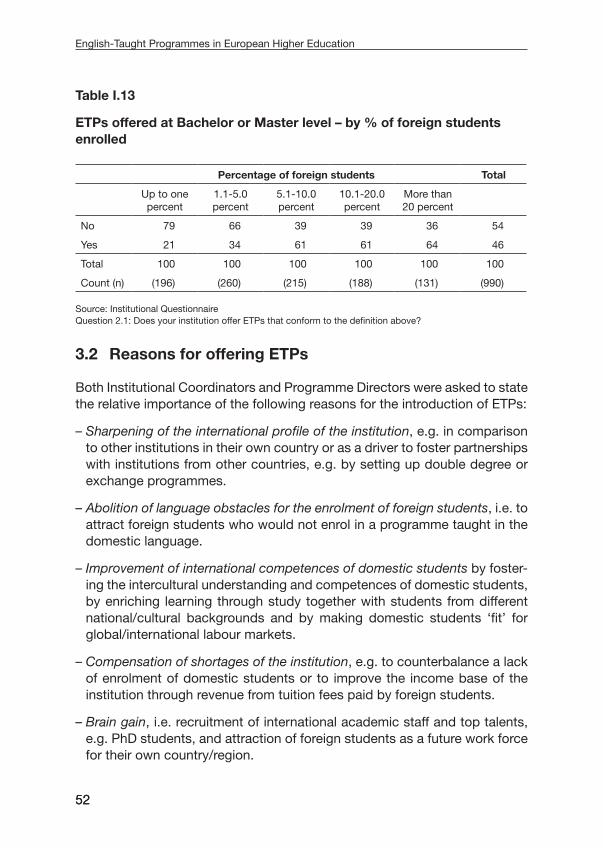
English-Taught Programmes in European Higher Education
5252
Table I.13
ETPs offered at Bachelor or Master level – by % of foreign students enrolled
Percentage of foreign students Total
Up to one percent
1.1-5.0 percent
5.1-10.0 percent
10.1-20.0 percent
More than 20 percent
No 79 66 39 39 36 54
Yes 21 34 61 61 64 46
Total 100 100 100 100 100 100
Count (n) (196) (260) (215) (188) (131) (990) Source: Institutional Questionnaire Question 2.1: Does your institution offer ETPs that conform to the definition above?
3.2 Reasons for offering ETPs
Both Institutional Coordinators and Programme Directors were asked to state the relative importance of the following reasons for the introduction of ETPs:
– Sharpening of the international profile of the institution, e.g. in comparison to other institutions in their own country or as a driver to foster partnerships with institutions from other countries, e.g. by setting up double degree or exchange programmes.
– Abolition of language obstacles for the enrolment of foreign students, i.e. to attract foreign students who would not enrol in a programme taught in the domestic language.
– Improvement of international competences of domestic students by foster-ing the intercultural understanding and competences of domestic students, by enriching learning through study together with students from different national/cultural backgrounds and by making domestic students ‘fit’ for global/international labour markets.
– Compensation of shortages of the institution, e.g. to counterbalance a lack of enrolment of domestic students or to improve the income base of the institution through revenue from tuition fees paid by foreign students.
– Brain gain, i.e. recruitment of international academic staff and top talents, e.g. PhD students, and attraction of foreign students as a future work force for their own country/region.
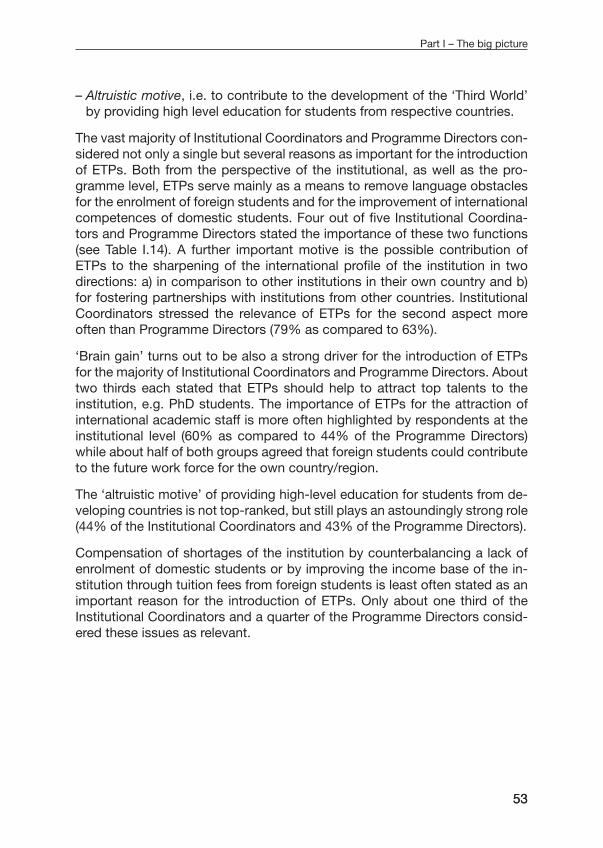
53
Part I – The big picture
53
– Altruistic motive, i.e. to contribute to the development of the ‘Third World’ by providing high level education for students from respective countries.
The vast majority of Institutional Coordinators and Programme Directors con-sidered not only a single but several reasons as important for the introduction of ETPs. Both from the perspective of the institutional, as well as the pro-gramme level, ETPs serve mainly as a means to remove language obstacles for the enrolment of foreign students and for the improvement of international competences of domestic students. Four out of five Institutional Coordina-tors and Programme Directors stated the importance of these two functions (see Table I.14). A further important motive is the possible contribution of ETPs to the sharpening of the international profile of the institution in two directions: a) in comparison to other institutions in their own country and b) for fostering partnerships with institutions from other countries. Institutional Coordinators stressed the relevance of ETPs for the second aspect more often than Programme Directors (79% as compared to 63%).
‘Brain gain’ turns out to be also a strong driver for the introduction of ETPs for the majority of Institutional Coordinators and Programme Directors. About two thirds each stated that ETPs should help to attract top talents to the institution, e.g. PhD students. The importance of ETPs for the attraction of international academic staff is more often highlighted by respondents at the institutional level (60% as compared to 44% of the Programme Directors) while about half of both groups agreed that foreign students could contribute to the future work force for the own country/region.
The ‘altruistic motive’ of providing high-level education for students from de-veloping countries is not top-ranked, but still plays an astoundingly strong role (44% of the Institutional Coordinators and 43% of the Programme Directors).
Compensation of shortages of the institution by counterbalancing a lack of enrolment of domestic students or by improving the income base of the in-stitution through tuition fees from foreign students is least often stated as an important reason for the introduction of ETPs. Only about one third of the Institutional Coordinators and a quarter of the Programme Directors consid-ered these issues as relevant.
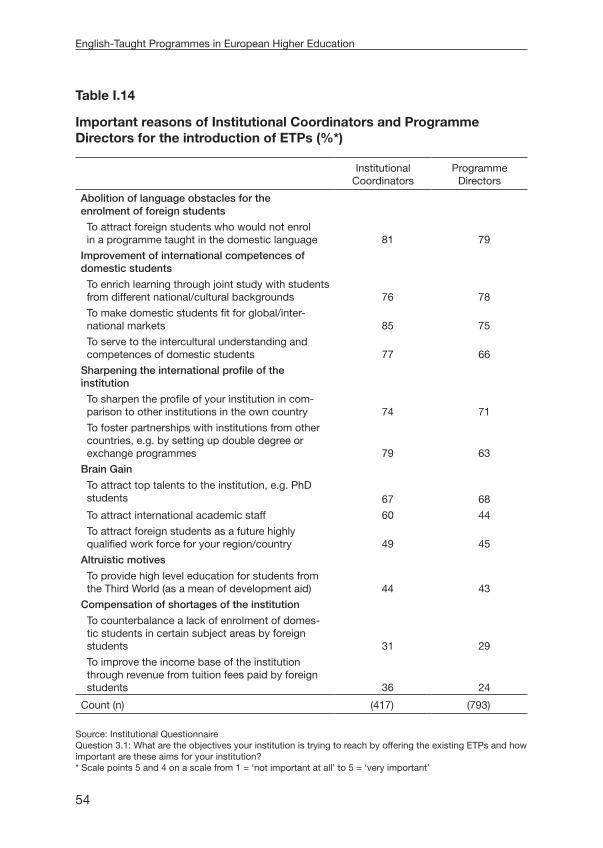
English-Taught Programmes in European Higher Education
54
Table I.14
Important reasons of Institutional Coordinators and Programme Directors for the introduction of ETPs (%*)
Institutional Coordinators
Programme Directors
Abolition of language obstacles for the enrolment of foreign students
To attract foreign students who would not enrol in a programme taught in the domestic language 81 79
Improvement of international competences of domestic students
To enrich learning through joint study with students from different national/cultural backgrounds 76 78
To make domestic students fit for global/inter-national markets 85 75
To serve to the intercultural understanding and competences of domestic students 77 66
Sharpening the international profile of the institution
To sharpen the profile of your institution in com-parison to other institutions in the own country 74 71
To foster partnerships with institutions from other countries, e.g. by setting up double degree or exchange programmes 79 63
Brain Gain
To attract top talents to the institution, e.g. PhD students 67 68
To attract international academic staff 60 44
To attract foreign students as a future highly qualified work force for your region/country 49 45
Altruistic motives
To provide high level education for students from the Third World (as a mean of development aid) 44 43
Compensation of shortages of the institution
To counterbalance a lack of enrolment of domes-tic students in certain subject areas by foreign students 31 29
To improve the income base of the institution through revenue from tuition fees paid by foreign students 36 24
Count (n) (417) (793)
Source: Institutional Questionnaire Question 3.1: What are the objectives your institution is trying to reach by offering the existing ETPs and how important are these aims for your institution? * Scale points 5 and 4 on a scale from 1 = ‘not important at all’ to 5 = ‘very important’

55
Part I – The big picture
Substantial differences in the reasons for introducing and running ETPs could be observed between institutions located in the Nordic region and Central West Europe on the one hand and institutions located in South and East Eu-rope on the other hand. Taking into account only those aspects considered of similar importance by Institutional Coordinators and Programme Direc-tors, the largest difference is the role of ETPs for the compensation of short-ages of the institutions, i.e. for improving the income base of the institution through tuition fees gathered from foreign students and for counterbalancing a lack of enrolment of domestic students (see Table I.15 and I.16). These as-pects are far more often a motive for institutions from the Baltic States, from Central East Europe and from South East Europe than for institutions from other regions. Institutions from south European countries most often stated the improvement of international competences of domestic students as the major goal. It could be assumed that the high unemployment rates in these countries have contributed to the importance of this aim. It might be also interesting to note that Institutional Coordinators and Programme Directors from institutions in the Nordic region stated only one aspect more often as important as their colleagues from other regions: to attract foreign students as future highly qualified work force for the own country.
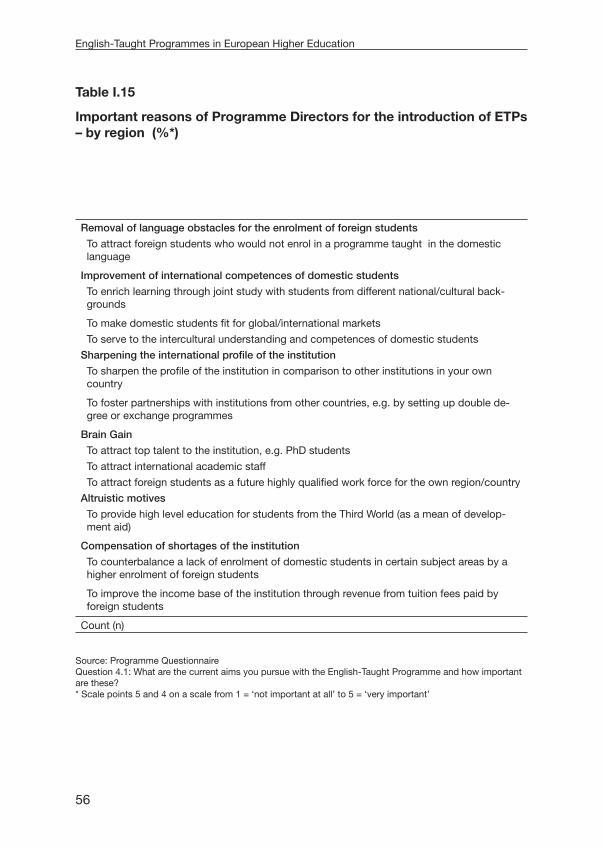
English-Taught Programmes in European Higher Education
56
Table I.15
Important reasons of Programme Directors for the introduction of ETPs – by region (%*)
Removal of language obstacles for the enrolment of foreign students
To attract foreign students who would not enrol in a programme taught in the domestic language
Improvement of international competences of domestic students
To enrich learning through joint study with students from different national/cultural back-grounds
To make domestic students fit for global/international markets
To serve to the intercultural understanding and competences of domestic students
Sharpening the international profile of the institution
To sharpen the profile of the institution in comparison to other institutions in your own country
To foster partnerships with institutions from other countries, e.g. by setting up double de-gree or exchange programmes
Brain Gain
To attract top talent to the institution, e.g. PhD students
To attract international academic staff
To attract foreign students as a future highly qualified work force for the own region/country
Altruistic motives
To provide high level education for students from the Third World (as a mean of develop-ment aid)
Compensation of shortages of the institution
To counterbalance a lack of enrolment of domestic students in certain subject areas by a higher enrolment of foreign students
To improve the income base of the institution through revenue from tuition fees paid by foreign students
Count (n)
Source: Programme Questionnaire Question 4.1: What are the current aims you pursue with the English-Taught Programme and how important are these? * Scale points 5 and 4 on a scale from 1 = ‘not important at all’ to 5 = ‘very important’
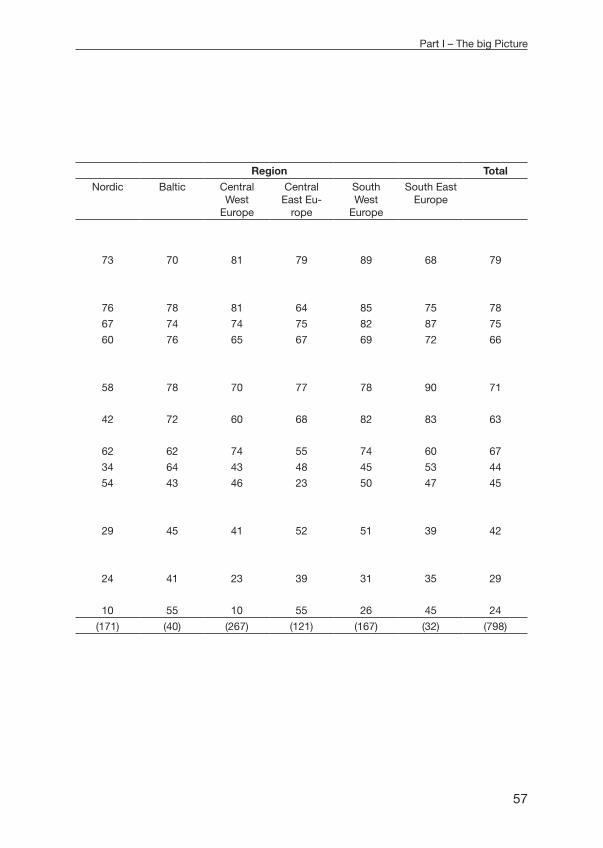
57
Part I – The big Picture
Region Total
Nordic Baltic Central West
Europe
Central East Eu-
rope
South West
Europe
South East Europe
73 70 81 79 89 68 79
76 78 81 64 85 75 78
67 74 74 75 82 87 75
60 76 65 67 69 72 66
58 78 70 77 78 90 71
42 72 60 68 82 83 63
62 62 74 55 74 60 67
34 64 43 48 45 53 44
54 43 46 23 50 47 45
29 45 41 52 51 39 42
24 41 23 39 31 35 29
10 55 10 55 26 45 24
(171) (40) (267) (121) (167) (32) (798)
English-Taught Programmes in European Higher Education
58
Table I.16
Important reasons of Institutional Coordinators for the introduction of ETPs – by region (%*)
Removal of language obstacles for the enrolment of foreign students
To attract foreign students who would not enrol in a programme taught in the domestic language
Improvement of international competences of domestic students
To enrich learning through joint study with students from different national/cultural back-grounds
To make domestic students fit for global/international markets
To serve to the intercultural understanding and competences of domestic students
Sharpening the international profile of the institution
To sharpen the profile of the institution in comparison to other institutions in your own country
To foster partnerships with institutions from other countries, e.g. by setting up double de-gree or exchange programmes
Brain Gain
To attract top talent to the institution, e.g. PhD students
To attract international academic staff
To attract foreign students as a future highly qualified work force for the own region/country
Altruistic motives
To provide high level education for students from the Third World (as a mean of develop-ment aid)
Compensation of shortages of the institution
To counterbalance a lack of enrolment of domestic students in certain subject areas by a higher enrolment of foreign students
To improve the income base of the institution through revenue from tuition fees paid by foreign students
Count (n)
Source: Institutional Questionnaire Question 3.1: What are the objectives your institution is trying to reach by offering the existing ETPs and how important are these aims for your institution? * Scale points 5 and 4 on a scale from 1 = ‘not important at all’ to 5 = ‘very important’
The aims associated with ETPs further differ between the Bachelor and the Master level (see Table I.17). Programme Directors of Master programmes more frequently highlighted the importance to abolish language obstacles for the enrolment of foreign students (82% in comparison to 68%) and to attract
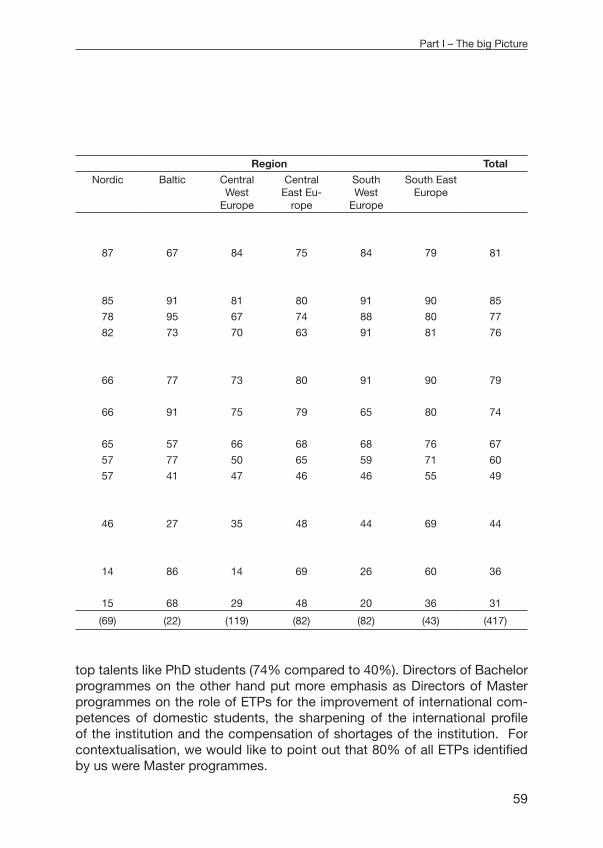
59
Part I – The big Picture
Region Total
Nordic Baltic Central West
Europe
Central East Eu-
rope
South West
Europe
South East Europe
87 67 84 75 84 79 81
85 91 81 80 91 90 85
78 95 67 74 88 80 77
82 73 70 63 91 81 76
66 77 73 80 91 90 79
66 91 75 79 65 80 74
65 57 66 68 68 76 67
57 77 50 65 59 71 60
57 41 47 46 46 55 49
46 27 35 48 44 69 44
14 86 14 69 26 60 36
15 68 29 48 20 36 31
(69) (22) (119) (82) (82) (43) (417)
top talents like PhD students (74% compared to 40%). Directors of Bachelor programmes on the other hand put more emphasis as Directors of Master programmes on the role of ETPs for the improvement of international com-petences of domestic students, the sharpening of the international profile of the institution and the compensation of shortages of the institution. For contextualisation, we would like to point out that 80% of all ETPs identified by us were Master programmes.

English-Taught Programmes in European Higher Education
60
Degree awarded Total
Bachelor Master
Abolition of language obstacles for the enrolment of foreign students
To attract foreign students who would not enrol in a programme taught in the domestic language 68 82 79
Improvement of international competences of domestic students
To enrich learning through joint study with students from different national/cultural backgrounds 79 78 78
To make domestic students fit for global/ inter-national markets 84 73 75
To serve to the intercultural understanding and competences of domestic students 77 63 66
Sharpening the international profile of the institution
To sharpen the profile of your institution in com-parison to other institutions in the own country 78 70 71
To foster partnerships with institutions from other countries, e.g. by setting up double degree or exchange programmes 73 61 63
Brain Gain
To attract top talents to the institution, e.g. PhD students 40 74 68
To attract international academic staff 45 45 45
To attract foreign students as a future highly qualified work force for your region/country 51 42 44
Altruistic motives
To provide high level education for students from the Third World (as a mean of development aid) 43 42 43
Compensation of shortages of the institution
To counterbalance a lack of enrolment of domestic students in certain subject areas by foreign students 39 26 29
To improve the income base of the institution through revenue from tuition fees paid by foreign students 41 20 24
Count (n) (147) (646) (793)
Table I.17
Important reasons of Programme Directors for the introduction of ETPs – by degree awarded at the end of the programme (%*)
Source: Programme Questionnaire Question 4.1: What are the current aims you pursue with the English-Taught Programme and how important are these? * Scale points 5 and 4 on a scale from 1 = ‘Not important at all’ to 5 = ‘very important’

61
Part I – The big Picture
3.3 Reasons for not offering ETPs
The universities and colleges which participated in the Institutional Survey and did not offer programmes taught in English at all or only programmes partly taught in English were asked in an open question to explain why they did not do so. An analysis of the answers shows that there are several main reasons or groups of perceived obstacles to offering ETPs.
a) Language proficiency
Institutional Coordinators in the sample mentioned several reasons related to language proficiency issues which account for not providing ETPs, such as low levels of proficiency in English among teaching staff, low-level of Eng-lish skills amongst domestic students or, on the other hand, high proficiency of foreign students in the domestic language. Low English skills of teach-ers were mentioned quite frequently as the major reason for not introducing ETPs. Institutional Coordinators mentioned poor language skills of teaching staff, and, understandably, a resulting reluctance to teach in English. On the other hand, in countries with more widely spoken languages, such as Germa-ny, France or Spain, the perception is often that there is no need to introduce programmes fully taught in English since foreign students already speak or want to learn the domestic language.
b) Type of higher education institution and discipline
A significant number of responses refer to specificities of the institution which make ETPs unnecessary, difficult to introduce or even incompatible with the discipline taught. For example, a number of institutions in the sample are academies of music or the arts where instruction is, in part, on a one-to-one basis and where it is therefore quite common to flexibly agree on the lan-guage which the student and the teacher master best. On the other hand, some institutions offer programmes with highly specialised terminology which students have to master in the domestic language, as is, for example, the case in teacher training or law.
c) Insufficient international enrolment
Quite a few Institutional Coordinators mentioned a low number of foreign stu-dents as the main reason for not providing ETPs. In some cases it was consid-ered too expensive to set up courses for just a few students so foreign students are required to learn the language of instruction in case they do not yet speak it. According to some Institutional Coordinators, though, there is simply no interest in English-Taught courses among the few foreign students in their institution. Some institutions, on the other hand, are involved only in ERASMUS exchanges and have adapted part of the curriculum to cater for exchange students, or have
English-Taught Programmes in European Higher Education
62
established bilateral agreements with institutions abroad on the understanding that incoming students master the domestic language.
These answers struck us as quite surprising. A lack of sufficient demand for ETPs could only safely be identified if there was an ETP offer at all. Likewise, a lack of demand for ETPs among foreign students already studying at the institution is not surprising, since these appear to have been admitted on the condition that they speak – or are willing to learn – the domestic language.
d) Lack of resources
Another obstacle which Institutional Coordinators identified frequently is the lack of funding and human resources. The survey conducted with representatives of regional and national governments confirms that there is a lack of incentives for the introduction of programmes fully taught in English. This appears to nega-tively affect the development of ETPs even if there are no major legal constraints.
e) Legal obstacles
In some countries, the absence of ETPs stems from the limitations imposed by the national or regional legislative and regulatory framework. For example, this seems to be often the case in Spain, where the curriculum depends on regional authorities and institutions do not have enough autonomy to design study programmes.
In some countries such as the Netherlands, the Dutch and French-speak-ing communities of Belgium and a number of Central European countries, there is the requirement to double an ETP in the domestic language. We have gained the impression that this requirement is often hypothetical, as long as no national of the country insists to be taught in the domestic language. Where it is seriously applied, it raises issues of human resources and ulti-mately also funds.
Accreditation, i.e. a lack of accreditation of ETPs is another major obsta-cle, according to the Institutional Coordinators from a number of countries. It appears to be a major hurdle in the Czech Republic, as well as in some institutions in Hungary, Romania, Slovakia and Slovenia. We were somewhat astonished by these comments, assuming that higher education institutions ‘cleared’ by their country for participation in English should, in principle, be eligible for accreditation by the country’s authorities.
Many institutions are in the process of launching one or more ETPs or have just started an ETP so there are no data available yet. Some institutions sur-veyed are very young and are still building the infrastructure but a number of Institutional Coordinators mentioned the intention of introducing programmes taught in English in the next one or two years.

63
Part II – Traits and daily operation of ETPs
Part II – Traits and daily operation of ETPsIrina Ferencz (ACA), Friedhelm Maiworm (GES), Marija Mitic (ACA)
The previous part provided an overview of the state of play and trends in the development of ETPs in the 28 European countries in the sample. It looked into the spread of ETPs, the leaders among countries in the provision of ETPs as well as the changes over years. It also provided an analysis of the driv-ers and reasons for the introduction of ETPs. The second part of the study examines some basic traits of this kind of programmes and their daily opera-tion. More specifically, it looks at the age of programmes, their disciplinary profiles, at the levels of study (Bachelor/Master), at the standard period of study, at the admission conditions, marketing and at the challenges faced during the implementation of the programmes. Further, it tries to answer the important question as to where the students enrolled in ETPs come from.
1 Age of programmes – year of introduction
The 2002 study came to the conclusion that ETPs were “a very young phe-nomenon” and the 2008 study found a continued strong growth in the crea-tion of respective offers. However, the current study suggests that the peak of the introduction of new ETPs is over and we are now in a phase of consolida-tion of existing offers.
Chart II.1 shows the distribution of ETPs covered in the current study by year of introduction. The figure shows a continuous increase in the proportion of newly introduced programmes until the years 2009-2010 (from 6% in the years 2001-2002 up to 21%). In the following years, the respective share de-creased to 17% in 2011-2012 and to 13% in 2013-2014. Although it has to be taken into consideration that the study did not cover the complete year 2014 and that the real number of programmes starting in 2013-2014 will finally be higher, it is not very likely it will top the numbers of 2009-2010. Under the as-sumption that the sample of ETPs covered by the study is largely representa-tive, it might be justified to conclude that after the peak in 2009-2010, the growth in the number of new ETPs has at least temporarily ended, although the total number of ETPs continues to increase.

English-Taught Programmes in European Higher Education
64
Chart II.1
Proportion of newly introduced ETPs – by year of introduction of programme (%)
Source: Programme Questionnaire Question 2.4: Year in which this programme was set up:
As was already the case in the predecessor studies, the ‘age’ of ETPs differs between countries, as shown in the Table II.1. A high proportion of programmes starting in recent years, i.e. since 2011, could be found in South West and Cen-tral East Europe (37% and 35% respectively) and in the Baltics (33%).
Table II.1
Year of introduction of the ETPs – by region (%)
Region Total
Nordic Baltic Central West
Europe
Central East
Europe
South West
Europe
South East
Europe
Up to 2000 13 10 13 13 3 27 11
2001-2005 13 17 24 17 10 5 16
2006-2010 48 40 38 35 50 46 43
2011-2014 26 33 25 35 37 22 30
Total 100 100 100 100 100 100 100
Count (n) (190) (48) (283) (136) (186) (41) (884)
Source: Programme Questionnaire Question 2.4: Year in which this programme was set up:
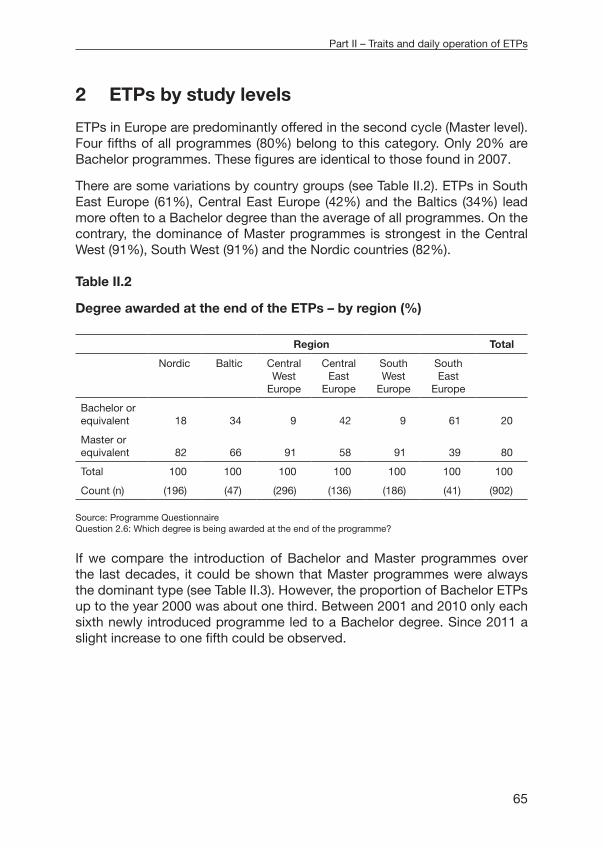
65
Part II – Traits and daily operation of ETPs
2 ETPs by study levels
ETPs in Europe are predominantly offered in the second cycle (Master level). Four fifths of all programmes (80%) belong to this category. Only 20% are Bachelor programmes. These figures are identical to those found in 2007.
There are some variations by country groups (see Table II.2). ETPs in South East Europe (61%), Central East Europe (42%) and the Baltics (34%) lead more often to a Bachelor degree than the average of all programmes. On the contrary, the dominance of Master programmes is strongest in the Central West (91%), South West (91%) and the Nordic countries (82%).
Table II.2
Degree awarded at the end of the ETPs – by region (%)
Region Total
Nordic Baltic Central West
Europe
Central East
Europe
South West
Europe
South East
Europe
Bachelor or equivalent 18 34 9 42 9 61 20
Master or equivalent 82 66 91 58 91 39 80
Total 100 100 100 100 100 100 100
Count (n) (196) (47) (296) (136) (186) (41) (902) Source: Programme Questionnaire Question 2.6: Which degree is being awarded at the end of the programme?
If we compare the introduction of Bachelor and Master programmes over the last decades, it could be shown that Master programmes were always the dominant type (see Table II.3). However, the proportion of Bachelor ETPs up to the year 2000 was about one third. Between 2001 and 2010 only each sixth newly introduced programme led to a Bachelor degree. Since 2011 a slight increase to one fifth could be observed.

English-Taught Programmes in European Higher Education
66
Table II.3
Degree awarded at the end of the ETPs – by year of introduction of the programme (%)
Year of introduction Total
Up to 2000 2001-2005 2006-2010 2011-2014
Bachelor or equivalent 36 15 17 21 20
Master or equivalent 64 85 83 79 80
Total 100 100 100 100 100
Count (n) (99) (144) (376) (259) (878)
Source: Programme Questionnaire Question 2.6: Which degree is being awarded at the end of the programme?
3 Subject areas covered by ETPs
According to the ISCED 2011 classification of broad groups and fields of edu-cation, the highest proportion of ETPs covered by the survey is offered in social sciences, business and law (35%), followed by sciences (23%) and engineer-ing, manufacturing and construction (18%). While the data does not allow for this differentiation, we would expect that in the field social sciences, business and law the majority of ETPs are offered in business and law studies, rather than in social sciences. All other subject areas remain below 10% although a large variety of subjects are available as ETPs in Europe as indicated in Study-Portals' database.

67
Part II – Traits and daily operation of ETPs
Table II.4
Subject areas to which the ETPs mainly belong – by year of introduction of the programme (%)
Year of introduction Total
Up to 2000 2001-2005 2006-2010 2011-2014
Agriculture 6 3 1 1 2
Education 0 3 1 3 2
Engineering, manufacturing and construction 23 19 15 20 18
Health and welfare 13 6 4 4 5
Humanities and arts 7 6 7 8 7
Sciences 8 19 29 23 23
Services 2 3 2 1 2
Social sciences, business and law 34 34 38 35 36
Other subject area 6 6 4 5 5
Total 100 100 100 100 100
Count (n) (99) (144) (378) (260) (881)
Source: Programme Questionnaire Question 2.8: To which subject area does your programme (mainly) belong (cf. ISCED 2011 classification of broad groups and fields of education)?
Some changes over time could be observed. While only 8% of the programmes starting until the year 2000 focused on sciences, the respective proportion in-creased to 29% in the years 2006-2010. At the same time the share of newly established programmes in social sciences, business and law remains stable while new programmes in health and welfare decreased (see Table II.4).
As Table II.5 shows, the overall distribution across disciplines differs by lev-els of study. The subject area group of social sciences, business and law is the clear leader in undergraduate (Bachelor-level) programmes (42%). Pro-grammes in natural sciences, on the other hand, tend to be offered more often at the Master level (26% as compared to 11% at the Bachelor level).

English-Taught Programmes in European Higher Education
68
Table II.5
Subject areas to which the ETPs mainly belong – by degree awarded at the end of the programme (%)
Degree awarded Total
Bachelor Master
Agriculture 2 2 2
Education 3 1 2
Engineering, manufacturing and construction
19 18 18
Health and welfare 6 5 5
Humanities and arts 10 7 7
Sciences 11 26 23
Services 3 1 2
Social sciences, business and law 42 34 35
Other subject area 3 6 5
Total 100 100 100
Count (n) (175) (725) (900)
Source: Programme Questionnaire Question 2.8: To which subject area does your programme (mainly) belong (cf. ISCED 2011 classification of broad groups and fields of education)?
The discipline pattern of ETPs differs between countries and regions to a cer-tain extent, as Table II.6 reveals. On the Master level, Central East Europe and the Baltics have a comparably high proportion of programmes in the fields of social sciences, business and law while sciences are above average in the Central West (33%) and South West Europe (30%) countries. On the Bachelor level, a considerably high proportion of ETPs in social sciences, business and law are offered in South West Europe (75%) while in South East Europe the share of programmes in engineering, manufacturing and construction is clearly above average (46%).

69
Part II – Traits and daily operation of ETPs
Table II.6
Subject areas to which the ETPs mainly belong – by region (%)
Region Total
Nordic Baltic Central West
Europe
Central East
Europe
South West
Europe
South East
Europe
Agriculture
Bachelor 0 0 0 5 0 0 2Master 2 3 3 5 1 0 2
Education
Bachelor 0 7 4 4 6 0 3Master 1 6 1 3 1 0 1
Engineering, manufacturing and constructionBachelor 22 27 4 14 13 46 19Master 18 10 14 14 25 25 18
Health and welfare
Bachelor 19 13 4 2 0 0 6Master 7 3 3 13 3 6 5
Humanities and Arts
Bachelor 8 13 7 11 0 17 10Master 8 16 6 13 2 19 7
Sciences
Bachelor 11 7 11 14 6 8 11Master 23 10 33 8 30 19 26
Services
Bachelor 6 0 4 2 0 8 3Master 1 0 2 1 2 0 1
Social sciences, business and lawBachelor 31 33 48 49 75 21 42Master 35 52 30 42 32 31 34
Other subject area
Bachelor 3 0 19 0 0 0 3Master 7 0 8 3 5 0 6
Total 100 100 100 100 100 100 100
Count (n) (197) (46) (296) (137) (187) (41) (904)
Source: Programme Questionnaire Question 2.8: To which subject area does your programme (mainly) belong (cf. ISCED 2011 classification of broad groups and fields of education)?
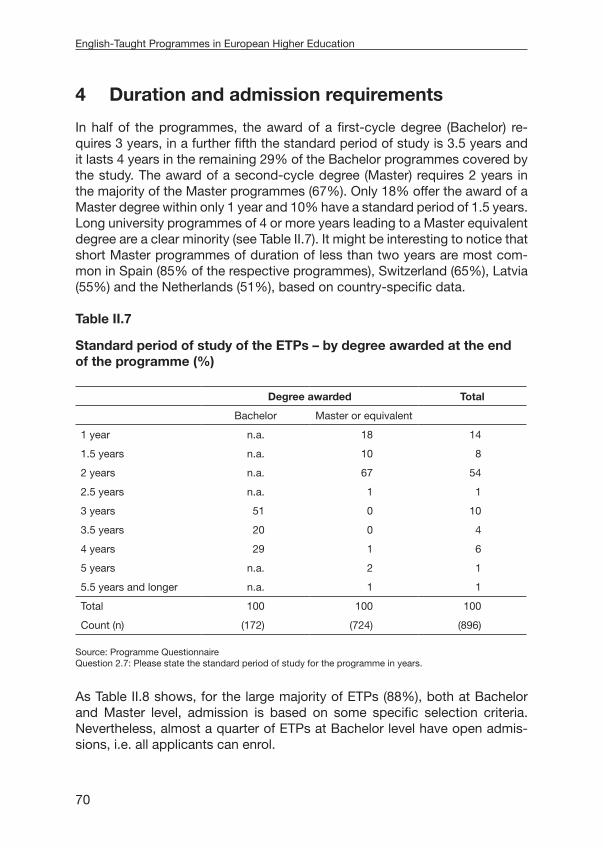
English-Taught Programmes in European Higher Education
70
4 Duration and admission requirements
In half of the programmes, the award of a first-cycle degree (Bachelor) re-quires 3 years, in a further fifth the standard period of study is 3.5 years and it lasts 4 years in the remaining 29% of the Bachelor programmes covered by the study. The award of a second-cycle degree (Master) requires 2 years in the majority of the Master programmes (67%). Only 18% offer the award of a Master degree within only 1 year and 10% have a standard period of 1.5 years. Long university programmes of 4 or more years leading to a Master equivalent degree are a clear minority (see Table II.7). It might be interesting to notice that short Master programmes of duration of less than two years are most com-mon in Spain (85% of the respective programmes), Switzerland (65%), Latvia (55%) and the Netherlands (51%), based on country-specific data.
Table II.7
Standard period of study of the ETPs – by degree awarded at the end of the programme (%)
Degree awarded Total
Bachelor Master or equivalent
1 year n.a. 18 14
1.5 years n.a. 10 8
2 years n.a. 67 54
2.5 years n.a. 1 1
3 years 51 0 10
3.5 years 20 0 4
4 years 29 1 6
5 years n.a. 2 1
5.5 years and longer n.a. 1 1
Total 100 100 100
Count (n) (172) (724) (896)
Source: Programme Questionnaire Question 2.7: Please state the standard period of study for the programme in years.
As Table II.8 shows, for the large majority of ETPs (88%), both at Bachelor and Master level, admission is based on some specific selection criteria. Nevertheless, almost a quarter of ETPs at Bachelor level have open admis-sions, i.e. all applicants can enrol.

71
Part II – Traits and daily operation of ETPs
Table II.8
Selection amongst the applicants qualified for entry – by degree awarded at the end of the programme (%)
Degree awarded Total
Bachelor Master
No, all can enrol 22 8 10
Enrolment on the first come first served basis 3 2 2
Application of specific selection criteria/measures 76 90 88
Total 100 100 100
Count (n) (157) (691) (848)
Source: Programme Questionnaire Question 3.2: Do you select amongst the applicants qualified for entry?
For almost all ETPs at Bachelor level, the minimum educational admission requirement is a secondary-school-leaving certificate at advanced level (bac-calauréat, Matura, Abitur, etc.) or the general eligibility to enter into higher education. Almost every second-cycle programme requires an undergradu-ate degree for admission.
Among the given criteria by the 88% of ETPs that use selection criteria, the most important ones are the academic/intellectual/artistic potential of the ap-plicants (92% of the programmes apply these selection criteria), followed by the proficiency in English (88%). Personality, social and cultural competences (44%) or practical experiences (33%) on the other hand, are relevant criteria for only a minority of the Programme Directors. While intellectual skills and the proficiency in English are of similar importance for Bachelor and Master programmes, personality, social and cultural competences are more often a selection criterion for Bachelor programmes, whereas work/practical experi-ence plays a more important role when selecting students for Master pro-grammes (see Table II.9).
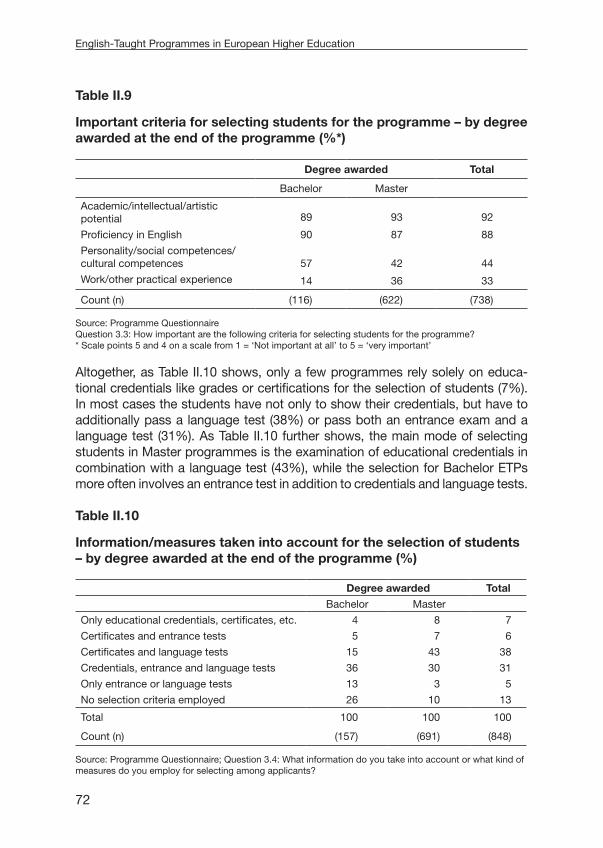
English-Taught Programmes in European Higher Education
72
Table II.9
Important criteria for selecting students for the programme – by degree awarded at the end of the programme (%*)
Degree awarded Total
Bachelor Master
Academic/intellectual/artistic potential 89 93 92
Proficiency in English 90 87 88
Personality/social competences/cultural competences 57 42 44
Work/other practical experience 14 36 33
Count (n) (116) (622) (738)
Source: Programme Questionnaire Question 3.3: How important are the following criteria for selecting students for the programme? * Scale points 5 and 4 on a scale from 1 = ‘Not important at all’ to 5 = ‘very important’
Altogether, as Table II.10 shows, only a few programmes rely solely on educa-tional credentials like grades or certifications for the selection of students (7%). In most cases the students have not only to show their credentials, but have to additionally pass a language test (38%) or pass both an entrance exam and a language test (31%). As Table II.10 further shows, the main mode of selecting students in Master programmes is the examination of educational credentials in combination with a language test (43%), while the selection for Bachelor ETPs more often involves an entrance test in addition to credentials and language tests.
Table II.10
Information/measures taken into account for the selection of students – by degree awarded at the end of the programme (%)
Degree awarded Total
Bachelor Master
Only educational credentials, certificates, etc. 4 8 7
Certificates and entrance tests 5 7 6
Certificates and language tests 15 43 38
Credentials, entrance and language tests 36 30 31
Only entrance or language tests 13 3 5
No selection criteria employed 26 10 13
Total 100 100 100
Count (n) (157) (691) (848)
Source: Programme Questionnaire; Question 3.4: What information do you take into account or what kind of measures do you employ for selecting among applicants?

73
Part II – Traits and daily operation of ETPs
Overall, entrance examinations are more common in Bachelor than in Master programmes (53% as compared to 39%) and mostly happen in the form of interviews (30% of all programmes). Written examinations play a role only in Bachelor programmes (29%), while other forms of oral examinations (i.e. other than interviews) are neither an important measure for the selection of students in Bachelor (10%) nor in Master programmes (5%).
Apart from IELTS where the minimum score to be reached by students in the language test is the same (6 points), at both levels, the requirements in Mas-ter programmes are higher than in Bachelor programmes (see Table II.11). On the Master level the minimum score to be reached in the TOEFL iBT is 86 and in the TOEFL paper-based test it is 563.
Table II.11
Minimum score to be reached by students in language tests – by degree awarded at the end of the programme (Mean)
Degree awarded Total
Bachelor Master
TOEFL iBT 79 86 85
TOEFL paper based test 538 563 560
IELTS 6 6 6
Count (n) (66) (361) (427)
Source: Programme Questionnaire Question 3.4: What information do you take into account or what kind of measures do you employ for select-ing among applicants?
As Table II.12 shows, the admission requirements differ to a certain extent between country groups. While Master programmes in the Nordic countries and in Central West Europe more often use the combination of certificates and language tests for the selection of students than the respective pro-grammes in Central East Europe, the latter more often use additional en-trance tests, partially by giving less importance to the educational credentials and certificates of students. On the Bachelor level the figures are similar but not as pronounced.
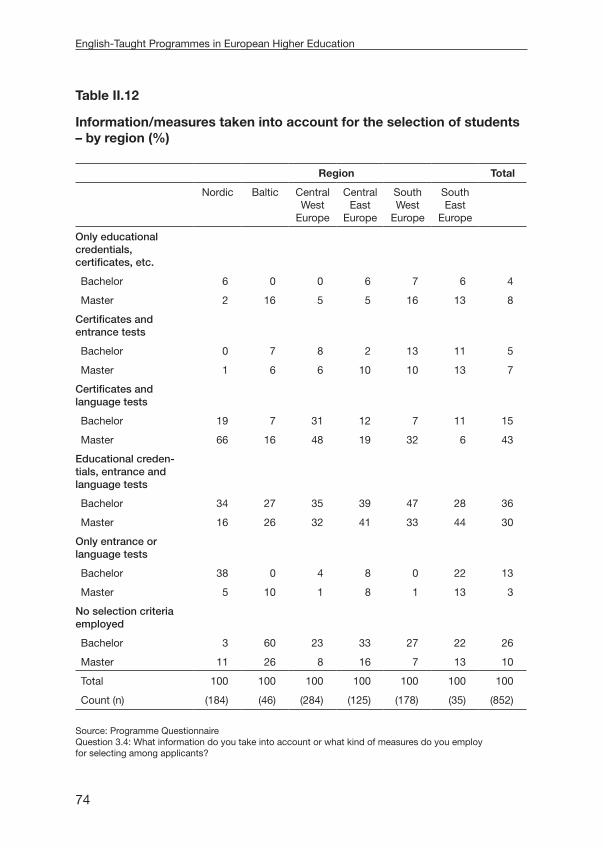
English-Taught Programmes in European Higher Education
74
Table II.12
Information/measures taken into account for the selection of students – by region (%)
Region Total
Nordic Baltic Central West
Europe
Central East
Europe
South West
Europe
South East
Europe
Only educational credentials, certificates, etc.
Bachelor 6 0 0 6 7 6 4
Master 2 16 5 5 16 13 8
Certificates and entrance tests
Bachelor 0 7 8 2 13 11 5
Master 1 6 6 10 10 13 7
Certificates and language tests
Bachelor 19 7 31 12 7 11 15
Master 66 16 48 19 32 6 43
Educational creden-tials, entrance and language tests
Bachelor 34 27 35 39 47 28 36
Master 16 26 32 41 33 44 30
Only entrance or language tests
Bachelor 38 0 4 8 0 22 13
Master 5 10 1 8 1 13 3
No selection criteria employed
Bachelor 3 60 23 33 27 22 26
Master 11 26 8 16 7 13 10
Total 100 100 100 100 100 100 100
Count (n) (184) (46) (284) (125) (178) (35) (852)
Source: Programme Questionnaire Question 3.4: What information do you take into account or what kind of measures do you employ for selecting among applicants?

75
Part II – Traits and daily operation of ETPs
5 Marketing channels
To attract foreign or domestic students to the ETPs, a broad range of market-ing measures and communication channels were used, as shown in Table II.13. Most common are the provision of information via the university web-site (81%), distribution of printed information material (71%), presentations at student fairs and information events at home (65%) and abroad (58%), use of entries in international portals/databases (64%), programme overviews/databases of national agencies (52%) and social media (56%). On the other hand, advertisements in newspapers (31%) and the use of agents in target countries (18%) play only a minor role.
Table II.13
Kind of marketing activities used – by degree awarded at the end of the programme (%, multiple replies possible)
Degree awarded Total
Bachelor Master
Provision of information via the university website 81 80 81
Production and distribution of printed information material/brochures etc. 73 70 71
Information events in your home country/home institution 80 61 65
Entry in international portals/databases (e.g. StudyPortals) 56 66 64
Distribution of information via existing networks/partnerships of the institution 64 61 61
Information events abroad, i.e. student fairs, conferences etc. 70 55 58
Social media (e.g. Facebook) 68 53 56
Entry in programme overviews/databases of national agencies 55 51 52
Advertisements in newspapers/mass media 48 26 31
Employment/use of agents in target countries 31 15 18
No special marketing activities 16 16 16
Other marketing activities 7 6 6
Total 650 561 578
Count (n) (147) (639) (786)
Source: Programme Questionnaire Question 5.2: Which kind of marketing activities or strategies do you use?

English-Taught Programmes in European Higher Education
76
In comparison to the results of the 2007 survey, there is an increase in the use of programme overviews/databases of national agencies, while the frequency of all other marketing activities has slightly decreased since 2007. However, the hierarchy of the individual activities has not changed significantly over the years. Thus, the internet (the university website) was already in 2002 and 2008 the top dissemination instrument for promotional messages.
Bachelor Programme Directors use several marketing instruments more often than those of Master programmes, e.g. student fairs and information events at home and abroad, social media, advertisements in newspapers, and agents in target countries. On the other hand, Master programmes use only one type of instrument more often than Bachelor programmes, namely entries in international portals/databases.
Naturally, the marketing instruments are adjusted to the target groups. To reach foreign students ETPs use mainly student fairs abroad as well as en-tries in international portals and databases of national agencies, but also agents in the target countries. Domestic students are more often addressed by information events in the country in which the institution is located, social media and advertisements in newspapers (see Table II.14).
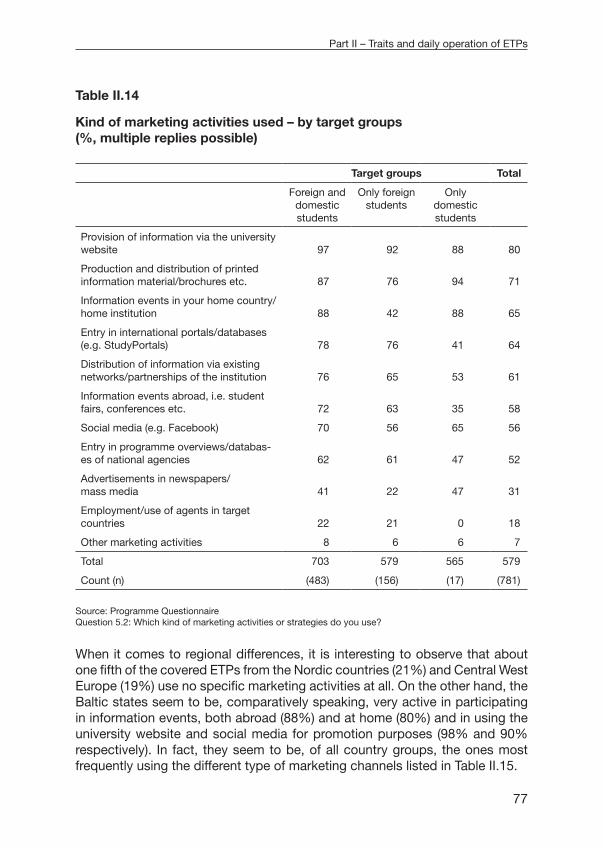
77
Part II – Traits and daily operation of ETPs
Table II.14
Kind of marketing activities used – by target groups (%, multiple replies possible)
Target groups Total
Foreign and domestic students
Only foreign students
Only domestic students
Provision of information via the university website 97 92 88 80
Production and distribution of printed information material/brochures etc. 87 76 94 71
Information events in your home country/home institution 88 42 88 65
Entry in international portals/databases (e.g. StudyPortals) 78 76 41 64
Distribution of information via existing networks/partnerships of the institution 76 65 53 61
Information events abroad, i.e. student fairs, conferences etc. 72 63 35 58
Social media (e.g. Facebook) 70 56 65 56
Entry in programme overviews/databas-es of national agencies 62 61 47 52
Advertisements in newspapers/ mass media 41 22 47 31
Employment/use of agents in target countries 22 21 0 18
Other marketing activities 8 6 6 7
Total 703 579 565 579
Count (n) (483) (156) (17) (781)
Source: Programme Questionnaire Question 5.2: Which kind of marketing activities or strategies do you use?
When it comes to regional differences, it is interesting to observe that about one fifth of the covered ETPs from the Nordic countries (21%) and Central West Europe (19%) use no specific marketing activities at all. On the other hand, the Baltic states seem to be, comparatively speaking, very active in participating in information events, both abroad (88%) and at home (80%) and in using the university website and social media for promotion purposes (98% and 90% respectively). In fact, they seem to be, of all country groups, the ones most frequently using the different type of marketing channels listed in Table II.15.

English-Taught Programmes in European Higher Education
78
Table II.15
Kind of marketing activities used – by region (%, multiple replies possible)
Region Total
Nordic Baltic Central West
Europe
Central East
Europe
South West
Europe
South East
Europe
Provision of information via the university website 74 98 77 85 84 90 81
Production and distri-bution of printed information material/ brochures etc. 64 88 71 77 70 74 71
Information events in your home country/ home institution 54 80 62 73 66 84 65
Entry in international portals/databases (e.g. StudyPortals) 51 68 70 63 69 58 64
Distribution of information via existing networks/partnerships of the institution 52 83 58 70 64 68 62
Information events abroad, i.e. student fairs, conferences etc. 51 88 57 69 53 52 58
Social media (e.g. Facebook) 47 90 48 71 56 74 56
Entry in programme over-views/databases of national agencies 43 65 58 57 44 48 52
Advertisements in news-papers/mass media 24 63 23 47 25 61 31
Employment/use of agents in target countries 8 38 13 40 16 13 18
No special marketing activities 21 3 19 12 13 6 16
Other marketing activities 9 5 7 2 7 3 6
Total 498 765 562 666 568 632 578
Count (n) (168) (40) (266) (121) (164) (31) (790)
Source: Programme Questionnaire Question 5.2: Which kind of marketing activities or strategies do you use?
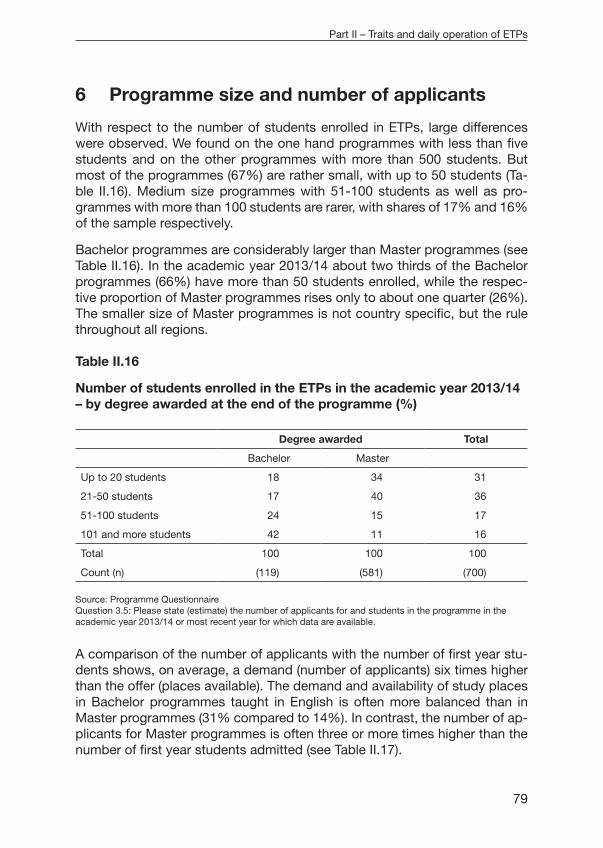
79
Part II – Traits and daily operation of ETPs
6 Programme size and number of applicants
With respect to the number of students enrolled in ETPs, large differences were observed. We found on the one hand programmes with less than five students and on the other programmes with more than 500 students. But most of the programmes (67%) are rather small, with up to 50 students (Ta-ble II.16). Medium size programmes with 51-100 students as well as pro-grammes with more than 100 students are rarer, with shares of 17% and 16% of the sample respectively.
Bachelor programmes are considerably larger than Master programmes (see Table II.16). In the academic year 2013/14 about two thirds of the Bachelor programmes (66%) have more than 50 students enrolled, while the respec-tive proportion of Master programmes rises only to about one quarter (26%). The smaller size of Master programmes is not country specific, but the rule throughout all regions.
Table II.16
Number of students enrolled in the ETPs in the academic year 2013/14 – by degree awarded at the end of the programme (%)
Degree awarded Total
Bachelor Master
Up to 20 students 18 34 31
21-50 students 17 40 36
51-100 students 24 15 17
101 and more students 42 11 16
Total 100 100 100
Count (n) (119) (581) (700)
Source: Programme Questionnaire Question 3.5: Please state (estimate) the number of applicants for and students in the programme in the academic year 2013/14 or most recent year for which data are available.
A comparison of the number of applicants with the number of first year stu-dents shows, on average, a demand (number of applicants) six times higher than the offer (places available). The demand and availability of study places in Bachelor programmes taught in English is often more balanced than in Master programmes (31% compared to 14%). In contrast, the number of ap-plicants for Master programmes is often three or more times higher than the number of first year students admitted (see Table II.17).
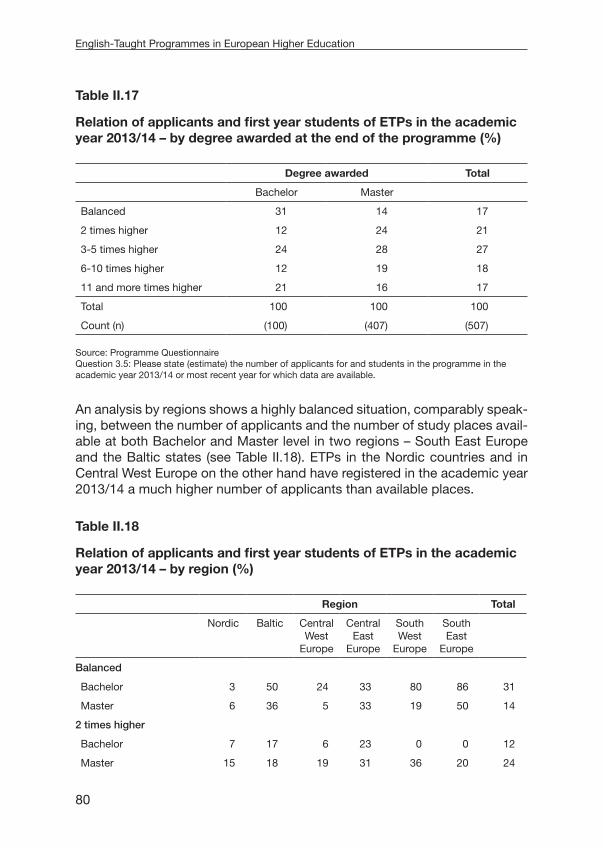
English-Taught Programmes in European Higher Education
80
Table II.17
Relation of applicants and first year students of ETPs in the academic year 2013/14 – by degree awarded at the end of the programme (%)
Degree awarded Total
Bachelor Master
Balanced 31 14 17
2 times higher 12 24 21
3-5 times higher 24 28 27
6-10 times higher 12 19 18
11 and more times higher 21 16 17
Total 100 100 100
Count (n) (100) (407) (507)
Source: Programme Questionnaire Question 3.5: Please state (estimate) the number of applicants for and students in the programme in the academic year 2013/14 or most recent year for which data are available.
An analysis by regions shows a highly balanced situation, comparably speak-ing, between the number of applicants and the number of study places avail-able at both Bachelor and Master level in two regions – South East Europe and the Baltic states (see Table II.18). ETPs in the Nordic countries and in Central West Europe on the other hand have registered in the academic year 2013/14 a much higher number of applicants than available places.
Table II.18
Relation of applicants and first year students of ETPs in the academic year 2013/14 – by region (%)
Region Total
Nordic Baltic Central West
Europe
Central East
Europe
South West
Europe
South East
Europe
Balanced
Bachelor 3 50 24 33 80 86 31
Master 6 36 5 33 19 50 14
2 times higher
Bachelor 7 17 6 23 0 0 12
Master 15 18 19 31 36 20 24
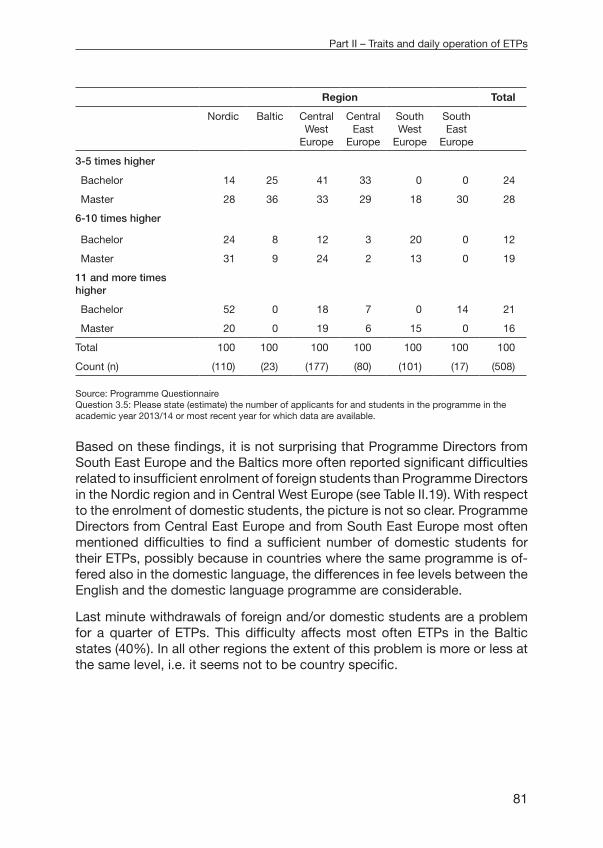
81
Part II – Traits and daily operation of ETPs
Region Total
Nordic Baltic Central West
Europe
Central East
Europe
South West
Europe
South East
Europe
3-5 times higher
Bachelor 14 25 41 33 0 0 24
Master 28 36 33 29 18 30 28
6-10 times higher
Bachelor 24 8 12 3 20 0 12
Master 31 9 24 2 13 0 19
11 and more times higher
Bachelor 52 0 18 7 0 14 21
Master 20 0 19 6 15 0 16
Total 100 100 100 100 100 100 100
Count (n) (110) (23) (177) (80) (101) (17) (508)
Source: Programme Questionnaire Question 3.5: Please state (estimate) the number of applicants for and students in the programme in the academic year 2013/14 or most recent year for which data are available.
Based on these findings, it is not surprising that Programme Directors from South East Europe and the Baltics more often reported significant difficulties related to insufficient enrolment of foreign students than Programme Directors in the Nordic region and in Central West Europe (see Table II.19). With respect to the enrolment of domestic students, the picture is not so clear. Programme Directors from Central East Europe and from South East Europe most often mentioned difficulties to find a sufficient number of domestic students for their ETPs, possibly because in countries where the same programme is of-fered also in the domestic language, the differences in fee levels between the English and the domestic language programme are considerable.
Last minute withdrawals of foreign and/or domestic students are a problem for a quarter of ETPs. This difficulty affects most often ETPs in the Baltic states (40%). In all other regions the extent of this problem is more or less at the same level, i.e. it seems not to be country specific.

English-Taught Programmes in European Higher Education
82
Table II.19
Significant difficulties which affected the running of the ETPs – by region (%*)
Region Total
Nordic Baltic Central West
Europe
Central East
Europe
South West
Europe
South East
Europe
Lack of/insufficient enrolment of foreign students 19 46 11 41 21 41 22
Lack of/insufficient enrolment of domestic students 23 22 16 41 22 32 23
Last minute withdraw-als of international and/or domestic students 28 40 21 29 25 20 25
Count (n) (171) (37) (258) (118) (157) (31) (772)
Source: Programme Questionnaire Question 4.7: To which extent have the following difficulties affected the running of the programme? * Scale points 5 and 4 on a scale from 1 = ‘not at all’ to 5 = ‘to a great extent’
7 Classroom composition – regional origin of students
In order to determine the geographical origin of students enrolled in ETPs, the Programme Directors were asked to provide information on the total number of students in the academic year 2013/14 in one of two ways. Preferably, they were asked to specify the number of students by country/region of origin. Al-ternatively, in case they were not able to do so, they were asked to differentiate only between domestic and foreign students. Unfortunately, only slightly more than half of all respondents were able or willing to provide data on the country/region of students’ origin. When interpreting the data obtained, these limitations must obviously be borne in mind. It is clear that, at best, the data can yield only rough indications of the geographical distribution of students in ETPs.
In total, about 54% of all students enrolled in ETPs are foreign students (Table II.20). In the 2007 survey, their proportion was considerably higher, at 65%, and in 2001 slightly higher, at 60%. Given these variations, there is obviously no clear trend in the enrolment of foreign students in the period 2001-2014.

83
Part II – Traits and daily operation of ETPs
With respect to the proportion of foreign students, a large variety between the ETPs covered in the survey could be observed. In a small proportion of 5% only domestic students are enrolled and in a further fifth of ETPs the share of foreign students is at most 25%. On the other hand, 10% of ETPs stated that all students are from outside their own country and in a quarter of programmes the proportion is 76% or higher. As Table II.20 shows, low enrol-ment of foreign students is most common in the Baltics and in South East Europe while it is highest in the Nordics and Central West Europe.
Table II.20
Proportion of foreign students enrolled in ETPs in 2013/14 – by region (% and mean)
Region Total
Nordic Baltic Central West
Europe
Central East
Europe
South West
Europe
South East
Europe
None 2 26 0 15 3 16 5
1-25% 7 39 18 17 27 56 20
26-50% 28 13 28 17 28 16 26
51-75% 26 6 16 11 12 4 16
76-99% 30 16 32 8 21 0 24
100% 8 0 6 32 9 8 10
Total 100 100 100 100 100 100 100
Count (n) (149) (31) (215) (84) (149) (25) (653)
All ETPs (mean) 62 27 59 55 51 22 54
Bachelor (mean) 60 10 36 45 29 30 39
Master (mean) 63 36 60 61 52 18 57
Source: Programme Questionnaire Question 3.5: Please state (estimate) the number of applicants for and students in the programme in the academic year 2013/14 or most recent year for which data are available.
The proportion of foreign students in Master programmes is on average sub-stantially higher than in Bachelor programmes (57% as compared to 39%). This finding supports the assumption that Bachelor programmes more often serve as a means to make domestic students fit for the global market while Master programmes more often suit to attract foreign students as top talents for the own labour markets, as fee payers, etc.

English-Taught Programmes in European Higher Education
84
Students with a European nationality form the largest cohort in ETPs, in fact the majority (about 68% - i.e. 17% EU//EFTA, 6% other European and 45% domestic). In Europe, of all foreign students in ETPs,
– 17% come from European Union and EFTA countries,
– 6% come from other European countries,
– 14% come from Asia, (or, to be precise, 4% from China, 4% from India, and 6% from other Asian countries),
– 5% come from Africa,
– 5% come from the Near and Middle East,
– 3% come from North America, and
– 4% come from Latin America15.
Thus, the group of foreign students from Europe forms the largest continen-tal group (23%), followed closely by Asians (14%). Africa and the Near and Middle East come third while the Americas play only a minor role. Leaving aside Europeans, the majority of foreign students come from developing or emerging economies, where demand for (quality) higher education is rising, but higher education supply is still insufficient.
The enrolment of domestic and foreign students in ETPs differs substantially by country of institutions. As Chart II.2 shows, domestic students have a share of more than three quarters in Lithuania (97%), Romania (90%) and Turkey (84%). On the other hand, the proportion of foreign students from non-EU/EFTA countries is highest in Poland (54%), Belgium (54%), Finland (54%) and Germany (51%).
15 Australia and Pacific have less than 1%.
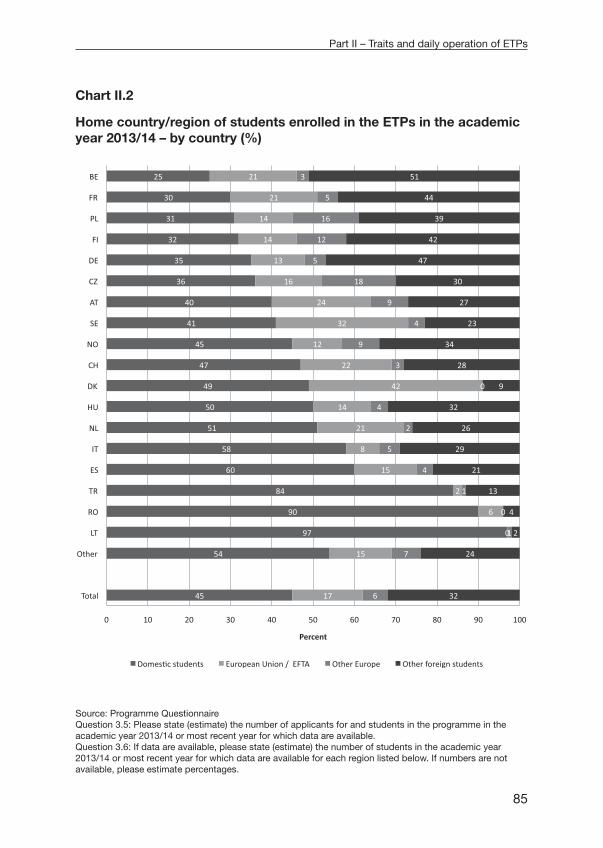
85
Part II – Traits and daily operation of ETPs
Chart II.2
Home country/region of students enrolled in the ETPs in the academic year 2013/14 – by country (%)
Source: Programme Questionnaire Question 3.5: Please state (estimate) the number of applicants for and students in the programme in the academic year 2013/14 or most recent year for which data are available. Question 3.6: If data are available, please state (estimate) the number of students in the academic year 2013/14 or most recent year for which data are available for each region listed below. If numbers are not available, please estimate percentages.
English-Taught Programmes in European Higher Education
86
8 Characteristics of the curriculum
Experience indicates that pioneers in one particular field of reform and in-ternationalisation, such as the creation of ETPs, are also innovators in other respects. It might therefore be reasonable to expect that, next to the use of English as a medium of instruction, curricula of programmes delivered in English would have further features typical of modern and internationalised programmes. From the descriptions of the curriculum by Programme Direc-tors the following characteristics could be elaborated:
Contents especially designed for foreign students.
Contents suitable for the preparation of students for international professions, e.g. interdisciplinary area and regional studies, broadening of traditional pro-grammes through an internationally comparative approach, offering interna-tional subject matters like international relations, European law etc., or ad-dressing cross-cultural communication issues and the provision of training in intercultural skills:
– Award of joint or double degrees.
– Mobility windows within the curriculum, e.g. mandatory study periods or work placements abroad. Spending a period abroad is usually a require-ment for the award of a joint or double degree.
– Mandatory work placements in the country where the institution is located.
– Special courses to bring students’ abilities to a homogeneous level.
It turns out that the vast majority of ETPs have tailored contents to prepare students for international professions (80%) (Table II.21). This is often done by broadening traditional programmes by an internationally comparative ap-proach (46%), by focusing on international subject matters (39%) or by ad-dressing cross-cultural communication issues and providing training in inter-cultural skills (35%).

87
Part II – Traits and daily operation of ETPs
Table II.21
Characteristics of the curriculum of the ETPs – by degree awarded at the end of the programme (%, multiple replies possible)
Degree awarded Total
Bachelor Master
Contents suitable for the preparation of students for international professions 87 78 80
Traditional/original subject area broadened by an internationally Comparative approach 61 43 46International subject matter 46 38 39Addressing of cross-cultural commu-nication issues and provision of Training in intercultural skills 53 30 35Interdisciplinary programme such as area and regional studies 23 25 24
Contents especially designed for foreign students 30 47 44
Award of joint or double degrees 25 28 28
Mobility windows within the curriculum 20 19 19
Mandatory study abroad 14 15 15Mandatory work placement abroad 12 6 7
Special courses to bring abilities of students to a homogenous level 20 27 26
Mandatory work placements in the country where the institution is located 26 10 13
Other characteristics of the curriculum 31 32 32
Total 238 242 241
Count (n) (167) (696) (863)
Source: Programme Questionnaire Question 2.9: Which of the following aspects are characteristics of the programme’s curriculum?
Slightly more than two fifths of the ETPs are especially designed for foreign students (44%), while 28% award joint or double degrees and 19% have in-troduced mobility windows in the curriculum in the form of mandatory study or work placements abroad. Mandatory work placements in the country in which the institution is located is a characteristic of 13% of the ETPs and 26% offer special courses to bring abilities of students to a homogeneous level.
What might come as a surprise – at first glance – is the relatively low per-centage of programmes with an integrated mobility window in the curriculum (Table II.21). But most of the ETPs are offered at the Master level and are thus
English-Taught Programmes in European Higher Education
88
of relatively short (maximum two years) duration, where it is more difficult to integrate a study-abroad phase than in longer programmes. In addition, it is less necessary than in ‘conventional’ programmes to internationalise the study experience through a stay abroad, since 55% of all students are non-domestic students and have thus already moved abroad (see Sub-section 7 of Part II).
Characteristics of the ETPs curriculum differ to a certain extent by subject area (see Table II.22). Programmes in social sciences, business and law on Bachelor and on Master level put special emphasis on the preparation of students for international professions (99% and 95%). Contents especially designed for foreign students are most common in natural sciences (51%). The award of joint and double degree is most often a characteristic of ETPs in engineering, manufacturing and construction (32% each of Bachelor and Master programmes) and in social sciences, business and law (35% and 33%). On the Bachelor level it turned out that mobility windows within the curriculum are most frequent in in social sciences, business and law (33%). An interesting case is that ETPs in health and welfare where on the one hand a comparable high proportion of Bachelor programmes are especially de-signed for foreign students while the respective proportion of Master pro-grammes is clearly below the average of all Master programmes.

89
Part II – Traits and daily operation of ETPs
Table II.22
Characteristics of the curriculum of the ETPs – by main subject area (%, multiple replies possible)
Main subject area
Engineering, manufacturing
and construction
Health and welfare
Humanities and arts
Contents especially designed for foreign students
Bachelor 13 45 25
Master 53 32 54
Contents suitable for the preparation of students for international professions
Bachelor 68 91 81
Master 67 79 88
Award of joint or double degrees
Bachelor 32 0 6
Master 32 9 10
Mobility windows within the curriculum
Bachelor 6 18 13
Master 10 12 16
Mandatory work placements in the country where the institution is located
Bachelor 19 36 25
Master 9 9 10
Special courses to bring abilities of students to a homogenous level
Bachelor 16 27 13
Master 25 32 20
Other characteristics of the curriculum
Bachelor 16 27 38
Master 28 32 30
Total 212 216 221
Count (n) (147) (45) (66)
Table II. 22 to continue on page 90
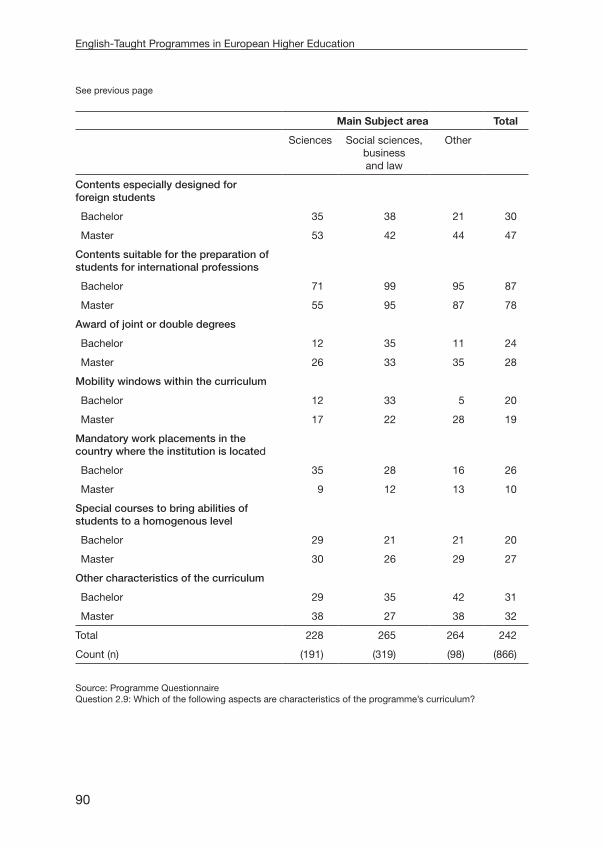
English-Taught Programmes in European Higher Education
90
Main Subject area Total
Sciences Social sciences, business and law
Other
Contents especially designed for foreign students
Bachelor 35 38 21 30
Master 53 42 44 47
Contents suitable for the preparation of students for international professions
Bachelor 71 99 95 87
Master 55 95 87 78
Award of joint or double degrees
Bachelor 12 35 11 24
Master 26 33 35 28
Mobility windows within the curriculum
Bachelor 12 33 5 20
Master 17 22 28 19
Mandatory work placements in the country where the institution is located
Bachelor 35 28 16 26
Master 9 12 13 10
Special courses to bring abilities of students to a homogenous level
Bachelor 29 21 21 20
Master 30 26 29 27
Other characteristics of the curriculum
Bachelor 29 35 42 31
Master 38 27 38 32
Total 228 265 264 242
Count (n) (191) (319) (98) (866)
See previous page
Source: Programme Questionnaire Question 2.9: Which of the following aspects are characteristics of the programme’s curriculum?
91
Part II – Traits and daily operation of ETPs
As Table II.23 shows, the importance attached to individual characteristics differs from one country group to another. However, it could not clearly be decided to what extent these are peculiarities of country groups or effects of different compositions of programmes by level of degree and subject area. If we look at those aspects of the curriculum which are of special importance from a national point of view for the recruitment of foreign students, the prep-aration of domestic students for international professions and the fostering of international cooperation’s of higher education institutions, the following strength and weaknesses could be observed:
– Programmes with a content especially designed for foreign students are most common in South West Europe (55% of the Master programmes and 38% of the Bachelor programmes). In Central West Europe the respective proportion of Master programmes is above average (51%) and in Central East Europe the proportion of Bachelor programmes (40%).
– Preparation of students for international professions is a frequent charac-teristic of curricula of Bachelor programmes in most regions. The respective proportions are lowest in South East Europe (67%) and in the Baltics (69%).
– Most joint or double degree ETPs taking part in the study could be found in South West Europe (56% of the Bachelor and 50% of the Master pro-grammes) and in the Baltics (44% and 32%).
– Mobility windows within the curriculum are most common in ETPs in Central West Europe (46% and 22%) and in South West Europe (38% and 28%).

English-Taught Programmes in European Higher Education
92
Table II.23
Characteristics of the curriculum of the ETPs – by region (%, multiple replies possible)
Region
Nordic Baltic Central West Europe
Central East Europe
Contents especially designed for foreign students
Bachelor 33 19 23 40
Master 40 42 51 34
Contents suitable for the preparation of students for international professions
Bachelor 97 69 96 85
Master 81 84 81 88
Award of joint or double degrees
Bachelor 19 44 31 6
Master 10 32 27 24
Mobility windows within the curriculum
Bachelor 22 6 46 8
Master 9 13 22 14
Mandatory work placements in the country where the institution is located
Bachelor 36 19 15 31
Master 7 16 9 13
Special courses to bring abilities of students to a homogenous level
Bachelor 31 6 27 15
Master 26 19 36 14
Other characteristics of the curriculum
Bachelor 39 19 46 27
Master 34 23 37 17
Total 221 213 265 209
Count (n) (188) (47) (281) (129)

93
Part II – Traits and daily operation of ETPs
Region Total
South West Europe
South East Europe
Contents especially designed for foreign students
Bachelor 38 10 30
Master 55 38 47
Contents suitable for the preparation of students for international professions
Bachelor 100 67 87
Master 66 81 78
Award of joint or double degrees
Bachelor 56 33 25
Master 50 13 28
Mobility windows within the curriculum
Bachelor 38 10 20
Master 28 0 19
Mandatory work placements in the country where the institution is located
Bachelor 19 19 26
Master 14 0 10
Special courses to bring abilities of students to a homogenous level
Bachelor 6 29 20
Master 23 13 27
Other characteristics of the curriculum
Bachelor 13 33 31
Master 31 25 32
Total 269 187 242
Count (n) (184) (38) (867)
Source: Programme Questionnaire Question 2.9: Which of the following aspects are characteristics of the programme’s curriculum?
English-Taught Programmes in European Higher Education
94
9 Challenges
Programme Directors of ETPs, both at Bachelor and Master levels, encounter different types of difficulties in the day to day running of their programmes. The biggest problems reported by both groups of coordinators are the large differ-ences in the academic level/ability of students – 30% of respondents in each category mentioned this as a significant difficulty (Table II.24). This seems to be by far the biggest difficulty encountered in the Nordic countries. Although the survey had not asked about such difficulties in programmes taught in the domestic language, we assume that this is not a challenge specific to ETPs, but a general one; however in the case of ETPs this might be felt as more acute, as it is often coupled with heterogeneity in the command of the English language, which is felt more, according to our survey, by Institutional Coor-dinators of ETPs at Bachelor than at Master level (21% compared to 13%).
While some of the coordinators providing more extended comments to this question regarded the heterogeneity of the student body in ETPs also as an important asset, they reported that some aspects deriving from this diversity are difficult to manage at programme level. Such challenging aspects include the different expectations of students with regards to teaching styles in the classroom given their diverse backgrounds – expectation for more passive versus more interactive approaches –, different levels of subject area knowl-edge, and different student academic practices and ethical standards (e.g. different habits in referencing academic work).

95
Part II – Traits and daily operation of ETPs
Table II.24
Significant difficulties which affected the running of the ETPs – by region (%*, multiple replies possible)
Region Total
Nordic Baltic Central West
Europe
Central East
Europe
South West
Europe
South East
Europe
Lack of/insufficient enrolment of foreign students
Bachelor 9 62 9 41 8 15 25
Master 22 38 11 41 22 60 21
Lack of/insufficient enrolment of domestic students
Bachelor 9 31 0 46 0 27 23
Master 27 17 18 38 23 31 23
Lack of support from faculty/ academic staff
Bachelor 9 15 9 13 0 18 11
Master 7 13 7 6 7 15 7
Insufficient proficiency in English of foreign students
Bachelor 16 8 9 7 0 0 8
Master 13 4 8 9 4 14 8
Insufficient proficiency in English of domestic students
Bachelor 0 0 4 7 8 0 4
Master 1 0 3 5 4 0 3
Insufficient proficiency in English of academic staff
Bachelor 0 0 4 7 0 0 3
Master 4 17 3 3 6 0 4
Insufficient proficiency in English of administrative staff
Bachelor 0 0 17 12 0 9 8
Master 1 8 5 9 14 0 7
Insufficient proficiency of foreign students in the domestic language at your institution
Bachelor 19 17 22 14 8 0 15
Master 2 17 7 1 6 8 6
Table II. 24 to continue on page 96
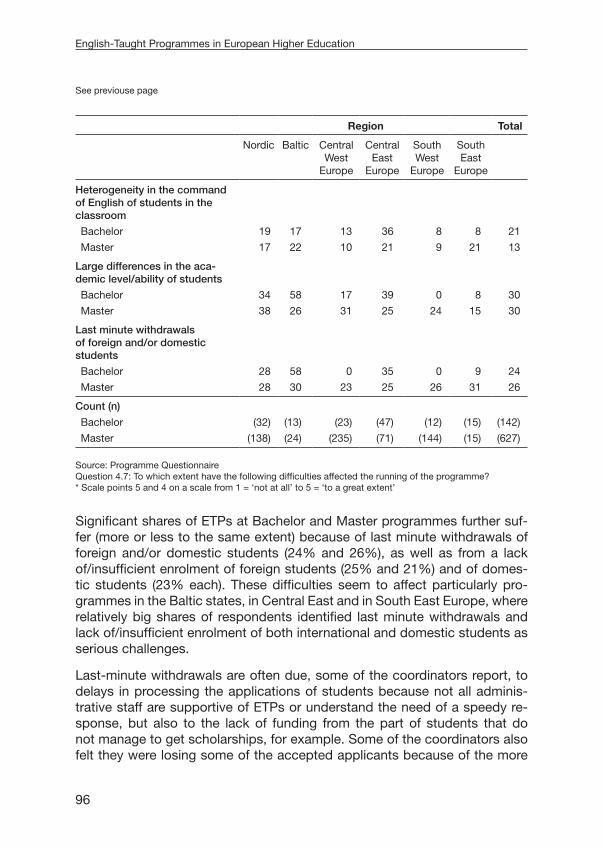
English-Taught Programmes in European Higher Education
96
See previouse page
Region Total
Nordic Baltic Central West
Europe
Central East
Europe
South West
Europe
South East
Europe
Heterogeneity in the command of English of students in the classroom
Bachelor 19 17 13 36 8 8 21
Master 17 22 10 21 9 21 13
Large differences in the aca-demic level/ability of students
Bachelor 34 58 17 39 0 8 30
Master 38 26 31 25 24 15 30
Last minute withdrawals of foreign and/or domestic students
Bachelor 28 58 0 35 0 9 24
Master 28 30 23 25 26 31 26
Count (n)
Bachelor (32) (13) (23) (47) (12) (15) (142)
Master (138) (24) (235) (71) (144) (15) (627)
Source: Programme Questionnaire Question 4.7: To which extent have the following difficulties affected the running of the programme? * Scale points 5 and 4 on a scale from 1 = ‘not at all’ to 5 = ‘to a great extent’
Significant shares of ETPs at Bachelor and Master programmes further suf-fer (more or less to the same extent) because of last minute withdrawals of foreign and/or domestic students (24% and 26%), as well as from a lack of/insufficient enrolment of foreign students (25% and 21%) and of domes-tic students (23% each). These difficulties seem to affect particularly pro-grammes in the Baltic states, in Central East and in South East Europe, where relatively big shares of respondents identified last minute withdrawals and lack of/insufficient enrolment of both international and domestic students as serious challenges.
Last-minute withdrawals are often due, some of the coordinators report, to delays in processing the applications of students because not all adminis-trative staff are supportive of ETPs or understand the need of a speedy re-sponse, but also to the lack of funding from the part of students that do not manage to get scholarships, for example. Some of the coordinators also felt they were losing some of the accepted applicants because of the more

97
Part II – Traits and daily operation of ETPs
“aggressive” countries that offer students attractive grants and scholarships. On the other hand, the low enrolment of domestic students seems to be in certain countries caused by national regulations that restrict the access of domestic students to such programmes, which are primarily targeting foreign students.
Other difficulties were mentioned by Programme Directors in addition to those covered in Table II.24 and they are quite diverse, as follows:
– lack of institutional support, particularly from administrative staff, which leads to academic staff having to become involved in programme admin-istration as well. Related to this, some institutions and programmes suffer from a high turnover of administrative staff, which leads to a lack of continu-ity and loss of expertise when dealing with administrative matters in ETPs.
– restrictive national regulations particularly when it comes to issuing visas for foreign students, which can cause in countries like France, the Nether-lands, Finland, Portugal or Sweden, some Programme Directors said, very long delays, of up to one year (depending on where the foreign students come from).
– lack of (structural) funding for the programmes, as well as for the foreign students taking part in the programme. Very often the sustainability of the programmes depends on the tuition fees that students pay, but on the other hand many programmes feel the pressure to lower their fee levels to be more competitive and be able to attract foreign students. Many pro-grammes do not have any funding available to compensate for the fees by granting scholarships to at least some of their ETP students, and feel they are disadvantaged because of this compared to other programmes that do. Lack of funding makes it difficult, some coordinators said, to keep the qual-ity of the ETPs at a very good level.
– competition – many of the Programme Directors felt they are in a fierce competition with established, top-ranked programmes in countries where English is the mother tongue and they found this difficult.
– challenges to select the “right students” – Some of the Programme Directors complained that especially for new ETPs they are forced to lower the stand-ards to be able to attract foreign students and to launch the programmes, and thus they don’t always get as good students as they would like. Other Programme Directors, especially from the Nordic countries, complained that they are flooded with very good applications and it is at times very dif-ficult to select in a fair manner.

English-Taught Programmes in European Higher Education
98
Part III – English in the classroom and beyond
Queenie K.H. Lam (ACA), Friedhelm Maiworm (GES)
When ETPs in non-English-speaking European countries first became a mat-ter of academic attention around the turn of the century, a highly controver-sial debate set in. It concentrated on the quality of learning, which critics maintained was in danger. Concerns were raised that the classroom reality of ETPs was marked by teachers who could not properly express themselves in English and students who were unable to fully understand. At its height, the dispute displayed all signs of religious warfare. The discussion on English as a “medium of instruction” appears to have calmed down considerably, but the issue of language mastery is still on the agenda.
The 2001 and 2007 surveys found that there were indeed language issues to be addressed. But it did not confirm that they were quite as serious as the critics of this form of delivery maintained. Moreover, it identified the most no-table problems in an area not much debated until then: the foreign students’ mastery (or rather the lack of mastery) of the domestic language of their host country.
How has the situation developed in the past seven years? The 2014 survey tried to shed light on this matter with a close look into language-related is-sues, which are presented in this part of the study.
1 Language proficiency
1.1 Language proficiency of students
The vast majority of Programme Directors rated the proficiency in English of students enrolled in their ETPs as good or very good. The competences of domestic students were however more positively assessed than those of foreign students, 80% compared to 73% (Table III.1). There are some excep-tions on the country level, however. In Spain, France, Italy and Turkey, the proficiency of foreign students was rated higher than that of the domestic students. In Italy and Turkey, this could be explained by the relatively low English proficiency of the domestic students, whereas in France and Spain, it was clearly because of the higher English proficiency of the foreign students. 98% and 84% of the Programme Directors in France and Spain, compared to the average 73% among all directors, considered the English of their foreign students to be of very high standard (Table III.3).
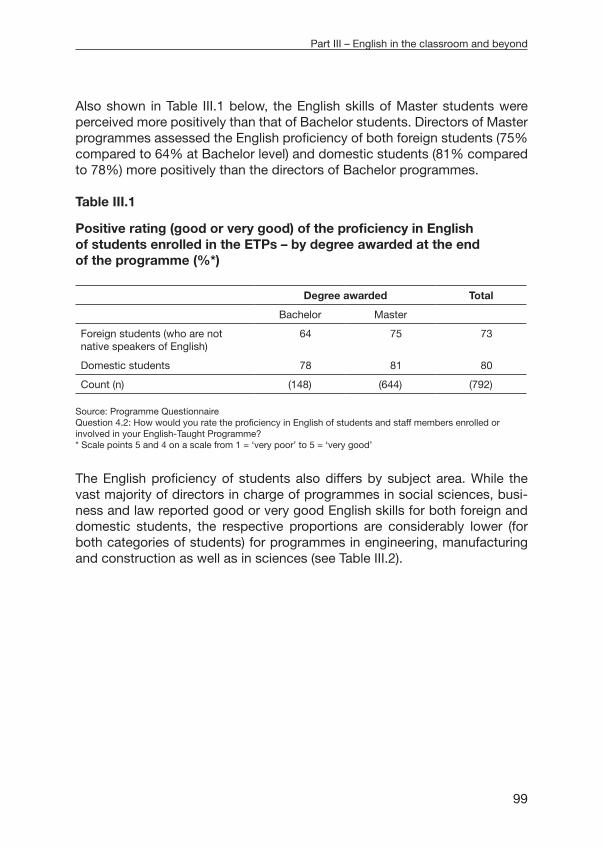
99
Part III – English in the classroom and beyond
Also shown in Table III.1 below, the English skills of Master students were perceived more positively than that of Bachelor students. Directors of Master programmes assessed the English proficiency of both foreign students (75% compared to 64% at Bachelor level) and domestic students (81% compared to 78%) more positively than the directors of Bachelor programmes.
Table III.1
Positive rating (good or very good) of the proficiency in English of students enrolled in the ETPs – by degree awarded at the end of the programme (%*)
Degree awarded Total
Bachelor Master
Foreign students (who are not native speakers of English)
64 75 73
Domestic students 78 81 80
Count (n) (148) (644) (792)
Source: Programme Questionnaire Question 4.2: How would you rate the proficiency in English of students and staff members enrolled or involved in your English-Taught Programme? * Scale points 5 and 4 on a scale from 1 = ‘very poor’ to 5 = ‘very good’
The English proficiency of students also differs by subject area. While the vast majority of directors in charge of programmes in social sciences, busi-ness and law reported good or very good English skills for both foreign and domestic students, the respective proportions are considerably lower (for both categories of students) for programmes in engineering, manufacturing and construction as well as in sciences (see Table III.2).

English-Taught Programmes in European Higher Education
100
Table III.2
Positive rating of the proficiency in English of students enrolled in the ETPs – by main subject area (%*)
Main Subject area Total
Engineering, manufac-turing and
construction
Health and
welfare
Humanities and arts
Sciences Social sciences, business and law
Other
Foreign students (who are not native speakers of English) 65 70 72 64 80 80 73
Domestic students 66 86 76 77 88 85 80
Count (n) (140) (43) (61) (179) (283) (89) (795)
Source: Programme Questionnaire Question 4.2: How would you rate the proficiency in English of students and staff members enrolled or involved in your English-Taught Programme? * Scale points 5 and 4 on a scale from 1 = ‘very poor’ to 5 = ‘very good’
On country level, as shown in Table III.3, foreign students studying in Bel-gium, Hungary, Sweden, and to a lesser extent, Turkey, Poland and Norway, were seen as less proficient in English than those studying in other countries. On average, 73% of the Programme Directors rated their foreign students as good or very good in English, whereas in the above-mentioned countries, only 50%-65% of the Programme Directors held the same view.
Table III.3
Positive rating of the proficiency in English of students, academic and administrative staff members involved in ETPs – by country (%*)
Country
AT BE CH CZ DE DK ES FI FR
Foreign students (who are not native speakers of English) 88 51 73 73 73 68 84 74 98
Domestic students 96 78 80 76 84 89 61 95 85
Teaching staff 100 100 93 95 91 95 88 95 92
Administrative staff 88 82 73 84 57 63 28 77 58
Count (n) (26) (39) (15) (43) (129) (19) (32) (66) (53)
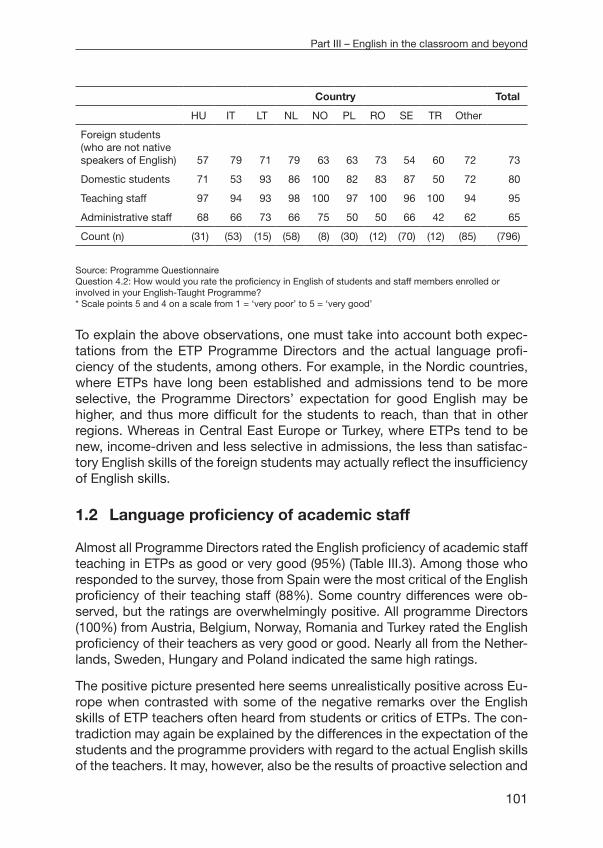
101
Part III – English in the classroom and beyond
Source: Programme Questionnaire Question 4.2: How would you rate the proficiency in English of students and staff members enrolled or involved in your English-Taught Programme? * Scale points 5 and 4 on a scale from 1 = ‘very poor’ to 5 = ‘very good’
To explain the above observations, one must take into account both expec-tations from the ETP Programme Directors and the actual language profi-ciency of the students, among others. For example, in the Nordic countries, where ETPs have long been established and admissions tend to be more selective, the Programme Directors’ expectation for good English may be higher, and thus more difficult for the students to reach, than that in other regions. Whereas in Central East Europe or Turkey, where ETPs tend to be new, income-driven and less selective in admissions, the less than satisfac-tory English skills of the foreign students may actually reflect the insufficiency of English skills.
1.2 Language proficiency of academic staff
Almost all Programme Directors rated the English proficiency of academic staff teaching in ETPs as good or very good (95%) (Table III.3). Among those who responded to the survey, those from Spain were the most critical of the English proficiency of their teaching staff (88%). Some country differences were ob-served, but the ratings are overwhelmingly positive. All programme Directors (100%) from Austria, Belgium, Norway, Romania and Turkey rated the English proficiency of their teachers as very good or good. Nearly all from the Nether-lands, Sweden, Hungary and Poland indicated the same high ratings.
The positive picture presented here seems unrealistically positive across Eu-rope when contrasted with some of the negative remarks over the English skills of ETP teachers often heard from students or critics of ETPs. The con-tradiction may again be explained by the differences in the expectation of the students and the programme providers with regard to the actual English skills of the teachers. It may, however, also be the results of proactive selection and
Country Total
HU IT LT NL NO PL RO SE TR Other
Foreign students (who are not native speakers of English) 57 79 71 79 63 63 73 54 60 72 73
Domestic students 71 53 93 86 100 82 83 87 50 72 80
Teaching staff 97 94 93 98 100 97 100 96 100 94 95
Administrative staff 68 66 73 66 75 50 50 66 42 62 65
Count (n) (31) (53) (15) (58) (8) (30) (12) (70) (12) (85) (796)

English-Taught Programmes in European Higher Education
102
training measures employed by institutions to ensure the high English profi-ciency of their teaching staff (see Sub-section 3.2 below).
1.3 Language proficiency of administrative staff
Also shown in Table III.3, about two thirds of the Programme Directors rated the proficiency in English of administrative staff members involved in the ETPs as good or very good. The respective proportion is highest in Austria (88%), Czech Republic (84%) and Belgium (82%), while it is lowest in Turkey (42%) and Spain (28%). A mixed picture was perceived in Germany, France, Poland and Romania, where only about half of the Programme Directors viewed the English proficiency of their administrative staff positively.
From a broader perspective, some noticeable regional differences by level of programme were observed. In South West Europe, administrative staff mem-bers supporting Master-level ETPs in this region were seen as the least pro-ficient in English. Only 52% of the Programme Directors rated their English proficiency positively. This is a stark contrast from that of the administrative staff supporting Bachelor-level ETPs who received a high rating from over 90% of the Programme Directors surveyed. A slightly similar pattern was observed in the Nordic and Baltic countries where administrative staff sup-porting Bachelor-level ETPs was seen to be more proficient in English than those supporting Master-level ETPs.
On the contrary, in Central West Europe, Central East Europe and South East Europe, English proficiency of all those involved in Master-level ETPs was rated higher than those involved in Bachelor-level ETPs across the board. The biggest concern over English proficiency in these regions appears to be with the administrative staff supporting Bachelor-level ETPs. Less than 60% of the Programme Directors rated the English proficiency of administrative staff for Bachelor-level ETPs as good or very good.
Among all regions, administrative staff in South East Europe is the least pre-pared in English. This may be explained by the fact of ETPs primarily enrolled domestic students in countries like Turkey (84%) and Romania (90%). In such cases, the introduction of ETPs does not necessarily lead to the introduction of English into the administrative environment (see Chart II.2).
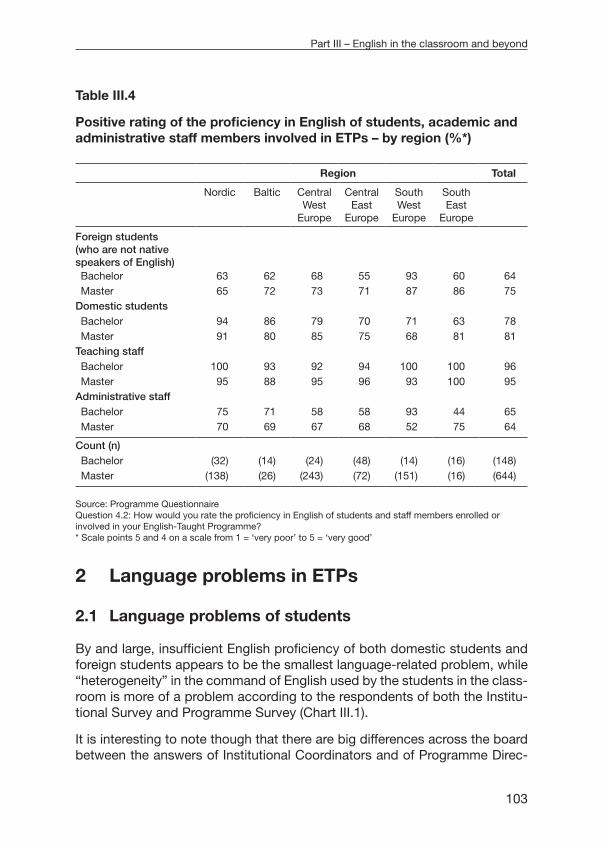
103
Part III – English in the classroom and beyond
Table III.4
Positive rating of the proficiency in English of students, academic and administrative staff members involved in ETPs – by region (%*)
Region Total
Nordic Baltic Central West
Europe
Central East
Europe
South West
Europe
South East
Europe
Foreign students (who are not native speakers of English)Bachelor 63 62 68 55 93 60 64Master 65 72 73 71 87 86 75
Domestic studentsBachelor 94 86 79 70 71 63 78Master 91 80 85 75 68 81 81
Teaching staffBachelor 100 93 92 94 100 100 96Master 95 88 95 96 93 100 95
Administrative staffBachelor 75 71 58 58 93 44 65Master 70 69 67 68 52 75 64
Count (n)Bachelor (32) (14) (24) (48) (14) (16) (148)Master (138) (26) (243) (72) (151) (16) (644)
Source: Programme Questionnaire Question 4.2: How would you rate the proficiency in English of students and staff members enrolled or involved in your English-Taught Programme? * Scale points 5 and 4 on a scale from 1 = ‘very poor’ to 5 = ‘very good’
2 Language problems in ETPs
2.1 Language problems of students
By and large, insufficient English proficiency of both domestic students and foreign students appears to be the smallest language-related problem, while “heterogeneity” in the command of English used by the students in the class-room is more of a problem according to the respondents of both the Institu-tional Survey and Programme Survey (Chart III.1).
It is interesting to note though that there are big differences across the board between the answers of Institutional Coordinators and of Programme Direc-

English-Taught Programmes in European Higher Education
104
tors, with Institutional Coordinators rating more frequently all the four lan-guage-related issues as “a serious/a very serious problem” than Programme Directors. The biggest discrepancy is related to the insufficient proficiency of foreign students in the host language – while 34% of Institutional Coordinators viewed this as a serious (and as the biggest) problem, only 7% of Programme Directors held this view. Instead, the most often encountered problem for Pro-gramme Directors seems to be the heterogeneity in the command of English of students (15%), while for Institutional Coordinators this is only the sec-ond most frequent problem (25%). These differences are not that surprising, though. In most cases, the Programme Directors are likely to have more con-tact with the students in the classroom setting where English is used, while the Institutional Coordinators are more likely to assist the students with the administrative matters that require the use of the host language.
Chart III.1
Significant problems encountered with language proficiency – by type of respondents (%*)
Source: Institutional QuestionnaireExtract from Question 3.7: To what extent did your institution encounter difficulties in any of the following areas in running of the English-Taught Programme(s)?Source: Programme QuestionnaireExtract from Question 4.7: To which extent have the following difficulties affected the running of the pro-gramme?* Points 4 and 5 on a scale from 1 = ‘not at all’ to 5 = ‘very serious difficulties’
While we are interested in trends, a comparison of the present data with the data from 2001 and 2007 surveys is only partly legitimate. This is because the countries surveyed and the definitions of ETPs in the three studies are not identical, as explained earlier in Part I of the study. In particular, the 2001 sur-
105
Part III – English in the classroom and beyond
vey included mixed-language programmes, in which a good command of the domestic language was also necessary in the classroom. Despite all these limitations, it could still be mentioned that the percentage of Programme Di-rectors who identified significant problems with regard to all four questions had gone down in 2007 and decreased further in 2014. Programme Directors who viewed the foreign students’ proficiency in the host-country language as insufficient went down from 39% in 2001 to 7% in the current study. The percentage value for the lack of English proficiency of foreign students went down from 21% to 8%. And the frequency of the least-often perceived prob-lem in both surveys, an insufficient mastery of English of domestic students, decreased from 8% to 3% in the view of Programme Directors.
In interpreting the above findings – on all four problem categories – one must bear in mind that the answers to these language-related questions are linked to expectations, and it is by no means certain that the levels of expectation – and the standards applied – are the same across Europe. By and large, however, the findings of the present surveys suggest that the conclusions of the 2001 and 2007 surveys still apply, and that English language proficiency has become less of a problem over the past seven years.
It is not to be ruled out, though, that institutions have, over time, gotten used to the imperfection of communication in an international classroom, of which they might have originally had too high an expectation. The newly found problem in the view of the Programme Directors these days is rather the “heterogeneity” in the command of English of the students and the difficulties to manage such heterogeneity in the classroom.
Beyond the classroom, the lack of domestic language skills for students to access the domestic labour market for internships, summer or post-study employment was raised by a number of Programme Directors in their replies to the open questions of the survey. This points to a new type of employ-ment-related language problems of ETP students (or graduates), but it does not seem to have developed into a common concern for ETP providers yet.
2.2 Language problems of academic staff
As shown in Sub-section 1.2 above, most Programme Directors have a very positive view of the English proficiency of their academic staff involved in the delivery of ETPs. According to the additional comments given by the respondents to the open questions of the surveys, the use of English profi-ciency as a selection criterion at the stage of recruitment was said to have im-proved and guaranteed the English proficiency of the teaching staff in some cases. To see it from a broader perspective, some Programme Directors ex-

English-Taught Programmes in European Higher Education
106
plained that with English being the global lingua academia, the offering of ETPs is a means, if not the only means, for them to access global talent and widen the potential choices of their new recruits. These new recruits inevi-tably speak English but not necessarily the local language (especially small languages) and therefore the courses offered by them “naturally” have to be taught in English. It was noted, however, that the strong English proficiency of the teaching staff does not imply that they can readily handle the heterogene-ous command of English, academic and cultural differences of the students in the classroom. As a result, the need to train the teachers, including native English-speakers, to handle linguistic and cultural diversity was mentioned by quite a few of the respondents.
2.3 Language problems of administrative staff
In contrast to the very positive ratings given to the academic staff, the English proficiency of administrative staff, especially those in central administration (such as the registry, financial office, housing office, student service cen-tre, etc.), was regarded as the least satisfactory by the survey respondents. Some Programme Directors pointed out, in their replies to the open ques-tions, that the administrators in the service units are not only unprepared to deal with students in English, but also unwilling to do so. It was therefore seen as a matter of attitude and openness to the foreign students on campus in addition to the lack of language ability.
In some universities where there is no critical mass of ETPs, the Programme Directors admitted that the problem is likely to persist because it is difficult for them to justify the “Englishisation” of the university’s administrative sys-tem and train all related staff in English to meet the needs of a few foreign students. Moreover, the lack of sustainable funding for ETPs, which are often self-financed or dependent on project funds, was said to have discouraged universities from making long-term investments to solve the language prob-lems of the administrative staff.
Instead of advocating for more language training for administrative staff, some respondents, particularly those from countries with other widely-spo-ken languages, started to question whether the problem of the administra-tors’ lack of English proficiency is not a problem of the students’ lack of domestic language skills. The current practice to completely waive the do-mestic language requirement in the recruitment of foreign students, even if the study programmes are fully taught in English, was challenged by a num-ber of respondents. From this point of view, the insufficient proficiency of the foreign students in the host language and the problem of the administrative staff in mastering English are closely related.

107
Part III – English in the classroom and beyond
3 Language support
3.1 Language support to students
Which efforts do higher education institutions in Europe make to support stu-dents with language problems related to English proficiency and mastery of domestic languages? This issue was addressed in the Institutional Survey as well as in the Programme Survey. The picture emerging from the responses is that a considerable proportion of institutions offer language training both in English and the domestic language. As Chart III.2 below shows, training in the domestic language for the foreign students was more often mentioned than English language training for domestic or foreign students. This finding shows that training offers are in line with the language difficulties of students.
Chart III.2
Offer of language training especially tailored for students enrolled in ETPs – by type of respondent (%, multiple replies possible)
Source: Programme Questionnaire Question 4.6: Does your institution offer language training especially tailored for students enrolled in English-Taught Programme(s)? Source: Institutional Questionnaire Question 3.5: Does your institution offer language training especially tailored for students enrolled in English-Taught Programme(s)?
Overall, less than one third of all responding programmes and institutions include no language training element at all (29% of the programmes and 27%

English-Taught Programmes in European Higher Education
108
of the institutions). More than half offer support for improving the command of the domestic language (55% and 58%), about half offer training in English for domestic students (48% and 51%) and foreign students (49% and 43%). From the programme perspective, slightly more English support is offered to foreign students than domestic students who were perceived to be more pro-ficient in English as shown in Sub-section 2 above. At the institutional level, however, more English support was said to have been provided to domestic students.
As Table III.5 shows, English language training is more often a character-istic of first-cycle, Bachelor programmes who, as we know from Part II.4, were also admitted with lower language test requirements when compared to Master students. The percentages of Bachelor-level ETPs offering Eng-lish language training to foreign students and to domestic students (63% and 60%) are significantly higher than those of second-cycle, Master pro-grammes (46% and 45%).
Among the regions compared, Bachelor students, both foreign and domes-tic, in South West Europe and South East Europe are much more likely to receive English support than those in other regions. This corresponds to the North-South divide that was mentioned earlier. The same emphasis on Eng-lish language support to foreign Bachelor students was also found in Central East Europe, where there is a large share of English-taught Bachelor pro-grammes and a serious problem perceived in the language proficiency of foreign Bachelor students.
Similarly, almost all Bachelor programmes (85%) in the Baltic region, and in particular Lithuania (79%), reported to have provided language support to their students, but the support is predominantly provided to domestic stu-dents. This does not come as a surprise knowing that ETPs in this region target largely domestic students (over 90% in Lithuania) (Table III.5, Table III.6 and Chart II.2).
As for training in domestic language, some 65% of both Bachelor and Mas-ter programmes in South West Europe, specifically France (71%) and Italy (68%), reported to have provided foreign students with domestic language training. The Nordic and Baltic regions, as well as South East Europe place substantially more emphasis on Bachelor students than Master students in the training of the domestic language (Table III.5 and Table III.6). Based on these observations, it seems that stronger emphasis on domestic language support is more likely to associate with new ETP offers on Bachelor level or in new areas of growth. This may have arisen from less developed English language services and thus a stronger need for the foreign students to com-municate in the domestic language beyond the classroom.
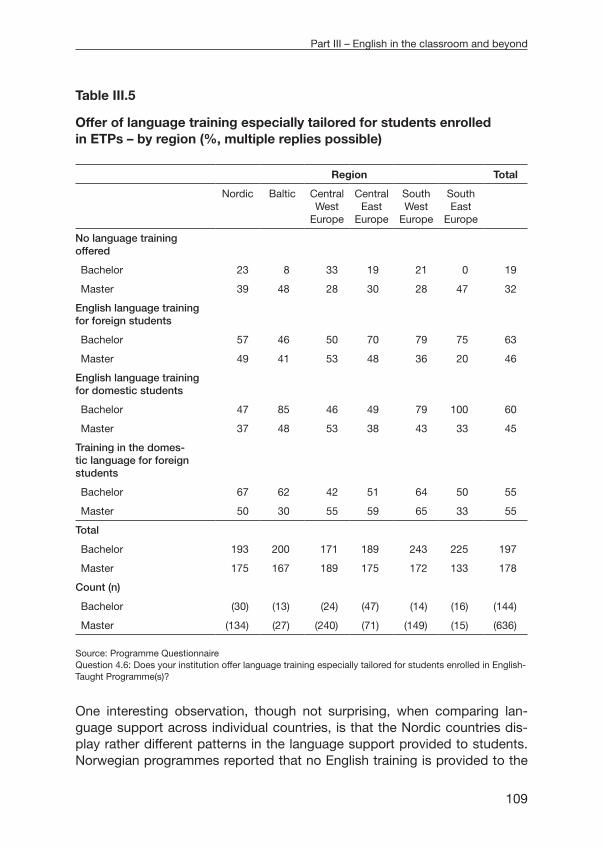
109
Part III – English in the classroom and beyond
Table III.5
Offer of language training especially tailored for students enrolled in ETPs – by region (%, multiple replies possible)
Region Total
Nordic Baltic Central West
Europe
Central East
Europe
South West
Europe
South East
Europe
No language training offered
Bachelor 23 8 33 19 21 0 19
Master 39 48 28 30 28 47 32
English language training for foreign students
Bachelor 57 46 50 70 79 75 63
Master 49 41 53 48 36 20 46
English language training for domestic students
Bachelor 47 85 46 49 79 100 60
Master 37 48 53 38 43 33 45
Training in the domes-tic language for foreign students
Bachelor 67 62 42 51 64 50 55
Master 50 30 55 59 65 33 55
Total
Bachelor 193 200 171 189 243 225 197
Master 175 167 189 175 172 133 178
Count (n)
Bachelor (30) (13) (24) (47) (14) (16) (144)
Master (134) (27) (240) (71) (149) (15) (636)
Source: Programme Questionnaire Question 4.6: Does your institution offer language training especially tailored for students enrolled in English-Taught Programme(s)?
One interesting observation, though not surprising, when comparing lan-guage support across individual countries, is that the Nordic countries dis-play rather different patterns in the language support provided to students. Norwegian programmes reported that no English training is provided to the

110
English-Taught Programmes in European Higher Education
students in ETPs, and only half of them provided domestic language training to foreign students. Next to Norway, only a small percentage of Danish pro-grammes (11%) provided language support to foreign students. No language support is provided for domestic students in ETPs. The relative importance of language training (a small percentage of 32% programmes) is placed on the training in the domestic language for foreign students. Sweden, though providing a bit more support than Denmark and Norway, is comparatively “lax” in the provision of language support compared to many other European countries, especially the support for its own students. Finland is at the other extreme. A large majority of Finnish programmes (74-78%) provide all four categories of language support (Table III.6).
The differences among the Nordic countries, which are all established ETP providers, suggest that mature systems may have very different approaches to language support.
3.2 Language support to academic staff
According to most Programme Directors, specific means are employed to ensure or to enhance the English proficiency of academic staff involved in ETPs (see Table III.7). This is positively associated with the above response from them that about 95% of academic staff teaching in ETPs has good or very good proficiency in English.
Overall speaking, in about half of the Master programmes and some 70% of Bachelor programmes responded to the survey, English proficiency is an important selection criterion for the recruitment of new academic staff. Den-mark, Turkey and Belgium are the countries where over 70% of ETPs reported that English is a selection criterion for new staff recruitment. On the contrary, Spain is the country where English proficiency is seldom considered a staff recruitment criterion, with less than one fifth of the programmes reporting that English is a selection criterion (Table III.8). Taking Turkey and Spain as examples, the use of English as a recruitment criterion does seem to have an impact on the perceived English proficiency of the teaching staff.
Almost as often, academic staff members are encouraged to improve, op-tionally, their English language proficiency (57% of those involved in Bache-lor-level ETPs and 48% in Master-level ETPs). Denmark, Finland, Spain and Switzerland are the countries where such an optional language support is most likely offered to academic staff.
About one third of the respondents in both Bachelor and Master programmes stated that the institution offers English-language courses that are tailored to the needs of academic staff. In Hungary, the Netherlands, Finland, Denmark
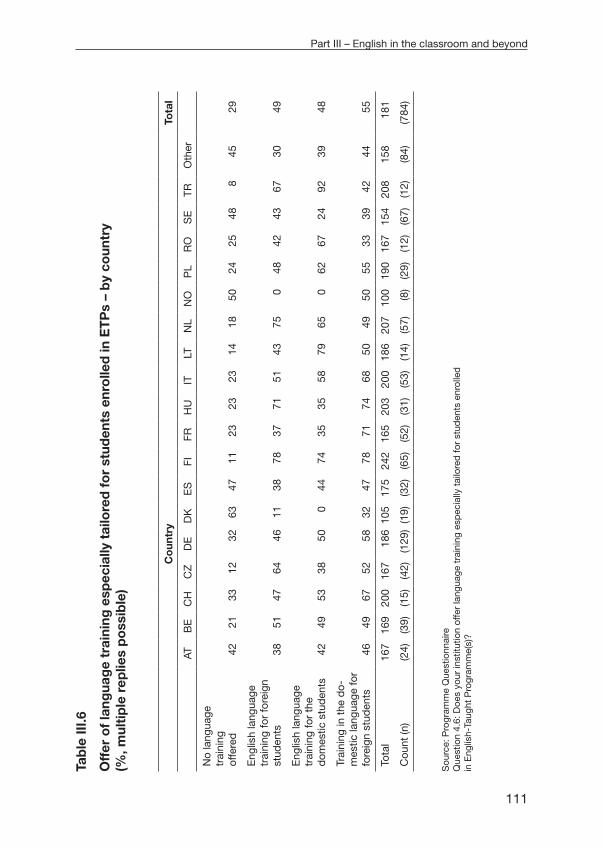
111
Part III – English in the classroom and beyond
Sou
rce:
Pro
gram
me
Que
stio
nnai
re
Que
stio
n 4.
6: D
oes
your
inst
itutio
n of
fer
lang
uage
tra
inin
g es
pec
ially
tai
lore
d fo
r st
uden
ts e
nrol
led
in
Eng
lish-
Taug
ht P
rogr
amm
e(s)
?
Co
untr
yTo
tal
ATB
EC
HC
ZD
ED
KE
SFI
FRH
UIT
LTN
LN
OP
LR
OS
ETR
Oth
er
No
lang
uage
tr
aini
ng
offe
red
4221
3312
3263
4711
2323
2314
1850
2425
488
4529
Eng
lish
lang
uage
tr
aini
ng fo
r fo
reig
n st
uden
ts38
5147
6446
1138
7837
7151
4375
048
4243
6730
49
Eng
lish
lang
uage
tr
aini
ng fo
r th
e
dom
estic
stu
den
ts42
4953
3850
044
7435
3558
7965
062
6724
9239
48
Trai
ning
in t
he d
o-m
estic
lang
uage
for
fore
ign
stud
ents
4649
6752
5832
4778
7174
6850
4950
5533
3942
4455
Tota
l16
716
920
016
718
610
517
524
216
520
320
018
620
710
019
016
715
420
815
818
1
Cou
nt (n
)(2
4)(3
9)(1
5)(4
2)(1
29)
(19)
(32)
(65)
(52)
(31)
(53)
(14)
(57)
(8)
(29)
(12)
(67)
(12)
(84)
(784
)
Tab
le II
I.6
Off
er o
f la
ngua
ge
trai
ning
esp
ecia
lly t
ailo
red
fo
r st
uden
ts e
nro
lled
in E
TP
s –
by
coun
try
(%
, mul
tip
le r
eplie
s p
oss
ible
)
English-Taught Programmes in European Higher Education
112
and Belgium, tailored English courses for academic staff are much more of-ten offered when compared to others. It is worth noting that these countries are either leading providers of ETPs or the up-and-coming ones.
Mandatory English courses for academic staff, on the other hand, are rather rare (19% for Bachelor and 11% for Master) in general. However, country differences are observed. In Belgium and the Netherlands, respectively 59% and 42% of all the programme respondents reported that it is mandatory for academic staff to improve their English. Less so, but still one third of the programmes in Hungary and Lithuania reported the same. Except the Nether-lands, such a mandatory measure appears to be more commonly adopted by the new providers than those that are established (e.g. Norway and Sweden where no programme reported such a measure).
The survey results also point to a general tendency for Bachelor programmes to employ more interventionist measures to ensure a high level of English pro-ficiency among the teaching staff when compared with Master programmes. The largest discrepancy to this trend was found in Central East Europe where academic staff in Master programme received significantly more mandatory training (15% compared to 9% at Bachelor-level) and specific training tailored for their needs (40% compared to 21% at Bachelor level) than those in Bach-elor programmes. On country level, it was also found that some countries are more interventionist than others either by including English proficiency as a recruitment criterion or requesting academic staff to improve their English with mandatory courses. Among all, Belgium, the Netherlands, Hungary and Lithuania appear to be more interventionist than other countries (e.g. Spain, Switzerland) when it comes to language enhancement measures (Table III.8).
Although the lack of English proficiency of academic staff has been perceived as an issue in the offering of ETPs in non-English-speaking countries, the re-sults in this study suggest that this is a ‘non-issue’ because of the perceived high English standard of the academic staff involved in the teaching of such programmes (Table III.4) across the board. Spain is the only country where less than 90% of the Programme Directors rated the English of their aca-demic staff positively. Correspondingly, less than 10% of all Programme Di-rectors surveyed reported that there are consequences related to insufficient English proficiency of academic staff (Table III.9). Among all the countries compared, Denmark and Belgium are the strictest towards academic staff members who do not have a sufficient level of English, whereas Turkey and Lithuania reported a perfect satisfaction with the English proficiency of their academic staff and thus no problem to be dealt with. While potential bias of the responses cannot be ruled out, it is worth noting that these are also the four countries that are most likely to use English as a selection criterion for academic staff recruitment.

Part III – English in the classroom and beyond
113
Table III.7
Employment of specific means to ensure and/or enhance the English proficiency of academic staff involved in the ETPs – by region (%, multiple replies possible)
Region Total
Nordic Baltic Central West
Europe
Central East
Europe
South West
Europe
South East
Europe
No specific meansBachelor 6 15 13 15 7 33 14Master 38 30 20 26 33 31 28
English proficiency is an important selection criterion for the recruitment of new academic staffBachelor 81 62 71 60 79 67 69Master 33 44 58 56 36 63 47
Academic staff is encour-aged (optional) to improve their English language proficiency, where necessaryBachelor 77 69 50 49 71 27 57Master 45 37 51 47 49 31 48
Academic staff is required (mandatory) to improve their English language proficien-cy, where necessaryBachelor 23 31 42 9 14 7 19Master 3 7 18 15 7 13 11
The institution offers Eng-lish-language courses that are tailored to the needs of academic staffBachelor 45 31 38 21 21 20 30Master 30 22 33 40 15 6 28
Other means are employed
Bachelor 13 0 13 0 0 20 7Master 4 11 5 3 1 19 4
TotalBachelor 245 208 225 153 193 173 196Master 153 152 185 188 140 163 166
Count (n)Bachelor (31) (13) (24) (47) (14) (15) (144)Master (139) (27) (240) (72) (152) (16) (646)
Source: Programme Questionnaire Question 4.3: Does your programme/institution employ any specific means to ensure and/or enhance the English proficiency of academic staff involved in the English-Taught Programme(s)?
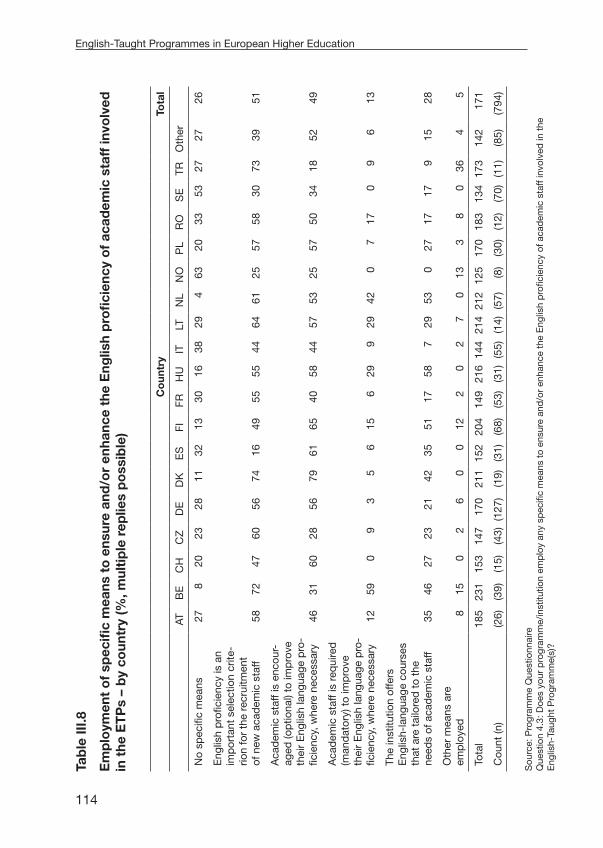
English-Taught Programmes in European Higher Education
114
Tab
le II
I.8
Em
plo
ymen
t o
f sp
ecifi
c m
eans
to
ens
ure
and
/or
enha
nce
the
Eng
lish
pro
fici
ency
of
acad
emic
sta
ff in
volv
ed
in t
he E
TP
s –
by
coun
try
(%, m
ulti
ple
rep
lies
po
ssib
le)
C
oun
try
Tota
l
ATB
EC
HC
ZD
ED
KE
SFI
FRH
UIT
LTN
LN
OP
LR
OS
ETR
Oth
er
No
spec
ific
mea
ns27
820
2328
1132
1330
1638
294
6320
3353
2727
26
Eng
lish
pro
ficie
ncy
is a
n im
por
tant
sel
ectio
n cr
ite-
rion
for
the
recr
uitm
ent
of
new
aca
dem
ic s
taff
5872
4760
5674
1649
5555
4464
6125
5758
3073
3951
Aca
dem
ic s
taff
is e
ncou
r-ag
ed (o
ptio
nal)
to im
pro
ve
thei
r E
nglis
h la
ngua
ge p
ro-
ficie
ncy,
whe
re n
eces
sary
4631
6028
5679
6165
4058
4457
5325
5750
3418
5249
Aca
dem
ic s
taff
is r
equi
red
(m
and
ator
y) t
o im
pro
ve
thei
r E
nglis
h la
ngua
ge p
ro-
ficie
ncy,
whe
re n
eces
sary
1259
09
35
615
629
929
420
717
09
613
The
inst
itutio
n of
fers
E
nglis
h-la
ngua
ge c
ours
es
that
are
tai
lore
d t
o th
e ne
eds
of a
cad
emic
sta
ff35
4627
2321
4235
5117
587
2953
027
1717
915
28
Oth
er m
eans
are
em
plo
yed
815
02
60
012
20
27
013
38
036
45
Tota
l18
523
115
314
717
021
115
220
414
921
614
421
421
212
517
018
313
417
314
217
1
Cou
nt (n
)(2
6)(3
9)(1
5)(4
3)(1
27)
(19)
(31)
(68)
(53)
(31)
(55)
(14)
(57)
(8)
(30)
(12)
(70)
(11)
(85)
(794
)
Sou
rce:
Pro
gram
me
Que
stio
nnai
re
Que
stio
n 4.
3: D
oes
your
pro
gram
me/
inst
itutio
n em
plo
y an
y sp
ecifi
c m
eans
to
ensu
re a
nd/o
r en
hanc
e th
e E
nglis
h p
rofic
ienc
y of
aca
dem
ic s
taff
invo
lved
in t
he
Eng
lish-
Taug
ht P
rogr
amm
e(s)
?

115
Part III – English in the classroom and beyond
Co
untr
yTo
tal
ATB
EC
HC
ZD
ED
KE
SFI
FRH
UIT
LTN
LN
OP
LR
OS
ETR
Oth
er
Not
rel
evan
t.
All
staf
f hav
e a
su
ffici
ent
pro
ficie
ncy
8179
8798
8878
8885
8293
8010
082
8893
8389
100
9287
No
cons
eque
nces
43
70
60
69
83
60
20
08
40
55
Sp
ecifi
c co
nseq
uenc
es15
187
26
226
610
315
016
137
87
04
8
Tota
l10
010
010
010
010
010
010
010
010
010
010
010
010
010
010
010
010
010
010
010
0
Cou
nt (n
)(2
6)(3
8)(1
5)(4
3)(1
28)
(18)
(32)
(68)
(50)
(30)
(54)
(14)
(57)
(8)
(30)
(12)
(71)
(12)
(85)
(791
)
Sou
rce:
Pro
gram
me
Que
stio
nnai
re
Que
stio
n 4.
4: If
aca
dem
ic s
taff
mem
ber
s in
volv
ed in
Eng
lish-
Lang
uage
-Tau
ght
Pro
gram
me(
s) d
o no
t ha
ve a
suf
ficie
nt le
vel o
f Eng
lish,
wha
t ar
e th
e co
nseq
uenc
es?
Tab
le II
I.9
Co
nseq
uenc
es, i
f ac
adem
ic s
taff
mem
ber
s in
volv
ed in
Eng
lish-
Lang
uag
e-Ta
ught
Pro
gra
mm
es d
o n
ot
have
a
suffi
cien
t le
vel o
f E
nglis
h –
by
coun
try
(%)

English-Taught Programmes in European Higher Education
116
3.3 Language support to administrative staff
As in the case of teachers involved in ETPs, a large majority of the programmes indicated that specific means are employed to ensure or to enhance the English proficiency of administrative staff members (see Table III.10). Eng-lish proficiency as an important selection criterion for the recruitment of new administrative staff was mentioned by 50% of the Programme Directors of Bachelor programmes and 43% of the Programme Directors of Master-level ETPs. Encouragement for administrative staff to improve their English lan-guage proficiency as an option plays often a role also (50% and 44%). About a third of the Programme Directors of Bachelor-level ETPs and a fifth of the Programme Directors of Master-level ETPs reported that English-language courses tailored to the needs of administrative staff are offered. Mandatory requirements for administrative staff to improve their English language profi-ciency on the other hand are rare (7% and 8%).
A comparison of answers by country (Table III.11) shows that English profi-ciency as an important selection criterion for the recruitment of new admin-istrative staff was mentioned most frequently by Programme Directors from Austria (62%), Czech Republic (62%), Hungary (61%), Switzerland (60%) and France (60%). In most countries, encouraging administrative staff to improve their English by optional means was frequently reported, except the Czech Republic where using English as a recruitment criterion is a predominant measure. Although mandatory measures to improve the English proficiency of administrative staff are rare, nearly one fifth of the programmes in the Neth-erlands, Romania and Italy reported to have requested their staff to under-take such training.
The Netherlands, amongst all countries compared, is the one that has placed the highest importance on the English proficiency of their administrative staff by tackling the problem from all directions (Table III.11). This does not come as a big surprise knowing that it is also the leading provider of ETPs in non-English-speaking countries with nearly 20% of the programmes taught in English and 61% of its institutions involved (Table I.4).
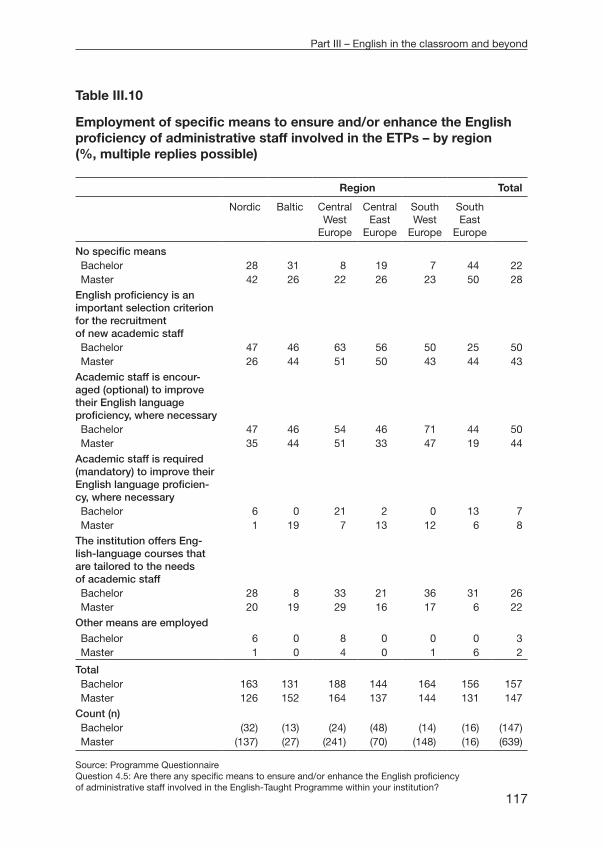
Part III – English in the classroom and beyond
117
Table III.10
Employment of specific means to ensure and/or enhance the English proficiency of administrative staff involved in the ETPs – by region (%, multiple replies possible)
Region Total
Nordic Baltic Central West
Europe
Central East
Europe
South West
Europe
South East
Europe
No specific meansBachelor 28 31 8 19 7 44 22Master 42 26 22 26 23 50 28
English proficiency is an important selection criterion for the recruitment of new academic staffBachelor 47 46 63 56 50 25 50Master 26 44 51 50 43 44 43
Academic staff is encour-aged (optional) to improve their English language proficiency, where necessaryBachelor 47 46 54 46 71 44 50Master 35 44 51 33 47 19 44
Academic staff is required (mandatory) to improve their English language proficien-cy, where necessaryBachelor 6 0 21 2 0 13 7Master 1 19 7 13 12 6 8
The institution offers Eng-lish-language courses that are tailored to the needs of academic staffBachelor 28 8 33 21 36 31 26Master 20 19 29 16 17 6 22
Other means are employed
Bachelor 6 0 8 0 0 0 3Master 1 0 4 0 1 6 2
TotalBachelor 163 131 188 144 164 156 157Master 126 152 164 137 144 131 147
Count (n)Bachelor (32) (13) (24) (48) (14) (16) (147)Master (137) (27) (241) (70) (148) (16) (639)
Source: Programme Questionnaire Question 4.5: Are there any specific means to ensure and/or enhance the English proficiency of administrative staff involved in the English-Taught Programme within your institution?
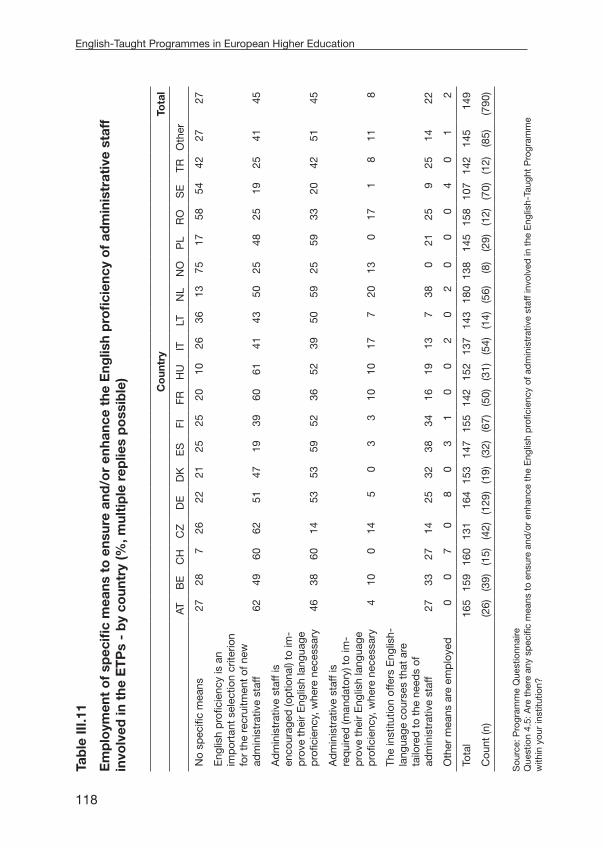
English-Taught Programmes in European Higher Education
118
Co
untr
yTo
tal
ATB
EC
HC
ZD
ED
KE
SFI
FRH
UIT
LTN
LN
OP
LR
OS
ETR
Oth
er
No
spec
ific
mea
ns27
287
2622
2125
2520
1026
3613
7517
5854
4227
27
Eng
lish
pro
ficie
ncy
is a
n im
por
tant
sel
ectio
n cr
iterio
n fo
r th
e re
crui
tmen
t of
new
ad
min
istr
ativ
e st
aff
6249
6062
5147
1939
6061
4143
5025
4825
1925
4145
Ad
min
istr
ativ
e st
aff i
s en
cour
aged
(op
tiona
l) to
im-
pro
ve t
heir
Eng
lish
lang
uage
p
rofic
ienc
y, w
here
nec
essa
ry46
3860
1453
5359
5236
5239
5059
2559
3320
4251
45
Ad
min
istr
ativ
e st
aff i
s re
qui
red
(man
dat
ory)
to
im-
pro
ve t
heir
Eng
lish
lang
uage
p
rofic
ienc
y, w
here
nec
essa
ry4
100
145
03
310
1017
720
130
171
811
8
The
inst
itutio
n of
fers
Eng
lish-
lang
uage
cou
rses
tha
t ar
e ta
ilore
d t
o th
e ne
eds
of
adm
inis
trat
ive
staf
f27
3327
1425
3238
3416
1913
738
021
259
2514
22
Oth
er m
eans
are
em
plo
yed
00
70
80
31
00
20
20
00
40
12
Tota
l16
515
916
013
116
415
314
715
514
215
213
714
318
013
814
515
810
714
214
514
9
Cou
nt (n
)(2
6)(3
9)(1
5)(4
2)(1
29)
(19)
(32)
(67)
(50)
(31)
(54)
(14)
(56)
(8)
(29)
(12)
(70)
(12)
(85)
(790
)
Sou
rce:
Pro
gram
me
Que
stio
nnai
re
Que
stio
n 4.
5: A
re t
here
any
sp
ecifi
c m
eans
to
ensu
re a
nd/o
r en
hanc
e th
e E
nglis
h p
rofic
ienc
y of
ad
min
istr
ativ
e st
aff i
nvol
ved
in t
he E
nglis
h-Ta
ught
Pro
gram
me
w
ithin
you
r in
stitu
tion?
Tab
le II
I.11
Em
plo
ymen
t o
f sp
ecifi
c m
eans
to
ens
ure
and
/or
enha
nce
the
Eng
lish
pro
fici
ency
of
adm
inis
trat
ive
staf
f in
volv
ed in
the
ET
Ps
- b
y co
untr
y (%
, mul
tip
le r
eplie
s p
oss
ible
)
119
Part IV – Impact of ETPs
Part IV – Impact of ETPs
Irina Ferencz (ACA), Friedhelm Maiworm (GES)
1 Impact on institutional policies and administrative procedures
Which wider effects did the introduction of teaching in English have on a higher education institution, on its different units, and on teachers and stu-dents? Is there any impact, be it of an expected or an unexpected sort? The Institutional Survey addressed the issue of impact that ETPs might have had since their introduction.
The most frequently mentioned effects are an improved international profile/awareness of the institutions (84%), the strengthening of cooperation with foreign partner universities/institutions (81%) and the improvement of assis-tance/guidance/advice for foreign students (71%) (Table IV.1). These were the top three perceived effects in all country groups and in the exact same order, with the exception of the Baltic states, in which the strengthening of cooperation with foreign partner universities/institutions ranks third (and not second, as in all other regions) (Table IV.2). Furthermore, as a result of ETPs, 56% of respondents declared to attribute higher importance to marketing and promotion in general, as well as to the “targeted recruitment of students” in particular (54%) (Table IV.1). Further effects are the increased offers for English language training (51%) and a higher flexibility in the admission of foreign students (50%).
As Table IV.1 further shows, the perceived effects do vary by type of institu-tion. Institutional Coordinators from institutions awarding as highest degree a PhD stated more often a higher flexibility in the admission of foreign students and more targeted recruitment of students as an impact of running ETPs compared to institutions awarding only Master or Bachelor degrees. At the same time, ETPs have led to much a lesser extent more targeted recruitment of students in institutions awarding up to a Master degree, compared to insti-tutions awarding a Bachelor and a PhD as highest degrees.
Co
untr
yTo
tal
ATB
EC
HC
ZD
ED
KE
SFI
FRH
UIT
LTN
LN
OP
LR
OS
ETR
Oth
er
No
spec
ific
mea
ns27
287
2622
2125
2520
1026
3613
7517
5854
4227
27
Eng
lish
pro
ficie
ncy
is a
n im
por
tant
sel
ectio
n cr
iterio
n fo
r th
e re
crui
tmen
t of
new
ad
min
istr
ativ
e st
aff
6249
6062
5147
1939
6061
4143
5025
4825
1925
4145
Ad
min
istr
ativ
e st
aff i
s en
cour
aged
(op
tiona
l) to
im-
pro
ve t
heir
Eng
lish
lang
uage
p
rofic
ienc
y, w
here
nec
essa
ry46
3860
1453
5359
5236
5239
5059
2559
3320
4251
45
Ad
min
istr
ativ
e st
aff i
s re
qui
red
(man
dat
ory)
to
im-
pro
ve t
heir
Eng
lish
lang
uage
p
rofic
ienc
y, w
here
nec
essa
ry4
100
145
03
310
1017
720
130
171
811
8
The
inst
itutio
n of
fers
Eng
lish-
lang
uage
cou
rses
tha
t ar
e ta
ilore
d t
o th
e ne
eds
of
adm
inis
trat
ive
staf
f27
3327
1425
3238
3416
1913
738
021
259
2514
22
Oth
er m
eans
are
em
plo
yed
00
70
80
31
00
20
20
00
40
12
Tota
l16
515
916
013
116
415
314
715
514
215
213
714
318
013
814
515
810
714
214
514
9
Cou
nt (n
)(2
6)(3
9)(1
5)(4
2)(1
29)
(19)
(32)
(67)
(50)
(31)
(54)
(14)
(56)
(8)
(29)
(12)
(70)
(12)
(85)
(790
)
Sou
rce:
Pro
gram
me
Que
stio
nnai
re
Que
stio
n 4.
5: A
re t
here
any
sp
ecifi
c m
eans
to
ensu
re a
nd/o
r en
hanc
e th
e E
nglis
h p
rofic
ienc
y of
ad
min
istr
ativ
e st
aff i
nvol
ved
in t
he E
nglis
h-Ta
ught
Pro
gram
me
w
ithin
you
r in
stitu
tion?
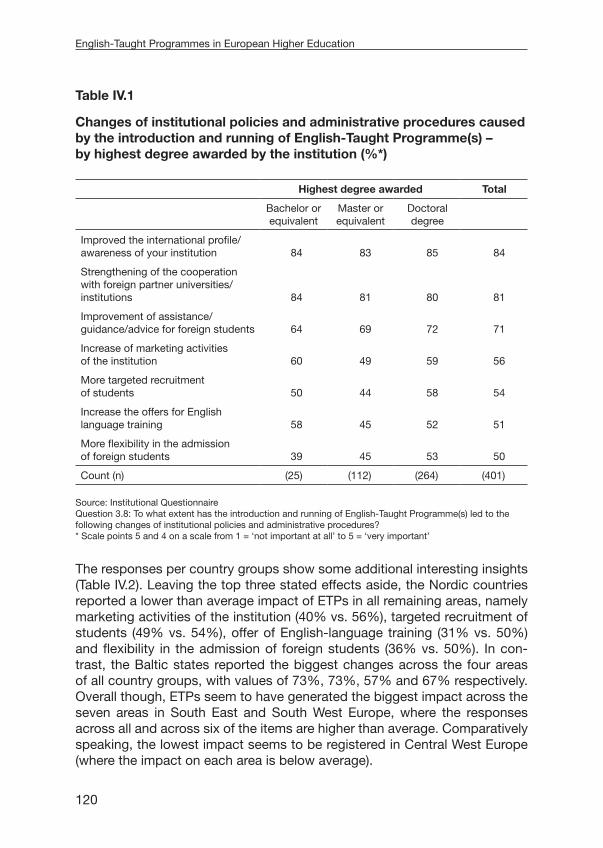
English-Taught Programmes in European Higher Education
120
Table IV.1
Changes of institutional policies and administrative procedures caused by the introduction and running of English-Taught Programme(s) – by highest degree awarded by the institution (%*)
Highest degree awarded Total
Bachelor or equivalent
Master or equivalent
Doctoral degree
Improved the international profile/awareness of your institution 84 83 85 84
Strengthening of the cooperation with foreign partner universities/institutions 84 81 80 81
Improvement of assistance/ guidance/advice for foreign students 64 69 72 71
Increase of marketing activities of the institution 60 49 59 56
More targeted recruitment of students 50 44 58 54
Increase the offers for English language training 58 45 52 51
More flexibility in the admission of foreign students 39 45 53 50
Count (n) (25) (112) (264) (401)
Source: Institutional Questionnaire Question 3.8: To what extent has the introduction and running of English-Taught Programme(s) led to the following changes of institutional policies and administrative procedures? * Scale points 5 and 4 on a scale from 1 = ‘not important at all’ to 5 = ‘very important’
The responses per country groups show some additional interesting insights (Table IV.2). Leaving the top three stated effects aside, the Nordic countries reported a lower than average impact of ETPs in all remaining areas, namely marketing activities of the institution (40% vs. 56%), targeted recruitment of students (49% vs. 54%), offer of English-language training (31% vs. 50%) and flexibility in the admission of foreign students (36% vs. 50%). In con-trast, the Baltic states reported the biggest changes across the four areas of all country groups, with values of 73%, 73%, 57% and 67% respectively. Overall though, ETPs seem to have generated the biggest impact across the seven areas in South East and South West Europe, where the responses across all and across six of the items are higher than average. Comparatively speaking, the lowest impact seems to be registered in Central West Europe (where the impact on each area is below average).

Part IV – Impact of ETPs
121
Table IV.2
Changes of institutional policies and administrative procedures caused by the introduction and running of English-Taught Programme(s) – by region (%*)
Region Total
Nordic Baltic Central West
Europe
Central East
Europe
South Wes
Europe
South East
Europe
Improved the international profile/awareness of your institution 87 82 82 80 90 88 84
Strengthening of the cooperation with foreign partner universities/ institutions 83 73 77 80 83 88 81
Improvement of assis-tance/guidance/advice for foreign students 71 77 69 73 66 71 70
Increase of marketing activities of the institution 40 73 50 68 58 64 56
More targeted recruitment of students 49 73 43 57 60 64 54
Increase the offers for English language training 31 57 41 65 53 71 50
More flexibility in the admission of foreign students 36 67 37 60 57 66 50
Count (n) (68) (22) (111) (81) (77) (42) (401)
Source: Institutional Questionnaire Question 3.8: To what extent has the introduction and running of English-Taught Programme(s) led to the following changes of institutional policies and administrative procedures?* Scale points 5 and 4 on a scale from 1 = ‘not important at all’ to 5 = ‘very important’
Some clear differences were observed also between individual countries, not only between different regions, when it comes to reported effects of ETPs (see Table IV.3). Overall, the biggest effects were stated by Institutional Co-ordinators from Bulgaria, France, Hungary, Latvia, the Netherlands, Poland, Romania, Slovakia and Turkey, while the impact of ETPs was clearly below the average in Austria, Switzerland and Norway. It is still a question though if indeed the effects were bigger in the first group of countries, or whether one of the two following situations occurred: the respondents from the first group were more prone to make more positive assessments than respondents in

English-Taught Programmes in European Higher Education
122
the second group or rather that the effects, while felt in the second group of countries were not necessarily the result of ETPs, but of other factors.
A high impact with respect to single aspects (reported by at least two thirds of respondents) could be observed in specific countries, as follows:
– Improved international profile/awareness of the institution: The Netherlands (100%), Denmark (94%), Sweden (92%) and France (90%).
– Strengthening of the cooperation with foreign partner universities/institu-tions: Switzerland (100%), Denmark (94%) and Belgium (91%).
– Improvement of assistance/guidance/advice for foreign students: Sweden (83%), Belgium (82%) and the Netherlands (82%).
– Increase of marketing activities of the institution: Lithuania (77%), the Neth-erlands (75%), Hungary (73%) and France (72%).
– More targeted recruitment of students: Sweden (85%), the Netherlands (75%) and France (74%).
– Increase the offers for English language training: Romania (78%), Turkey (74%) and Poland (70%).
– More flexibility in the admission of foreign students: France (68%), Lithuania (67%) and Romania (67%).
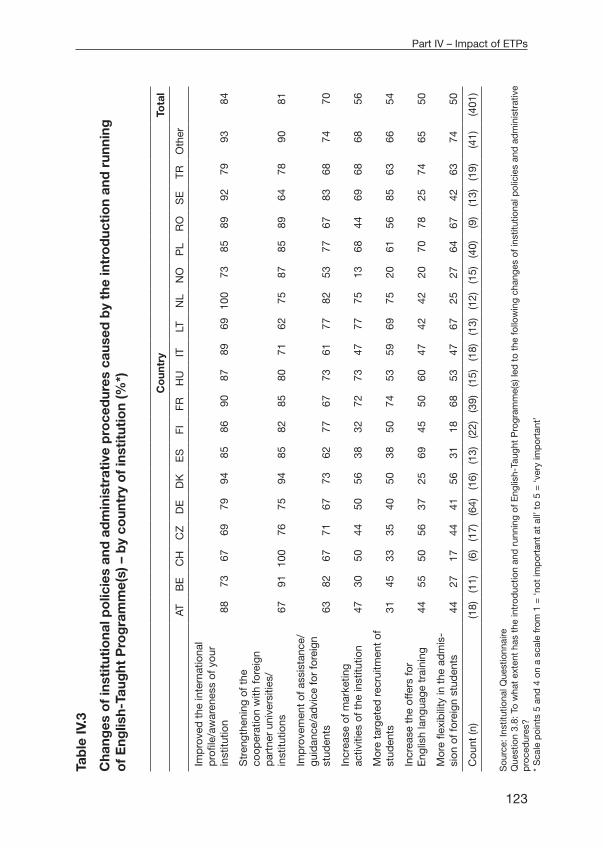
123
Part IV – Impact of ETPs
Co
untr
yTo
tal
ATB
EC
HC
ZD
ED
KE
SFI
FRH
UIT
LTN
LN
OP
LR
OS
ETR
Oth
er
Imp
rove
d t
he in
tern
atio
nal
pro
file/
awar
enes
s of
you
r in
stitu
tion
8873
6769
7994
8586
9087
8969
100
7385
8992
7993
84
Str
engt
heni
ng o
f the
co
oper
atio
n w
ith fo
reig
n p
artn
er u
nive
rsiti
es/
inst
itutio
ns67
9110
076
7594
8582
8580
7162
7587
8589
6478
9081
Imp
rove
men
t of
ass
ista
nce/
guid
ance
/ad
vice
for
fore
ign
stud
ents
6382
6771
6773
6277
6773
6177
8253
7767
8368
7470
Incr
ease
of m
arke
ting
activ
ities
of t
he in
stitu
tion
4730
5044
5056
3832
7273
4777
7513
6844
6968
6856
Mor
e ta
rget
ed r
ecru
itmen
t of
st
uden
ts31
4533
3540
5038
5074
5359
6975
2061
5685
6366
54
Incr
ease
the
offe
rs fo
r E
nglis
h la
ngua
ge t
rain
ing
4455
5056
3725
6945
5060
4742
4220
7078
2574
6550
Mor
e fle
xib
ility
in t
he a
dm
is-
sion
of f
orei
gn s
tud
ents
4427
1744
4156
3118
6853
4767
2527
6467
4263
7450
Cou
nt (n
)(1
8)(1
1)(6
)(1
7)(6
4)(1
6)(1
3)(2
2)(3
9)(1
5)(1
8)(1
3)(1
2)(1
5)(4
0)(9
)(1
3)(1
9)(4
1)(4
01)
Sou
rce:
Inst
itutio
nal Q
uest
ionn
aire
Q
uest
ion
3.8:
To
wha
t ex
tent
has
the
intr
oduc
tion
and
run
ning
of E
nglis
h-Ta
ught
Pro
gram
me(
s) le
d t
o th
e fo
llow
ing
chan
ges
of in
stitu
tiona
l pol
icie
s an
d a
dm
inis
trat
ive
p
roce
dur
es?
* S
cale
poi
nts
5 an
d 4
on
a sc
ale
from
1 =
‘not
imp
orta
nt a
t al
l’ to
5 =
‘ver
y im
por
tant
’
Tab
le IV
.3
Cha
nges
of
inst
itut
iona
l po
licie
s an
d a
dm
inis
trat
ive
pro
ced
ures
cau
sed
by
the
intr
od
ucti
on
and
run
ning
o
f E
nglis
h-Ta
ught
Pro
gra
mm
e(s)
– b
y co
untr
y o
f in
stit
utio
n (%
*)

English-Taught Programmes in European Higher Education
124
2 Benefits of ETPs
The Programme Directors were asked, through an open question, which they thought the main benefits of ETPs were, in comparison with study pro-grammes taught in the domestic language, for the participating students and for the institution as a whole.
Concerning the benefits of ETPs for students, the most often cited ones can be grouped in the following categories:
– Improve the mastery of the English language, which is perceived by many Programme Directors as an essential element for students to be more suc-cessful in their future career. In some disciplines, like Computer Science this is a must, as the core terminology is already in English.
– Closer interaction with teachers – because of the in general smaller teach-er-student ratio, students in ETPs benefit from closer guidance from their teachers, which enhances the quality of their education.
– More mobility opportunities – ETPs enable the creation of more structured mobility arrangements with specific international partners, that ETP stu-dents can take advantage of.
– Good preparation for working in an international and intercultural environ-ment – because of their more international nature (multinational student body, curriculum integrating international elements, etc.). ETPs offer a bet-ter preparation for students to work on the international labour market.
– Higher employability – again, related to the international nature of ETPs, the ensuing degree gives better access to the labour market by opening more possibilities than graduates from domestic language programmes actually have. The Programme Directors also believed that an ETP degree is per-ceived as more valuable by potential employers.
– Better networking – thanks to the multinational composition of the student body in ETPs, students (that are often mature students, especially at Master level) establish contacts with classmates from other countries, which they could later resort to also for professional purposes.
The Programme Directors mentioned some other benefits, also for their in-stitutions, in additions to the elements that were mentioned above under Im-pact, namely:
– ETPs are seen by some as an important means to increase the quality of the educational offer, as they enable institutions to “attract” or recruit bet-ter qualified staff and students. Through ETPs, institutions gain access to a global pool of talent that they can select from.
Part IV – Impact of ETPs
125
– ETPs are also praised for helping institutions and the study programmes in question to build an international network of partner universities, pro-grammes, partner companies and international alumni, and thus develop closer relations and ties with “externals” that are perceived as beneficial.
3 ETPs and the development of student support services in English
One of the impact areas mentioned above in Tables IV.1-3 is the improve-ment of assistance/guidance/advice for foreign students. An important item that fits under this broader category is the provision of relevant documents and information in English. Although the Institutional Coordinators were not explicitly asked if the provision of such materials was the result of the intro-duction of ETPs, it could be expected that the respective developments are at least in part influenced by the ETPs. Overall, the majority of institutions (approx. 85%) stated an availability of at least some relevant documents in English (Table IV.4). Quite surprisingly though, according to the results there also seem to be ETPs for which no information is provided in English. Un-less the respective programmes targeted exclusively domestic students or students that spoke the domestic language, we would find such cases quite surprising.
The information most frequently offered in English is on admission require-ments and application procedures (84%), on the study programme itself (83%) and on orientation and welcoming services (80%). This is not surprising though, given that this is the core information needed by students before they decide to apply for a specific study programme. In contrast, less than half of Institutional Coordinators reported to provide information on academic/psy-chological counselling services, student representation regulations or career and alumni services in English. In many cases though, the lower values might be due to either the fact that such services are not open to foreign students studying in ETPs (e.g. student representation) or that the institutions in ques-tion do not offer such services to begin with (e.g. career and alumni services).
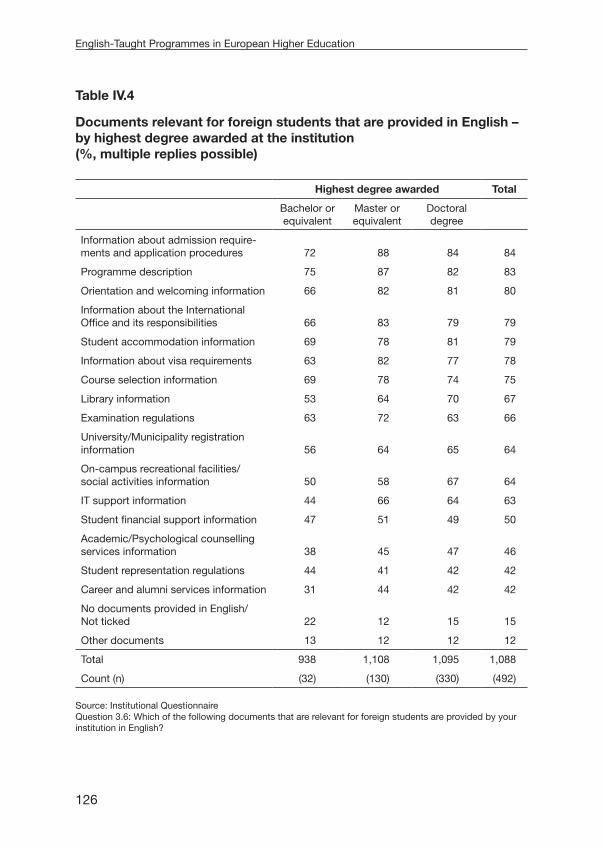
English-Taught Programmes in European Higher Education
126
Table IV.4
Documents relevant for foreign students that are provided in English – by highest degree awarded at the institution (%, multiple replies possible)
Highest degree awarded Total
Bachelor or equivalent
Master or equivalent
Doctoral degree
Information about admission require-ments and application procedures 72 88 84 84
Programme description 75 87 82 83
Orientation and welcoming information 66 82 81 80
Information about the International Office and its responsibilities 66 83 79 79
Student accommodation information 69 78 81 79
Information about visa requirements 63 82 77 78
Course selection information 69 78 74 75
Library information 53 64 70 67
Examination regulations 63 72 63 66
University/Municipality registration information 56 64 65 64
On-campus recreational facilities/ social activities information 50 58 67 64
IT support information 44 66 64 63
Student financial support information 47 51 49 50
Academic/Psychological counselling services information 38 45 47 46
Student representation regulations 44 41 42 42
Career and alumni services information 31 44 42 42
No documents provided in English/ Not ticked 22 12 15 15
Other documents 13 12 12 12
Total 938 1,108 1,095 1,088
Count (n) (32) (130) (330) (492)
Source: Institutional Questionnaire Question 3.6: Which of the following documents that are relevant for foreign students are provided by your institution in English?
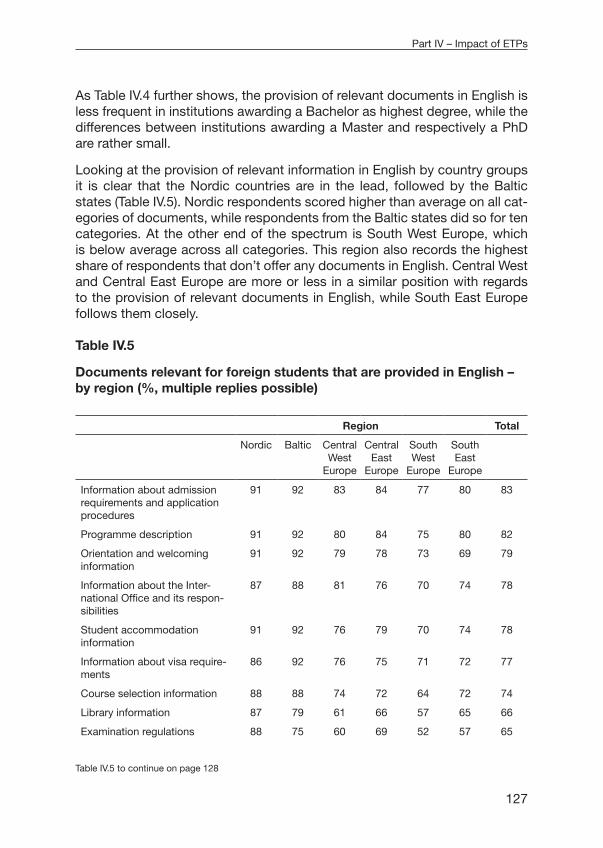
127
Part IV – Impact of ETPs
As Table IV.4 further shows, the provision of relevant documents in English is less frequent in institutions awarding a Bachelor as highest degree, while the differences between institutions awarding a Master and respectively a PhD are rather small.
Looking at the provision of relevant information in English by country groups it is clear that the Nordic countries are in the lead, followed by the Baltic states (Table IV.5). Nordic respondents scored higher than average on all cat-egories of documents, while respondents from the Baltic states did so for ten categories. At the other end of the spectrum is South West Europe, which is below average across all categories. This region also records the highest share of respondents that don’t offer any documents in English. Central West and Central East Europe are more or less in a similar position with regards to the provision of relevant documents in English, while South East Europe follows them closely.
Table IV.5
Documents relevant for foreign students that are provided in English – by region (%, multiple replies possible)
Region Total
Nordic Baltic Central West
Europe
Central East
Europe
South West
Europe
South East
Europe
Information about admission requirements and application procedures
91 92 83 84 77 80 83
Programme description 91 92 80 84 75 80 82
Orientation and welcoming information
91 92 79 78 73 69 79
Information about the Inter- national Office and its respon-sibilities
87 88 81 76 70 74 78
Student accommodation information
91 92 76 79 70 74 78
Information about visa require-ments
86 92 76 75 71 72 77
Course selection information 88 88 74 72 64 72 74
Library information 87 79 61 66 57 65 66
Examination regulations 88 75 60 69 52 57 65
Table IV.5 to continue on page 128

English-Taught Programmes in European Higher Education
128
Region Total
Nordic Baltic Central West
Europe
Central East
Europe
South West
Europe
South East
Europe
University/Municipality registration information
83 54 66 58 51 63 63
On-campus recreational facili-ties/social activities information
79 58 58 62 62 59 63
IT support information 88 67 58 57 56 59 63
Student financial support information
65 33 53 40 42 50 49
Academic/Psychological coun-selling services information
78 42 49 27 35 44 45
Student representation regula-tions
69 42 38 35 29 46 41
Career and alumni services information
62 42 42 32 36 37 41
No documents provided in English/Not ticked
9 8 17 15 21 19 16
Other documents 16 17 13 8 13 11 12
Total 1,425 1,213 1,107 1,068 1,001 1,074 1,128
Count (n) (77) (24) (144) (95) (104) (54) (498)
Source: Institutional Questionnaire Question 3.6: Which of the following documents that are relevant for foreign students are provided by your institution in English?
When it comes to ETPs in individual countries (Table IV.6), the sampled pro-grammes in Lithuania stand out, as they offer all information (100%) related to admission requirements and application procedures, programme descrip-tion, orientation and welcoming, student accommodation, the international office and visa requirements in English. So do the Belgian ETPs covered by the study, when it comes to information about admission requirements and application procedures and orientation and welcoming, as well as the Ital-ian programmes, but on admission requirements and application procedures only. Based on the number of categories on which each country is positioned above average and the size of the respective shares, the five countries of-fering most complete information in English across the dimensions covered in Table IV.6 are Denmark, Finland, Norway, Lithuania and Sweden. On the other side, about one third of the ETPs covered in the study from Switzerland, France and the Netherlands offer no documents in English.
See previous page
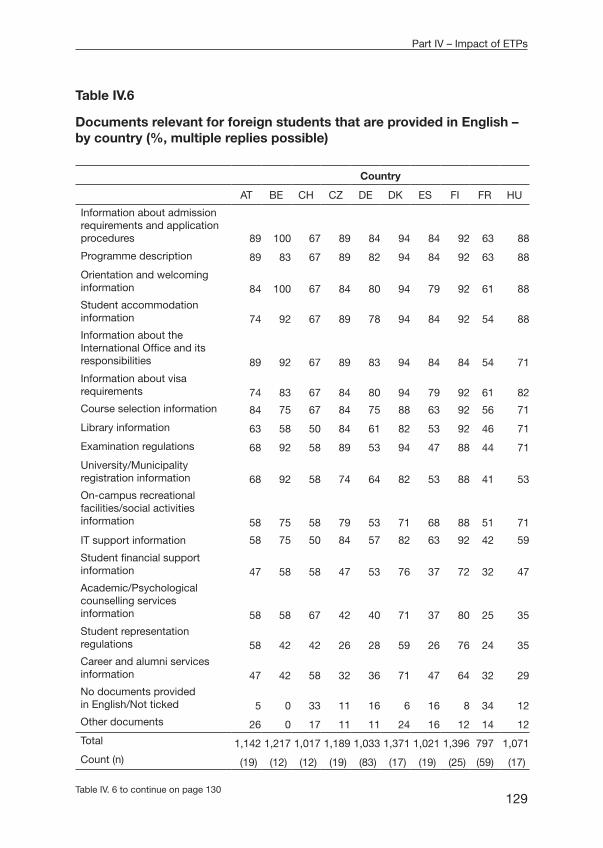
Part IV – Impact of ETPs
129
Country
AT BE CH CZ DE DK ES FI FR HU
Information about admission requirements and application procedures 89 100 67 89 84 94 84 92 63 88
Programme description 89 83 67 89 82 94 84 92 63 88
Orientation and welcoming information 84 100 67 84 80 94 79 92 61 88
Student accommodation information 74 92 67 89 78 94 84 92 54 88
Information about the International Office and its responsibilities 89 92 67 89 83 94 84 84 54 71
Information about visa requirements 74 83 67 84 80 94 79 92 61 82
Course selection information 84 75 67 84 75 88 63 92 56 71
Library information 63 58 50 84 61 82 53 92 46 71
Examination regulations 68 92 58 89 53 94 47 88 44 71
University/Municipality registration information 68 92 58 74 64 82 53 88 41 53
On-campus recreational facilities/social activities information 58 75 58 79 53 71 68 88 51 71
IT support information 58 75 50 84 57 82 63 92 42 59
Student financial support information 47 58 58 47 53 76 37 72 32 47
Academic/Psychological counselling services information 58 58 67 42 40 71 37 80 25 35
Student representation regulations 58 42 42 26 28 59 26 76 24 35
Career and alumni services information 47 42 58 32 36 71 47 64 32 29
No documents provided in English/Not ticked 5 0 33 11 16 6 16 8 34 12
Other documents 26 0 17 11 11 24 16 12 14 12
Total 1,142 1,217 1,017 1,189 1,033 1,371 1,021 1,396 797 1,071
Count (n) (19) (12) (12) (19) (83) (17) (19) (25) (59) (17)
Table IV.6
Documents relevant for foreign students that are provided in English – by country (%, multiple replies possible)
Table IV. 6 to continue on page 130
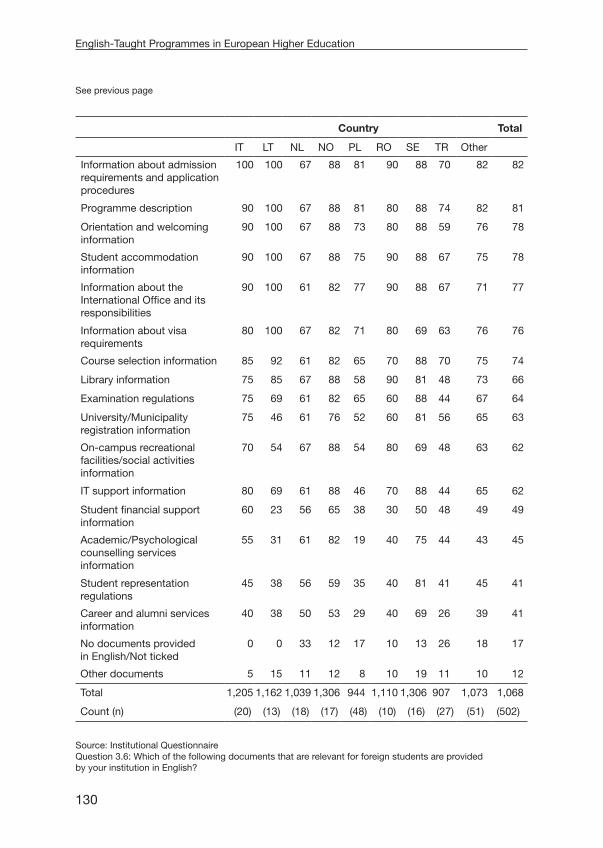
English-Taught Programmes in European Higher Education
130
See previous page
Country Total
IT LT NL NO PL RO SE TR Other
Information about admission requirements and application procedures
100 100 67 88 81 90 88 70 82 82
Programme description 90 100 67 88 81 80 88 74 82 81
Orientation and welcoming information
90 100 67 88 73 80 88 59 76 78
Student accommodation information
90 100 67 88 75 90 88 67 75 78
Information about the International Office and its responsibilities
90 100 61 82 77 90 88 67 71 77
Information about visa requirements
80 100 67 82 71 80 69 63 76 76
Course selection information 85 92 61 82 65 70 88 70 75 74
Library information 75 85 67 88 58 90 81 48 73 66
Examination regulations 75 69 61 82 65 60 88 44 67 64
University/Municipality registration information
75 46 61 76 52 60 81 56 65 63
On-campus recreational facilities/social activities information
70 54 67 88 54 80 69 48 63 62
IT support information 80 69 61 88 46 70 88 44 65 62
Student financial support information
60 23 56 65 38 30 50 48 49 49
Academic/Psychological counselling services information
55 31 61 82 19 40 75 44 43 45
Student representation regulations
45 38 56 59 35 40 81 41 45 41
Career and alumni services information
40 38 50 53 29 40 69 26 39 41
No documents provided in English/Not ticked
0 0 33 12 17 10 13 26 18 17
Other documents 5 15 11 12 8 10 19 11 10 12
Total 1,205 1,162 1,039 1,306 944 1,110 1,306 907 1,073 1,068
Count (n) (20) (13) (18) (17) (48) (10) (16) (27) (51) (502)
Source: Institutional Questionnaire Question 3.6: Which of the following documents that are relevant for foreign students are provided by your institution in English?

131
Postscript
Postscript
Bernd Wächter (ACA)
Many of the results of this study could have been anticipated, and therefore came as no surprise. Others were indeed unexpected.
What the authors had expected was that the number of universities and col-leges offering ETPs would be considerably beyond those of our last (2007) surveys, and that the overall number of ETPs on offer across Europe would likewise have risen substantially. What none of us had expected was that the increase would be as steep as it turned out to be. In the year 2001, we had identified slightly over 700 programmes. In 2007, this number had more than trebled, to almost 2,400. In the 2014 exercise, we found over 8,000 ETPs. This looks like sensational growth and, indeed, it is. The numbers of 2001, 2007 and 2014 are, however, not easily comparable. In 2001, our only sources of identification of ETPs were our surveys. In 2007, quite a number of countries already had online databases, which we of course also used for the identification of ETPs. In 2014, we had the advantage of the existence of StudyPortals and its Europe-wide database of English-medium programmes. However, all of this casts little doubt on the validity of the 2014 figures. It rather makes us conjecture that the numbers in our earlier studies were an underrepresentation of the ETPs offered at the time.
Does that mean that ETPs are no longer a marginal phenomenon, as we concluded in 2001, and quite a modest one, as we felt in 2007? It does and it does not. The number of programmes has risen steeply. ETPs now make up nearly six percent of all programmes across Europe. But the share of students enrolled in ETPs of all students in the system remains very low, at 1.3%. By the measure of enrolment, ETPs are marginal still today.
European averages are, of course, somewhat treacherous. For ETPs remain very unevenly distributed over countries. The Alps still are an ‘ETP water-shed’, as we put it in our earlier publications. The ETP leaders remain the Netherlands together with Europe’s Nordic countries. We were surprised by the Baltic countries, who are the ‘runners up’ in the present publication, and who played no major role in our earlier studies. Germany, France and Central West Europe are in midfield. In the southern parts of Europe ETPs are few and far between - with the exception of Cyprus.
Are we likely to see further growth at the rate of the past? There are some indications that growth has passed its peak. In this study, we found declin-ing growth rates since the years 2009 and 2010. In order not to be misun-derstood: we are here not talking of declining numbers of ETPs, but of less

English-Taught Programmes in European Higher Education
132
steep annual increases. If this will develop into a medium- or long-term trend is difficult to predict. We intend to revisit the European ETP landscape before 2020 once again.
In our last study, we concluded that the very heated and often highly ideologi-cal debates about the quality of English of both teaching staff and students were over and that English-medium instruction had become a no longer ex-otic and therefore normal feature of Europe’s higher education systems. With a sigh of relief, we felt there was “normalcy, at last”. Were we right? It is not clear at all. On the one hand, the warnings that the quality of teaching and learning in ETPs will necessarily be lower than that in the native language due to an insufficient command of English of all parties have not fully dis-appeared. Nor are worries no longer voiced that teaching in English would lead to a large number of languages disappearing as a means of scientific expression. On the other hand, administrative staff at central university level and Programme Directors ‘on the ground’ have in none of our earlier studies perceived fewer problems with the mastery of English by students (domestic as well as foreign) and teaching staff alike. What came as a slight surprise was that the central-level administrators saw more of these problems than the Programme Directors. But in both cases, the extent of the problems iden-tified was small.
How can we explain the fact that the quality debate about ETPs goes on while those closely involved in ETPs see hardly any problems at all? We do not have an absolutely watertight answer to this question. But we believe that expectations vis-à-vis the necessary degree of the mastery of English differ between those actually involved the delivery of ETPs and those dealing with language issues and policies in general, and multilingualism in particular. Both ‘camps’ could probably agree that there remains room for improvement in the ‘ETP classroom’, to put it in a diplomatic way. But the practitioners on the ground appear to have developed a higher degree of ‘language pain toler-ance’ and an acknowledgement of the fact that, whenever non-native speak-ers interact, some concessions on the beauty of expression have to be made.

133
What is ACA?
What is ACA?
Founded in 1993, the Academic Cooperation Association (ACA) is a not-for-profit pan-European network of major organisations responsible in their countries for the promotion of internationalisation in education and training. Current membership is comprised of 29 such organisations in 18 European countries, as well as associate members from the Americas, Canada and Australia. ACA’s secretariat is located in Brussels, Belgium, in easy reach of the European institutions.
ACA is active in the following fields
♦ The promotion of innovation and internationalisation in (higher) education and training;
♦ The enhancement of contacts, networking and cooperation between its members and third parties;
♦ The provision of fast and up-to-date information on important develop-ments in the European institutions and international organisations via the monthly ACA Newsletter – Education Europe, regularly held seminars and an annual conference;
♦ Research into and publications on internationalisation in education and training;
♦ The provision of know-how and expertise in the management of interna-tional cooperation projects and programmes;
♦ Contract work for third parties.
Academic Cooperation Association (ACA)15, rue d’EgmontstraatB-1000 Brusselsphone: +32 2 513 22 41fax: +32 2 513 17 76e-mail: [email protected]: www.aca-secretariat.be

English-Taught Programmes in European Higher Education
134

135
ACA Papers
ACA Papers on International Cooperation in Education
All pdf files for free (open access) – please go to: www.lemmens.de or www.aca-secretariat.be
Queenie K.H. Lam, Danja Oste with Irina Ferencz and Bernd Wächter Portable state grants and loans: An overview and their contribution to outgoing student mobility Bonn: Lemmens 2013 ISBN 978-3-86856-011-4 Paperback: € 29.80, pdf file (open access)
Irina Ferencz Kristina Hauschildt and Irma Garam (eds.) Mobility Windows From Concept to Practice Bonn: Lemmens 2013 ISBN 978-3-86856-009-1 Paperback: € 29.80, pdf file (open access)
Bernd Wächter, Queenie K.H. Lam, Irina Ferencz (eds.) Tying it all together Excellence, mobility, funding and the social dimension in higher education Bonn: Lemmens 2012 ISBN 978-3-86856-006-0 Paperback: € 29.80, pdf file (open access)
Irina Ferencz, Bernd Wächter (eds.) European and national policies for academic mobility Bonn: Lemmens 2012 ISBN 978-3-86856-005-3 Paperback: € 29.80, pdf file (open access)
Maria Kelo, Tim Rogers with Laura E. Rumbley International Student Support in European Higher Education.Needs, Solutions, and Challenges Bonn: Lemmens 2010 ISBN 978-3-932306-99-0 Paperback: € 29.80, pdf file (open access)
Kerstin Janson, Harald Schomburg, Ulrich Teichler The Professional Value of ERASMUS Mobility.The Impact of International Experience on Former Students’ and on Teachers’ Careers Bonn: Lemmens 2009 ISBN 978-3-932306-96-9Paperback: € 29.80, pdf file (open access)

English-Taught Programmes in European Higher Education
136
Maria Kelo (ed.) Beyond 2010. Priorities and challenges for higher education in the next decade Bonn: Lemmens 2008 ISBN 978-3-932306-92-1Paperback: € 29.80, pdf file (open access)
Bernd Wächter & Friedhelm MaiwormEnglish-Taught, Programmes in European Higher Education. The Picture in 2007 Bonn: Lemmens 2008 ISBN 978-3-932306-89-1Paperback: € 24.80, pdf file (open access)
Maria Kelo Support for International Students in Higher Education. Practice and Principles Bonn: Lemmens 2006 ISBN 3-932306-82-1Paperback: € 25.00, pdf file (open access)
Maria Kelo (ed.) The Future of the University. Translating Lisbon into Practice Bonn: Lemmens 2006 ISBN 3-932306-78-3(out of print), pdf file (open access)
Maria Kelo, Ulrich Teichler, Bernd Wächter (eds.) EURODATA. Student mobility in European higher education Bonn: Lemmens 2006 ISBN 3-932306-72-4 (out of print), pdf file (open access)0
Jeroen Huisman, Marijk van der Wende (eds.) On Cooperation and Competition II.Institutional Responses to Internationalisation, Europeanisation and Globalisation Bonn: Lemmens 2005 ISBN 3-932306-68-6Paperback: € 30.00, pdf file (open access)0
Franziska Muche (ed.) Opening up to the Wider World. The External Dimension of the Bologna Process Bonn: Lemmens 2005 ISBN 3-932306-67-8Paperback: € 24.80, pdf file (open access)
137
ACA Papers
Franziska Muche, Maria Kelo, Bernd Wächter The Admission of International Students into Higher Education. Policies and InstrumentsBonn: Lemmens 2004 ISBN 3-932306-62-7 Paperback: € 24.80,pdf file (open access)
Bernd Wächter (ed.) Higher Education in a Changing Environment. Internationalisation of Higher Education Policy in Europe Bonn: Lemmens 2004 ISBN 3-932306-55-4 (out of print), pdf file (open access)
Marijk van der Wende, Jeroen Huismann (eds.) On Cooperation and Competition. National and European Policies for the Internationalisation of Higher Education Bonn: Lemmens 2004 ISBN 3-932306-54-6Paperback: € 30.00, pdf file (open access)
Friedhelm Maiworm, Bernd Wächter (eds.) English-Language-Taught Degree Programmes in European Higher Education.Trends and Success Factors Bonn: Lemmens 2002 ISBN 3-932306-47-3Paperback: € 19.80, pdf file (open access)
Ulrich Teichler (ed.) ERASMUS in the SOCRATES Programme. Findings of an Evaluation Study Bonn: Lemmens 2002 ISBN 3-932306-41-4 Paperback: € 19.80, pdf file (open access)
Bernd Wächter (ed.) The Virtual Challenge to International Cooperation in Higher Education. A Project of the Academic Cooperation Association Bonn: Lemmens 2002 ISBN 3-932306-40-6Paperback: € 19.80, pdf file (open access)
Bernd Wächter (ed.) Handbook of European Associations in Higher Education. A Practical Guide to Academic Networks in Europe and Beyond Bonn: Lemmens 2000 ISBN 3-932306-37-6Paperback: € 31.00, pdf file (open access)
English-Taught Programmes in European Higher Education
138
Bernd Wächter (ed.) Internationalisation in European Non-University Higher Education. A Project of the Academic Cooperation Association Bonn: Lemmens 1999 ISBN 3-932306-35-X(out of print), pdf file (open access)
Bernd Wächter (ed.) Internationalisation in Higher Education. A Paper and Seven Essays on International Cooperation in the Tertiary Sector Bonn: Lemmens 1999 ISBN 3-932306-33-3 (out of print), pdf file (open access)
Lemmens Medien GmbHMatthias-Grünewald-Straße 1-3 · D-53175 Bonn, Germanyphone: +49 228 4 21 37-0 · fax: +49 228 4 21 37-29e-mail: [email protected] · www.lemmens.de


This is the third study on English-medium instruction of the Academic Cooperation Association (ACA). Like its predecessors, this report maps the provision of English-taught Bachelor and Master programmes in non-English-speaking European countries. Using the results of its predecessor publications as historical references, the present study is able to trace the quantitative – and, to an extent, qualitative – devel-opment of English-medium instruction over a 12-year period.
The number of English-taught Bachelor and Master programmes has risen by almost 1,000% in the period since 2002. Growth in student enrolment in these programmes has been far more moderate, however. Furthermore, there remain huge differ-ences between individual countries, especially in the form of a North-South divide. As in our earlier re-ports, the Nordic countries and the Netherlands are the leading providers. The runners-up are the Baltic States. Southern European countries are still largely ‘abstentious’. The bulk of the provision of English-medium instruction is concentrated in programmes at the Master level.
ISBN 978-3-86856-017-6
Lemmens
Bernd Wächter, Friedhelm Maiworm (eds.)
English-Taught Programmes in European Higher Education
ACA Papers on International Cooperation in Education
The State of Play in 2014
Bern
d W
ächt
er,
Frie
dhel
m M
aiw
orm
(eds
.) En
glis
h-Ta
ught
Pro
gram
mes
in E
urop
ean
High
er E
duca
tion


