+ All Categories
Home > Documents > BEST PRACTICE FOR THE ASSESSMENT OF SPANS IN · PDF filecan be taken to the management of free...

BEST PRACTICE FOR THE ASSESSMENT OF SPANS IN · PDF filecan be taken to the management of free...

Date post: 10-Mar-2018
Category:
Upload: phungdat
View: 222 times
Download: 1 times
Share this document with a friend
55
US MINERALS MANAGEMENT SERVICE 1435-01-98-PO-16063 BEST PRACTICE FOR THE ASSESSMENT OF SPANS IN EXISTING SUBMARINE PIPELINES VOLUME 1 - MAIN TEXT C811\01\007R REV O AUGUST 2002 Purpose of Issue Rev Date of Issue Author Checked Approved Final report O August 2002 JKS HMB HMB Controlled Copy Uncontrolled Copy BOMEL LIMITED Ledger House Forest Green Road, Fifield Maidenhead, Berkshire SL6 2NR, UK Telephone +44 (0)1628 777707 Fax +44 (0)1628 777877 Email [email protected] C811\01\007R Rev O August 2002 Page 0.1 of 0.5
Transcript

US MINERALS MANAGEMENT SERVICE

1435-01-98-PO-16063

BEST PRACTICE FOR THE ASSESSMENT OF SPANS IN

EXISTING SUBMARINE PIPELINES

VOLUME 1 - MAIN TEXT

C811\01\007R REV O AUGUST 2002

Purpose of Issue Rev Date of Issue Author Checked Approved

Final report O August 2002

JKS HMB HMB

Controlled Copy Uncontrolled Copy

BOMEL LIMITED

Ledger House

Forest Green Road, Fifield

Maidenhead, Berkshire

SL6 2NR, UK

Telephone +44 (0)1628 777707

Fax +44 (0)1628 777877

Email [email protected]

C811\01\007R Rev O August 2002 Page 0.1 of 0.5

REVISION SHEET

REVISION DETAILS OF REVISION DATE

O Final JIP report 7 August 2002

FILE SHEET

PATH AND FILENAME DETAILS OF FILE

C811\01\Figure 3.1.vsd

C811\01\016U.vsd

C811\01\016U.vsd

C811\01\016U.vsd

C811\01\Figure 3.5.vsd

C811\01\007R - Appendices.wpd

C811\01\007R - Appendix D.doc

Figure 3.1

Figure 3.2

Figure 3.3

Figure 3.4

Figure 3.5

Appendices A, B, C, E, F, G, H

Appendix D

C811\01\007R Rev O August 2002 Page 0.2 of 0.5

CONTENTS

Page No.

VOLUME 1

EXECUTIVE SUMMARY 0.4

1. INTRODUCTION, BACKGROUND AND SCOPE OF WORK 1.1

1.1 INTRODUCTION 1.1

1.2 BACKGROUND 1.2

1.3 SCOPE OF WORK 1.3

2. APPROACHES TO SPAN ASSESSMENT 2.1

2.1 INTRODUCTION 2.1

2.2 PRINCIPAL CONSIDERATIONS 2.1

2.3 AVAILABLE APPROACHES 2.2

2.3.1 The Basic Approach 2.2

2.3.2 Screening Approach 2.4

2.3.3 The Tiered Approach 2.6

3. UNCERTAINTY 3.1

3.1 PREAMBLE 3.1

3.2 RISK AND RELIABILITY FUNDAMENTALS 3.4

3.2.1 Qualitative Indexing Systems 3.4

3.2.2 Quantitative Risk Systems 3.6

3.3 SPATIAL AND TEMPORAL VARIABILITY 3.10

4. DATA FOR SPAN ASSESSMENT 4.1

4.1 PREAMBLE 4.1

4.2 DATA CLASSES 4.1

4.3 DATA SOURCES 4.2

5. SURVEYS 5.1

5.1 PREAMBLE 5.1

5.2 SURVEY TECHNIQUES 5.1

6. ASSESSMENT BENCHMARKING 6.1

7. DISCUSSION OF CURRENT PRACTICE 7.1

C811\01\007R Rev O August 2002 Page 0.3 of 0.5

8.1

9.1

8. WAY FORWARD

9. REFERENCES

VOLUME 2

APPENDIX A ­ PIPELINE DEFECT ASSESSMENT PROCESS: SPAN ANALYSIS FOR STATIC

STRENGTH AT THE TIER 1 LEVEL

APPENDIX B - PIPELINE DEFECT ASSESSMENT PROCESS: SPAN ANALYSIS FOR STATIC

STRENGTH AT THE TIER 2 LEVEL

APPENDIX C - PIPELINE DEFECT ASSESSMENT PROCESS: SPAN ANALYSIS FOR STATIC

STRENGTH AT THE TIER 3 LEVEL

APPENDIX D - PIPELINE DEFECT ASSESSMENT PROCESS: SPAN ANALYSIS FOR DYNAMIC

OVERSTRESS AT THE TIER 1 LEVEL (VORTEX SHEDDING)

APPENDIX E - DEVELOPMENT OF FATIGUE ASSESSMENT METHODOLOGY

APPENDIX F - CRITERIA DETERMINING THE STATIC STRENGTH OF PIPELINE SPANS

APPENDIX G ­ RECOMMENDED INSPECTION STRATEGY

APPENDIX H - COPY OF REFERENCE: BOMEL, 1995

C811\01\007R Rev O August 2002 Page 0.4 of 0.5

US MINERALS MANAGEMENT SERVICE

1435-01-98-PO-16063

BEST PRACTICE FOR THE ASSESSMENT OF SPANS IN

EXISTING SUBMARINE PIPELINES

EXECUTIVE SUMMARY

Although there is significant published guidance on the design of new pipelines that, as they are laid, may

form spans as a result of topographical features, there is not presently available equivalent published guidance for the assessment of free spans which may form during the operating life of a pipeline system

due to such processes as scour. This report therefore provides a foundation for an agreed industry wide consistent and standardised process for the assessment of such spans by presenting a review of the

"state of the art" practice for the assessment of spans in existing submarine pipelines and giving

recommendations for determining "best practice" in undertaking such assessments.

Section 1 of the report, following an introduction to the topic, gives the background to the work and details the scope under taken in the present project. Section 2 reviews the various philosophical approaches that

can be taken to the management of free spans in existing pipelines and suggests a framework with associated procedures and processes for the assessment of such spans.

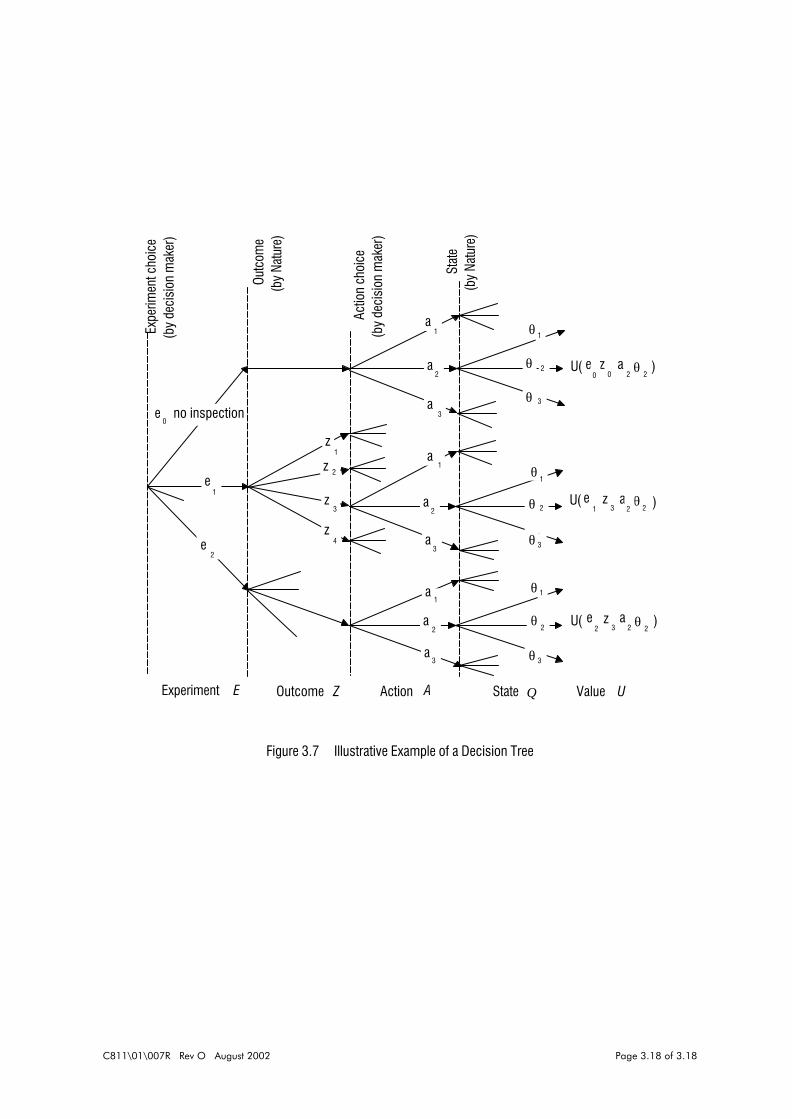
Section 3 then reviews the issue of "uncertainty" in respect of pipeline free spans by considering both the

resolution uncertainty in the data and the inherent temporal variability of the span itself. The sensitivity of the free span assessment outcome to the various input parameters is presented. The section

concludes with a discussion of a risk based, reliability approach to the subject.

Section 4 is concerned with the data perceived as required for assessment of free spans and in par ticular the value of historic records to better understand such issues as span development, migration and

elimination both by natural processes or intervention. Section 5 addresses pipeline surveys with regard to methods, frequencies and accuracy of the data obtained.

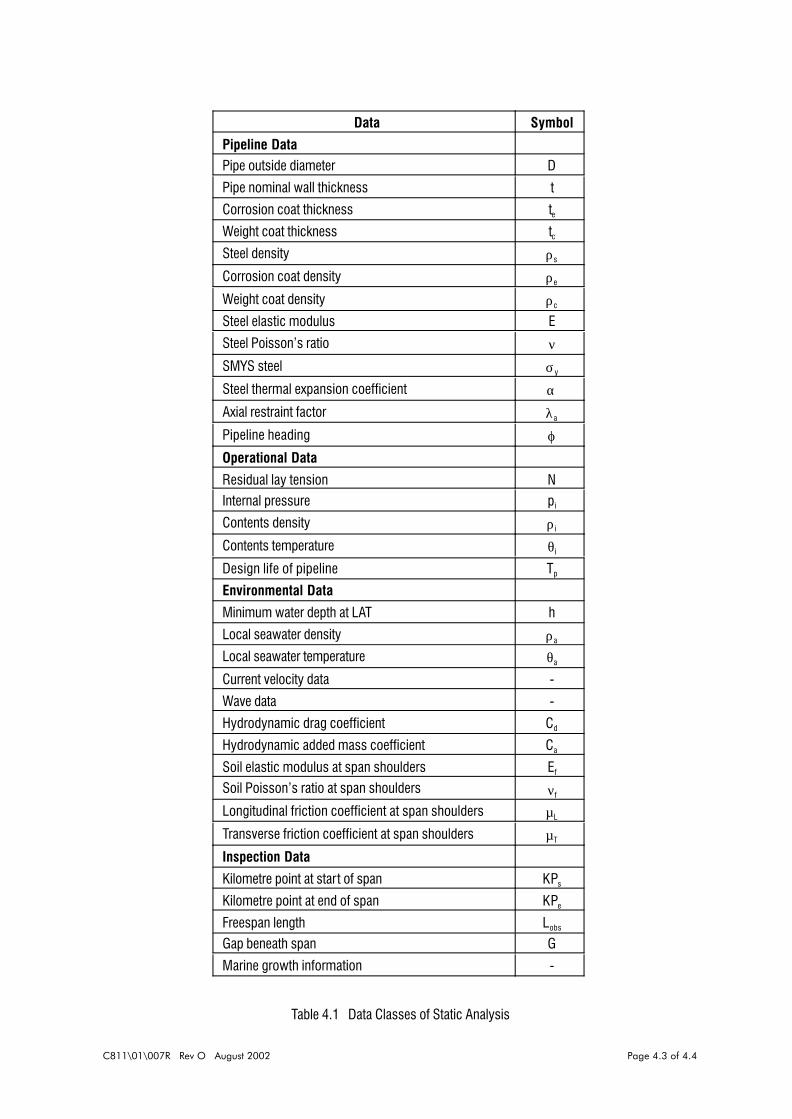
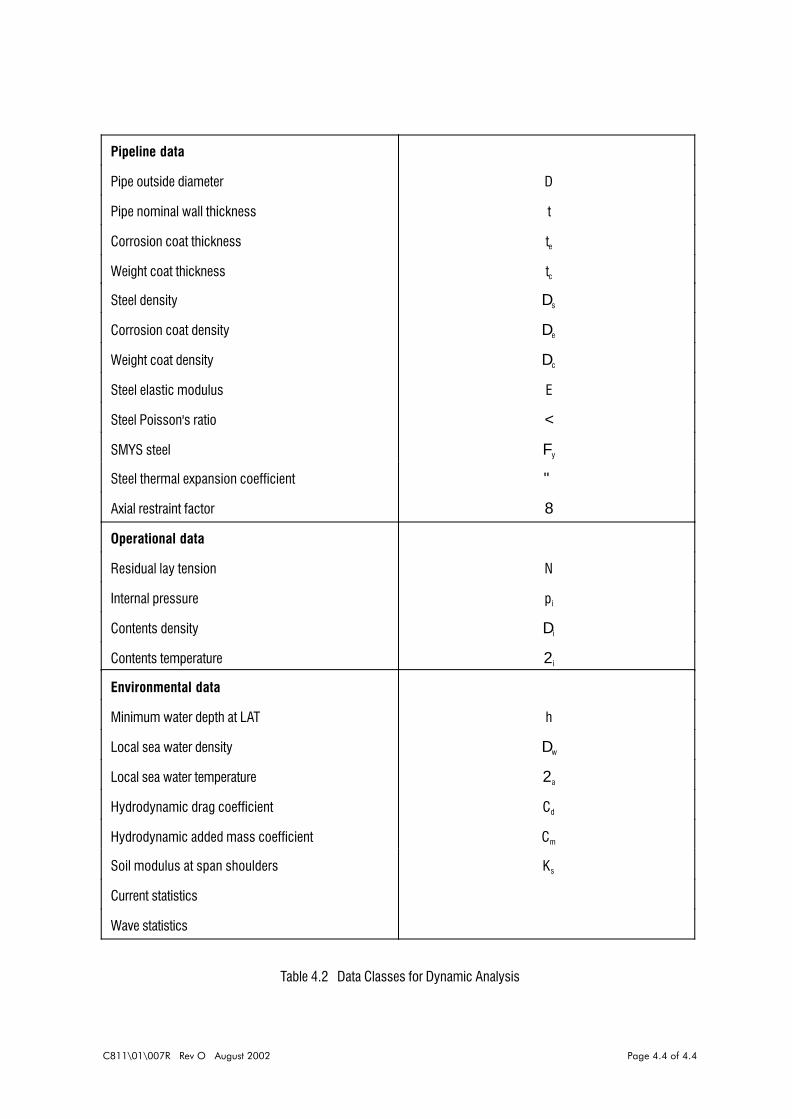
Section 6 is concerned with preliminary data to allow a review and comparison of the various analytical

tools presently available.

Section 7 presents a critical discussion of the earlier sections to determine the recommended content of a "best practice" document, key technical obstacles to its production, consideration of the availability of

appropriate historic data and the feasability of its use to improve the assessment process.

Recommendations for a "Way Forward" from this point to availability of "Best Practice" guidance are

documented in Section 8 to conclude the report.

The Appendices contain detailed technical material associated with the report.

C811\01\007R Rev O August 2002 Page 0.5 of 0.5

1. INTRODUCTION, BACKGROUND AND SCOPE OF WORK

1.1 INTRODUCTION

The primary duty of pipeline operators is to ensure the health and safety of individuals and the

protection of the environment in respect of the pipelines under their control. In the United

Kingdom (UK), up until the time of issue of the Pipelines Safety Regulations (SI 1996 No 825),

the health and safety aspects of onshore and offshore pipelines were covered by various sets

of regulations. Those applicable to offshore pipelines dated from the 1970s, were prescriptive,

bureaucratic and encouraged a compliance culture (Bugler, J.,1996 and Thayne, A . T.,1996).

The Pipelines Safety Regulations, 1996 represent a move away from prescription in that they

are based on a goal-setting philosophy and therefore compatible with the overall UK offshore

regulatory regime. The regulations recognise the need for different approaches for pipelines with

different levels of risk and the UK Health and Safety Executive has thus developed a regime that

is intended to be flexible in all aspects of pipeline design, construction and, particularly relevant

in the present context, operation. The adoption of a risk based approach is also consistent with

present international trends. New techniques and approaches are encouraged (Parkash, S.,

1996); however, those that are developed within this framework must be soundly-based and

achieve an equivalent or greater level of safety compared with present practice. Thus, the

present safety regime throws down the challenge to operators to promote innovative technology

and thinking, allowing them the freedom that the previous prescriptive legislation did not permit.

In addition to compliance with the regulatory framework, a further business driver for pipeline

operators is cost management. Cost savings are being sought in all areas including the

operation, maintenance and assessment of pipeline systems (Kaye, D., 1996). Operators have

a clear responsibility to the public, regulators, customers and shareholders to prevent integrity

breakdown adversely influencing pollution, personnel safety, security of supplies and the

reliability or economic value of the asset. Operating companies are thus under continually

increasing pressure to develop and manage pipeline integrity programmes in a responsible and

cost-effective manner so as not only to ensure safety but also to increase the business

emphasis on the reliability of pipeline systems. Maintaining the integrity of a pipeline system

during its operational life has significant benefits in financial and environmental aspects in

addition to safety considerations (Henderson, P.A., 1996).

As stated above, the Pipeline Safety Regulations,1996 are goal-setting; they therefore require

the operator to demonstrate the integrity of the pipeline but do not specify the methods to be

used. This permits the choice of any rationally engineered strategy and thus opens the route

to more efficient and cost-effective integrity management. However, such strategies must be

C811\01\007R Rev O August 2002 Page 1.1 of 1.6

recognised as being more 'scientific' than used previously; they thus rely for their efficacy on

the availability of good information (Rober tson et al ,1995 and Ellinas et al, 1995), and data

associated with the uncertainties involved in the operation of pipelines (Tviet, O. J., 1995). The

desire to utilise more sophisticated approaches to the integrity management of pipelines

imposes pressures all the way through the process and is dependent on the inspection

technology to detect anomalies (Jones, D.,1996 and Bruce, J.,1994) and provide the quality of

information that such technology requires (Lilley, J. R., 1996).

1.2 BACKGROUND

A key element in the integrity management of submarine pipelines is the detection,

characterisation, assessment and, if necessary, correction of pipeline free spans. Submarine

pipeline spans have received a great deal of attention in terms of research in recent years.

Acronyms for research projects abound, including SVSP, MASPUS, GUDESP (Tura et al 1994),

SUPERB (Sotberg et al, 1996) and the MULTISPAN project (Mørk, K. J., Vitali, L. and Verley,

R., 1997). Despite these intensive efforts, and the fact that many of the pieces of work were

Joint Industry Projects (JIPs), many of the findings generated have not directly found their way

into the public domain and, therefore, are not used on an industry-wide basis. In practice

pipeline operators, or consultants acting on their behalf, have developed and applied different

procedures and criteria depending on individual company philosophy and standards. A whole

range of methodologies and bespoke software has evolved (some of it commercially available)

based on differing interpretations of research, guidelines a n d rules. However, the degree of

divergence or convergence between the different approaches is not presently known

quantitatively because, until now, there has been no opportunity to compare and contrast the

strengths and applicability of the various methodologies.

Discussions with various industry stakeholders have indicated that there is a strong consensus

that insufficient attention has been paid to, and that the principal outstanding problem is one of,

the assessment of spans as unplanned-for defects in existing pipelines (formed as a result of

seabed material transpor t) rather than design for spans in new pipelines. With existing pipelines

there are greater uncertainties and less-detailed knowledge of many factors, as compared with

the design situation where spans are formed on known topography. This, coupled with the

strong influences of inherent time-dependent aspects, and the reliance on survey data (with its

associated uncertainties) means that the problem presents serious impediments to the use of

modern, complex and sophisticated analytical tools. While it is commendable that much high-

quality and rigorous research work has been incorporated into the DNV Recommended Practice

DNV-RP-F105 - Free Spanning Pipelines (DNV, 2001), this document remains biased towards

design analysis and, whilst it recognises that time-dependence is one key aspect of spans by

C811\01\007R Rev O August 2002 Page 1.2 of 1.6

the use of the so-called temporal classification, gives little other definitive guidance for spans

that develop while the pipeline is in service. Furthermore, although some research recognises

that uncertainty is a key aspect of the general problem of addressing pipeline spans, and

advocates the use of reliability methods, it is still strongly felt within the industry that

insufficient attention has been paid to providing definitive guidance for pipeline spans as

unplanned-for defects.

This present report therefore specifically addresses spans as unplanned-for defects in terms

of the requirements for assessments and the constraints within which they must be performed.

It addresses the perceived imbalance between designed-for and unplanned-for spans by

providing a foundation for development of 'Best Practice' assessment guidance to provide

acceptable levels of safety, coupled with appropriate cost-effectiveness, for spans that develop

in existing pipelines.

The availability of such guidance will promote:

! consistent and standardised practice across the industry

! the ability to make rational span acceptance decisions that are informed by:

- quantified levels of safety or probability of 'failure'

- collective expertise and experience

! rationalised inspection, maintenance and repair strategies, with potential cost savings

! avoidance of pipeline failure (and all its potential consequences) with confidence

! an holistic view of the problem, rather than addressing isolated technical aspects

! a coherent research strategy - directing resources towards the quantifiably important

aspects of the problem.

1.3 SCOPE OF WORK

The fundamental issues associated with the assessment of unplanned-for free spans in existing

pipelines can be summarised as follows:

1 There are greater uncertainties and less detailed knowledge of many factors

(compared with the design situation). It may even be the case that certain

information is not available owing to the age of the pipeline.

There is a temptation to use the more complex and sophisticated analytical tools that

are available on the basis that they are 'better' by some subjective judgement.

However, these tools are diverse, and their usage may require the precise

C811\01\007R Rev O August 2002 Page 1.3 of 1.6

2

specification of many data items. If information is scant, subjective engineering

judgement is necessary to assign values to parameters; these may be over-

conservative or under conservative and any advantage gained from using the

sophisticated tool may be lost, or the level of safety unquantified.

3 In using data or information that is available, specific issues may be raised as to their

applicability and relevance to the present problem (as compared with the design

situation).

4 There is strong reliance on survey data, which is obtained by remote or indirect

means, very of ten under difficult conditions, and thus may be imprecise or subject to

interpretation. This data relates to fundamental parameters of the problem, e.g.

observed span length and gap beneath span.

5 Underlying and strongly influencing the whole of the problem are the time-dependent

aspects. The problem is one of dealing with the mechanics of a structure that may

change its geometry, sometimes rapidly, with respect to both time and space.

Results from an individual survey only represent a "snapshot" at a particular time.

Whereas much past research has concentrated, almost exclusively, on quantitative engineering

analysis tools, the scope of work under taken in this project has been formulated by taking a

holistic and systemic view of span assessment as a management process that involves:

! data and information procurement

! data and information processing

! decision making.

And thus seeks to determine:

! what informs decision making? (whether to leave a span or intervene with remedial

measures?)

! what are the means of data / information processing? (analytical / engineering

assessment tools?)

! what data / information is required? (including survey data?)

Uncertainty is treated as an integral part of the assessment process.

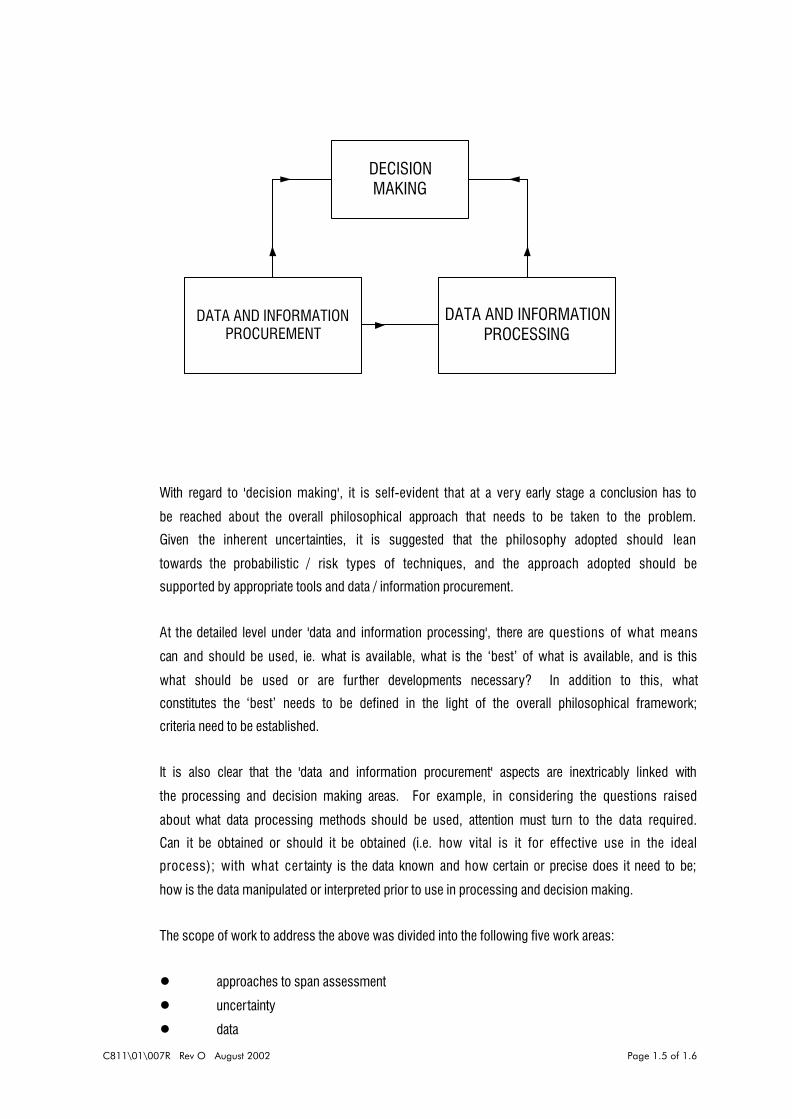
The above issues, which are expanded in Table 1.1, interact systemically thus:

C811\01\007R Rev O August 2002 Page 1.4 of 1.6

DECISION MAKING

DATA AND INFORMATION PROCUREMENT

DATA AND INFORMATION PROCESSING

With regard to 'decision making', it is self-evident that at a very early stage a conclusion has to

be reached about the overall philosophical approach that needs to be taken to the problem.

Given the inherent uncertainties, it is suggested that the philosophy adopted should lean

towards the probabilistic / risk types of techniques, and the approach adopted should be

supported by appropriate tools and data / information procurement.

At the detailed level under 'data and information processing', there are questions of what means

can and should be used, ie. what is available, what is the ‘best’ of what is available, and is this

what should be used or are further developments necessary? In addition to this, what

constitutes the ‘best’ needs to be defined in the light of the overall philosophical framework;

criteria need to be established.

It is also clear that the 'data and information procurement' aspects are inextricably linked with

the processing and decision making areas. For example, in considering the questions raised

about what data processing methods should be used, attention must turn to the data required.

Can it be obtained or should it be obtained (i.e. how vital is it for effective use in the ideal

process); with what cer tainty is the data known and how certain or precise does it need to be;

how is the data manipulated or interpreted prior to use in processing and decision making.

The scope of work to address the above was divided into the following five work areas:

! approaches to span assessment

! uncertainty

! data

C811\01\007R Rev O August 2002 Page 1.5 of 1.6

! surveys

! analytical tools

and the following aspects were considered:

! identifying the most appropriate overall philosophical approach for span assessment

and ensuring that subsequent work is directed towards it

! ensuring that the decision-making process is supported by tools and information that

incorporate and handle the uncertainty inherent in the problem

! identifying what assessment tools can and should be used, and what are the best

features of those available

! determining what data needs to be obtained and with what degree of certainty

! benchmarking span analysis programs / systems

! determining what data can be obtained, to what degree of certainty they are known

and how are they manipulated or interpreted

! formulating recommendations for "Best Practice" guidance.

C811\01\007R Rev O August 2002 Page 1.6 of 1.6

2. APPROACHES TO SPAN ASSESSMENT

2.1 INTRODUCTION

A key element of a submarine pipeline integrity management system is a sub-system for the

identification, assessment and, if necessary, correction of free spans that may occur as a result

of scour or other sediment transport processes. Span assessment is an essential part of this

sub-system and must include a procedure to inform the decision process on the need to

intervene to reduce a span and / or prevent its fur ther growth. The assessment process can

range in content from a data review and the application of engineering judgement (which might

be quite appropriate for pipelines with low failure consequences and / or where there is well

known history of free span behaviour not prejudicial to safe operation of the system) to the

rigorous application of advanced analytical techniques (which might be appropriate on high

failure consequence pipelines and / or where the economic and / or technical constraints on an

intervention are critical).

This section reviews and compares the benefits and dis-benefits of various procedures and

analytical approaches that have been applied to pipeline free span assessment and makes

recommendations for the adoption of a specific approach which is presently considered to

represent a "Best Practice" in this arena.

2.2 PRINCIPAL CONSIDERATIONS

In determining the selection of an optimal approach to free span assessment, it is necessary

to adopt a contingency approach that will be conditioned by system specific parameters. These

will typically include the economic, safety and pollution consequences of a pipeline failure; the

economic and technical feasibility of an intervention; the age and histor y of the pipeline system;

the quality of the available data in terms of content, availability and accuracy; the applicability

of analytical tools and any regulatory constraints.

It is typically found that the simpler approaches to free span assessment are inherently more

conservative in determining acceptable span lengths and that the level of conservatism reduces

as the level of sophistication in the span analysis increases. It is, however, important to note

that in certain circumstances the simpler methods can lead to under-conservative (i.e. unsafe)

results. Thus, the inappropriate application of the simpler methods may lead to either wasted

expenditure on unnecessary interventions or losses from unpredicted system failure.

C811\01\007R Rev O August 2002 Page 2.1 of 2.13

When using assessment methods at the more sophisticated end of the available assessment

spectrum, it is necessary to ensure the quality of the data is compatible with the technique

employed and that no important parameters are neglected in the determination of the acceptable

span length.

Based on the perceived accuracy of the input parameters and the level of confidence in the

analytic models there will be uncertainty in the results of the analysis. This uncertainty may

be fur ther compounded by the spacial and temporal variation that occurs as a span develops,

migrates or self-corrects. It is therefore important to determine whether a deterministic or

probabilistic approach is more appropriate in any specific system scenario. Risk / reliability

based approaches to assessment can also be adopted as further discussed below.

Generally, there are three failure modes that have to be considered when assessing a maximum

acceptable span length:

! Pipe failure under static loading

! Pipe failure under instantaneous dynamic loading, and

! Pipe failure under long term dynamic loading (fatigue).

For each of the above failure modes it is fur ther necessary to determine appropriate acceptance

criteria.

In particular conditions it may be necessary for fur ther failure modes to be considered. For

instance, if a pipeline has a propensity for its weight coating to detach, tight limitations on

dynamic response may be required to prevent fur ther weight coat loss and the stability of the

pipeline being thus impaired.

The above failure modes and associated loading combinations and acceptance criteria are also

fur ther discussed below.

2.3 AVAILABLE APPROACHES

2.3.1 The Basic Approach Other than the direct application of engineering judgement to the bare inspection data, the most

basic approach taken to determining a maximum acceptable span length is the use of a simple

deterministic, stress based criteria to assess the limiting span length under static conditions

coupled with ensuring avoidance of the onset of vor tex shedding resonance by the use of a

reduced velocity approach.

C811\01\007R Rev O August 2002 Page 2.2 of 2.13

A typical basic static analysis approach is to use simple linear elastic methods of analysis and

limit the maximum equivalent stress (arising from pressure, temperature and bending) to a

proportion (as dictated by pipeline codes) of the specified minimum yield strength (SMYS) of

the pipe material.

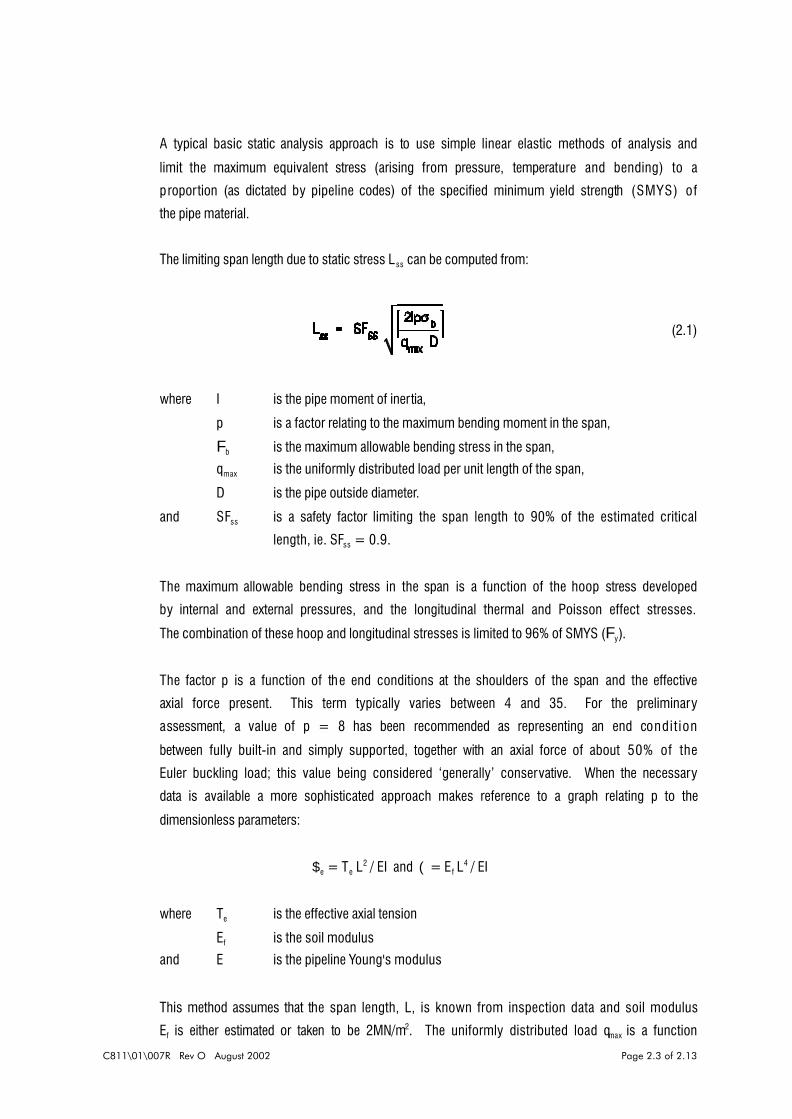
The limiting span length due to static stress Lss can be computed from:

(2.1)

where I is the pipe moment of inertia,

p is a factor relating to the maximum bending moment in the span,

Fb is the maximum allowable bending stress in the span,

qmax is the uniformly distributed load per unit length of the span,

D is the pipe outside diameter.

and SFss is a safety factor limiting the span length to 90% of the estimated critical

length, ie. SFss = 0.9.

The maximum allowable bending stress in the span is a function of the hoop stress developed

by internal and external pressures, and the longitudinal thermal and Poisson effect stresses.

The combination of these hoop and longitudinal stresses is limited to 96% of SMYS (Fy).

The factor p is a function of the end conditions at the shoulders of the span and the effective

axial force present. This term typically varies between 4 and 35. For the preliminary

assessment, a value of p = 8 has been recommended as representing an end condit ion

between fully built-in and simply supported, together with an axial force of about 50% of the

Euler buckling load; this value being considered ‘generally’ conservative. When the necessary

data is available a more sophisticated approach makes reference to a graph relating p to the

dimensionless parameters:

$e = Te L2 / EI and ( = Ef L

4 / EI

where Te is the effective axial tension

Ef is the soil modulus

and E is the pipeline Young's modulus

This method assumes that the span length, L, is known from inspection data and soil modulus

Ef is either estimated or taken to be 2MN/m2. The uniformly distributed load qmax is a function

C811\01\007R Rev O August 2002 Page 2.3 of 2.13

of the submerged weight of the pipe and the horizontal loading on the span, due to current and

waves. It should be noted that, with regard to horizontal loading typically:

! The wave and current velocities are to be derived from the 50 year return period data;

! The hydrodynamic drag coefficient is to be taken as 0.7 and 1.05 for smooth and

rough pipe, respectively;

! In combining the current and wave velocities, the critical wave phase angle has been

assumed to be zero.

Further refinement can be obtained by using span specific inspection data.

A 'safety factor' can be applied to the calculated allowable span to provide a margin against

span growth prior to the next planned inspection. A value of 0.9 has been adopted.

The simple approaches which limit the maximum equivalent stress to a proportion of the

minimum yield stress of the pipe material are inherently more conservative than limit state type

analysis which uses the material stress / strain properties more efficiently. The approach uses

unsophisticated structural mechanics and some parameters such as soil / str ucture interaction,

axial force and P-* effects are not treated explicitly. The method is based on small deflection

assumptions and does not consider the effects of membrane action.

2.3.2 Screening Approaches Further sophistication can be achieved by using free span assessment procedures embodying

a screening approach where spans are classified as acceptable or otherwise according to some

initial criteria. Spans failing the initial criteria are then either subject to intervention or subjected

to a series of more rigorous analyses and / or more detailed inspections to provide further input

to the intervention decision making process.

Some screening procedures classify spans in terms of the need for future inspection or remedial

works, for instance:

Acceptable Spans

The span may be lef t indefinitely without the need for correction.

Reviewable Spans

The span should be marked and its history monitored during yearly inspections. If it exists for

more than three consecutive years it should be recategorised as rectifiable and corrected during

the next IRM programme.

C811\01\007R Rev O August 2002 Page 2.4 of 2.13

Rectifiable Span (next IRM)

The span may be lef t until the next scheduled IRM Programme and then corrected.

Rectifiable Span (immediately)

The span must be corrected immediately.

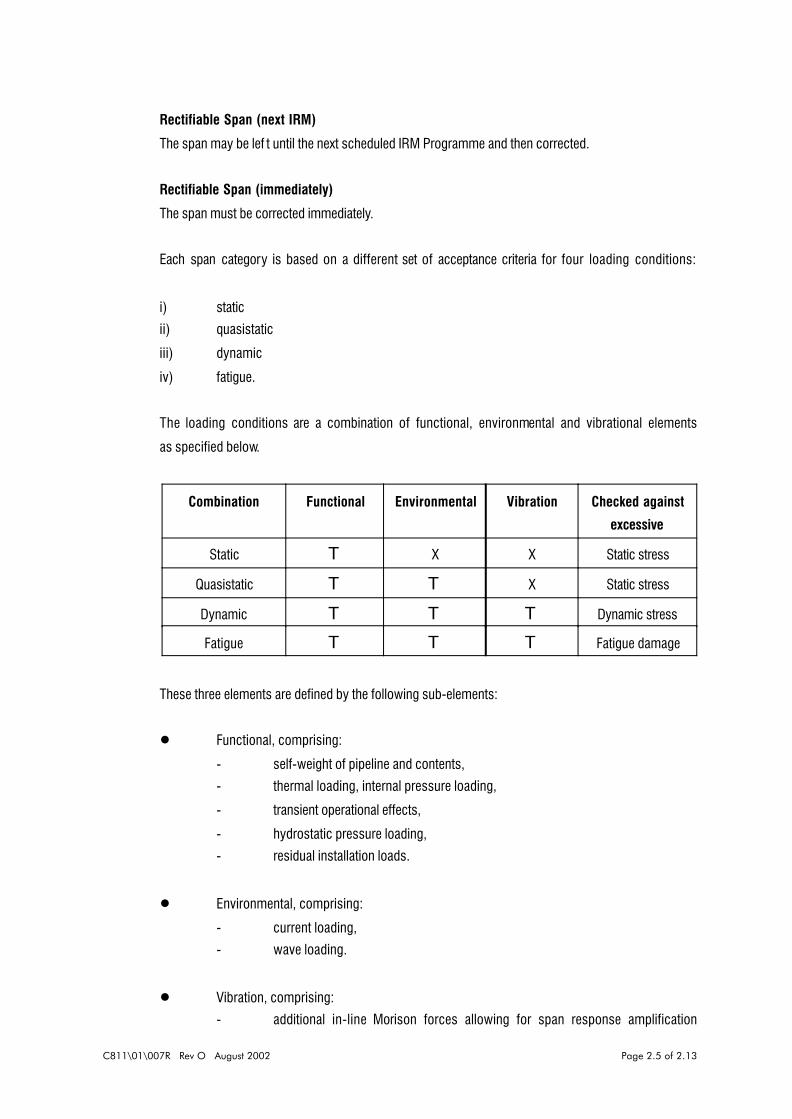
Each span category is based on a different set of acceptance criteria for four loading conditions:

i) static

ii) quasistatic

iii) dynamic

iv) fatigue.

The loading conditions are a combination of functional, environmental and vibrational elements

as specified below.

Combination Functional Environmental Vibration Checked against

excessive

Static T X X Static stress

Quasistatic T T X Static stress

Dynamic T T T Dynamic stress

Fatigue T T T Fatigue damage

These three elements are defined by the following sub-elements:

! Functional, comprising:

- self-weight of pipeline and contents,

- thermal loading, internal pressure loading,

- transient operational effects,

- hydrostatic pressure loading,

- residual installation loads.

! Environmental, comprising:

- current loading,

- wave loading.

! Vibration, comprising:

- additional in-line Morison forces allowing for span response amplification

C811\01\007R Rev O August 2002 Page 2.5 of 2.13

due to resonance phenomena,

- effects due to periodic flow acceleration relating to the pipe/seabed

proximity,

- effects due to the periodic shedding of vortices.

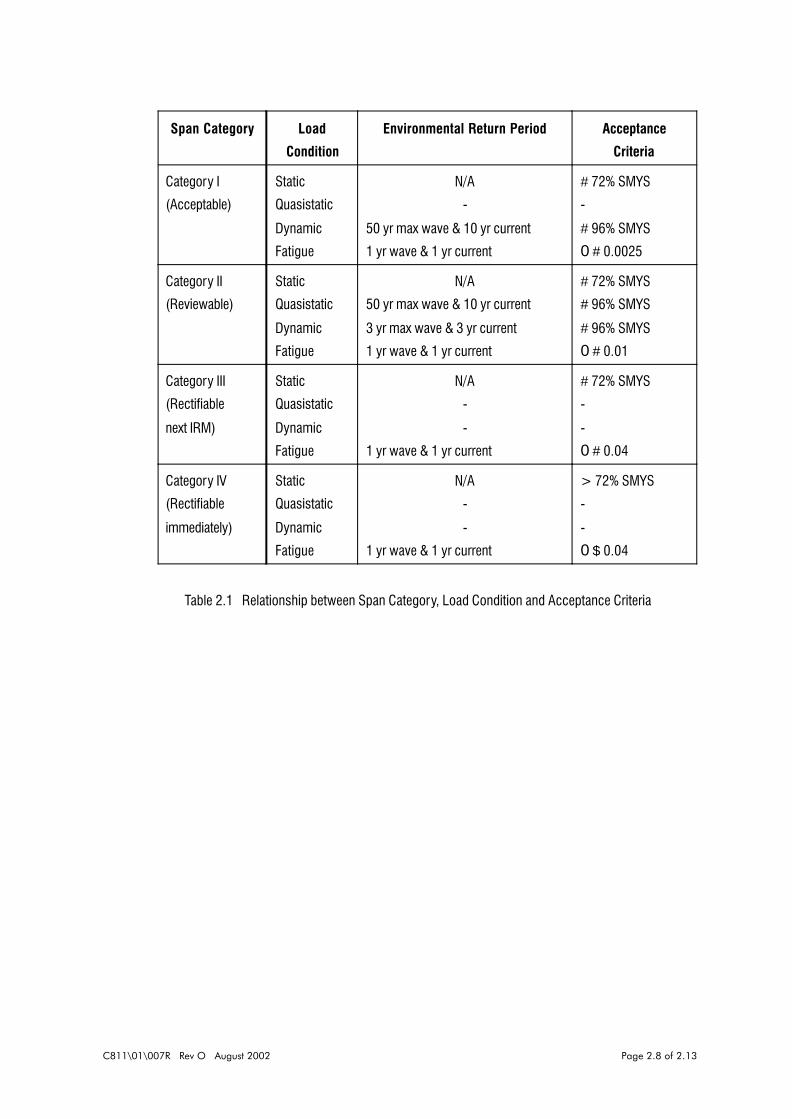
The acceptance criteria for each of the four loading conditions is related to a propor tion of

specified minimum yield stress (SMYS) or Miner’s damage ratio 0. The relationship between

span category, load condition and acceptance criteria is summarised in Table 2.1.

As would be expected, it is the time dependent dynamic / fatigue factors that most affect the

classification of category. Considering the static and quasistatic conditions above, the

categorisations will be at one of three levels: ‘Acceptable’, ‘Reviewable’ (if quasistatic span

length is less than the static span length) or ‘Rectify Immediately’. Therefore, the advantages

of this approach are largely lost if the assessment is limited to static strength behaviour only.

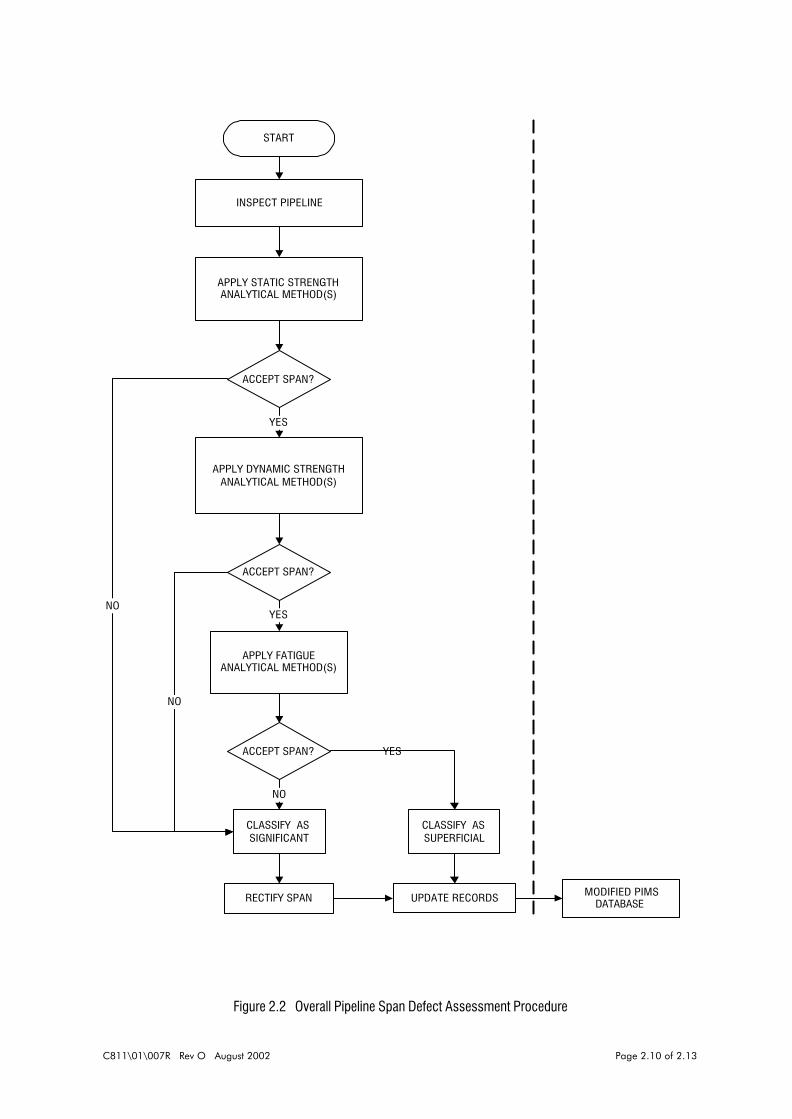
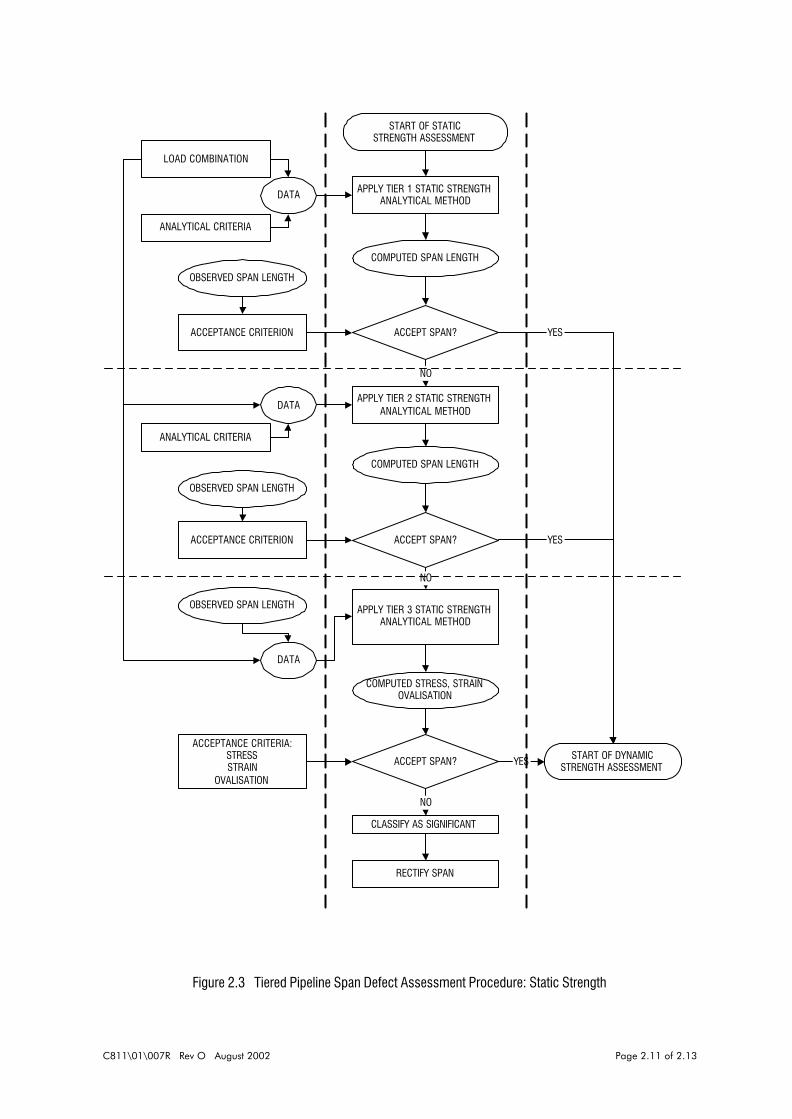
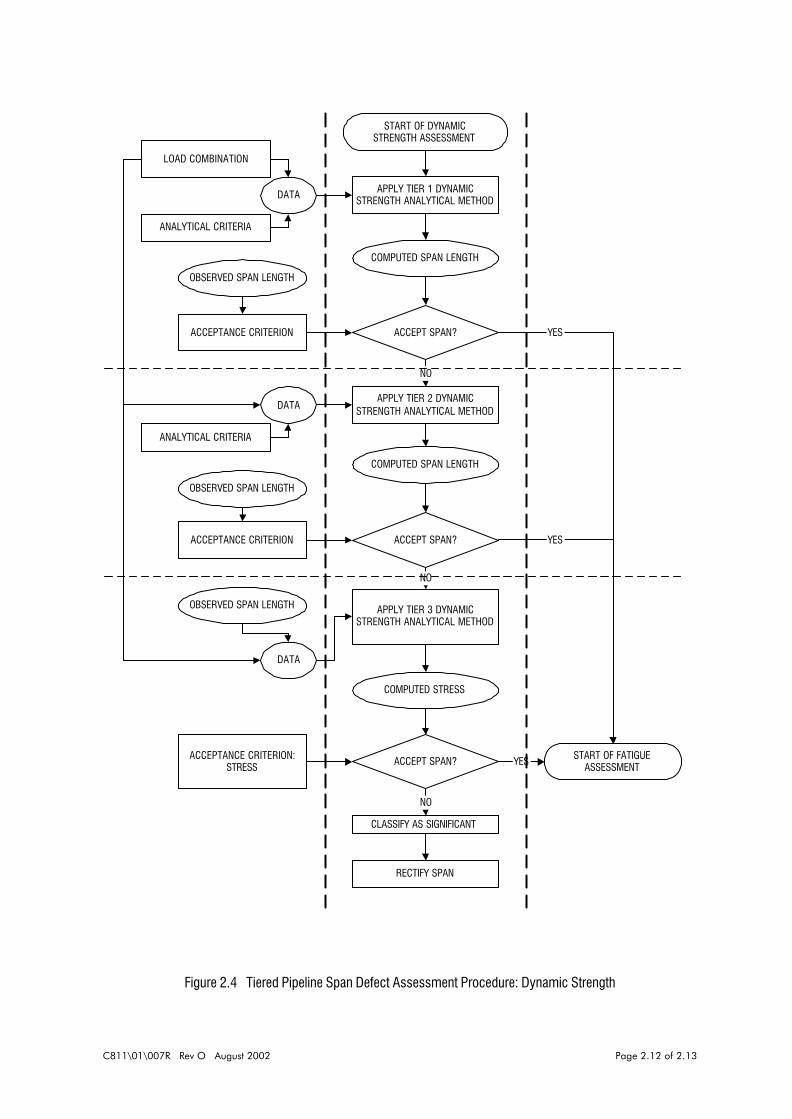
2.3.3 The Tiered Approach A generic system has been developed that is considered to represent a 'Best Practice' for the

determination of the acceptability of pipeline defects. This procedure is shown graphically in

Figure 2.1 which illustrates that the procedure involves information transfer to and from a

process, with a result ensuing. Inspection provides information to the assessment procedure;

this is amalgamated with the other data and provides input, along with the load combinations

and analytical criteria, into the analytical methods. Specific application of the generic procedure

to minimise the need for remedial intervention for free-spans is depicted in Figure 2.2. Each

failure mode is subjected to a tiered screening approach that employs increasing levels of

analytical complexity, for each potential failure mode as shown in Figures 2.3, 2.4 and 2.5. The

results of the analytical methods, in conjunction with the acceptance criteria, are then used to

decide the acceptability or otherwise, of a span.

The tiered screening process involves implementing successively less conservative and more

sophisticated analytical and modelling techniques. In this way pipeline spans that pass

conservative tests, which are designed to be easily and rapidly applied to bulk-processing of

large numbers of spans, are screened out at an early stage, leaving fewer spans to be analysed

using the more complex techniques of the higher tiers. The basic structure of each tier is

similar insofar as it involves the interaction between data, load combinations, analytical criteria,

an analytical method and an acceptance criterion, before a decision is made whether to accept

a span. If a span is found to be acceptable, it is passed to the next failure mode assessment

(static strength to dynamic strength, dynamic strength to fatigue), or if it is deemed to be not

acceptable it is passed to a higher tier level. If a span is determined to be not acceptable at the

Tier 3 level, then it is classified as significant and must be rectified. If and only if the span has

been determined to be acceptable for all three failure modes is it classified as superficial.

C811\01\007R Rev O August 2002 Page 2.6 of 2.13

The precise interactions between the data, load combinations, analytical criteria, analytical

methods and acceptance criteria may differ between the tiers. This is because the different

analytical methods employed may, in each case, require distinct inputs and produce distinct

outputs and, consequently, the process will require different modes of handling. The tiered

approach is intended to be flexible and the manner in which it is to be applied is largely at the

discretion of the individual applying the procedure.

To date, specific deterministic processes, including load combinations and acceptance criteria,

for assessing static span strength at Tier Levels 1, 2 & 3 and dynamic acceptability at Tier Level

1 are available and are presented in Appendices A, B, C,& D respectively.

Work undertaken on the tiered approach to dynamic and fatigue assessment is detailed in

Appendix E.

An evaluation analysis of various acceptance criteria, particularly in relation to static strength

is reported in Appendix F.

C811\01\007R Rev O August 2002 Page 2.7 of 2.13

Span Category Load

Condition

Environmental Return Period Acceptance

Criteria

Category I

(Acceptable)

Static

Quasistatic

Dynamic

Fatigue

N/A

-

50 yr max wave & 10 yr current

1 yr wave & 1 yr current

# 72% SMYS

-

# 96% SMYS

0 # 0.0025

Category II

(Reviewable)

Static

Quasistatic

Dynamic

Fatigue

N/A

50 yr max wave & 10 yr current

3 yr max wave & 3 yr current

1 yr wave & 1 yr current

# 72% SMYS

# 96% SMYS

# 96% SMYS

0 # 0.01

Category III

(Rectifiable

next IRM)

Static

Quasistatic

Dynamic

Fatigue

N/A

-

-

1 yr wave & 1 yr current

# 72% SMYS

-

-

0 # 0.04

Category IV

(Rectifiable

immediately)

Static

Quasistatic

Dynamic

Fatigue

N/A

-

-

1 yr wave & 1 yr current

> 72% SMYS

-

-

0 $ 0.04

Table 2.1 Relationship between Span Category, Load Condition and Acceptance Criteria

C811\01\007R Rev O August 2002 Page 2.8 of 2.13

Figure 2.1 Generic Defect Assessment Procedure

INFORMATION PROCESS RESULT TRANSFER

INSPECT PIPELINE

APPLY ANALYTICAL METHOD(S)

START

LOAD COMBINATIONS

ANALYTICAL CRITERIA

DATA

ACCEPTANCE CRITERIA ACCEPT DEFECT?

NO

YES

RECTIFY DEFECT

CLASSIFY AS SUPERFICIAL

UPDATE RECORDS

CLASSIFY AS SIGNIFICANT

MODIFIED PIMS

DATABASE

(PIMS = Pipeline Inspection Management System)

C811\01\007R Rev O August 2002 Page 2.9 of 2.13

INSPECT PIPELINE

APPLY STATIC STRENGTH ANALYTICAL METHOD(S)

ACCEPT SPAN?

RECTIFY SPAN

START

CLASSIFY AS SIGNIFICANT

APPLY DYNAMIC STRENGTH ANALYTICAL METHOD(S)

APPLY FATIGUE ANALYTICAL METHOD(S)

ACCEPT SPAN?

ACCEPT SPAN?

NO

NO

YES

YES

NO

YES

UPDATE RECORDS

CLASSIFY AS SUPERFICIAL

MODIFIED PIMS DATABASE

Figure 2.2 Overall Pipeline Span Defect Assessment Procedure

C811\01\007R Rev O August 2002 Page 2.10 of 2.13

Figure 2.3 Tiered Pipeline Span Defect Assessment Procedure: Static Strength

C811\01\007R Rev O August 2002 Page 2.11 of 2.13

ACCEPT SPAN?

DATA

ANALYTICAL CRITERIA

LOAD COMBINATION

APPLY TIER 1 STATIC STRENGTH ANALYTICAL METHOD

COMPUTED SPAN LENGTH

OBSERVED SPAN LENGTH

YES

NO

ACCEPT SPAN?

APPLY TIER 2 STATIC STRENGTH ANALYTICAL METHOD

COMPUTED SPAN LENGTH

YES

NO

ACCEPTANCE CRITERION

ACCEPT SPAN?

APPLY TIER 3 STATIC STRENGTH ANALYTICAL METHOD

COMPUTED STRESS, STRAIN OVALISATION

YES

NO

START OF DYNAMIC STRENGTH ASSESSMENT

CLASSIFY AS SIGNIFICANT

DATA

ACCEPTANCE CRITERIA: STRESS STRAIN

OVALISATION

DATA

ANALYTICAL CRITERIA

ACCEPTANCE CRITERION

RECTIFY SPAN

START OF STATIC STRENGTH ASSESSMENT

OBSERVED SPAN LENGTH

OBSERVED SPAN LENGTH

Figure 2.4 Tiered Pipeline Span Defect Assessment Procedure: Dynamic Strength

C811\01\007R Rev O August 2002 Page 2.12 of 2.13

ACCEPT SPAN?

DATA

ANALYTICAL CRITERIA

LOAD COMBINATION

APPLY TIER 1 DYNAMIC STRENGTH ANALYTICAL METHOD

COMPUTED SPAN LENGTH

OBSERVED SPAN LENGTH

YES

NO

ACCEPT SPAN?

APPLY TIER 2 DYNAMIC STRENGTH ANALYTICAL METHOD

COMPUTED SPAN LENGTH

YES

NO

ACCEPTANCE CRITERION

ACCEPT SPAN?

APPLY TIER 3 DYNAMIC STRENGTH ANALYTICAL METHOD

COMPUTED STRESS

YES

NO

START OF FATIGUE ASSESSMENT

CLASSIFY AS SIGNIFICANT

DATA

ACCEPTANCE CRITERION: STRESS

DATA

ANALYTICAL CRITERIA

ACCEPTANCE CRITERION

RECTIFY SPAN

START OF DYNAMIC STRENGTH ASSESSMENT

OBSERVED SPAN LENGTH

OBSERVED SPAN LENGTH

Figure 2.5 Tiered Pipeline Span Defect Assessment Procedure: Fatigue

C811\01\007R Rev O August 2002 Page 2.13 of 2.13

ACCEPT SPAN?

DATA

ANALYTICAL CRITERIA

LOAD COMBINATION

APPLY TIER 1 FATIGUE ANALYTICAL METHOD

COMPUTED SPAN LENGTH

OBSERVED SPAN LENGTH

YES

NO

ACCEPT SPAN?

APPLY TIER 2 FATIGUE ANALYTICAL METHOD

COMPUTED SPAN LENGTH

YES

NO

ACCEPTANCE CRITERION

ACCEPT SPAN?

APPLY TIER 3 FATIGUE ANALYTICAL METHOD

COMPUTED FATIGUE LIFE

YES

NO

CLASSIFY AS SIGNIFICANT

DATA

ACCEPTANCE CRITERION: FATIGUE LIFE

DATA

ANALYTICAL CRITERIA

ACCEPTANCE CRITERION

RECTIFY SPAN

START OF FATIGUE ASSESSMENT

OBSERVED SPAN LENGTH

OBSERVED SPAN LENGTH

CLASSIFY AS SUPERFICIAL

UPDATE RECORDS

3. UNCERTAINTY FRAMEWORK

3.1 PREAMBLE

As noted above the assessment of submarine free spans is complicated by the various

uncertainties that are inherent in the problem. The interaction of these uncertainties from both

the observation of the span and the computation of its acceptability (or otherwise) is illustrated

in Figure 3.1. The uncertainties can be classified into three key areas viz:

! Statistical uncertainty associated with the both 'fixed' data (e.g. pipeline material

proper ties, residual lay tension, soil properties etc.) and 'variable' data ( e.g. span

location, span length, span / sea-bed gap, trench characteristics, wave / current

parameters, temperature, pressure, etc.)

! Model uncertainty associated with hydrodynamic loading, structural response and

dynamic analysis etc.

! Temporal and spatial uncertainty associated both with a span's development history

and with its predicted future behaviour.

Because of these uncer tainties there is a need to optimize the balance between the level of

sophistication of the analytical tools employed and the quality of the input data available. This

balance must include consideration of the cost benefit aspects to determine the best 'value

added' options between, for example, fur ther refined data collection; more rigorous analysis; and

expenditure on remedial measures. A risk based approach suppor ted by reliability analysis is

considered a 'Best Practice' approach to addressing this problem which also requires significant

experience and engineering judgement to determine a best strategy. Again, as noted earlier,

a risk based approach is also consistent with international regulatory trends.

Key areas of uncertainty include:

Statistical:

! Span location: Survey datum and accuracy

! Span length: Survey accuracy (depending on the sur vey method employed, there can

be instances of touch down that are not identified by the survey), span interpretation

C811\01\007R Rev O August 2002 Page 3.1 of 3.18

! Span end conditions: Extent of burial

(see Figure 3.2)

! Pipeline / sea-bed gap: Survey accuracy (the extent of the gap can be difficult to

obtain)

(See also Figure 3.2)

! Trench characteristics: Survey accuracy (whether the pipeline is in a trench and, if so,

the trench configuration)

(see Figure 3.3)

! Geotechnical: Sub-grade reaction, friction and damping characteristics (often not

available and are subject the inherent spatial variability)

! Environmental: Directional wave / current characteristics and combined probabilities,

scatter diagram data

! Material / weld properties: Yield, ultimate strength, fatigue, toughness, defects etc.

! Coating: Weight, condition

! Corrosion: Nature /extent of metal loss, CP system effectiveness

! Existing stress state: Residual lay tension, creep, span history, degree of axial

constraint (see Figure 3.4)

Model:

! Hydrodynamics: Kinetics and kinematics (combined wave / current), gap effects

! Fluid loading: Drag / lif t coefficients; transfer function

! 'Static' response: Loading model, analytical model (see Figure 3.5)

! Fatigue: Loading model, dynamic response model, SCFs and damage model

! Stress / strain predictions: Material behaviour model

C811\01\007R Rev O August 2002 Page 3.2 of 3.18

Temporal / Spatial:

! Span history: Survey frequency, survey accuracy, inter-survey behaviour

(See Figure 3.6)

! Span future behaviour: Predictive model and data

Some preliminary work has been undertaken to identify the relative significance and importance

of some of these key parameters and is reported in BOMEL, 1995, the full text of which is

included in Appendix H. A series of analyses were performed using a sensitivity methodology

that utilised Monte Carlo simulation. The technique corresponds to a Level Three reliability

method; although a reliability analysis per se was not performed, the approach embedded the

application of reliability techniques to assess the sensitivity of a deterministically-based

assessment procedure. The work concluded that:

! It is evident that there are three possible routes to reducing the conservatism inherent

in the span assessment procedure:

- maintain the usage of the current techniques, and rely on the procurement

of ‘better’ data;

- adopt more complex analytical span assessment tools that better represent

the mechanical behaviour of spans;

- incorporate less onerous acceptance criteria.

! The analyses highlighted the dangers of classifying a span as being governed by a

particular criterion based on a single deterministic calculation. Introduction of

variability in the input parameters may influence which criterion governs, which should

be based on a balance of probabilities. Changes in the variation assigned to input

parameters may result in a parameter assuming an importance greater than that

indicated by a deterministic calculation.

! Two groups of parameters pertaining to modelling of the span response, and

hydrodynamic loading were found to impose the greatest influence on limiting spans.

These groups contained:

- bending moment factor p and natural frequency parameter f;

- current velocity Vc, maximum wave induced velocity Vw and significant wave

induced velocity Vwsig.

! The parameters in the first group were the most influential and enhanced limiting span

lengths may result from improved data on these. However, they will be strongly

C811\01\007R Rev O August 2002 Page 3.3 of 3.18

dependent on span end suppor t conditions and effective axial force in the pipeline,

and hence a different structural model would be necessary to determine the relative

influences of these.

! It is apparent that for beneficial changes to occur as a result of improved data,

improvements may be necessary to all key input parameters as significant

enhancement of a single parameter may not necessarily lead to a commensurate

enhancement of limiting span length.

! Early indications, however, are that significantly improved limiting span lengths would

not accrue from improved data and that the greatest sources of conservatism are

most likely the analytical methods and restrictions/criteria imposed by codes and

guidelines.

3.2 RISK AND RELIABILITY FUNDAMENTALS

A variety of qualitative and quantitative risk-based approaches to the strategic integrity

management of engineered systems have been proposed and used widely in a number of

industries, including the offshore industry. In offshore structural engineering, risk and reliability

techniques have been used for more than a decade to prioritise the inspection of the welded

connections of steel jackets. A number of schemes have also been proposed for the

assessment of land-based and sub-sea pipelines.

Two commonly used methodologies are qualitative indexing and quantitative risk assessment;

approaches based on a combination of the two have also been suggested.

3.2.1 Qualitative Indexing Systems Qualitative risk indexing approaches are based on assigning subjective scores to the different

factors that are thought to influence the probabilities and consequences of failure. The scores

are then combined using simple formulae to give an index representing the level of risk. The

resulting indices for different components (or pipe zones, or failure modes, or hazards) can then

be ranked to determine components with the highest risk.

Clearly the main advantage of this approach is that it is very simple to apply.

However, there are a number of disadvantages with this approach:

! the index does not give any indication of whether the risk associated with a par ticular

C811\01\007R Rev O August 2002 Page 3.4 of 3.18

segment is unacceptable;

! no guidance is provided as to whether any risk reduction action is necessary;

! it is very difficult to calibrate the scoring and indexing system for pipelines, and to

validate the results.

An example of an Indexing system is that developed for the MTD (MTD, 1989) to prioritise the

inspection requirements for detecting and monitoring fatigue cracking of components in jacket

structures. The approach is based on deriving a numerical criticality rating for each component.

The criticality rating for any component j in a given year n is based on a function of:

! consequence of failure,

! mode of failure,

! likelihood of failure,

! cost and reliability of inspection,

! inspection history data.

The MTD’s criticality rating function is given by:

(3.1)

where is the weighting for the consequence of failure

is the weighting for the likelihood of failure

is the weighting reflecting the inspection history of the component

The weighting for the consequence of failure, , is evaluated as the sum of nine individual

weightings for items such as redundancy or importance of chord and brace, immediate risk to

life, risk to environment, risk of lost production, cost of repair, confidence in assessment, etc.

Weightings for each of the individual items are judged subjectively as high, medium, or low, and

assigned numerical values; values are suggested for each categor y and item which range from

1 to 100, and the suggested weightings are such that an average score is 80.

The weighting for the likelihood of failure, , is evaluated as the sum of eight individual

weightings for items such as susceptibility to damage, whether a defect is known to exist,

corrosion condition, fabrication quality, confidence in assessment, etc. Again each item is

judged as high, medium or low, and assigned numerical values; values are suggested ranging

from 1 to 100, and the average suggested score is 80.

The rating is also influenced by the time elapsed since the last inspection. Weightings for the

C811\01\007R Rev O August 2002 Page 3.5 of 3.18

inspection history, , are suggested ranging from 0, if the component was inspected last year,

to 6400, if the previous inspection was more than 5 years ago. The values suggested are

preliminary, and the MTD report cautions that the procedure needs fur ther systematic review,

and formal calibration or bench-marking studies need to be undertaken.

As discussed by Descamps et al 1996, when the methodology was applied to a real northern

North Sea structure, it was found that too much weight was applied to the consequences of

failure compared to the likelihood of failure. As a result only elements classified as primary

were repeatedly recommended for inspection throughout the lifetime of the structure.

Descamps et al. have revised the MTD methodology in an attempt to balance the effects.

Henderson, P. A.,1996, and Kaye, D.,1996, discuss a qualitative risk assessment procedure for

pipelines using a “Boston square”. Kaye’s matrix is shown in Table 3.1; Henderson considers

five categories for probability and consequence. The matrix defines a ranking number which

defines the risk of the failure mechanism, where the lowest number is the least severe and the

highest is the most important.

However, Kaye notes that risk ranking alone does not give any guidance on how risk may be

controlled, and does not show how inspection may help to manage these risks. In an attempt

to manage the risks, they both consider the value of the inspection and introduce a third

dimension to transform the Boston square into a “Boston cube”. Thus, inspection criticality is

defined as the product of failure probability, failure consequence and inspection value.

Having identified the high risk scenarios for each mode and mechanism on every section of the

pipeline the value of inspection is assessed. Henderson gives the following examples of

inspection value:

! High value internal corrosion, which can be monitored closely by inspection

and measures taken to remedy the rate of decay;

! Low value trawl board impact, which cannot be monitored by inspection as

the event can occur immediately af ter inspection.

Kaye gives details of a case study of the use of a Boston cube for a modern, large diameter

expor t tr unkline in the Nor th Sea, and the results are summarised in Table 3.2. For this example,

spanning was found to have the highest inspection criticality with a value of 12.

3.2.2 Quantitative Risk Systems Quantitative risk systems are based on estimating the level of risk by direct assessment of the

probability and consequences of failure. Depending on the sophistication of the approach, the

C811\01\007R Rev O August 2002 Page 3.6 of 3.18

probability of failure may be estimated using historical failure rate data (actuarial approach) or

advanced structural reliability methods (notional approach).

Most of the quantitative risk systems are based on Bayesian Decision Theory (see for example

Benjamin, J. R. and Cornell C. A., 1970). This theory has been applied to a number of areas,

and is concerned with decision making which depends on factors that are not known with

certainty; it offers a convenient framework for the inclusion of subjective information. The

decision problem is of ten illustrated using a ‘Decision Tree’, and an example is shown in Figure

3.7.

The terminology of decision theory is rather general; in the context of the present analysis the

terms can be defined as:

an experiment corresponds to an inspection option (method/time)

an experiment outcome corresponds to an inspection measurement or result

an action corresponds to a repair or maintenance option

an outcome of nature corresponds to no failure, or loss of containment or

serviceability

a utility corresponds to expected cost

From basic Bayesian decision theory, the problem of the decision maker is to choose an

experiment E (an inspection option) yielding a random or uncertain outcome Z (inspection result)

that can be used by the decision maker to choose an action A (repair option). When the

decision maker has taken an action (to repair or not) this will result in a random outcome of

nature 1 (failure or not). The chosen inspection method and repair option together with the

outcome determines a utility value U (expected cost).

The part of the analysis starting once the results of an experiment (inspection) are known, and

involving the choice of an action and its random outcome, is known as a posterior analysis; the

statistics of the utility (expected costs) can be estimated using known statistics (about the

existing state of the pipeline). Whereas the complete analysis, where the choice and results

of an inspection are still unknown, is known as a preposterior analysis.

The theory associated with defining the conditional, marginal, prior and posterior probabilities

is well defined in a number of texts.

The application of advanced reliability-based techniques to offshore systems, specifically

structures, is primarily due to work by Madsen and his co-workers using the PROBAN suite of

software (Madsen et al 1987 and Madsen, H.O., and Sorensen, J. D.,1990 ). Most of the

quantified risk applications to offshore structures have been based on this work.

C811\01\007R Rev O August 2002 Page 3.7 of 3.18

The main impetus for Madsen et al’s research came from concerns over the catastrophic

consequences of fatigue following a number of major incidents; and the need to address the

increasing expense and dangers of inspecting the joints of offshore jackets, particularly as

str uctures moved into deeper waters. Madsen et al have developed a theoretical framework

which has brought together probabilistic analysis, fracture mechanics, fatigue crack growth

theory, probability of detection (POD) curves, and reliability updating for inspection and repair,

etc..

Reliability-based methodology has also been incorporated into procedures for ‘optimising’ the

design, inspection and repair of fatigue sensitive elements (Madsen, H.O., and Sorensen, J.

D.,1990 and Faber et al, 1994). The basis of the procedures is that the optimal inspection and

maintenance plan is one which yields the minimum expected total costs for maintaining the

system throughout its anticipated life (design decisions may also be ‘optimised’ by including

the initial costs). The optimisation can be summarised mathematically as:

(3.2)

where is the expected cost associated with failure,

is the expected cost of inspection,

is the expected cost associated with maintenance or repair,

is the probability of failure, and is the target.

Using a very similar methodology a software system for Inspection and Maintenance planning

of fixed offshore str uctures using Reliability based methods (IMREL) under an EC funded

THERMIE project known as Reliability based Inspection Scheduling (RISC) see Faber et al, 1994;

Dharmavasan et al, 1994; Peers et al,1994; and Goyet et al,1994. The basic methodology has

been linked with a knowledge-based system (Peers et al,1994), and some case studies are

presented in Goyet et al,1994.

A hybrid approach is suggested by Descamps et al.,1996 who propose a targeted inspection

planning methodology which is based on a semi-probabilistic approach , followed by a

probabilistic approach. The semi-probabilistic approach is based on a quantitative risk-based

ranking (indexing) system, and its aim is to identify critical members. Together with engineering

judgement an inspection programme can be developed which maintains the level of confidence

in the integrity of the structure. Alternatively the member criticality information can be used with

a probabilistic approach which is based on detailed risk analysis; its objective is to determine

the overall financial risk associated with failure sequences starting with the failure of each

C811\01\007R Rev O August 2002 Page 3.8 of 3.18

identified critical component. Risk is taken as the measure of inspection priority, and is

expressed as the probability of failure multiplied by the estimated consequential costs of failure.

Thus, for a simplified failure sequence consisting of member failure (event ), and structural

collapse (event ) under extreme environmental loading following failure of member 0, the

expected costs associated with member failure are given by:

(3.3)

where is the probability or likelihood of member failure due to progressive deterioration

(ie. fatigue or corrosion), or accidental damage (ie. ship impact, dropped object etc)

determined from Fault Tree Analysis,

is the probability of structural collapse given the initial member failure ,

and is evaluated from structural reliability analysis,

and is assessed from Cost Analysis.

Onoufriou et al, 1994 present the application of reliability based optimised inspection planning

(OIP) techniques to a number of Nor th Sea jackets. The paper states that the analysis, which

was undertaken using the PROBAN and PROFAST programs, achieved significant safety and

cost benefits for both new and existing platforms.

Monte Carlo simulation can also be used to update reliability estimates to account for inspection

information (by sampling from modified distributions) as discussed by Oakley et al,1994. Their

approach, together with a very simplified method for estimating system reliability, has been

applied to Nor th Sea platforms. The paper concludes that critical joints were identified for

inspection and a higher reliability was available per unit cost.

A number of quantitative risk-based approaches have been proposed for pipelines. However,

one of the main limitations of the published quantitative risk approaches for pipelines is that they

typically base the failure probability estimates on historical failure rates.

Nessim, M. M. and Stephens, M.J. 1995 illustrates a framework for “risk-based optimisation

of pipeline integrity maintenance”. Their approach is based on system prioritisation to rank

pipeline segments with respect to the need for integrity maintenance; and decision analysis to

assess available maintenance alternatives and determine the optimal choice for each targeted

segment. They suggest that failure rates are estimated from publicly available data, company

specific information and subjective judgement, but point out that for the process to be

meaningful the estimates must reflect the specific attributes of the line segment under

investigation.

C811\01\007R Rev O August 2002 Page 3.9 of 3.18

A number of quantitative risk approaches have also been proposed to assess specific risks in

pipelines; these include corrosion and geotechnical hazards.

Reliability analysis has also been applied to estimate failure probabilities for a number of other

pipeline failure modes, including:

! upheaval buckling (Mork et al, 1995a)

! cross-flow vortex shedding (Mork et al, 1995b)

! pipeline spans (Roland et al,1995)

! dropped objects (Katteland, L. H. and Oygarden, B., 1995)

This list is by no means exhaustive.

A major joint industry project, the SUPERB project for Submarine Pipeline Reliability Based

Design (see Sotberg et al, 1996) was initiated in 1991 to develop and apply risk and reliability

procedures to pipeline design. The project has developed limit states, target reliabilities, and

calibrated safety factors for a number of design-based applications.

A recommended 'best practice' approach to a risk / reliability based system for the integrity

management of pipelines, and in particular inspection scheduling, is detailed in Appendix G.

3.3 SPATIAL AND TEMPORAL VARIABILITY

Recent work (Mork et al.,1999 & Fyrileiv et al., 2000) has addressed the issue of the spatial and

temporal variability of pipeline free spans using a reliability approach and probabilistic input.

Whereas there are established procedures to assess the ultimate and fatigue limit states for

stationary spans (which are generally 'designed-for' spans), this is not the case for spans that

develop, migrate and, perhaps, self correct with time (which are generally unplanned-for defect

spans). For instance, for non-stationary spans (that might occasionally become 'long') a fatigue

calculation based on the extreme length (and therefore, probably, extreme dynamic response)

may be over-conservative and lead to unnecessary intervention expenditure. Similarly,

conclusions reached about acceptable spans in pipelines assumed to be constantly in operation

may be inappropriate for pipeline free spans where the system is shut down for significant

periods and where, therefore, the variation of axial loads in the pipeline result in a change to

natural frequency and thus dynamic response. The above referenced work reports on the use

of survey data to estimate both past and future span behaviour and to thereby address the

effects of short term span length and varying operational conditions on the ultimate and fatigue

limit states of the pipeline. The authors conclude that, for the specific pipeline investigated,

failure to allow for spatial and temporal variation of parameters such as span length, leads to

C811\01\007R Rev O August 2002 Page 3.10 of 3.18

unnessarily conservative estimates of critical span length.

Using such a sophisticated analytical approach is, of course, highly dependent on having high

quality continuous data sets of the relevant parameters and is very system specific.

C811\01\007R Rev O August 2002 Page 3.11 of 3.18

Probability Consequence

High 3 6 9

Medium 2 4 6

Low 1 2 3

Low Medium High

Table 3.1 Example of “Boston Square”

Failure

mechanism

Probability

(Pf)

Consequence

(C)

Risk

(= Pf × C)

Inspection

value

(Iv)

Inspection

criticality

(= Pf × C × Iv)

Spanning 2 2 4 3 12

Instability 2 1 2 1 4

Thermal

buckling

1 1 1 2 2

Impact 1 1 1 1 1

External

corrosion/CP

system

1 2 2 3 6

Table 3.2 Example of use of Boston Cube

C811\01\007R Rev O August 2002 Page 3.12 of 3.18

Figure 3.1 Illustration of Effect of Uncertainty in Span Data and Computed

DETERMINISTIC ASSUMPTIONS

SPAN LENGTH

Observed Computed Allowable

EFFECT ON UNCERTAINTY OF SPAN DATA

AND MODEL PARAMETERS

SPAN LENGTH

A B

Change with time?Change with time?

EFECT ON UNCERTAINTY

OF TIME DEPENDENCE A

A

A B

SPAN LENGTH

A: Uncertainty associated with span data B: Uncertainty associated with calculated acceptable span length

Allowable Span Length and the Additional Uncertainty Associated with Time Dependency

C811\01\007R Rev O August 2002 Page 3.13 of 3.18

PIPELINE ON SEABED (OR IN OPEN TRENCH)

PIPELINE BURIED (INCLUDING TRENCHED)

Figure 3.2 Possible End Conditions

C811\01\007R Rev O August 2002 Page 3.14 of 3.18

LEVEL OF AMBIENT

De

SEABED MUST BE

SELECTED s

h

Wbottom

W trench

Wspoil

e

h depth of trench (below ambient seabed)

s height of spoil (scour or trenching) (above ambient seabed)

trench width (top of spoil heaps)Wspoil

trench width (at ambient seabed level)Wtrench

width of bottom of trenchWbottom

D pipeline external diametere

e gap below pipeline

Figure 3.3 Trench Configuration Parameters

C811\01\007R Rev O August 2002 Page 3.15 of 3.18

Figure 3.4 Possible Error in Interpretation of Survey Data (Function of Span History)

C811\01\007R Rev O August 2002 Page 3.16 of 3.18

SPAN - AS REPORTED (two spans with buried section between)

TRANSVERSE PROFILES

ACTUAL SPAN (having grown axially, settled at mid span, self-buried at mid-span)

Model A Model B

Figure 3.5 Affect of Model Assumption and Parameter

Uncertainty on Calculated Acceptable Span Length

0 10 20 30 40 50 60

KP

0

20

40

60

80

100

120

140

160

180

200

Free

span

leng

th (m

)

1991 1992 1993

Figure 3.6 Typical Variation of Span Length and Location as Reported in Annual Surveys

C811\01\007R Rev O August 2002 Page 3.17 of 3.18

e no inspection0

e 1

e 2

Expe

rimen

t cho

ice

(by

deci

sion

mak

er)

Actio

n ch

oice

(by

deci

sion

mak

er)

a 1

a 2

a 3

q 1

q 2

q 3

z

z 1

z 2

z 3

a 1

a 2

a 3

a 1

a 2

a 3

q 1

q 2

q 3

q 1

q 2

q 3

4

Outc

ome

(by

Natu

re)

Stat

e(b

y Na

ture

)

U( e z a q )0 0 2 2

U( e z a q )1 3 2 2

e aU( z q )2 3 2 2

Experiment E Outcome Z Action A State Q Value U

Figure 3.7 Illustrative Example of a Decision Tree

C811\01\007R Rev O August 2002 Page 3.18 of 3.18

4. DATA FOR SPAN ASSESSMENT

4.1 PREAMBLE

The data required for assessment of a pipeline free-span and its required level of accuracy and

/ or uncertainty is highly dependent of the analytical approach that is to be utilised in evaluation

of the span. Collection of free-span data is a very expensive activity and an appropriate balance

is necessary between the data collection costs and the value it might add to the assessment

process and thus the safe elimination of any remedial inter ventions. Sensitivity analysis in

respect of acceptable span length, as a function of data uncertainty, is reported in BOMEL, 1995

(which is reproduced in Appendix H); the results strongly suggest that there was little sensitivity

of acceptable span length to data uncertainty, except, perhaps, if significant improvement could

be made to all the data inputs. It is necessary to ensure that high levels of data accuracy and

therefore low levels of data uncertainty are not spuriously specified relative to the uncertainty

in the overall assessment process.

4.2 DATA CLASSES

A detailed breakdown of the data into the three classes of: pipeline, operational, environmental

and inspection is given in Table 4.1 for static analysis and Table 4.2 for dynamic analysis.

Some data have to be processed by means of calculation into suitable input data for analysis.

The pipeline data include geometrical and material proper ties; these are used in the analytical

model, the analytical criteria and the material characteristic. The axial restraint factor is used

to approximate the degree of suppression of longitudinal strains in the pipe wall due to the

interaction of the pipe with the seabed.

The operational data encompass installation (residual lay tension) and those related to the pipe

contents: its density, pressure and temperature; these are used to derive some of the loadings

applied to the span.

The environmental data include the parameters that relate to the fluid loading on the pipeline

(for example, water depth and various wave and current data). They also contain parameters

defining the mechanical interaction between the pipe and the seabed (for example, soil modulus

and Poisson’s ratio at the span shoulders); these particular parameters influence the support

conditions at the shoulder of the pipeline.

C811\01\007R Rev O August 2002 Page 4.1 of 4.4

4.3 DATA SOURCES

Appropriate sources of data must be used. If no data are available for residual lay tension or

axial restraint factor, then these are to be estimated conservatively and included if they

adversely affect the pipeline.

C811\01\007R Rev O August 2002 Page 4.2 of 4.4

Data Symbol

Pipeline Data Pipe outside diameter D

Pipe nominal wall thickness t

Corrosion coat thickness te

Weight coat thickness tc

Steel density rs

Corrosion coat density re

Weight coat density rc

Steel elastic modulus E

Steel Poisson’s ratio n

SMYS steel sy

Steel thermal expansion coefficient a

Axial restraint factor la

Pipeline heading j

Operational Data

Residual lay tension N Internal pressure pi

Contents density ri

Contents temperature qi

Design life of pipeline Tp

Environmental Data

Minimum water depth at LAT h

Local seawater density ra

Local seawater temperature qa

Current velocity data -

Wave data -

Hydrodynamic drag coefficient Cd

Hydrodynamic added mass coefficient Ca

Soil elastic modulus at span shoulders Ef

Soil Poisson’s ratio at span shoulders nf

Longitudinal friction coefficient at span shoulders mL

Transverse friction coefficient at span shoulders mT

Inspection Data

Kilometre point at start of span KPs

Kilometre point at end of span KPe

Freespan length Lobs

Gap beneath span G

Marine growth information -

Table 4.1 Data Classes of Static Analysis

C811\01\007R Rev O August 2002 Page 4.3 of 4.4

Pipeline data

Pipe outside diameter D

Pipe nominal wall thickness t

Corrosion coat thickness te

Weight coat thickness tc

Steel density Ds

Corrosion coat density De

Weight coat density Dc

Steel elastic modulus E

Steel Poisson's ratio <

SMYS steel Fy

Steel thermal expansion coefficient "

Axial restraint factor 8

Operational data

Residual lay tension N

Internal pressure pi

Contents density Di

Contents temperature 2i

Environmental data

Minimum water depth at LAT

Local sea water density

Local sea water temperature

Hydrodynamic drag coefficient

Hydrodynamic added mass coefficient

Soil modulus at span shoulders

Current statistics

Wave statistics

h

Dw

2a

Cd

Cm

Ks

Table 4.2 Data Classes for Dynamic Analysis

C811\01\007R Rev O August 2002 Page 4.4 of 4.4

5. SURVEY METHODS

5.1 PREAMBLE

There are a number of inspection technologies and techniques that can be used to identify free-

spans on submarine pipelines. These techniques normally require the mobilisation of a

sophisticated and costly marine spread which is subject to operability constraints imposed by

environmental conditions. It is therefore imperative that both the quality of data required in

terms of type, accuracy and uncertainty and the survey frequencies are appropriately specified

such that the associated costs are proportionate to the costs of analysis, intervention and / or

the consequences of system failure. These considerations suggest that a "Best Practice"

survey programme should be based on a risk /reliability based approach.

5.2 SURVEY TECHNIQUES

The lowest cost inspection technique for the detection of free-spans is normally the use of a

towed fish with side-scan sonar capability. Reliability of span detection can be improved by

making two passes, one on each side of the pipeline. The use of Remotely Operated Towed

Vehicles (ROTVs), which can be "steered", can give enhanced data quality at a relatively small

marginal cost. Side-scan techniques are, however, dependent on the competency of the

survey party to interpret the records accurately; a subjective process open to human error. It

is of ten beneficial, but costly, to visually confirm by camera mounted Remotely Operated

Vehicle (ROV) any spans identified by side-scan, particularly to correctly identify touch down

points. The side-scan technique does, however, have the advantage that long lengths of

pipeline can be inspected in a relatively shor t time and that a relatively inexpensive mother ship

can be used. Locational accuracy is limited by the offset of the fish to the vessel.

A more expensive option is to sur vey the pipeline by ROV with visual cameras and scanning

sonar. This technique may be optimal if the survey is addressing other factors in addition to

free-spans (e.g. weight coat condition, cathodic protection, anode depletion etc.). The process

is relatively slow and therefore costly and requires an appropriate vessel to support the ROV

activities. Interpretation of the visual findings is relatively easy and accurate and location can

be quite precisely determined relative to datums. Good underwater visibility is, of course,

necessary. The use of ROVs is also preferable when the pipeline is in a trench which can

shadow towed fish side-scan. Trench profiles can also be determined by ROV mounted

scanning sonar equipment.

C811\01\007R Rev O August 2002 Page 5.1 of 5.2

Work is being undertaken to develop intelligent inertial pipeline 'pigs' to map the shape of a

pipeline. Such data could be used to determine stress levels due to deformation. The use of

radio-active sources to determine when a pipeline is in contact with the sea-bed is also being

considered. Although development and hire of such tools will be expensive, they should provide

high quality data and may prove to be economic by the significant savings that could be made

by elimination of the marine spread.

Where probabilistic techniques are being used, and account taken of the temporal and spatial

variability of spans as discussed in Section 3.3 above, it is particularly important to ensure

consistency of both inspection methodology and sur vey datums so that trends in span length

and location are accurately determined.

C811\01\007R Rev O August 2002 Page 5.2 of 5.2

6. ASSESSMENT BENCHMARKING

A multitude of different methodologies and analytical tools have been developed by pipeline

operators and service companies for both optimisation of survey activities and assessment of

survey findings. Some of these are proprietary to the owners and others are commercially

available. Some methodologies employ generic tools such as standard finite element packages.

The tools vary in sophistication and the influencing parameters included in the models they

employ. The degrees of refinement available range from simple bending models to applications

that take into account membrane action, levels of axial constraint, sub-grade reaction, and soil

friction etc..

Selection of the most appropriate tool will be dependent on the amount and quality of the

available input data, the cost of intervetnion to ‘correct’ the span and the perceived

consequences of pipeline failures.

The quality, and therefore utility, of the output of these tools is of ten highly dependent on the

experience and ability of the user to appropriately select values for the key parameters and to

ensure the models realistically represent the actual conditions of the pipeline system. The work

reported in BOMEL,1995 (repeated in Appendix H) does, however, suggest that in terms of

minimising intervention costs there is generally more to be gained by using more sophisticated

analytical techniques than in expenditure to obtain refined data.

To date there has not been a comprehensive study of the relative utility of available systems

to assess their suitability for incorporation in assessment procedures. A study to benchmark

both the results of using different tools to assess the same span and application of the same

tool on the same span by different users would be feasible and provide useful data. The

following packages are presently identified for possible inclusion in such a benchmarking study:

! ALKYON: "PIPESIN" / "PIPECAST"

! ANDREW PALMER: "PLUS ONE" / "SPAN"

! BOMEL: Proprietary software associated with 'tiered' approach to assessment /

ABAQUS

! DHI: GSPAN

! FENRIS (SESAM)

! DNV / ABAQUS / In-house EXCEL Spreadsheet / FATFREE

! JPK: "SIMULATOR" / "SPANS"

! LR: Proprietary software

C811\01\007R Rev O August 2002 Page 6.1 of 6.1

! PRC!: "FREESPAN" (originally developed by EXXON)

! RAMBOL: RHSpan / ANSYS ROSAP

! RCM: "OFFPIPE"

! SOUTHWEST APPLIED MECHANICS INC.: "SPAN"

! THALES: "SAGE PROFILE"

! ZENTECH: "PIPELINE"

Several organisations also use general purpose finite element packages such as ABAQUS and

develop ad-hoc models of specific spans at various levels of sophistication.

C811\01\007R Rev O August 2002 Page 6.2 of 6.1

7. DISCUSSION OF CURRENT PRACTICE

Although it is known that there is a wide variety of approaches being taken to the management

of pipeline spans there is, at present, little to no information on the extent to which the various

philosophies are used or on the relative cost / benefits so obtained.

Pipeline failures as a result of free-spanning are thought to be rare and it is possible that there

have actually been no instances of this failure mode occurring. Nevertheless, there is a strong

industry view that such failure potential is real and must be appropriately managed. There is,

however, apparently a high variation in the level of concern and resource allocation devoted to

the issue.

As discussed above, there is an apparent lack of consensus of the methodology to be used in

respect of unplanned-for defect free-spans as opposed to those intentionally introduced in the

design and construction process for which there are well established codes, guidance and

procedures and where the associated analytical tools are developed and available.

Whereas adoption of a contingency approach to assessment of spans that develop in service

is sensible, there would appear to be inadequate information available to assist in the decision

process to determine which approach is most appropriate for any given pipeline system in terms

of the risk it presents - that is the probability of a failure occurring and the potential associated

consequences.

Because of the large number of variables in the assessment process it is considered that the

use of a probabilistic / reliab ility type approach is optimal in many circumstances. However,

the extent to which this approach is actually used is unknown.

Although it is evident that some pipeline operators keep comprehensive records of pipeline span

management in terms of surveys, assessment and remedial works, there is no common

database for the collection of such information and therefore combining the various data-sets

to allow further statistical analysis is perceived to be difficult.

The use of a 'tiered' approach to assessment, as described above, to allow initial screening out

of insignificant spans is thought to represent a 'Best Practice' in that it allows resources to be

focussed to optimise cost / benefit on the overall hazard management process in respect of

spans. When combined with a reliability approach the 'tiered' methodology is likely to represent

a favourable scenario for development into an industr y wide 'Best Practice' approach to span

management.

C811\01\007R Rev O August 2002 Page 7.1 of 7.1

8. WAY FORWARD

As the above Sections indicate, there has been a very significant amount of work undertaken

in respect of pipeline free-spans. However, it is considered unfortunate that the development

has generally been undertaken 'bottom-up' in response to various specific needs rather than as

a structured 'top-down' strategic approach to the issues involved. It is therefore perceived that

there is significant potential for fur ther improvement that could be realised by adopting a

systemic approach to the subject. Such an approach would present an opportunity to provide

great benefit to all stakeholders in terms of reduced costs, and improved safety and

environmental protection by developing universally acceptable 'Best Practice' guidance on the

management of unplanned-for defect free-spans.

A staged approach to development of such guidance could be adopted.

Initial development work might consist of collection of data from pipeline operators to try and

better understand the range and nature of current management practices in this area.

Following this a formal benchmarking exercise could be undertaken to assess the respective

merits and demerits of the procedures and processes identified from the survey to identify best

candidates for further development.

The 'tiered' approach, detailed for certain cases in the appendices, can be fur ther developed and

extended to from a complete set of assessment processes; further risk / reliability aspects

could be included in the procedures.

The output from the above could then, ultimately, be consolidated into a high quality guidance

document.

C811\01\007R Rev O August 2002 Page 8.1 of 8.1

9. REFERENCES

Benjamin JR, & Cornell CA. ‘Probability, Statistics, and Decision for Civil Engineers’, McGraw-

Hill, 1970.

Bruce J. 'The Inertial Geometry Pig'. ASPECT 1994.

Bugler J. 'Pipelines Safety Regulations - HSE's Approach'. Risk and Reliability and Limit States

in Pipeline Design and Operations, Aberdeen, May 1996.

Descamps B, Woolley KJ, & Baker MJ. ‘Targeted subsea inspection of offshore structures

based on risk and criticality’, Proc 28th OTC, Houston, 1996.

Det Norske Veritas. 'Guideline No 14 - Free Spanning Pipelines', Proposal issued for comment

(confidential), December 1997 (Modified).

Dharmavasan S, Peers SMC, Faber MH, Dijkstra OD, Cervetto D, & Manfredi E. ‘Reliability

based inspection scheduling for fixed offshore structures’, Proc 13th OMAE Conf, ASME,

Houston, 1994.

Ellinas CP et al. 'PARLOC - Pipeline and Riser Loss of Containment: North Sea Experience'.

ISOPE 1995.

Faber MH, Dharmavasan S, & Dijkstra OD. ‘Integrated analysis methodology for reassessment

and maintenance of offshore structures’, Proc 13th OMAE Conf, ASME, Houston, 1994.

Fyrileiv O, Mørk K J and Rongued K. 'TOGI Pipeline - Assessment of Non-Stationary free spans',

Proc ETCE / OMAE Joint Conf, New Orleans, 2000.

Goyet J, Faber MH, Paynard J-C, & Maroini A. ‘Optimal inspection and repair planning: Case

studies using IMREL software’, Proc 13th OMAE Conf, ASME, Houston, 1994.

Henderson PA. ‘Engineering and managing a pipeline integrity programme’, Proc Conf on Risk

& Reliability & Limit States in Pipeline Design & Operations, Aberdeen, 1996.

Jiao G, & Sotberg T. ‘Risk and reliability based pipeline design’, Proc Conf on Risk & Reliability

& Limit States in Pipeline Design & Operations, Aberdeen, 1996.

C811\01\007R Rev O August 2002 Page 9.1 of 9.3

Jones D. 'Use of High Resolution Internal Inspection and Fitness for Purpose to Ensure Pipeline

Reliability'. Risk and Reliability and Limit States in Pipeline Design and Operations, Aberdeen,

May 1996.

Katteland LH, & Øygarden B. ‘Risk analysis of dropped objects for deep water development’,

Proc 14th OMAE Conf, ASME, Copenhagen, 1995.

Kaye D. ‘Optimisation of pipeline inspection using risk and reliability analysis’, Proc Conf on

Risk & Reliability & Limit States in Pipeline Design & Operations, Aberdeen, 1996.

Lilley J R. 'Pipeline Integrity Information for Risk Management Purposes through Advanced

Inspection technology'. Risk and Reliability and Limit States in Pipeline Design and

Operations, Aberdeen, May 1996.

Madsen HO, Skjong RK, Tallin AG, & Kirkemo F. ‘Probabilistic fatigue crack growth analysis of

offshore structures with reliability updating through inspection’, Proc of Marine Structural

Reliability Symposium, SNAME, Arlington, Virginia, 1987.

Madsen HO, & Sørensen JD. ‘Probability-based optimisation of fatigue design, inspection and

maintenance’, Proc 4th IOS Conf, Glasgow, 1990.

Mørk K, Bjørnsen T, Venås A, & Thorkildsen F. ‘A reliability based calibration study for upheaval

buckling of pipelines’, Proc 14th OMAE Conf, ASME, Copenhagen, 1995.

Mørk K J, Fyrileiv O, Nes H and Sortland L. 'A Strategy for Assessment of Non-stationary Free

Spans', Proc 9th. IOPE Conf., ISOPE, Brent, 1999.

Mørk K, Verley R, & Bruschi R. ‘Troll oil pipeline: Calibration of safety factors for cross-flow

vibrations of spans on very uneven seabeds’, Proc 14th OMAE Conf, ASME, Copenhagen, 1995.

Mørk K J, Vitali L and Verley R. 'The MULTISPAN Project: Design Guideline for Free Spanning

Pipelines'. Proceedings OMAE, Yokohama, Japan, April 1997.

MTD (Marine Technology Directorate) Ltd.. ‘Underwater inspection of steel offshore

installations: implementation of a new approach’, MTD Ltd. publication 89/104, London, 1989.

Nessim MA, & Stephens MJ. ‘Risk-based optimisation of pipeline integrity maintenance’, Proc

14th OMAE Conf, ASME, Copenhagen, 1995.

C811\01\007R Rev O August 2002 Page 9.2 of 9.3

Oakley A, Brown M, Warren PA, & Barltrop NPD. ‘Optimised inspection scheduling for offshore

structures - a probabilistic approach’, Proc BOSS Conf, Massachusetts, 1994.

Onoufriou T, Fowler D, & Smith JK. ‘Reliability based optimised inspection planning’, Proc BOSS

Conf, Massachusetts, 1994.

Parkash S. 'Introduction of Pipelines Safety Regulations '96'. ASPECT 1996.

Peers SMC, Tang MX, & Dharmavasan S. ‘Knowledge based approach to inspection planning

for offshore structures’, Proc 13th OMAE Conf, ASME, Houston, 1994.

Robertson J L M, Smart D and Al-Hassan T. 'Offshore Nor th Sea Pipeline and Riser Loss of

Containment Study (PARLOC) Applications and Limitations in the Assessment of Operating

Risks'. OMAE 1995.

Rolond KO. ‘A probabilistic approach to the lengths of free pipeline spans’, Applied Ocean

Research, 17, pp225-232, 1995.

Rolond KO, Nielsen NR, Tura F, Bryndum MB, & Smed PF. ‘Reliability based calibration of

partial safety factors for design of free pipeline spans’, Proc 14th OMAE Conf, ASME,

Copenhagen, 1995.

Sotberg T, Bruschi R and Mørk K. 'The SUPERB Project: Reliability-Based Design Guideline for

Submarine Pipelines'. OTC Paper 8220, Offshore Technology Conference, Houston, May 1996.

Thayne A T. 'Pipelines Safety Regulations 1996 - Impact and Implications'. ASPECT 1996.

Tura F, Bryndum M B and Nielsen N J R. 'Guidelines for Free Spanning Pipelines: Outstanding

Items and Technological Innovations'. ASPECT 1994.

Tveit O J. 'Dealing with Uncertainties - The Use of Risk Analysis in Decision Making'. OMAE

1995.

C811\01\007R Rev O August 2002 Page 9.3 of 9.3


Recommended