76
DWLBC REPORT Best Practice Framework for the Monitoring and Evaluation of Water Dependant Ecosystems 1: Framework 2007/12

DWLBC REPORT
Best Practice Framework
for the Monitoring and
Evaluation of Water
Dependant Ecosystems
1: Framework
2007/12

Best Practice Framework for the Monitoring and Evaluation of Water Dependant Ecosystems 1: Framework
Jeremy Wilkinson1, Nicholas Souter2 and Peter Fairweather1
1. Flinders Research Centre for Coastal and Catchment Environments (FRC3E), Flinders University of South Australia
2. Knowledge and Information Division Department of Water, Land and Biodiversity Conservation
May 2007
Report DWLBC 2007/12
Knowledge and Information Division Department of Water, Land and Biodiversity Conservation 25 Grenfell Street, Adelaide GPO Box 2834, Adelaide SA 5001 Telephone National (08) 8463 6946 International +61 8 8463 6946 Fax National (08) 8463 6999 International +61 8 8463 6999 Website www.dwlbc.sa.gov.au Disclaimer The Department of Water, Land and Biodiversity Conservation and its employees do not warrant or make any representation regarding the use, or results of the use, of the information contained herein as regards to its correctness, accuracy, reliability, currency or otherwise. The Department of Water, Land and Biodiversity Conservation and its employees expressly disclaims all liability or responsibility to any person using the information or advice. Information contained in this document is correct at the time of writing. © Government of South Australia, through the Department of Water, Land and Biodiversity Conservation 2007 This work is copyright. Apart from any use as permitted under the Copyright Act 1968 (Cwlth), no part may be reproduced by any process without prior written permission from the Department of Water, Land and Biodiversity Conservation. Requests and inquiries concerning reproduction and rights should be addressed to the Chief Executive Officer, Department of Water, Land and Biodiversity Conservation, GPO Box 2834, Adelaide SA 5001. ISBN-978-1-921218-48-4 Preferred way to cite this publication Wilkinson, J, Souter, N, & Fairweather, P 2007, Best Practice Framework for the Monitoring and Evaluation of Water-Dependent Ecosystems 1: Framework, DWLBC Report 2007/12, Government of South Australia, through Department of Water, Land and Biodiversity Conservation, Adelaide.

Report DWLBC 2007/12 Best Practice Framework for the Monitoring and Evaluation of Water Dependant Ecosystems 1: Framework
iii
FOREWORD
South Australia’s unique and precious natural resources are fundamental to the economic and social wellbeing of the State. It is critical that these resources are managed in a sustainable manner to safeguard them both for current users and for future generations.
The Department of Water, Land and Biodiversity Conservation (DWLBC) strives to ensure that our natural resources are managed so that they are available for all users, including the environment.
In order for us to best manage these natural resources it is imperative that we have a sound knowledge of their condition and how they are likely to respond to management changes. DWLBC scientific and technical staff continues to improve this knowledge through undertaking investigations, technical reviews and resource modelling.
Rob Freeman CHIEF EXECUTIVE DEPARTMENT OF WATER, LAND AND BIODIVERSITY CONSERVATION

Report DWLBC 2007/12 Best Practice Framework for the Monitoring and Evaluation of Water Dependant Ecosystems 1: Framework
iv

Report DWLBC 2007/12 Best Practice Framework for the Monitoring and Evaluation of Water Dependant Ecosystems 1: Framework
v
ACKNOWLEDGEMENTS
This report has been produced with the support of the Australian Government through the National Action Plan for Salinity and Water Quality (NAP) with the Centre for Natural Resource Management.
The authors would like to thank all those who donated their time to attend and contribute to the project workshops, and to Gillian Napier who co-ordinated the workshop meetings. Thanks also to other contributors to this process, in particular John Gross of the United States National Parks Service and the body of work produced for inventory and monitoring of ecosystems in US National Parks and Reserves. This material has been invaluable and has made a major contribution to the work presented here.

Report DWLBC 2007/12 Best Practice Framework for the Monitoring and Evaluation of Water Dependant Ecosystems 1: Framework
vi

Report DWLBC 2007/12 Best Practice Framework for the Monitoring and Evaluation of Water Dependant Ecosystems 1: Framework
vii
CONTENTS FOREWORD........................................................................................................................... iii ACKNOWLEDGEMENTS........................................................................................................v EXECUTIVE SUMMARY .........................................................................................................1 INTRODUCTION......................................................................................................................3
WATER DEPENDENT ECOSYSTEMS...............................................................................3 MONITORING AND EVALUATION.....................................................................................3 ADVANTAGES OF A FRAMEWORK..................................................................................4 WHO IS THE BEST PRACTICE FRAMEWORK INTENDED FOR? ...................................5 FRAMEWORK STRUCTURE AND OUTLINE.....................................................................6
Group 1 – Rationale and priorities....................................................................................7 Group 2 – Conceptual understanding ..............................................................................8 Group 3 – Monitoring programme ....................................................................................8 Group 4 – Implement and assess.....................................................................................8
WDE INFORMATION DIAGRAM ........................................................................................9 THE FUTURE......................................................................................................................9
Data management..........................................................................................................11 Development needs .......................................................................................................11
THE FRAMEWORK...............................................................................................................13 HOW TO USE THE FRAMEWORK...................................................................................13 GROUP 1 – RATIONALE AND PRIORITIES ....................................................................14
Task 1.1 – Key questions ...............................................................................................14 Task 1.2 – Review the objectives...................................................................................16 Task 1.3 – WDE Summary table and priorities...............................................................23 Task 1.4 – Identify and rank risks and threats................................................................26
GROUP 2 – CONCEPTUAL UNDERSTANDING..............................................................30 Task 2.1 – Creating a conceptual diagram.....................................................................31 Task 2.2 – Generate a Stommel diagram for temporal and spatial bounds ...................33 Task 2.3 – Describe the wetting/drying and event response..........................................37 Task 2.4 – Build stressor or state-and-transition model .................................................40
GROUP 3 – MONITORING PROGRAMME ......................................................................44 Task 3.1 – Review monitoring ........................................................................................44 Task 3.2 – Review and/or select indicators ....................................................................46 Task 3.3 – Choose measures and frequencies..............................................................52 Task 3.4 – Consider resources ......................................................................................54
GROUP 4 – IMPLEMENT AND ASSESS..........................................................................55 Task 4.1 – Implementation .............................................................................................55 Task 4.2 – Collect data...................................................................................................58 Task 4.3 – Evaluate and assess.....................................................................................59 Task 4.4 – Review results against targets......................................................................61
GLOSSARY ...........................................................................................................................63 REFERENCES.......................................................................................................................67

CONTENTS
Report DWLBC 2007/12 Best Practice Framework for the Monitoring and Evaluation of Water Dependant Ecosystems 1: Framework
viii
LIST OF FIGURES
Figure 1. An adaptive management cycle for WDEs ............................................................4 Figure 2. Layout of the Framework in this workbook ............................................................6 Figure 3. Structure, flow and arrangement of the Framework ..............................................7 Figure 4. A WDE information diagram for monitoring, management and information
including: stressor model; management module; and monitoring programme ..........................................................................................................10
Figure 5. A decision pathway for matching monitoring activities to needs..........................22 Figure 6. A pictorial conceptual diagram showing major components and water
movement in a coastal pool connected to the sea...............................................32 Figure 7. Example Stommel diagram for faecal indicator dynamics in creek systems .......34 Figure 8. Stream nitrate concentration (Afon Hore, Plynlimon, Wales) demonstrating
response dynamics at three temporal scales ......................................................34 Figure 9. Blank Stommel diagram to copy and complete for WDE drivers, stressors,
attribute dynamics, monitoring objectives............................................................36 Figure 10. Wetting/drying cycles and changes in water chemistry in temporary
wetlands showing seasonal changes in invertebrate composition ......................38 Figure 11. A legend of symbols and basic structure for use in conceptual models,
for distinguishing between the roles of model components .................................40 Figure 12. Blank stressor model template ............................................................................42 Figure 13. Blank WDE information diagram..........................................................................51 Figure 14. The information and reporting pyramid: from sound science to effective
communication.....................................................................................................60
LIST OF TABLES
Table 1. Key monitoring questions ....................................................................................15 Table 2. Determine and review objectives.........................................................................16 Table 3. SMART objectives ...............................................................................................20 Table 4. Questions associated with monitoring need ........................................................21 Table 5. WDE summary table............................................................................................24 Table 6. Summary of threats/risks and what is at risk .......................................................26 Table 7. Threat summary table..........................................................................................27 Table 8. WDE attributes for inclusion in a Stommel diagram ............................................35 Table 9. Summary of phased and event system response characteristics........................39 Table 10. WDE attributes to incorporate in your stressor model(s) .....................................41 Table 11. Monitoring review questions ................................................................................45 Table 12. WDE indicators and their attributes .....................................................................47 Table 13. Indicator/variable monitoring information table ....................................................53

Report DWLBC 2007/12 Best Practice Framework for the Monitoring and Evaluation of Water Dependant Ecosystems 1: Framework
1
EXECUTIVE SUMMARY
The Best Practice Framework for the Monitoring and Evaluation of Water Dependent Ecosystems is a comprehensive guide for developing robust monitoring programmes. The Framework comprises two parts: the Framework; and its supporting Technical Resource. The Framework provides the information necessary to design and undertake a monitoring programme. The Technical Resource provides additional explanation and examples to support the concepts introduced by the Framework.
The components of the Framework are laid-out sequentially and comprise a series of four groups of tasks that enable an effective monitoring programme to be developed.
Group 1 – Rationale and priorities
The first group of tasks provides the justification for developing a monitoring programme. The monitoring objectives are determined and placed into one or more categories. The objective category determines what sort of monitoring effort is required and how the monitoring programme develops. The physical and biological nature of your Water Dependent Ecosystem (WDE) and its risks and threats are also determined at this stage.
Group 2 – Conceptual understanding
The next stage of the Framework is the development of conceptual diagrams and models. Conceptual diagrams and models may be in the form of: a conceptual diagram, which is a pictorial representation at the landscape or ecosystem scale and includes the major ecosystem components and the influences on condition; a stressor model, which portrays the key stress response relationships affecting the system; and/or a state-and-transition model, which is for systems where there is a progression from one condition through various stages and back to the initial condition. The Framework introduces a standard approach to representing conceptual models.
Group 3 – Monitoring programme
The monitoring programme is designed through a process of indicator selection, determining what to measure and establishing the frequency at which data is collected. The resources required to undertake the monitoring are then calculated.
Group 4 – Implement and assess
The steps required to implement the monitoring programme are determined and guidelines on data collection and storage are provided, along with information on effective data evaluation and assessment. A final review determines whether the monitoring results have met the desired objectives and the effectiveness of the selected indicators. The final step is to incorporate any new system understanding into the WDE conceptual models, maintaining the adaptive management cycle.
The Best Practice Framework is an evolving process requiring continuous development that incorporates the experience gained in its application across the State.

Report DWLBC 2007/12 Best Practice Framework for the Monitoring and Evaluation of Water Dependant Ecosystems 1: Framework
2

Report DWLBC 2007/12 Best Practice Framework for the Monitoring and Evaluation of Water Dependant Ecosystems 1: Framework
3
INTRODUCTION
WATER DEPENDENT ECOSYSTEMS A great number and variety of WDEs are found within South Australia, ranging from estuaries to the River Murray, small ephemeral and perennial streams, groundwater dependent ecosystems (i.e. mound springs) and saline lakes and wetlands. These ecosystems are composed of a wide variety of flora and fauna, including algae, aquatic plants, macroinvertebrates, reptiles, amphibians, mammals, fish and water birds1. As the nature of the WDEs differ, so to will their monitoring needs and objectives. Water dependent ecosystems are threatened by a wide range of processes, such as lack of flow, erosion and pollution. Considerable investment is being channelled into improving the condition of natural resources by State and Federal Government Departments, Natural Resource Management (NRM) Boards and through programmes such as; the National Action Plan for Salinity and Water Quality (NAP) and the Natural Heritage Trust (NHT). Such activities are being implemented by a variety of people including scientists, natural resource managers, land owners, Government (State and Local), NRM Boards, private industry and community groups. This best practice Framework will guide users through a selection process to provide them with the most appropriate techniques for monitoring and evaluating of their WDE.
MONITORING AND EVALUATION South Australia’s Natural Resources Management Plan (DWLBC 2006a) states that monitoring and evaluation are essential to deliver and report on NRM and is vital for programme improvement, accountability and adaptive management. Monitoring and evaluation is the process of undertaking regular data collection, which is then comprehensively analysed to determine if the programme aims and objectives are being met. Monitoring may have multiple goals and monitoring data may be used to detect long-term environmental change, provide insights into the ecological consequences of change and help decision-makers determine if observed change requires a shift in management practices (Noon et al. 1999)2.
The complexity of WDEs and the limited knowledge of their functions make devising a monitoring programme a challenging process (Finlayson and Mitchell 1999). The wide (and justified) interest in all components of biological diversity creates a conundrum; acknowledging the need to simplify the view of ecosystems to begin the process of monitoring, and at the same time recognising that monitoring may need to be broad to consider a range of ecosystem components (Gross 2003; Downes et al. 2002). One way of organising this information is through the development of conceptual models. 1 Additional background information on South Australia’s WDE is provided in Appendix 1 of the Technical Resource document. 2 Additional background information on Monitoring and Evaluation is provided in the Technical Resource document.

INTRODUCTION
Report DWLBC 2007/12 Best Practice Framework for the Monitoring and Evaluation of Water Dependant Ecosystems 1: Framework
4
The need and desire to develop this conceptual understanding was highlighted by participants in both of the workshops held during the development of the Framework. The development of conceptual models is a central part of this Framework.
ADVANTAGES OF A FRAMEWORK The Best Practice Framework provides a set of tools placed within an adaptive management cycle (Fig. 1) that enables WDE practitioners (government agency, academic or voluntary) to: • Set-up or review existing monitoring programmes, such that they deliver useful and
appropriate information on condition and management needs.
• Deliver information that is consistent across the state.
• Manage information in a consistent manner, such that it can be held in a focal data repository.
Reviewsystem
understanding,conceptual
model
Reviewsystem
understanding,conceptual
model
Figure 1. An adaptive management cycle for WDEs.
The development of a state-wide water dependent ecosystem monitoring Framework offers a range of advantages. The experience of the National Parks Service in the United States, where protocols for national park monitoring have been established, suggests that cooperation and sharing of ideas has been fostered by the adoption and application of their protocols (Gross 2003). A summary of beneficial outcomes adapted from Fancy (2003) is provided below:
Promotion of consistency and collaboration so that practitioners can: • Identify the most critical data needs and partnership/cost-sharing opportunities
(maximise the use and relevance of the data; get the most for your monitoring dollar/effort).

INTRODUCTION
Report DWLBC 2007/12 Best Practice Framework for the Monitoring and Evaluation of Water Dependant Ecosystems 1: Framework
5
• Identify any common ground and additional opportunities for collaboration and consistency among approaches, programmes and protocols.
• Share/compare monitoring plans, models and datasets.
• Analyse and report at several levels of scale for different audiences (local, regional, state).
• Provide detailed data to managers and integrate with other operations.
• Make data available to others to assist with synthesis, modelling, and undertake more sophisticated analysis at regional and state scales.
• Develop a network.
• Demonstrate the value of scientific data for WDE stewardship, from which funding and staffing can grow.
As with all adaptive monitoring and management, this Framework is not intended to be prescriptive, but is a guide that aids progress in monitoring and assessment and it is intended that the Framework will be modified and adapted as the process of implementation proceeds.
WHO IS THE BEST PRACTICE FRAMEWORK INTENDED FOR? This Framework has been designed for use by all professionals involved with WDEs in South Australia. It may be used by NRM managers as a structure within which the scope and boundaries of a monitoring programme project brief may be developed. Managers operate at local, regional and state levels, as well as, within agricultural, horticultural, viticultural and mining industries with WDEs on their land. The monitoring programme itself can then be developed by following the Framework. Such a task is likely to be done by technically qualified NRM project officers, agency scientists and consultants. Scientists operating from research institutes and universities may also use the Framework when undertaking monitoring aimed at understanding WDE processes. Guided by technically qualified staff, monitoring programmes may be developed in conjunction with a range of interest groups including: non-governmental organisations (NGOs), land care groups, conservation organisations etc. Whilst the tasks in the Framework may be undertaken by an individual, team work can also play an important part in developing a monitoring framework. The authors have used workshops in developing and testing the Framework and recommend their use in the development of a monitoring programme. Useful information on getting the best out of group decision making, in the context of monitoring, can be found at the website: http://science.nature.nps.gov/im/monitor/VitalSigns.cfm.
The objective is that, irrespective of the level from which the group or individuals are working, the tools and structure of the framework can provide a useful guide to developing consistent WDE monitoring programmes.

INTRODUCTION
Report DWLBC 2007/12 Best Practice Framework for the Monitoring and Evaluation of Water Dependant Ecosystems 1: Framework
6
FRAMEWORK STRUCTURE AND OUTLINE The Framework is structured as a stepwise flow with four main groups that encompass a cycle of investigation, activity, assessment and review. The Framework asks the user to address a number of questions or issues in each section and provide a variety of diagram templates and tables for completion by the practitioner. The layout of the Framework is presented in Figure 2 and its logical structure and flow is presented in Figure 3.
2: Conceptual understanding
Wetting/dryingand event response?
Create conceptualdiagram
Stommel diagram fortemporal and spatial bounds
Build stressor and/or state-and-transition
model
1: Rationale and priorities
Answer key questions
Identify and rank risks and threats
Review M&Eobjectives
WDE summarytable: rankpriorities
3: Monitoring programme
Choose measures and frequencies
Consider resources
Review monitoring
Review/selectindicators
4: Implement and assess
Review resultsagainst targets
Evaluate andassessCollect dataImplement
Figure 2. Layout of the Framework in this workbook.

INTRODUCTION
Report DWLBC 2007/12 Best Practice Framework for the Monitoring and Evaluation of Water Dependant Ecosystems 1: Framework
7
Answer key questions
Identify and rankrisks and threats
Review M&Eobjectives
WDE summarytable &
priorities
Wetting / dryingand event response?
Conceptualdiagram
Stommel diagram fortemporal and spatial bounds
Build stressor and / or state-and-transition
model
Evaluate and assess
Review resultsagainst targets
Choose measures
Consider Resources
Start 1
Start 2
Select indicators
Review monitoring
Collect data
Implement
Figure 3. Structure, flow and arrangement of the Framework.
GROUP 1 – RATIONALE AND PRIORITIES
The Framework begins by prompting you to consider the nature of your problem and whether it is suited to being answered by monitoring. The Framework requires that you consider alternative approaches before starting to design a monitoring programme. If you decide monitoring is required, the next phase of Group 1 requires you to: determine the type of monitoring you will be undertaking; begin to characterise the physical and biological nature of your WDE; and determine risks and threats. With this information you will then be able to determine the necessary rigour your monitoring requires.

INTRODUCTION
Report DWLBC 2007/12 Best Practice Framework for the Monitoring and Evaluation of Water Dependant Ecosystems 1: Framework
8
GROUP 2 – CONCEPTUAL UNDERSTANDING
Central to the Framework is the development of conceptual diagrams and models as an aid to communicating between practitioners, managers, policy-makers and the public. These diagrams/models will also assist with and improve understanding of ecosystem behaviour, functioning and response to driving variables and stresses.
The development of a good conceptual understanding of the system being studied is a prerequisite of monitoring and also influences further monitoring and management decisions. For this reason, there is a strong emphasis on conceptual modelling as a keystone aspect of any monitoring programme. The use of conceptual models, and how they drive understanding, is vital for getting the best out of the adaptive management approach.
The conceptual diagram approach is recommended. This approach is based-on a pictorial representation at the landscape or ecosystem scale which includes the major ecosystem components and the influences on condition; each diagram is accompanied by a concise narrative. In addition to this simplified approach, two further types of conceptual model are recommended: the stressor model; and the state-and-transition model. The stressor model is ideal for portraying the key stress response relationships affecting the system. The state-and-transition model is ideal for systems that have a rainfall-event response or those which have dry-wet-dry seasonal behaviour where there is a progression from one condition through various stages and back to the initial condition. A standard approach to representing conceptual models is introduced.
The Technical Resource document provides many examples of conceptual models for water dependent ecosystems that may be referred to as an aid to constructing your own conceptual models.
GROUP 3 – MONITORING PROGRAMME Once you have gained an understanding of your system and worked out what you need to measure you can devise your monitoring programme. In order to collect the necessary data the Framework provides guidance on how to correctly choose appropriate methods, techniques and instrumentation.
GROUP 4 – IMPLEMENT AND ASSESS The final section provides a comprehensive outline of what is required to successfully implement a monitoring programme, collect and store data, make an evaluation and assessment of your data and review your results. The final review determines whether the monitoring results are meeting their desired objectives and the effectiveness of the chosen indicators. Any new system understanding is incorporated into your WDE conceptual models, maintaining the adaptive management cycle.

INTRODUCTION
Report DWLBC 2007/12 Best Practice Framework for the Monitoring and Evaluation of Water Dependant Ecosystems 1: Framework
9
WDE INFORMATION DIAGRAM On completion of the Framework you will have developed a WDE monitoring information diagram for your system of interest (Fig. 4). A new concept, the WDE information diagram allows the manager or practitioner to summarise information about the ecosystem, the monitoring programme and any management interventions. This gives an overview for the WDE component of interest and can be combined with the conceptual diagram. One of the aims of the WDE information diagram is to direct practitioners through the driving variables such as climate and weather, through hydrological responses and water quality impacts, to the more integrating indicators of ecosystem health. The diagram assists in demonstrating the flow of functions in the system from drivers to end-points at the same time as demonstrating that indicators can provide information at all stages within that flow, and as such meet the needs for predicting and anticipating negative impacts, as well as observing end-point condition.
THE FUTURE This Framework represents the beginning of a process of bringing together and coordinating the results of water dependent ecosystem monitoring and evaluation in South Australia. The Framework has been prepared in a way that assists practitioners do the best job possible and provide consistent and comparable data (where appropriate) to help guide resource management and conservation.
It is intended, expected and also desirable, that this Framework evolves as experience informs the process and provides feedback about its effectiveness. Adaptive management is as much applicable to this document and guide as it is to any individual monitoring programme. For that purpose, wide application and use is encouraged and feedback welcomed.
Future versions of the framework need to be driven by user feedback. A considerable amount of information has been provided, both in the Framework and Technical Resource document. It will only be through the use of the framework that the usefulness of this information can be determined. Once known, useful information can be expanded and developed and the less useful reduced in extent, or even removed from the Framework.

INTRODUCTION
Report DWLBC 2007/12 Best Practice Framework for the Monitoring and Evaluation of Water Dependant Ecosystems 1: Framework
10
Figure 4. A WDE information diagram for monitoring, management and information
including: stressor model; management module; and monitoring programme.

INTRODUCTION
Report DWLBC 2007/12 Best Practice Framework for the Monitoring and Evaluation of Water Dependant Ecosystems 1: Framework
11
DATA MANAGEMENT
A prototype Ecological Data Warehouse (EDW) for the storage of WDE data was developed in parallel with this Framework (App. 2 – Technical Resource document). The EDW was designed to be accessible by a web based user interface and provide two major interrelated functions: data management and data mining. Data management provides the Framework with data acquisition, archiving, retrieval, sharing, documentation and visualisation tools. Data mining provides tools for statistics, ordination and clustering, as well as predictive monitoring. The EDW provides a demonstration of how a range of data from various regions across South Australia; including macroinvertebrate, diatom and water quality data may be successfully incorporated. The integration of such a database into a monitoring programme designed using the Framework is the next logical step. By doing so, the data collected would become an integral part of the adaptive management process and would further drive the development and improvement of the conceptual models, leading to them becoming data driven models. Such an approach would generate a powerful understanding of South Australia’s water dependent ecosystems and lead to targeted and efficient monitoring and management.
DEVELOPMENT NEEDS
In its current form, the Framework focuses on the conceptual and indicator aspect of monitoring. It would be desirable to extend and expand the advice on the actual monitoring practicalities rather than simply referring to external resources to guide indicator choice.
There exists a vast array of analytical methods and approaches available for data analysis and interpretation, with many books written on the subject. If the Framework were expanded to include analytical and evaluation methods, this should be done after the Framework has been extensively tested. Testing will not only provide experience from which to improve the current Framework, it may also provide insight into the sort of monitoring questions the Framework is being used to address, allowing the most appropriate analytical and evaluation techniques to be recommended.
Presentation of the Framework is likely to change in the future. In the development of the Framework it has been recognised that it may be best to present the Framework on the web rather than as hard copy documents. This would make the Framework more user-friendly, as it could be hyperlinked to the additional information currently found in the Technical Resource document, along with other resources such as relevant software, decision tools, facilities to record inputs and help pages. As a web based tool the content of the Framework could be easily updated and a comments forum could be established to help with further development.
In addition, the authors recommend that workshops are conducted in each region to trial the approach and receive direct feedback on the Framework. A recent workshop that trialled the draft Groups 1 and 2 was very successful, receiving positive feedback (App. 3 - Technical Resource document).

Report DWLBC 2007/12 Best Practice Framework for the Monitoring and Evaluation of Water Dependant Ecosystems 1: Framework
12

Report DWLBC 2007/12 Best Practice Framework for the Monitoring and Evaluation of Water Dependant Ecosystems 1: Framework
13
THE FRAMEWORK
HOW TO USE THE FRAMEWORK The Best Practice Framework for the Monitoring and Evaluation of Water Dependent Ecosystems comprises two parts: this Framework document and a supporting Technical Resource document. The Framework document provides all of the information necessary to design and undertake a monitoring programme. The Framework document is supported by the Technical Resource document, which provides additional explanation and examples. Both documents have the same format so that additional information in the Technical Resource document is located under the same headings as it is referred to in the Framework.
The components of the Framework are laid out sequentially, but this doesn’t necessarily mean that the components must be dealt with in a strict order. It is advisable to complete the groups of tasks at around the same time and, as indicated in Figure 3, certain tasks can run simultaneously, feeding into one another. There is inevitably an overlap and repetition between the components and the information assembled within the tasks. The components are intended to provide a structure that facilitates the gathering of all the necessary information required to devise a monitoring and evaluation programme. Where overlap exists, you will be prompted to skip ahead to the relevant section. The Group 1 tasks are an important building block for the following groups; they build up a picture of the information needed to do a thorough job. Group 2 generates the conceptual understanding of the WDE. This is both informed by and informs the Group 1 tasks. The tasks within Group 2 are also complimentary: they will need to be updated as new insights into process and function arise. During Groups 3 and 4, indicators are selected, and the logistics and evaluation are designed and planned for the monitoring programme.

THE FRAMEWORK
Report DWLBC 2007/12 Best Practice Framework for the Monitoring and Evaluation of Water Dependant Ecosystems 1: Framework
14
GROUP 1 – RATIONALE AND PRIORITIES The Group 1 tasks are intended to determine why monitoring is needed, what the WDE of concern comprises, the monitoring objectives and what threats, risks, and susceptible components exist. This way you might uncover options that you were previously unaware of.
Note: You may wish to complete Group 1 at the same time as building the conceptual diagram (Task 2.1).
TASK 1.1 – KEY QUESTIONS
1: Rationale and priorities
Answer key questions
Identify and rank risks and threats
Review M&Eobjectives
WDE summarytable: rankpriorities
The answers to these questions provide a strong justification about why (and if) monitoring and evaluation is required and help the user to maintain focus through the remaining tasks of the Framework. By working through this section the user considers alternatives to monitoring, the consequences of not monitoring and begins to determine the essential monitoring needs and prioritise activities. Three worked examples are provided in the Technical Resource document to help you understand how this process may work in practice.
Attempt to answer the questions in Table 1 as fully as possible. Feel free to return to these questions later. The other stages in the process may highlight further information for these responses.

THE FRAMEWORK
Report DWLBC 2007/12 Best Practice Framework for the Monitoring and Evaluation of Water Dependant Ecosystems 1: Framework
15
Table 1. Key monitoring questions.
Question Response
What are the questions that you think can be answered using M&E?
They may be RCTs, milestones, investment reporting requirements etc.
Will monitoring and evaluation answer my questions?
Is M&E really needed?
What alternatives are there?
Would these provide the same information as M&E?
What would happen if I didn’t monitor?
This can be a useful test. It is an opportunity to demonstrate why monitoring really is essential. Show the consequences of not monitoring.
What are the key or core monitoring needs?
This is a chance to prioritise. The priorities may become clearer after conceptual models have been constructed.

THE FRAMEWORK
Report DWLBC 2007/12 Best Practice Framework for the Monitoring and Evaluation of Water Dependant Ecosystems 1: Framework
16
TASK 1.2 – REVIEW THE OBJECTIVES
1: Rationale and priorities
Answer key questions
Identify and rank risks and threats
Review M&Eobjectives
WDE summarytable: rankpriorities
The aim of this task is to gain a clear picture of what the monitoring objectives or needs are, and provide direction for the remainder of the process. Monitoring objectives, to some degree, determine the level of activity and intensity of monitoring needed. This will also depend on the prior knowledge of the system or comparable systems. If the monitoring objective is to simply carryout ambient monitoring, but little is known about the system, it will be desirable to carryout additional monitoring at a higher level in order to give a context of understanding to the ambient monitoring data.
Determine and Review Objectives
Your first task is to determine and review your objectives. You need to determine what you want to do and why? Clearly establish the main objectives of monitoring and the information the evaluation is expected to provide. The stakeholder forum identified a range of monitoring objectives for WDEs which fell into four main groups, with a number of sub-categories in each main grouping: • Understanding process and response.
• Management or regulatory objectives and targets.
• Ambient/baseline statistical monitoring — passive monitoring of system baseline condition.
• State of Environment — snap-shot type observation and assessment.
The group in which your objectives fit is important because this determines the final design of your monitoring programme. These groups are defined below and should be used to determine which group your monitoring objectives belong. Table 2 follows the definitions and should be used to detail your monitoring objectives.
Table 2. Determine and review objectives.
Monitoring objective group Yes/No Monitoring objective
Process understanding: validation
Management
Intervention
Compliance
Evidence gathering
Threat/risk
Ambient/baseline statistical monitoring
State of Environment
Other

THE FRAMEWORK
Report DWLBC 2007/12 Best Practice Framework for the Monitoring and Evaluation of Water Dependant Ecosystems 1: Framework
17
Further information on monitoring objectives
Process understanding: validation
When monitoring to understand process, objectives may concern the identification of driving variables, stressors, system components and interactions. This often leads to the development of causal relationships, identification of improved indicators and the optimisation of management and monitoring practices. Understanding process monitoring is sometimes referred to as validation monitoring. This is because the monitoring may provide information to “validate” the conceptual understanding of the system and the conceptual model used to represent this understanding.
The monitoring of transient behaviour and response of hydrometeorological stimuli is an important aspect of validation based monitoring. In all flowing systems and to a lesser extent groundwater driven systems, rainfall and runoff events can lead to dramatic changes in condition and these short term events can have a significant impact on system condition if high levels of turbidity, nutrients or dissolved salts are delivered to the system.
Management Sub-categories for management driven objectives include: • Intervention assessment.
• Evidence gathering.
• Compliance monitoring.
• Threat/Risk assessment.
Intervention assessment
Intervention assessment evaluates the success, or otherwise, of a management action. In an intervention assessment, a measurement of the system state is made against a management plan baseline. This is a form of effectiveness monitoring, as it determines whether the management action is having the desired effect. Current State and Commonwealth natural resource management (NRM) frameworks are major drivers for this type of monitoring and evaluation. It requires monitoring and evaluation to assess performance against long-term resource condition targets (RCTs) and shorter term management action targets (MATs). Within an adaptive management framework, monitoring is designed to detect change and provide a basis for understanding the system, if desired improvements are not occurring. If monitoring does not provide the required or expected information then new questions and hypotheses need to be formulated and fed back into future monitoring.
Management objectives may be driven by financial constraints and may result in the optimisation or reduction of monitoring to key indicators known to integrate system variability and provide a reliable measure of condition. This gives a prioritisation of key monitoring activities and elimination of monitoring that might at best be supplementary, or in the worst case not provide additional information of any value. Compliance monitoring
Compliance monitoring measures the effectiveness of compliance to a management regime. It applies to questions such as: is a land manager undertaking required actions to reduce impact on an adjacent WDE? Choose a stress sensitive or predictive indicator and

THE FRAMEWORK
Report DWLBC 2007/12 Best Practice Framework for the Monitoring and Evaluation of Water Dependant Ecosystems 1: Framework
18
monitor the stressor and system end-point. Is compliance leading to improved WDE condition? Are compliance measures effective? Are compliance actions being implemented? This is a form of implementation monitoring; it can be applied to WDE managers or land holders who have been served with a compliance order. Evidence gathering
Where a system is degraded or suffering known stress and the cause is either suspected, but not proven, or unknown, monitoring may be required to provide supporting evidence, or to establish the cause of deterioration in order to take mitigating action (this may also coincide with understanding or validation based objectives).
Management driven monitoring might also prioritise which systems or locations require the most urgent attention, i.e. those most at threat of serious deterioration in condition. This may arise from ambient monitoring or state-of-catchment monitoring activities, or may be based on prior knowledge of sites requiring specific monitoring or remedial action. This is a form of risk assessment, for example due to susceptibility to impacts from adjacent catchment activity, if the system health is near a threshold for rapid deterioration and consequent loss of species or other undesirable loss or damage. Threat/Risk assessment
Threat/Risk assessment is most often used in systems known to be threatened; under stress; or fragile systems with high susceptibility to deterioration or loss of species. Threat/Risk assessment makes observations of anticipatory or predictive indicators, stress sensitive indicators as well as end-point bio-indicators. The detection of early warning signs can then prompt management intervention as required.
Ambient monitoring objectives
Some basic purposes of ambient monitoring are to evaluate or establish baseline systemcondition, determine natural variability and to “keep an eye” on a system so that deterioration in condition can be detected. Ambient monitoring often monitors end-point condition; it would seem desirable to monitor stress sensitive or predictive indicators for perceived threats or risks.
State of Environment In South Australia, a State of Environment (SOE) report must be published at least once every five years. The report must include an assessment of the condition of the major environmental resources of the state including: stream and river health, groundwater, wetlands, fisheries, and biodiversity. The report must also identify significant trends in environmental quality based on an analysis of indicators of environmental quality. South Australia’s SOE report sits under the national SOE reporting framework. The SOE adopts a condition – pressure – response framework so that attention is focussed on the condition of the environment rather than pressures, as in the OECD pressure-state-response model (DEHAA 1998). SOE reporting also occurs within the regions as NRM boards are required to report on the state and condition and related trends in natural resources in the region on a five-yearly basis, in line with the review of the regional NRM plans.

THE FRAMEWORK
Report DWLBC 2007/12 Best Practice Framework for the Monitoring and Evaluation of Water Dependant Ecosystems 1: Framework
19
Existing Monitoring and Evaluation Now that you have set your objectives, determine where your objectives fit-in with existing M&E (Task 3.1). Ask, where there is local ownership, can new M&E objectives fit-in, or how can the existing M&E form the basis of an extended programme?
Prioritise objectives Next, and only if possible, prioritise the objectives. Thomas (2001) suggests that one of the most difficult tasks is to prioritise monitoring objectives for the short-term and maintain vision to the future, and offers two approaches:
• Start with a comprehensive consideration of all resources and issues – then follow a process of elimination.
• Begin with core resources and issues and define an extension/building process as funding and partners become available.
Spatial scale Summarise the spatial and temporal scales associated with each monitoring objective (Task 2.2).
SMART objectives Determine if your intervention monitoring objectives are SMART. Use Table 3 and refer to the following for further information on SMART targets.
Further notes on SMART Targets
For management intervention objectives consider whether they are specific, measurable, achievable, realistic and time-specific (SMART) and complete the following summary table (Table 3) below for each objective. If they cannot be found to meet at least some of the SMART criteria it may be necessary to re-evaluate the objectives.
The SMART approach ensures that workable intervention management objectives are set, rather than some loose, woolly or nebulous objective that offers no clear target. For the Framework, the SMART acronym is taken to mean:
S – specific (clear, well defined targets).
M – measurable (allows assessment of effectiveness or otherwise against which the management action can be modified as needed).
AR – achievable and realistic (reachable and feasible within the ability to manipulate the system drivers in terms of cost, logistics, resources, and physical, chemical and biological limitations).
T – time-specific (a target is meaningless unless it has a time frame by which the specific measurable result is to be achieved).
Once SMART objectives are set there is a basis against which to design management actions, and review, assess and update/adapt the programme. With active management, the adaptive cycle expands and becomes a true adaptive management cycle, and management actions require effectiveness monitoring for the purposes of testing.

THE FRAMEWORK
Report DWLBC 2007/12 Best Practice Framework for the Monitoring and Evaluation of Water Dependant Ecosystems 1: Framework
20
Table 3. SMART objectives.
SMART Objective Summary Yes/No Details
Specific
Some quantifiable outcome is specified in the objectives, rather than a vague suggestion like “water quality is to be improved”
Measurable
Having quantified the objective can the outcome be measured against the prior state or some parallel “control”?
Achievable
Can the objective be achieved? For example, if natural levels of heavy metals are high it does not make sense to set the objective below this level.
Realistic
Are the objectives realistic within budgetary and logistical constraints?
Time-specific
Is there a clear time frame for actions and expected outcomes against which progress can be measured?

THE FRAMEWORK
Report DWLBC 2007/12 Best Practice Framework for the Monitoring and Evaluation of Water Dependant Ecosystems 1: Framework
21
Determine the level of monitoring required
The monitoring objectives will determine the intensity and scope of the monitoring programme and, as suggested above, this may or may not be influenced by what we already know or don’t know about the system. Table 4 presents the groups of management objectives, proposes key questions which underlie the objectives and sets out the sub-objectives within each group. The objectives are listed according to intensity of monitoring activity, with the most intensive monitoring at the top of the table and the least intensive monitoring at the bottom. In the current usage, “intensity” simply refers to the amount of information to gather or intensity of monitoring activity, and is not meant in a spatial or temporal context.
Table 4. Questions associated with monitoring need.
Monitoring need Key underlying question Specific questions
How does it work? What are the key:
components?
Hig
h
processes?
drivers/stressors?
vital signs/measures?
Process understanding (validation)
How does the system function at different temporal or spatial scales?
Is the system protected?
Are risks/threats reduced?
Management Is management effective?
Are interventions achieving desired outcomes?
What is:
the risk of deterioration?
the baseline condition?
Inte
nsity
of a
ctiv
ity
the natural variability?
Ambient monitoring (Statistical observation)
Is the condition/status changing?
the trend?
Low
State of Environment What is the condition (now)?
What is the present condition (perhaps of numerous sites)?

THE FRAMEWORK
Report DWLBC 2007/12 Best Practice Framework for the Monitoring and Evaluation of Water Dependant Ecosystems 1: Framework
22
Figure 5. A decision pathway for matching monitoring activities to needs.

THE FRAMEWORK
Report DWLBC 2007/12 Best Practice Framework for the Monitoring and Evaluation of Water Dependant Ecosystems 1: Framework
23
Figure 5 and Table 5 provide a flow diagram and table to assist with matching the level of monitoring activity to the monitoring need. For example, at the most intense level of monitoring activity (Path 1 in Fig. 5) all aspects of monitoring need to be undertaken. Adequate indicators may or may not exist and significant questions about ecosystem function still remain unanswered. Consequently, only a rudimentary conceptual model may be available. This is why, at the process understanding level, monitoring is sometimes referred to as validation monitoring, since the model is being developed, updated and validated by detailed investigation.
For Path 2 in Figure 5, the system functioning is relatively well understood, or at least an adequate stressor model or stress/response relationship is known. In this case, the key monitoring activity will be in monitoring the end-point indicator and the stress indicator.
TASK 1.3 – WDE SUMMARY TABLE AND PRIORITIES
1: Rationale and priorities
Answer key questions
Identify and rank risks and threats
Review M&Eobjectives
WDE summarytable: rankpriorities
The WDE summary table (Table 5) is intended to provide a tick-box summary of the type and nature of the system, the driving influences, the threats and stressors, dynamic scales of functioning, and monitoring objectives. The aim of the exercise is to think in general terms about the system and area of interest and list it in one place.
Run through the tables below for the system you want to monitor and tick everything that is applicable. In the details/comments column add further detail as required or relevant. The table is not intended to be exhaustive, but intends to provide the broad areas for consideration in the process of developing an M&E programme. So, if necessary, add extra categories or items that are not present. In addition, highlight the importance of particular features, mark those which are monitored already, and highlight whether the priority for attention is high or low.

THE FRAMEWORK
Report DWLBC 2007/12 Best Practice Framework for the Monitoring and Evaluation of Water Dependant Ecosystems 1: Framework
24
Table 5. WDE summary table. N
ote:
(det
ails
, com
men
ts,
prio
rity,
sig
nific
ance
)
Priority
To monitor
Importance
Present
Sub-
cate
gory
Dire
ctly
rain
fed
Sur
face
/soi
l wat
er fe
d G
roun
dwat
er fe
d
Per
man
ently
wet
Flow
ing/
still/
dry
Wet
/dry
Epi
sodi
c
Ext
ensi
ve
Sm
all s
cale
Long
(i.e
. yea
rs)
Sho
rt (i.
e. w
eeks
, mon
ths,
pu
lsed
, cha
otic
or r
ando
m)
Com
mon
– n
umer
ous
Rar
e –
few
Eas
y ac
cess
Rem
ote
Lake
Pon
d/P
ool
Anab
ranc
h
Cha
nnel
Floo
d pl
ain
Spr
ing
Alga
l ass
embl
age
Hig
her p
lant
s
Tree
s
Lent
ic (s
tillw
ater
)
Lotic
(flo
win
g)
Flor
a
Syst
em F
eatu
re
Hyd
rolo
gy
Sea
sona
lity
Spa
tial e
xten
t
Tem
pora
l dyn
amic
(of e
ntire
WD
E)
Occ
urre
nce
Logi
stic
s
Fluv
ial c
hara
cter
istic
s
Eco
syst
em b
iotic
co
mpo
nent
s

THE FRAMEWORK
Report DWLBC 2007/12 Best Practice Framework for the Monitoring and Evaluation of Water Dependant Ecosystems 1: Framework
25
N
ote:
(det
ails
, com
men
ts,
prio
rity,
sig
nific
ance
)
Priority
To monitor
Importance
Present
Sub-
cate
gory
Inve
rtebr
ates
Sty
gofa
una
Frog
Fish
Snai
ls
Bird
s
Terr
estri
al fa
una
Alie
n sp
ecie
s
Key
ston
e sp
ecie
s
Dom
inan
t spe
cies
Econ
omic
spe
cies
SO
E
EW
R
Inte
rven
tion
Ris
k as
sess
men
t
Res
earc
h
Am
bien
t
Com
plia
nce
Dia
gnos
tic/E
vide
nce
Con
serv
atio
n va
lue/
ETS
Faun
a
Syst
em F
eatu
re
Eco
syst
em b
iotic
co
mpo
nent
s
Nat
ure
of s
peci
es
Mon
itorin
g an
d Ev
alua
tion
driv
er
Addi
tiona
l fea
ture
s no
t men
tione
d ab
ove

THE FRAMEWORK
Report DWLBC 2007/12 Best Practice Framework for the Monitoring and Evaluation of Water Dependant Ecosystems 1: Framework
26
TASK 1.4 – IDENTIFY AND RANK RISKS AND THREATS
1: Rationale and priorities
Answer key questions
Identify and rank risks and threats
Review M&Eobjectives
WDE summarytable: rankpriorities
The aim of this task is to summarise potential and known threats and rank them according to their seriousness. An overview of known stressors to WDE’s in South Australia is provided in the Technical Resource document.
Please answer the questions in Table 6 and complete the threat summary (Table 7). The threat summary tables are intended as a memory mapping tool and reminder of possible threats. Rank the threats according to those known to be the most pressing or serious.
Table 6. Summary of threats/risks and what is at risk.
Question Response
What water quantity/ level/flow/availability threats exist?
What water quality threats exist?
What invasive species threats exist?
What susceptible/ threatened/ endangered species/communities exist?
What other susceptible/fragile aspects to the WDE exist?
Are there any pending developments or changes that might impact on the system?

THE FRAMEWORK
Report DWLBC 2007/12 Best Practice Framework for the Monitoring and Evaluation of Water Dependant Ecosystems 1: Framework
27
Table 7. Threat summary table. Po
ssib
le o
utco
me
or c
onse
quen
ce o
f str
ess
or ri
sk
UV
dam
age/
expo
sure
- ac
cele
rate
d pr
imar
y pr
oduc
tivity
Red
uced
: sha
ding
/cho
king
by
exot
ics
Acc
eler
ated
dry
ing,
incr
ease
in w
ater
tem
pera
ture
Lack
of:
dryi
ng, s
low
ing
of fl
ow, l
oss
of d
ilutio
n
Too
muc
h: d
ryin
g, s
low
ing
of fl
ow, i
ncre
ase
in s
alin
ity
Too
little
: inc
reas
ed e
vapo
ratio
n
Dec
line:
dry
ing
of ro
ots,
oxi
datio
n of
bed
sub
stra
te, l
oss
of m
igra
tory
hab
itat
Dec
line:
dro
p in
wat
er le
vel,
slow
ing
flow
, red
uced
cyc
ling/
incr
ease
d re
side
nce
time
Dec
line:
sta
gnat
ion,
bui
ld-u
p of
was
te p
rodu
cts,
redu
ced
oxyg
enat
ion.
Incr
ease
d fla
shin
ess:
flus
hing
of n
utrie
nts/
sedi
men
t - in
crea
sed
PP
and
turb
idity
Dec
line:
redu
ctio
n in
tim
e to
com
plet
e lif
e cy
cles
Dec
line:
redu
ced
abun
danc
e, lo
ss o
f sup
porti
ng h
abita
t
Oxy
gen
stre
ss, o
ther
stre
sses
Stre
ss to
and
loss
of f
resh
wat
er s
peci
es -
redu
ctio
n in
abu
ndan
ce/ri
chne
ss
Ext
rem
es o
f pH
- dr
iven
by
PP
/resp
iratio
n - s
tress
of b
iota
Sha
ding
, im
pact
s on
fish
spa
wni
ng, c
oatin
g of
aqu
atic
pla
nts
Red
uctio
n in
ligh
t clim
ate
- not
det
ecte
d by
turb
idity
Hyp
er-o
xyge
natio
n, h
ypox
ia (l
ow o
xyge
n)
Eut
roph
ic re
spon
ses
Lim
iting
nut
rient
- eu
thro
phic
resp
onse
s
Mob
ile a
t low
pH
- fis
h gi
ll po
ison
ing
Sha
ding
-out
and
com
petit
ion
for n
utrie
nts
with
nat
ives
, los
s of
hab
itat/
food
stru
ctur
e
Pre
datio
n, c
ompe
titio
n in
food
cha
in/w
eb, d
isea
se
Rai
nfal
l run
off o
f tra
ck m
ater
ial,
impo
undi
ng e
ffect
s
Issu
e?
Y/N
Spec
ific
driv
er/in
dica
tor
of s
tres
s
Sunl
ight
hou
rs
Sol
ar ra
diat
ion
(PA
R)
Air
tem
pera
ture
Rai
nfal
l
Evap
orat
ion
Hum
idity
Wat
er le
vel
Wat
er p
ress
ure
Flow
/dis
char
ge
Wat
er h
ydro
-per
iod
Map
ped
area
l ext
ent
Wat
er te
mpe
ratu
re
Con
duct
ivity
/sal
inity
pH
Turb
idity
Col
our
Dis
solv
ed O
xyge
n
Nitr
ogen
spe
cies
Phos
phor
us
Hea
vy m
etal
s
Hig
her p
lant
s (in
vasi
ve)
Pes
t exo
tic fa
una
Acc
ess
track
s
Cat
egor
y
Met
eoro
logi
cal
Hyd
rom
etric
WD
E ex
tent
Phys
/che
m W
ater
Qua
lity
Bio
tic
All
uses

THE FRAMEWORK
Report DWLBC 2007/12 Best Practice Framework for the Monitoring and Evaluation of Water Dependant Ecosystems 1: Framework
28
Po
ssib
le o
utco
me
or c
onse
quen
ce o
f str
ess
or ri
sk
Loss
of s
ourc
e ha
bita
t for
flor
a an
d fa
una,
sal
inity
bui
ld-u
p, fl
ashi
er ru
noff
Low
erin
g/ra
isin
g of
wat
er ta
ble,
sal
t bui
ld-u
p an
d ru
noff
Expo
sure
to a
gric
hem
ical
s
Incr
ease
d tu
rbid
ity, a
ccel
erat
ed ru
noff
resp
onse
Leac
hing
of N
, run
off o
f par
ticul
ate
boun
d P
Rub
bish
dum
ping
Loss
of f
lora
, red
uced
hab
itat v
alue
, fla
shie
r run
off
App
licat
ions
of s
ludg
e
Bra
sh b
reak
dow
n re
sults
in 3
-5 m
gN/l
(NO
3_N
)
Land
dis
turb
ance
and
sed
imen
t rel
ease
Incr
ease
d de
pth
to g
roun
dwat
er, d
ryin
g of
wet
land
s
Loss
of s
ourc
e ha
bita
t
Loss
of a
quife
r con
nect
edne
ss
Low
erin
g of
wat
er ta
ble,
loss
of d
ry s
easo
n re
fugi
a
Aci
dic
runo
ff/le
achi
ng w
ith m
obile
hea
vy m
etal
s, a
mm
onia
etc
.
Des
truct
ion
of c
atch
men
t, so
urce
hab
itat
Flas
hy ru
noff
with
silt
and
nut
rient
s
Amm
onia
cal n
itrog
en le
achi
ng u
ndilu
ted
durin
g dr
y w
eath
er, B
OD
Sou
rce
area
for e
xotic
spe
cies
Sou
rce
area
for e
xotic
pes
t spe
cies
; fox
es, r
abbi
ts, c
ats,
rats
Poo
r was
te d
ispo
sal p
ract
ices
Hou
seho
ld, D
IY a
nd g
arde
n ch
emic
als
- via
sep
tic le
acha
te o
r run
off
Enh
ance
d ris
k of
fire
Issu
e?
Y/N
Spec
ific
driv
er/in
dica
tor
of s
tres
s
Land
cle
aran
ce
Irrig
atio
n
Pes
ticid
e ov
ersp
ray
Sod
icity
- tu
rbid
runo
ff
Ferti
lliser
runo
ff
Land
fill
Gra
zing
Pest
icid
e us
e
Sew
age
slud
ge
Pos
t-fel
ling
nutri
ent f
lux
Pos
t-fel
ling
turb
id ru
noff
Hyd
rolo
gica
l im
pact
Mon
o-cu
lture
Litte
r
Wat
er-ta
ble
inte
rcep
tion
Aqui
fer d
raw
dow
n
Tailin
g po
nd ru
noff
Spo
il-tip
enc
roac
hmen
t
Ele
vate
d st
orm
runo
ff
Sep
tic ta
nk d
rain
age
Exo
tic s
peci
es
Pes
ts/p
reda
tors
Was
te e
ngin
e oi
l
Dom
estic
che
mic
als
Land
fill l
each
ate
Fire
Litte
r
Cat
egor
y
Land
use
: Agr
icul
ture
Land
use
: For
estr
y
Land
use
: Min
ing
Land
use
: Res
iden
tial

THE FRAMEWORK
Report DWLBC 2007/12 Best Practice Framework for the Monitoring and Evaluation of Water Dependant Ecosystems 1: Framework
29
Po
ssib
le o
utco
me
or c
onse
quen
ce o
f str
ess
or ri
sk
Toxi
cici
ty. T
rans
ient
kno
ck-d
own
of s
usce
ptib
le s
peci
es. C
hron
ic im
pact
if lo
ng-li
ved
cont
amin
ant
As
for s
pill.
Atm
osph
eric
fall-
out -
toxi
c so
ot a
nd p
artia
l com
bust
ion
prod
ucts
Flas
hier
runo
ff, m
ore
runo
ff - g
reat
er h
ydro
dyna
mic
and
WQ
dis
turb
ance
Par
ticul
ates
, met
als,
hyd
roca
rbon
resi
dues
Leac
hate
con
tam
inat
ion,
inte
rcep
tion
of w
ater
tabl
e.
Tem
pera
ture
rang
e ch
ange
s (b
ut m
igra
tion
pote
ntia
l lim
ited)
, inc
reas
ed e
vapo
ratio
n,
incr
ease
d w
ater
stre
ss
Flas
hier
turb
id e
vent
s
Big
ger w
et/d
ry e
xtre
mes
, lon
ger d
ry s
easo
n
Wet
ting
beco
mes
mor
e va
riabl
e an
d un
pred
icta
ble
Red
uced
fres
hwat
er ta
bles
and
incr
easi
ng s
ea-le
vel,
acce
lera
ted
salin
e in
trusi
on
Salin
e in
unda
tion
of n
ear-s
hore
WD
Es m
ore
likel
y
Phy
toph
thor
a
Phys
ical
dam
age
to c
hann
el
BO
D
Con
tam
inan
t mic
ro-o
rgan
ism
s
Kno
ck-d
own/
disr
uptio
n of
ripa
rian
syst
em
Issu
e?
Y/N
Spec
ific
driv
er/in
dica
tor
of s
tres
s
Che
mic
al s
pill
Che
mic
al fi
re
Enh
ance
d ru
noff
Con
tam
inat
ed ru
noff
Land
fill
Incr
ease
d te
mpe
ratu
re
Mor
e ex
trem
e ra
infa
ll
Low
er to
tal r
ainf
all
Rai
nfal
l reg
ular
ity re
duce
d
Ris
ing
sea-
leve
l
Sto
rm s
urge
s
Intro
duce
d di
seas
e
Cre
ek b
ed d
rivin
g
Gre
y-w
ater
rele
ase
Faec
al c
onta
min
atio
n
Fire
Litte
r
Cat
egor
y
Land
use
: Ind
ustr
ial
Clim
ate
chan
ge
Rec
reat
iona
l act
ivity
Add
ition
al th
reat
s/ris
ks n
ot
liste
d

THE FRAMEWORK
Report DWLBC 2007/12 Best Practice Framework for the Monitoring and Evaluation of Water Dependant Ecosystems 1: Framework
30
GROUP 2 – CONCEPTUAL UNDERSTANDING Having completed the Group 1 tasks, you should now be aware of why you need to monitor, what the drivers and ecosystem components are and the nature of the system. In addition, you should know the threats and risks and the components most under threat or susceptible to deterioration or loss.
The next stage in the process is to formalise all of the information you have gathered into a conceptual understanding of WDE functioning, and an illustrated overview of the system. In addition, you will: examine issues of time and spatial scale; investigate event and seasonal issues; and build stressor or state-and-transition models.
Constructing a realistic set of conceptual models is an important element of designing effective monitoring programmes and evaluating management strategies (Gross 2003). Monitoring programmes founded on solid conceptual models are more likely to identify key processes and indicators, and thereby contribute significantly to WDE management. Models should always be viewed as a work in progress and be subject to regular review as part of the adaptive management cycle.
The tasks in Group 2 aim to help you produce the conceptual models needed to develop an effective monitoring programme. Importantly, these models are depicted using a common format that enables ease of communication between practitioners. Conceptual models come in a variety of forms.
If you are unfamiliar with conceptual models (and even if you think you are) you must read the Conceptual Model section in the Technical Resource document before starting Group 2.
The Framework aims to provide guidance on building conceptual models and suggest tools to assist in this process. The tasks and procedures are largely based on the work of Gross and co-workers (Gross 2003).
On completion of Group 2 you will have built a conceptual model, or models, for the WDE of interest. Once complete you might expect to have one or more of the following (adapted from Gross 2003): • A highly aggregated, holistic overview model.
• A set of Stommel diagrams that assist in recognising the spatial and temporal extent of drivers, ecosystem functions, objectives and management actions.
• Tables summarising important drivers, responses, resources, etc.
• Driver-stressor models focused on priority ecosystem health indicators.
• A state-and-transition model (e.g. for phased wetting and drying, invasive plants etc.).
• A mechanistic (process, control, etc.) model of key ecosystem processes, and perhaps species.
• Detailed supporting narratives.
• A set of tools that provide an overview of your system and highlight key threatening mechanisms/influences, such that management and observation of the status and condition of the system is facilitated, and informed choices can be made around monitoring and management interventions.

THE FRAMEWORK
Report DWLBC 2007/12 Best Practice Framework for the Monitoring and Evaluation of Water Dependant Ecosystems 1: Framework
31
The glossary below defines common terms used in Group 2. Further information on WDE drivers, stressors, and ecosystem attributes is provided in Appendix 4 of the Technical Resource document.
Conceptual Model Glossary • Drivers — exert major forcing influences on natural systems and are associated with
large-scale processes. Examples include climate, landform, geology/soils and time.
• Stressors — cause significant changes in ecological components, patterns and relationships. Barrett et al. (1976) give this definition: “Stress is defined here as a perturbation (stressor) applied to a system (a) which is foreign to that system or (b) which is natural to that system but applied at an excessive [or deficient] level.” Examples may include changes in: salinity and nutrients, groundwater level, flooding regime and invasion of exotic species.
• Ecosystem process/response (attributes) — physical, chemical or biological factors that respond to the drivers and stressors. This response may be positive or negative. Examples include: community and population dynamics; water and sediment quality; flow regime; stream geomorphology; physiology; and organism health.
• Vital sign/indicator — any “information rich” feature of an ecosystem that may be independent or integrative, and may be measured or estimated to provide insight into the condition of the ecosystem. Examples may include water quality and the macroinvertebrate community.
• Measurements — measures of the vital sign/indicator. A measure of water quality may be electrical conductivity and a measure for the macroinvertebrate community may be structure and composition.
TASK 2.1 – CREATING A CONCEPTUAL DIAGRAM
2: Conceptual understanding
Wetting/dryingand event response?
Create conceptualdiagram
Stommel diagram fortemporal and spatial bounds
Build stressor and/or state-and-transition
model
The conceptual diagram is a visual tool for collecting and displaying a wide range of information about your system. It is a good way of getting this information out of your head and onto paper and helps to build the “bigger picture”, since it can be very easy to get focussed on a narrow area of concern and miss an important connection.
For many purposes a simple conceptual diagram combined with sub-system “stressor” models will be adequate. The conceptual diagram (Figure 6) provides an “easy access for all” pictorial representation of the system of interest, combined with a narrative dialogue that describes the key drivers, stressors and system components (see the Technical Resource document for further information). A stressor model is a reduced flow diagram that links stresses and threats to a given indicator of health, this feeds directly into the choice of monitoring design (further notes on stressor models are provided in Task 2.4 and also refer to the Group 3 tasks).

THE FRAMEWORK
Report DWLBC 2007/12 Best Practice Framework for the Monitoring and Evaluation of Water Dependant Ecosystems 1: Framework
32
By completing the WDE summary table (Table 5) most of the components that are needed to construct a conceptual model or diagram are listed. This will also be valuable if the more complex “control” type of model is to be constructed for research or process understanding purposes.
Creating a conceptual diagram has six main stages: 1. Sketch the landscape
2. Add the ecosystem
3. Draw-on the drivers
4. Show the stressors
5. Draw in the indicators
6. Add the narrative
Figure 6. A pictorial conceptual diagram showing major components and water movement in a coastal pool connected to the sea (source: Stephens & Daniel 2006).

THE FRAMEWORK
Report DWLBC 2007/12 Best Practice Framework for the Monitoring and Evaluation of Water Dependant Ecosystems 1: Framework
33
TASK 2.2 – GENERATE A STOMMEL DIAGRAM FOR TEMPORAL AND SPATIAL BOUNDS
2: Conceptual understanding
Wetting/dryingand event response?
Create conceptualdiagram
Stommel diagram fortemporal and spatial bounds
Build stressor and/or state-and-transition
model
The use of Stommel diagrams at one or various scales can help match monitoring and management goals and help determine the scale at which spatial and temporal scale monitoring needs to be carried out (refer to the Technical Resource document for a detailed discussion of issues of scale). Management goals can be set out on a Stommel diagram with system drivers, stressors, processes and indicators (Fig. 7). The technique gives a rapid visual assessment of temporal and spatial scales and helps home-in on overlaps, so the monitoring programme can be devised to pick the variables and indicators that are appropriate to the monitoring objectives. The Stommel diagram also helps the user focus on how frequently they need to collect monitoring data and how long monitoring will be required. As with the other stages of the Framework, it may be necessary to return to this exercise having completed other tasks that may provide the necessary information.
The Stommel diagram (developed by Stommel 1963) is a valuable tool for characterising the scales of complex ecosystem components in space and time, and has been applied in a wide range of eco-system fields. These diagrams provide an ‘at-a-glance’ impression of the time and space continuum (as seen by x and y axes, respectively), the associated range of process dynamics and how these relate to one-another. For example, thunderstorms may be spatially extensive, but are a short-term phenomenon, microbial processes are rapid and small-scale, lake mixing may be both long-term temporally and spatially extensive in a major system, and successions in vegetation may take hundreds of years and cover a small to large area. The diagrams are not intended to provide any mechanistic linkages of system functions. Examples of Stommel diagrams are provided in the Technical Resource document.

THE FRAMEWORK
Report DWLBC 2007/12 Best Practice Framework for the Monitoring and Evaluation of Water Dependant Ecosystems 1: Framework
34
Figure 7. Example Stommel diagram for faecal indicator dynamics in creek systems.
0.0
1.0
2.0
3.0
4.0
5.0
Apr-83
Mar-84
Apr-85
Apr-86
Apr-87
Apr-88
Apr-89
Apr-90
Apr-91
Apr-92
Apr-93
Apr-94
Apr-95
Apr-96
Apr-97
NO
3_N
(mg/
L)
Seasonal cycle (1 year)
Event responses(days)
Purturbation response (7 years)
0.0
1.0
2.0
3.0
4.0
5.0
Apr-83
Mar-84
Apr-85
Apr-86
Apr-87
Apr-88
Apr-89
Apr-90
Apr-91
Apr-92
Apr-93
Apr-94
Apr-95
Apr-96
Apr-97
NO
3_N
(mg/
L)
Seasonal cycle (1 year)
Event responses(days)
Purturbation response (7 years)
Figure 8. Stream nitrate concentration (Afon Hore, Plynlimon, Wales) demonstrating
response dynamics at three temporal scales (adapted from: Wilkinson et al, 1997).
As an example of temporal scales, Figure 8 demonstrates processes occurring over three time-scales associated with the breakdown of conifer brash following clear-felling. It takes seven years for the brash to break-down sufficiently that nitrogen leaching falls below pre-felling concentrations, each year during the winter months leaching is maximised by rainfall runoff, and individual rainfall-runoff events cause short-term spikes in nitrogen concentration of a few days duration. This example also demonstrates the value of long-term monitoring to capture the impact of major disruptive land management activities, and the value of simple visualisation of raw water quality data.

THE FRAMEWORK
Report DWLBC 2007/12 Best Practice Framework for the Monitoring and Evaluation of Water Dependant Ecosystems 1: Framework
35
Prior to completing the Stommel diagrams refer to your summary tables from Group 1 as a reminder of what you want to display. Use Table 8 to list the key components you want to represent.
Table 8. WDE attributes for inclusion in a Stommel diagram.
WDE attributes to incorporate in your Stommel diagram(s)
Drivers:
Stresses/stressors, threats/risks:
Ecosystem processes, attributes and indicators:
Monitoring objectives, management actions/plans and funding cycles:
Use the blank Stommel diagram (Fig. 9) to map-out the spatial and temporal extent of your ecosystem components, drivers, monitoring objectives and management actions. Make multiple copies for each category of features, or sub-system as necessary (to avoid cluttering and confusion – you can always re-draw them later).

THE FRAMEWORK
Report DWLBC 2007/12 Best Practice Framework for the Monitoring and Evaluation of Water Dependant Ecosystems 1: Framework
36
Figure 9. Blank Stommel diagram to copy and complete for WDE drivers, stressors, attribute dynamics, monitoring objectives.
0.1 1 10
100
1000
10000
1000000.001
0.01
0.1
1
10
100
1000
10000
100000
1000000
Tem
poral Scale (days)
Spatial Scale (m)
Days
Weeks
Years
Minutes
Decades
Centuries
Months
Hours

THE FRAMEWORK
Report DWLBC 2007/12 Best Practice Framework for the Monitoring and Evaluation of Water Dependant Ecosystems 1: Framework
37
TASK 2.3 – DESCRIBE THE WETTING/DRYING AND EVENT RESPONSE
2: Conceptual understanding
Wetting/dryingand event response?
Create conceptualdiagram
Stommel diagram fortemporal and spatial bounds
Build stressor and/or state-and-transition
model
Answer these three questions about your WDE: • Is it necessary to adjust your monitoring to suit seasonal cycles of wetting and drying?
• Is your system driven by a rainfall-runoff process?
• Is it necessary to tailor your monitoring to capture storm-event responses, in order to characterise nutrient and sediment inputs, consequent ecosystem responses and other related effects (you may have a well defined set of indicators that do not require event monitoring, or you may need additional information to validate your indicators)?
And then follow the decision tree below:
Task 2.3
Doesthe system
respond rapidly tostorm
rainfall?
Doesthe system wet/dry over
weeks ormonths?
Yes
No
Yes
No
CompleteEvent response
section of Table 10
Go to Task 2.4
Create a state-and-transition for model
phasing
Identify the phasesof the seasonal
cycle and the keyprocesses and
components
Complete Phasingsection of Table 10
Investigate the impact of storm-runoffon the system, devisean event monitoring
plan
If the WDE is constantly wet or hardly varying a
single model may sufficient
Arethe indicators
associated with your objectives integrating?(i.e. is it necessary to
monitor events?)
Yes
No

THE FRAMEWORK
Report DWLBC 2007/12 Best Practice Framework for the Monitoring and Evaluation of Water Dependant Ecosystems 1: Framework
38
For seasonally wetting/drying WDEs, Seaman (2002a) presents a diagram indicating the typical changes in water chemistry and associated changes in invertebrate assemblages (Fig. 10). This diagram may provide a useful guide when thinking about the progression from dry to wet and back to dry for your WDE.
Figure 10. Wetting/drying cycles and changes in water chemistry in temporary wetlands showing seasonal changes in invertebrate composition (source: Seaman 2002a).

THE FRAMEWORK
Report DWLBC 2007/12 Best Practice Framework for the Monitoring and Evaluation of Water Dependant Ecosystems 1: Framework
39
Fill in Table 9 with information relating to the seasonal wetting and drying of your system, or the event response. Give a general overview; think about the dominant processes at each stage as the system transits through the response to complete the cycle, back to the dry season or dry-weather conditions (see the Technical Resource document for an example of a dry weather and rainfall-runoff event response model).
Table 9. Summary of phased and event system response characteristics.
Questions Yes/No Details (Refer to your conceptual diagram and summary tables as a reminder)
Phasing
Is this a wetting and drying system?
Identify the phases and key mechanisms/processes as the system transits through a season.
What date is the earliest the wetting-up season might be expected to start?
When is the wet generally under way (later than the earliest start)?
When, typically, will the WDE have reached full development and productivity (i.e. the height of the season)?
Roughly when has the system tipped into its decline phase back towards the dry weather condition?
Event response
Is there a distinct rainfall-runoff response?
Does the system go from dry to wet or still-water to flowing? Describe the sequence of events. (Note: phasing of creek systems occurs on a seasonal basis, so some of the answers to the questions on phasing are of relevance to event response, e.g. an event of a given magnitude will be soaked-up and evaporated off in summer, and will cause runoff in the middle of winter).
How does the magnitude (size) of the feeder creeks compare to the WDE? (e.g. in a large wetland with small creeks, the runoff event may have negligible impact, whereas a small wetland inundated from a larger creek will be heavily disturbed.)
How quickly does the hydrograph rise (e.g. several hours, half a day, anecdotal evidence is sufficient as an initial guide)?
How quickly does the flow event decline back to dry weather conditions?
Having considered the importance of phasing and event response in the WDE, you have taken a further step in assembling the information to contribute to planning your monitoring and helping choose whether you need to construct a conceptual model for stressor relationships and/or state-and-transition model (see Task 2.4 below).

THE FRAMEWORK
Report DWLBC 2007/12 Best Practice Framework for the Monitoring and Evaluation of Water Dependant Ecosystems 1: Framework
40
TASK 2.4 – BUILD STRESSOR OR STATE-AND-TRANSITION MODEL
2: Conceptual understanding
Wetting/dryingand event response?
Create conceptualdiagram
Stommel diagram fortemporal and spatial bounds
Build stressor and/or state-and-transition
model
Task 2.3 will help determine which type of model is necessary for the monitored WDE. This section describes how to construct two types of model; a stressor and a state-and-transition model. These are but two of a range of conceptual models and further examples are provided in the Technical Resource document.
Fancy (2003) describes the components and symbols of a hierarchical conceptual model (Fig. 11). There are various terms used for the model components, in this document we attempt to adhere to the set of terms presented below, the alternative terms are included in the square brackets. From top to bottom, the components are: • Rectangles = Drivers [disturbances] – these
exert a major forcing influence on natural systems and are associated with large-scale processes.
• Ovals = Stressor [consequences] – these cause significant change in ecological components, patterns and relationships. Barrett et al. (1976) give this definition: “Stress is defined here as a perturbation (stressor) applied to a system (a) which is foreign to that system or (b) which is natural to that system but applied at an excessive [or deficient] level.”
• Diamonds = Ecosystem attribute [process, ecological effect, response] – are the responses to the drivers and stressors.
• Hexagons = Indicators [vital signs] – any “information rich” feature of an ecosystem that may be independent or integrative and may be measured or estimated and provide insight into the condition of the ecosystem.
• Parallelograms = Measurements – measures of the attribute or indicator.
The Technical Resource document provides further definitions of model components.
Figure 11. A legend of symbols and basic structure for use in conceptual models, for distinguishing between the roles of model components.
Driver
Stressor
Ecosystemprocess /attribute
Vital sign /indicator
Measure
Stressor model for a single sub-system

THE FRAMEWORK
Report DWLBC 2007/12 Best Practice Framework for the Monitoring and Evaluation of Water Dependant Ecosystems 1: Framework
41
Building the stressor model
Most systems will require at least a stressor model. This is the simplest of the conceptual models (see: Conceptual Model Glossary, page 31) and focuses on the key mechanisms and stress response relationships at the spatial and temporal scales, and the set of objectives for the system of interest. Advice and guidelines on model construction and examples of stressor models can be found in the Technical Resource document.
Use the Stommel diagram and other tables of information already gathered to help you determine what you will present in the model.
Use Table 10 to help summarise the range of information you want or need to present. Copy and use multiple tables if you are building stressor models for sub-systems with differing stressors, attributes and indicators.
Complete the stressor model template presented in Figure 12, or construct your own model from scratch once you have a clear idea of the key process(es) or sub-system(s) you wish to represent. If you are unclear about what your indicators should be, please go to Task 3.2 and then return to Task 2.4.
Table 10. WDE attributes to incorporate in your stressor model(s).
WDE attributes
Drivers:
Stresses/stressors, threats/risks:
Ecosystem processes, attributes, and indicators:
Measures (that quantify the state of your indicators):

THE FRAMEWORK
Report DWLBC 2007/12 Best Practice Framework for the Monitoring and Evaluation of Water Dependant Ecosystems 1: Framework
42
Figure 12. Blank stressor model template.

THE FRAMEWORK
Report DWLBC 2007/12 Best Practice Framework for the Monitoring and Evaluation of Water Dependant Ecosystems 1: Framework
43
The state-and-transition-model
If you have a phased system, i.e. it has a seasonal wetting/drying response, or it has a marked rainfall event response that you need to monitor or quantify, generate state-and-transition models for the system. Refer to your Stommel diagram and the summary table (Table 9) in Task 2.3.
If your WDE has seasonal phasing and you need to monitor or quantify rainfall event responses, two state-and-transition models will be beneficial for understanding how the system functions. In doing so, refer to Table 9 which provides your summary of the time-scales and processes relevant to the seasonal and event system dynamics. Further information on, and examples of, state-and-transition models are presented in the Technical Resource document.
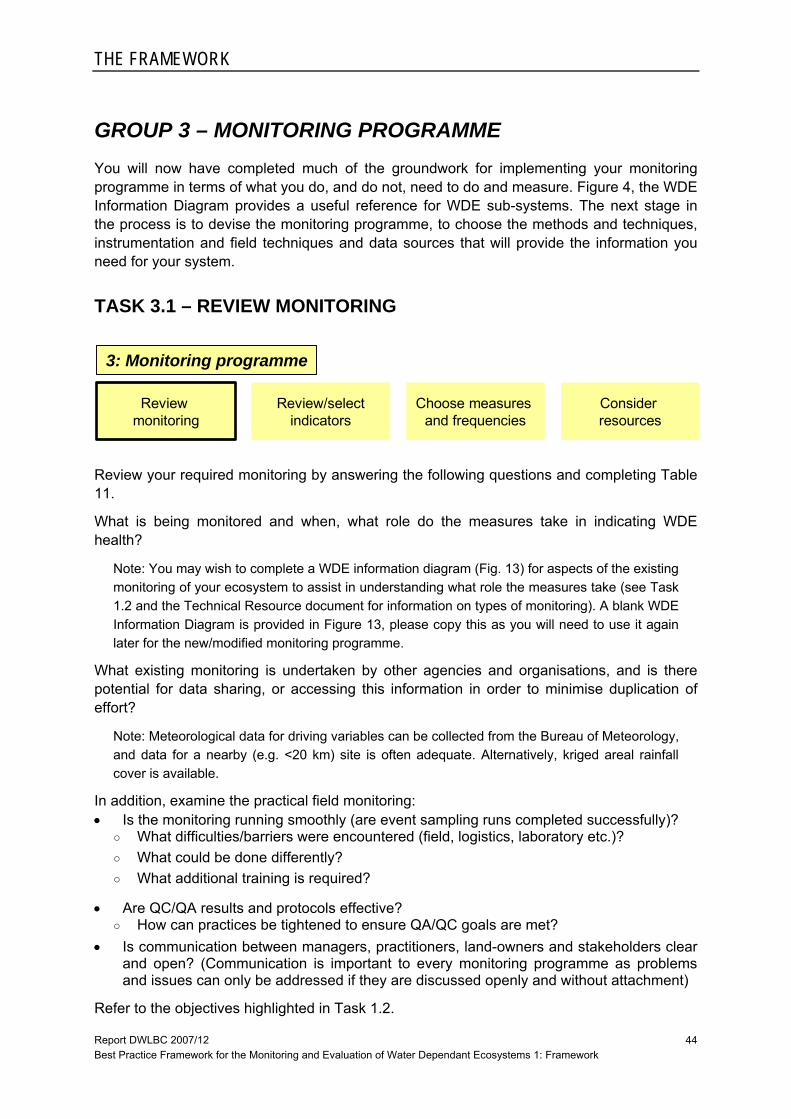
THE FRAMEWORK
Report DWLBC 2007/12 Best Practice Framework for the Monitoring and Evaluation of Water Dependant Ecosystems 1: Framework
44
GROUP 3 – MONITORING PROGRAMME You will now have completed much of the groundwork for implementing your monitoring programme in terms of what you do, and do not, need to do and measure. Figure 4, the WDE Information Diagram provides a useful reference for WDE sub-systems. The next stage in the process is to devise the monitoring programme, to choose the methods and techniques, instrumentation and field techniques and data sources that will provide the information you need for your system.
TASK 3.1 – REVIEW MONITORING
3: Monitoring programme
Choose measures and frequencies
Consider resources
Review monitoring
Review/selectindicators
Review your required monitoring by answering the following questions and completing Table 11.
What is being monitored and when, what role do the measures take in indicating WDE health?
Note: You may wish to complete a WDE information diagram (Fig. 13) for aspects of the existing monitoring of your ecosystem to assist in understanding what role the measures take (see Task 1.2 and the Technical Resource document for information on types of monitoring). A blank WDE Information Diagram is provided in Figure 13, please copy this as you will need to use it again later for the new/modified monitoring programme.
What existing monitoring is undertaken by other agencies and organisations, and is there potential for data sharing, or accessing this information in order to minimise duplication of effort?
Note: Meteorological data for driving variables can be collected from the Bureau of Meteorology, and data for a nearby (e.g. <20 km) site is often adequate. Alternatively, kriged areal rainfall cover is available.
In addition, examine the practical field monitoring: • Is the monitoring running smoothly (are event sampling runs completed successfully)?
○ What difficulties/barriers were encountered (field, logistics, laboratory etc.)? ○ What could be done differently? ○ What additional training is required?
• Are QC/QA results and protocols effective? ○ How can practices be tightened to ensure QA/QC goals are met?
• Is communication between managers, practitioners, land-owners and stakeholders clear and open? (Communication is important to every monitoring programme as problems and issues can only be addressed if they are discussed openly and without attachment)
Refer to the objectives highlighted in Task 1.2.

THE FRAMEWORK
Report DWLBC 2007/12 Best Practice Framework for the Monitoring and Evaluation of Water Dependant Ecosystems 1: Framework
45
Table 11. Monitoring review questions.
Question Response
How does this fit/answer objectives?
Are the indicators appropriate to the objectives?
Refer to Task 3.2
Can anything be dropped?
What needs to be added?
Refer to Table 5 – Task 1.3.
Is there a conceptual diagram or stressor model?
What type of monitoring is needed?
Refer to Task 1.2 and the Technical Resource Document.

THE FRAMEWORK
Report DWLBC 2007/12 Best Practice Framework for the Monitoring and Evaluation of Water Dependant Ecosystems 1: Framework
46
TASK 3.2 – REVIEW AND/OR SELECT INDICATORS
3: Monitoring programme
Choose measures and frequencies
Consider resources
Review monitoring
Review/selectindicators
This task may, in part, have been answered already. However, as one of the Frameworks objectives is to provide a series of checks and balances to ensure that no information has been missed, it is recommended that you complete this task as you have for the other tasks.
To assist you in this process it would now be of value to complete a WDE Information Diagram (Fig. 13). Figure 4 presents an example WDE Information Diagram including indicators and measures. Since you have stated your objectives for monitoring, you know which aspects of your system require indicators and the diagram helps in choosing these indicators. In addition, a further table of indicators is provided (Table 12) and demonstrates where a wide range of variables, attributes and system process indicators lie within a WDE system, the type of indicating role they can play and whether or not they are also a measure (can be suitably quantified in terms of system condition or status). This table refers to primary and secondary state variables. Primary state variables are driven directly by the drivers and stressors. Secondary state variables are lower down in the flow of causality within the system as they are dependent on the primary variables. For example, invertebrates are a secondary state variable and are dependent on various primary state variables associated with hydraulic conditions and water quality, which are usually driven by external factors. It may be useful to highlight in this table those variables, indicators and measures that are present in a currently monitored system, or that you intend to include them in a new monitoring programme. The table is not intended to present an exhaustive list of all possible WDE components and indicators, in fact, feedback from users to update and modify this Framework is welcomed; the aim is to provide a user-friendly tool that facilitates effective monitoring. The Technical Resource document provides some helpful definitions of vital sign and indicator along with a further discussion of indicators and their selection (note: the terms vital sign and indicator are used together in this report).
We highly recommend that you read the accompanying section on indicators in the Technical Resource document before you proceed with indicator selection.
In completing this Task the following questions need to be answered: • What kinds of vital signs/indicators are needed?
○ End-point (retrospective, State of Environment). ○ Driver/stressor sensitive (distinct response to natural/anthropogenic influences). ○ Predictive (coal-mine canary – known response). ○ Anticipatory (expected outcome).
• Integrative (long-term health or instantaneous?) ○ Are the indicators appropriate to the objectives?
Are any surrogate measures that are cheaper to use available?
The next procedure is to actually begin to devise the monitoring programme.

THE FRAMEWORK
Report DWLBC 2007/12 Best Practice Framework for the Monitoring and Evaluation of Water Dependant Ecosystems 1: Framework
47
Table 12. WDE indicators and their attributes.
Not
es
Use
ful i
f pai
red
with
wat
er te
mpe
ratu
re to
de
mon
stra
te d
iffer
entia
l im
pact
s, i.
e. if
wat
er w
arm
s bu
t air
sam
e, p
erha
ps fl
ow re
duce
d Le
ss fr
eque
nt ra
in, s
hifti
ng o
f ann
ual t
imin
g of
rain
s,
mor
e in
tens
e st
orm
s, c
hang
e in
vol
ume
- dry
ing,
er
osio
n an
d sa
linity
impa
cts
Acc
eler
ated
eva
pora
tion
- rel
ativ
e to
long
-term
mea
n - m
ore
rapi
d dr
ying
A re
duct
ion
in fl
ow m
ight
pre
ceed
a d
rop
in le
vel -
a
prec
urso
r to
fallin
g w
ater
tabl
e
Tim
ing
and
dura
tion,
may
be im
pact
due
to d
iffer
ent
timin
g of
dep
ende
nt s
peci
es b
reed
ing
cycl
es
Red
uced
are
al e
xten
t ind
icat
es re
duce
d pr
ovis
ion
of
wat
e r
Incr
ease
d te
mpe
ratu
re m
ight
indi
cate
redu
ced
flow
ra
te in
a G
DE
. In
a w
etla
nd te
mpe
ratu
re h
as a
long
te
rm in
dica
tion
qual
ity a
s w
ell a
s di
urna
l var
iatio
n (it
ca
n te
ll us
diff
eren
t thi
ngs
in d
iffer
ent s
yste
ms
- but
is
of l
ittle
dia
gnos
tic v
alue
alo
ne)
In current programme?
End-point (retrospective)
Diagnostic y y y y
Integrative
Anticipatory y y y y y
Predictive (coal-mine canary)
Stressor sensitive (Anthropogenic impact)
y y
Indi
cato
r Typ
e
Driver sensitive (natural)
y y y
Secondary y y
Primary state y
Driver y y y y y y y y y
Indicator y y y
Stru
ctur
al p
ositi
on
Measure y y y y y y y y y y y
Spec
ific
Sunl
ight
hou
rs
Sol
ar ra
diat
ion
(PA
R)
Air
tem
pera
ture
Rai
nfal
l
Evap
orat
ion
Hum
idity
Wat
er le
vel
Wat
er p
ress
ure
Flow
/dis
char
ge
Wat
er h
ydro
perio
d
Map
ped
area
l ext
ent
Wat
er te
mpe
ratu
re
Cat
egor
y
Met
eoro
logi
cal
Hyd
rom
etric
Wet
land
ext
ent
Phys
/che
m
Wat
er Q
ualit
y

THE FRAMEWORK
Report DWLBC 2007/12 Best Practice Framework for the Monitoring and Evaluation of Water Dependant Ecosystems 1: Framework
48
Not
es
Cha
nge
in s
alin
ity -
incr
ease
d ev
apor
atio
n, s
alin
e ru
noff
impa
ct, r
educ
ed fl
ow -
loss
of s
alt i
ntol
eran
t sp
ecie
s pH
cha
nge
- res
pons
e to
rain
fall,
cha
nge
in re
dox
indi
cativ
e of
runo
ff an
d er
osio
n, s
odic
ity -
impa
cts
on
light
clim
ate
and
fish
spaw
ning
Hum
ic a
nd fu
lvic
sub
stan
ces
in s
urfa
ce w
ater
s co
lour
runo
ff an
d co
ntrib
ute
to re
duce
d lig
ht c
limat
e:
Turb
idity
alo
ne m
ay n
ot a
dequ
atel
y ac
coun
t for
ligh
t re
duct
ion,
and
ther
e is
val
ue in
ass
essi
ng th
e co
nditi
ons
asso
ciat
ed w
ith d
omin
antly
col
oure
d ru
noff
or d
omin
antly
turb
id ru
noff.
H
yper
-oxy
gena
tion,
hyp
oxia
(low
oxy
gen)
- eu
troph
icat
ion
can
resu
lt in
ext
rem
es o
f oxy
gena
tion
asso
ciat
ed w
ith p
hoto
synt
hesi
s an
d re
spira
tion
Enr
ichm
ent,
was
tew
ater
con
tam
inat
ion
Lim
iting
nut
rient
- eu
thro
phic
resp
onse
s
Alg
al g
row
th o
n N
/P a
mm
ende
d m
edia
(EH
MP
)
Mob
ile a
t low
pH
- fis
h gi
ll po
ison
ing
Dem
onst
ratio
n of
lim
iting
nut
rient
rela
tions
hip
(SE
Q
met
hod)
Mea
sure
of t
urn-
over
/act
ivity
- ac
cele
rate
d in
an
impa
cted
sys
tem
(EH
MP
)
In current programme?
End-point (retrospective)
y y y y
Diagnostic Y y y y y y
Integrative y y y
Anticipatory y y
Predictive (coal-mine canary)
Stressor sensitive (Anthropogenic impact)
y y y y y y
Indi
cato
r Typ
e
Driver sensitive (natural)
y Secondary y y y y y
Primary state y y y y y
Driver
Indicator y y y y y y
Stru
ctur
al p
ositi
on
Measure y y y y y y y y y
Spec
ific
Con
duct
ivity
/ sa
linity
pH
Turb
idity
Col
our
Dis
solv
ed O
xyge
n
Nitr
ogen
spe
cies
Phos
phor
us
Nut
rient
sen
sitiv
ity
Hea
vy m
etal
s
Alg
al p
rodu
ctiv
ity
GP
P/
Res
pira
tion
Cat
egor
y
Alg
ae

THE FRAMEWORK
Report DWLBC 2007/12 Best Practice Framework for the Monitoring and Evaluation of Water Dependant Ecosystems 1: Framework
49
Not
es
Sen
sitiv
ity to
nut
rient
enr
ichm
ent
Hig
h sc
ore
good
!
Valu
able
indi
catio
n of
con
tam
inat
ion
End
-poi
nt, l
ow v
alue
indi
cate
s a
degr
aded
sys
tem
(u
nles
s kn
own
to b
e na
tura
lly s
peci
es p
oor h
abita
t)
Ofte
n m
ore
tole
rant
of d
egra
ded
habi
tats
Obs
erve
d/ex
pect
ed in
dex;
1 =
inta
ct, .
5 =
half
mis
sing
etc
.
Sam
ple
rand
om o
r sel
ecte
d qu
adra
ts a
nd a
sses
s %
ar
eal c
over
with
exo
tics
Phy
sica
l exa
min
atio
n, v
isua
l evi
denc
e
Pre
senc
e/ab
senc
e or
impa
ct e
vide
nce
Div
ersi
ty o
f ass
embl
age
- pre
senc
e/ab
senc
e of
key
sp
ecie
s D
iver
sity
of a
ssem
blag
e - p
rese
nce/
abse
nce
of k
ey
spec
ies
Div
ersi
ty o
f ass
embl
age
- pre
senc
e/ab
senc
e of
key
sp
ecie
s D
iver
sity
of a
ssem
blag
e - p
rese
nce/
abse
nce
of k
ey
spec
ies
In current programme?
End-point (retrospective) y y y y y y y y y y y y y
Diagnostic y y y y Y y y y y y y
Integrative y y y y
Anticipatory
Predictive (coal-mine canary)
Stressor sensitive (Anthropogenic impact) y y y y y y y y y y y y y y
Indi
cato
r Typ
e
Driver sensitive (natural)
y y y y y y
Secondary y y y y y y y y Primary state
Driver
Indicator y y y y y y y y y y y y y y
Stru
ctur
al p
ositi
on
Measure y y y Y y y y y y y
Spec
ific
Abun
danc
e
Pres
ence
/abs
ence
Ric
hnes
s
PE
T S
core
SIG
NA
L sc
ore
% n
atur
al s
peci
es
% e
xotic
spe
cies
O/E
inde
x
Inva
sive
s/ex
otic
s
Pla
nt/a
nim
al d
isea
se
Inse
ct p
ests
Rip
aria
n co
mm
uniti
es
Wet
land
com
mun
ities
Fres
hwat
er
com
mun
ities
D
eser
t com
mun
ities
Cat
egor
y
Dia
tom
s
Inve
rteb
rate
s
Fish
Bio
logi
cal
inte
grity

THE FRAMEWORK
Report DWLBC 2007/12 Best Practice Framework for the Monitoring and Evaluation of Water Dependant Ecosystems 1: Framework
50
Not
es
Min
imal
buf
fer s
trip
enha
nces
pot
entia
l im
pact
s of
ad
jace
nt c
atch
men
t In
dica
tive
of p
oten
tial t
hrea
ts a
nd ri
sks
Sm
alle
r siz
e, m
ore
susc
eptib
le to
var
iatio
ns in
ra
infa
ll
Indi
cativ
e of
pot
entia
l to
buffe
r pH
var
iatio
n
In current programme?
End-point (retrospective)
Diagnostic y y y y
Integrative
Anticipatory y
Predictive (coal-mine canary)
Stressor sensitive
(Anthropogenic impact)
Indi
cato
r Typ
e
Driver sensitive (natural)
Secondary
Primary state
Driver y y
Indicator
Stru
ctur
al p
ositi
on
Measure y y y y
Spec
ific
Buf
fer r
egio
n
Land
use
Cat
chm
ent s
ize
Maj
or io
n ch
emis
try
Cat
egor
y
Land
use
Geo
logy
Add
ition
al
Indi
cato
rs

THE FRAMEWORK
Report DWLBC 2007/12 Best Practice Framework for the Monitoring and Evaluation of Water Dependant Ecosystems 1: Framework
51
Figure 13. Blank WDE information diagram

THE FRAMEWORK
Report DWLBC 2007/12 Best Practice Framework for the Monitoring and Evaluation of Water Dependant Ecosystems 1: Framework
52
TASK 3.3 – CHOOSE MEASURES AND FREQUENCIES
3: Monitoring programme
Choose measures and frequencies
Consider resources
Review monitoring
Review/selectindicators
At this stage it may be worth returning to Task 1.2 and Figures 11 and 12 to refresh your memory about what your objectives for monitoring are, i.e. if you need a full range of monitoring from drivers through to end-points, including anticipatory indicators, or you simply need to monitor the end-point condition of an attribute. Also, it would help if you referred back to your Stommel diagram (Task 2.2) to revisit the spatial and temporal scale of your system.
Refer to Task 3.1 where existing monitoring has been identified. Consider what you NEED to monitor that is not already collected for the WDE of interest. In addition, check that all of the existing monitored variables do serve a purpose.
Figure 13 should outline what you need to monitor. You now need to choose your methods for quantifying your indicators and decide on the sampling or data interrogation frequencies (refer to the Technical Resource document for a list of references).
• Choose a monitoring time-frame for each objective and complete a time-line: ○ Use a long-term scale with sufficient detail to incorporate the short-term objective
monitoring. ○ Can the monitoring activities be overlapped to maximise efficiency?
Record your reporting intervals (if known) for future reference.
Refer to the material you have already gathered to guide you.
Use Table 13 to compile the information, stating why you have chosen the measures listed. For each indicator or variable, summarise how it is or will be measured/monitored, e.g. direct observation, piezometer logging, vegetation condition survey, manual sampling, and the methods; field, remote, instrumented. List any sampling equipment that may be required e.g. electronic instrumentation, aerial photography or vegetation quadrat etc. Detail the sampling frequency or data capture interval. List who is, or will be, collecting the data.

THE FRAMEWORK
Report DWLBC 2007/12 Best Practice Framework for the Monitoring and Evaluation of Water Dependant Ecosystems 1: Framework
53
Table 13. Indicator/variable monitoring information table
Indicator/variable Sampling method Equipment Survey frequency Collector

THE FRAMEWORK
Report DWLBC 2007/12 Best Practice Framework for the Monitoring and Evaluation of Water Dependant Ecosystems 1: Framework
54
TASK 3.4 – CONSIDER RESOURCES
3: Monitoring programme
Choose measures and frequencies
Consider resources
Review monitoring
Review/selectindicators
Task 3.3 sets out the intended indicators and variables, and how you might ideally monitor them. In this task, we summarise the resources available to conduct the monitoring, i.e. your budget, the logistics, personnel, laboratory and analysis facilities (for further information refer to the Technical Resource document).
Answer the following questions as fully as possible and highlight any action points that arise (Use a separate sheet to write full answers): 1. What is your annual budget for this programme, what is already allocated and how much
is available for this specific monitoring project, is it desirable, or possible, to redirect financial resources, and what additional sources of funding could you pursue to support the programme?
2. State the amount for the current programme: $
○ How much is allocated to staff or personnel? $ ____________ ○ Do you have to cover an institutional overhead? $ ____________ ○ What remains to cover all aspects of the monitoring? $ ____________
3. Referring to Task 3.1 above, investigate and summarise the cost of monitoring each indicator or variable for a year (consider one-off equipment and installation costs for new monitoring programmes). Is it necessary to defer certain expenses or phase-in equipment over a number of years to establish the full monitoring programme?
4. Consider staff time: allocate and cost the time to undertake routine field visits.
5. Estimate the requirement for reusable sampling media and equipment.
6. What laboratory facilities, personnel and time will you need to process your samples or material collected from the field?
7. Estimate and allocate staff time and resources for data processing, analysis, interpretation and reporting.
8. Consider any additional costs, such as personal protection equipment (to comply with occupational health and safety), vehicles, accommodation, flights, over-flights, remote sensing etc.
9. Compile the costs and compare with your available budget; adjust and prioritise your programme accordingly.
10. Can you still meet your monitoring objectives, if not what additional actions can be taken to address any short-fall in resources?

THE FRAMEWORK
Report DWLBC 2007/12 Best Practice Framework for the Monitoring and Evaluation of Water Dependant Ecosystems 1: Framework
55
GROUP 4 – IMPLEMENT AND ASSESS The Group 4 tasks include implementation of the monitoring programme; data collection; evaluation and assessment; review results and feed the Framework back to the various start points to close the adaptive management cycle.
TASK 4.1 – IMPLEMENTATION
4: Implement and assess
Review resultsagainst targets
Evaluate andassessCollect dataImplement
This task in the Framework is all about being organised and prepared for your monitoring. The following points will help facilitate your field-work and the practical implementation of your programme: 1. Ensure that actions to be carried out under your monitoring programme conform to all
relevant legislation, i.e. permits are required to collect flora and fauna in National Parks and there may be restrictions or prohibitions placed on collecting threatened species.
2. Organise the purchase of any new equipment or instrumentation for field implementation (take care to check specifications, to ensure quality).
3. Schedule any works and contractors to install structures etc.
4. Allocate staff, volunteer time or employ suitably qualified staff as required.
5. Identify training needs and conduct training, briefing sessions and workshops for staff and volunteers involved in sampling.
6. Compile a time-line or Gant chart setting-out the stages of implementation, regular field visits and times for data interrogation and reporting periods.
7. Devise a thorough set of data and field record sheets (do not rely on individuals notebooks as individuals record information to different degrees of thoroughness) that include:
○ Record sheet number, date, time, location (and unique site identifier) and staff names. ○ Space to record weather and additional information about the area, anything unusual
that might influence the results, e.g. tramping by cattle. ○ Space to record all field variables such as water temperature, pH, conductivity,
dissolved oxygen, turbidity and colour: include space for the instrument number of each hand-held meter etc. (see note below).
○ Other field data for biotic indices and measures and observations. ○ Telephone contact numbers for the laboratory, office, land-owner; EPA and other
useful numbers should additional advice or notification need to be given. ○ A list of instruments, tools and equipment to take to the field, especially if it is a remote
site. Ensure the form is clear in layout and easy to use, so important information does not get missed.

THE FRAMEWORK
Report DWLBC 2007/12 Best Practice Framework for the Monitoring and Evaluation of Water Dependant Ecosystems 1: Framework
56
8. Field instruction sheets (essential to ensure consistency and completeness): ○ Provide a concise and clear list of each measure and check to be made, with
procedures for each including instrument checking and calibration (record the calibration details).
○ Check with staff that all instructions are clear and unambiguous. ○ List the activities in an order that maximises efficiency. ○ Provide a tick box as an additional cross-check for each action or stage in the field
visit (this should be obvious from the field record sheet). ○ Make sure that the instructions have clear advice on do’s and don’ts relating to sample
handling and storage. ○ Include details of where samples should be taken and the names of laboratory staff
expected to receive the samples. ○ Don’t assume anything – always clearly state the obvious.
9. For systems with seasonal wetting-up and drying, you may want to consider how to remotely indicate the beginning of wetting-up, and hence when your season of observation commences. Low cost options include recruiting the assistance of a ranger or member of the public who visits the site regularly.
10. For event response monitoring you will need a ready-to-use event response kit which should include:
○ All field instruments and tools: lighting and head-torches; shelter; and spare batteries for all instruments.
○ Blank record sheets and instructions to act as a reminder if late night sampling is undertaken. Instructions should be thorough and clear, with a time-line and list of all variables and instruments necessary for the job. Make sure all personnel understand the instructions and amend them as required.
○ A roster of staff/volunteers available at short notice to assist with sampling and field-work.
○ Laboratory facilities and staff who are fully aware of your event monitoring intentions and capable of accommodating your samples at relatively short notice.
11. Make sure all field kits are checked and replenished AFTER each field trip, so that it is ready for the next use, and no delays are encountered if parts, or media are not available at short notice.
12. Weather watch for event sampling: regularly check the weather radar, synoptic charts and BOM forecasts in order to be prepared for an event, should one occur.
13. With regard to site selection, location, access and logistics:
○ Ensure your sites are representative of the system to be monitored, i.e. make sure you are monitoring the main body of water and that the depth is appropriate etc.
○ Referring to your indicators: ensure site disturbance and potential disturbance of endangered species is minimal.
○ When located on private land make sure you have full permission from the land owner to access the site on a regular basis. Ensure the owner knows when you will visit and has contact details and mobile phone numbers so they can contact you should any queries arise, or if they wish to notify you of events that are out of the ordinary.
○ Make sure that the sampling location is safe to access under all conditions and at night if event sampling is to be undertaken.

THE FRAMEWORK
Report DWLBC 2007/12 Best Practice Framework for the Monitoring and Evaluation of Water Dependant Ecosystems 1: Framework
57
○ Choose sites that are accessible by road, unless access by foot is unavoidable or preferable. Consider the physical requirement to get instruments and equipment to sampling sites.
○ Ensure that adequate personal protection is provided, including clean drinking water, sunscreen, a first aid kit, appropriate clothing and food.
14. QA/QC, Quality assurance and control in the context of environmental monitoring and for WDEs is intended to provide a chain of evidence from field sampling, through laboratory analysis and data handling, intended to ensure consistency and repeatability of results, such that any change or deviation from expected results can be checked, to ensure that it is an actual change in the system being monitored and not a consequence of some change in monitoring practice. The information provided under Task 3.4 in the Technical Resource document provides useful notes in this respect. A few additional measures not already noted above include:
○ Create a reference sheet which lists all field instruments, allocates a general use number (e.g. pH#1, this is the number to note on the record sheet), and the manufacturers serial number. By recording this number on the record sheet it is always known which instrument was in use and any faults can be adjusted for appropriately.
○ Instruments should be checked, serviced and calibrated according to the manufacturers specifications (and by an accredited laboratory if required) and at the recommended intervals.
○ Devise a unique sample code that includes a site/location mnemonic and sample number, label any samples or bottles with this information, including the date and time.
○ Laboratory practices – ensure that a memorandum setting-out agreed laboratory standards and practices exists that sets-out exactly how samples are to be treated and what analyses are to be undertaken, as well as, what blanks, standards, calibrations and inter-laboratory calibrations are needed. This will ensure consistency and is part of any standard QA/QC agreement.
15. A note on communication. Good, clear, open and non-defensive communication is often overlooked when devising a scientific programme, but it is a key aspect in the success of any monitoring programme. It is vital that staff at all levels have good communication skills. It is therefore recommended that any staff with identified communication blocks undertake additional workplace training to facilitate effective operation. This is likely to be challenging, but ultimately rewarding for the individual and for the programme as a whole.

THE FRAMEWORK
Report DWLBC 2007/12 Best Practice Framework for the Monitoring and Evaluation of Water Dependant Ecosystems 1: Framework
58
TASK 4.2 – COLLECT DATA
4: Implement and assess
Review resultsagainst targets
Evaluate andassessCollect dataImplement
Task 4.1 dealt with many logistical aspects associated with being prepared and collecting complete information while in the field. Task 2.5 covers issues regarding the data that is collected as listed below: 1. Ensure that instruments are on the most sensitive range for conditions being measured,
or set auto-range, allow sufficient time for instruments to stabilise.
2. Record all digits displayed (usually no more than four on most field instruments). This helps to maintain the resolution of the data and if rounding is dealt with in a systematic fashion when the raw data is being analysed, rounding errors can be minimised.
3. When entering data into your database or spreadsheet, be sure to enter the data exactly as it is written down, do not round.
4. If using a logger, always check that data is safely downloaded and readable, before clearing field instrumentation memory.
5. Only round laboratory data after any conversions to SI units have been made. Use standard rounding procedures.
6. Maintain unedited, uncleaned, archive copies of all raw data.
7. Collate and compile raw data for each site in a single table or spreadsheet.
8. Check for data errors and clean (data errors often involve a decimal place in the wrong location, plotting time-series of the data is an easy way to view points that fall outside the observed range). Mark cleaned points with a comment which states the original value.
9. Structure your spreadsheet or table to start with the site identifier, the sample number, date, sample time, analysis time, meteorological variables, hydrometric variables, physical-chemical water quality parameters, biotic indices, other information (this order associates with the ecosystem structure from drivers to primary state variables, secondary variables, indicators and end-points).
A new database system for South Australian WDEs is under investigation. The prototype system developed by Recknagel et al. (2006) offers an excellent system and provides useful tools for data analysis (App. 2 in the Technical Resource document).

THE FRAMEWORK
Report DWLBC 2007/12 Best Practice Framework for the Monitoring and Evaluation of Water Dependant Ecosystems 1: Framework
59
TASK 4.3 – EVALUATE AND ASSESS
4: Implement and assess
Review resultsagainst targets
Evaluate andassessCollect dataImplement
Once you have collected a few months worth of data you will begin to get an indication of the values and scores the system exhibits. 1. Visualisation of raw data is a key component of any analysis and interpretation, in that:
systematic variations and relationships between variables can be discerned and contribute to the conceptual understanding of the system (and the conceptual model). This should be the first task prior to undertaking any statistical tests, comparisons, transformations or aggregations.
○ Plot time-series of all variables, i.e. the x-axis is time, the y-axis is the variable and align each plot vertically so you can compare the variations in each. Organise the plots in ecosystem function order, so the driving variables are at the top of the page and the end-point indicator is at the bottom of the page.
2. Some variables are log-normally distributed, this means that in a frequency distribution plot, they tend to be skewed towards the x-axis origin, or in other words they have predominantly low values, and high values tend to increase by orders of magnitude rather than in a linear fashion. Plotting log10(x) can aid visualisation of the data, a typical example is flow data and water quality variables.
3. Some variables correlate negatively, i.e. they do the opposite to each other. When one goes-up the other goes down. This is often the case with flow and conductivity. Reversing the y-axis scale of either can be useful.
4. Excessive variability can also cause problems when trying to make useful comparisons. Aggregating the data by taking a running mean can be a useful way of removing excess ‘noise’ and revealing or enhancing a more gradual variation that was masked.
5. Calculate means and standard deviations to quantify baseline conditions and variability, and for different periods or sites to compare conditions between sites or relative to other reporting periods or times of the year. Use the appropriate tests that can be found in all basic statistical geography textbooks (e.g. Green 1979). A list of useful statistical text books is listed in the Technical Resource document.
6. Assess means against specific targets, control sites, literature values or expected values.
7. Visualise aggregated data and means to present information to managers, policy makers, stakeholders and the public – display the message (Fig. 14). Annotated diagrams that clearly point out the message being portrayed are particularly effective.

THE FRAMEWORK
Report DWLBC 2007/12 Best Practice Framework for the Monitoring and Evaluation of Water Dependant Ecosystems 1: Framework
60
Policy makers, Non-Scientists
Scientists, Field-level Practitioners
Science Environment
Public Environment
Effective communication
Sound Science
Use Assessment by experts to
translate scientific findings for policy
and decision-making
Highly Aggregated
Indices
Indicators, Indices and Information
Processed Data/Statistics
Raw Data
Simple, clear public message
“Improve ecosystem management through greater reliance on scientific
data”
Policy makers, Non-Scientists
Scientists, Field-level Practitioners
Science Environment
Public Environment
Effective communication
Sound Science
Use Assessment by experts to
translate scientific findings for policy
and decision-making
Highly Aggregated
Indices
Indicators, Indices and Information
Processed Data/Statistics
Raw Data
Highly Aggregated
Indices
Indicators, Indices and Information
Processed Data/Statistics
Raw Data
Simple, clear public message
“Improve ecosystem management through greater reliance on scientific
data”
Figure 14. The information and reporting pyramid: from sound science to effective communication (after Fancy 2003).
Appendix 5 of the Technical Resource document contains a summary of the South-East Queensland EHMP reporting system. This is a scorecard system proving to be very popular.

THE FRAMEWORK
Report DWLBC 2007/12 Best Practice Framework for the Monitoring and Evaluation of Water Dependant Ecosystems 1: Framework
61
TASK 4.4 – REVIEW RESULTS AGAINST TARGETS
4: Implement and assess
Review resultsagainst targets
Evaluate andassessCollect dataImplement
This task is intended to investigate whether the results derived from Task 4.3 demonstrate an improvement in condition or whether monitoring is meeting the objectives and targets identified in Task 1.2.
Are the indicators and measures capturing the information required to take appropriate management actions?
Refer to Task 3.1, the review of existing monitoring.
In addition, are existing management actions affecting the recovery or improvement in WDE condition that was intended?
Update your WDE information diagram as required.
Return to the Group 2 tasks and incorporate any new system understanding into your WDE conceptual models: • Do the results inform understanding?
• Is the conceptual diagram a good clear representation of the key processes, and does it present the system in a clear way?
• Are my stressor relationships valid?
• Is my state-and-transition model realistic?
You may also wish to review Task 1.2, which examines your M&E objectives – were they realistic? Have you exceeded expectations, or were your objectives wildly ambitious?
Having reviewed all aspects of the monitoring programme, summarise points for action and set a time-frame for implementing any changes (e.g. instrumentation, lab practices, sampling regime, event response etc.) and continue monitoring, reviewing and adapting, making use of the tools, tables and charts provided here. Refer to Figure 3, which provides a diagrammatic representation of the return paths within the Framework.

Report DWLBC 2007/12 Best Practice Framework for the Monitoring and Evaluation of Water Dependant Ecosystems 1: Framework
62

Report DWLBC 2007/12 Best Practice Framework for the Monitoring and Evaluation of Water Dependant Ecosystems 1: Framework
63
GLOSSARY Adaptive management: A management approach, often used in natural resource management, where there is little information and/or a lot of complexity and there is a need to implement some management changes sooner rather than later. The approach is to use the best available information for the first actions, implement the changes, monitor the outcomes, investigate the assumptions and regularly evaluate and review the actions required. Consideration must be given to the temporal and spatial scale of monitoring and the evaluation processes appropriate to the ecosystem being managed.
Ambient: The background level of an environmental parameter (e.g. a background water quality like salinity).
Anabranch: A branch of a river that leaves the main stream and later rejoins.
Aquifer: An underground layer of rock or sediment which holds water and allows water to percolate through.
Baseflow: The water in a stream that results from groundwater discharge to the stream. This discharge often maintains flows during seasonal dry periods and has important ecological functions.
Basin: The area drained by a major river and its tributaries.
Biological diversity (biodiversity): The variety of life forms: the different life forms including plants, animals and micro-organisms, the genes they contain and the ecosystems (see below) they form. It is usually considered at three levels — genetic diversity, species diversity and ecosystem diversity.
Biota: All of the organisms at a particular locality.
BOD: Biochemical oxygen demand.
BOM: Bureau of Meteorology.
Buffer zone: A neutral area that separates and minimises interactions between zones, whose management objectives are significantly different or in conflict (e.g. a vegetated riparian zone can act as a buffer to protect the water quality and streams from adjacent land uses).
Catchment: The area of land determined by topographic features within which rainfall will contribute to runoff at a particular point.
Drivers: exert major forcing influences on natural systems and are associated with large-scale processes. Examples include: climate, landform, geology/soils and time.
DWLBC: Department of Water, Land and Biodiversity Conservation. Government of South Australia.
Electrical Conductivity (EC): 1 EC unit = 1 micro-Siemen per centimetre (µS/cm) measured at 25 degrees Celsius, commonly used to indicate the salinity of water.
Ecological processes: All biological, physical or chemical processes that maintain an ecosystem.
Ecology: The study of the relationships between living organisms and their environment.
Ecosystem: Any system in which there is interdependence upon and interaction between living organisms and their immediate physical, chemical and biological environment.
Ecosystem process/response (attributes): are physical, chemical or biological factors that respond to the drivers and stressors. This response may either be positive or negative. Examples include: community and population dynamics, water and sediment quality; flow regime; stream geomorphology; physiology; and organism health.
Ecosystem services: All biological, physical or chemical processes that maintain ecosystems and biodiversity and provide inputs and waste treatment services that support human activities.
EHMP: Ecosystem Health Monitoring Programme.
Environmental water requirements (EWR): The water regimes needed to sustain the ecological values of aquatic ecosystems, including their processes and biological diversity, at a low level of risk.

GLOSSARY
Report DWLBC 2007/12 Best Practice Framework for the Monitoring and Evaluation of Water Dependant Ecosystems 1: Framework
64
EPA: Environment Protection Agency.
Ephemeral streams/wetlands: Those streams or wetlands that usually contain water only on an occasional basis after rainfall events. Many arid zone streams and wetlands are ephemeral.
Erosion: Natural breakdown and movement of soil and rock by water, wind or ice. The process may be accelerated by human activities.
Estuaries: Semi-enclosed waterbodies at the lower end of a freshwater stream that are subject to marine, freshwater and terrestrial influences, and experience periodic fluctuations and gradients in salinity.
Eutrophication: Degradation of water quality due to enrichment by nutrients (primarily nitrogen and phosphorus), causing excessive plant growth and decay. (See algal bloom).
Floodplain: Of a watercourse means: (a) the floodplain (if any) of the watercourse identified in a catchment water management plan or a local water management plan; adopted under Part 7 of the Water Resources Act 1997; or (b) where paragraph (a) does not apply — the floodplain (if any) of the watercourse identified in a development plan under the Development Act 1993, or (c) where neither paragraph (a) nor paragraph (b) applies — the land adjoining the watercourse that is periodically subject to flooding from the watercourse.
GAB: Great Artesian Basin.
GIS (geographic information system): Computer software that allows geographic data (for example land parcels) to be linked to textual data (soil type, land value, ownership). It allows for a range of features, from simple map production to complex data analysis.
Greenhouse effect: The balance of incoming and outgoing solar radiation which regulates our climate. Changes to the composition of the atmosphere such as the addition of carbon dioxide through human activities, have the potential to alter the radiation balance and to effect changes to the climate. Scientists suggest that changes would include global warming, a rise in sea level and shifts in rainfall patterns.
Groundwater: Water occurring naturally below ground level or water pumped, diverted or released into a well for storage underground.
Groundwater Dependent Ecosystem (GDE): An ecosystem that derives a part of its water budget from groundwater.
Habitat: The natural place or type of site in which an animal or plant, or communities of plants and animals, lives.
Health: A measure of ecosystem integrity based on vigor, resilience and organisation. High levels of each of these factors indicate a healthy ecosystem.
Heavy metal: Any metal with a high atomic weight (usually, although not exclusively, greater than 100), for example: mercury, lead and chromium. Heavy metals have a widespread industrial use, and many are released into the biosphere via air, water and solids pollution. Usually these metals are toxic at low concentrations to most plant and animal life.
Hydrology: The study of the characteristics, occurrence, movement and utilisation of water on and below the earth’s surface and within its atmosphere. (See hydrogeology.)
Hyporheic zone: The wetted zone among sediments below and alongside rivers. It is a refuge for some aquatic fauna.
Indigenous species: A species that occurs naturally in a region.
Irrigation: Watering land by any means for the purpose of growing plants.
Lake: A natural lake, pond, lagoon, wetland or spring (whether modified or not) and includes: part of a lake; and a body of water declared by regulation to be a lake; a reference to a lake is a reference to either the bed, banks and shores of the lake or the water for the time being held by the bed, banks and shores of the lake, or both, depending on the context.
M&E: see Monitoring and Evaluation.
MAT: Management Action Target.

GLOSSARY
Report DWLBC 2007/12 Best Practice Framework for the Monitoring and Evaluation of Water Dependant Ecosystems 1: Framework
65
Macroinvertebrates: Animals without backbones that are typically of a size that is visible to the naked eye. They are a major component of aquatic ecosystem biodiversity and fundamental in food webs.
Measurements: Measures of the vital sign/indicator. A measure of water quality may be electrical conductivity and a measure for the macroinvertebrate community may be structure and composition.
Model: A conceptual or mathematical means of understanding elements of the real world which allows for predictions of outcomes given certain conditions. Examples include, estimating storm runoff, assessing the impacts of dams or predicting ecological response to environmental change.
Monitoring and Evaluation: The process of undertaking regular data collection, data that is then comprehensively analysed to determine if the programme aims and objectives are being met.
Mount Lofty Ranges Watershed: The area prescribed by Schedule 1 of the regulations.
NAP: National Action Plan for Salinity and Water Quality.
NO3_N: aqueous nitrogen in the form of the highly mobile nitrate anion, and expressed as nitrate_nitrogen, i.e. 1mg/L NO3_N ≡ 4.429 mg/L NO3 (1xN [m.w. 14] + 3xO [m.w. 16]).
Natural recharge: The infiltration of water into an aquifer from the surface (rainfall, streamflow, irrigation etc.) (See recharge area, artificial recharge.).
NHT: Natural Heritage Trust.
Natural Resources: Soil; water resources; geological features and landscapes; native vegetation, native animals and other native organisms; and ecosystems.
Natural Resources Management (NRM): All activities that involve the use or development of natural resources and/or that impact on the state and condition of natural resources, whether positively or negatively.
OECD: Organisation for Economic Co-operation and Development
Owner of land: In relation to land alienated from the Crown by grant in fee simple — the holder of the fee simple; in relation to dedicated land within the meaning of the Crown Lands Act 1929 that has not been granted in fee simple but which is under the care, control and management of a Minister, body or other person — the Minister, body or other person; in relation to land held under Crown lease or licence — the lessee or licensee; in relation to land held under an agreement to purchase from the Crown — the person entitled to the benefit of the agreement; in relation to any other land — the Minister who is responsible for the care, control and management of the land or, if no Minister is responsible for the land, the Minister for Environment and Heritage.
Phreaphytic vegetation: Vegetation that exists in a climate more arid than its normal range by virtue of its access to groundwater.
Phytoplankton: The plant constituent of organisms inhabiting the surface layer of a lake; mainly single-cell algae.
Pollution, diffuse (or non-point) source: Pollution from sources that are spread out and not easily identified or managed (e.g. an eroding paddock, urban or suburban lands and forests).
Pollution, point source: A localised source of pollution.
PP: Primary productivity.
Ramsar Convention: This is an international treaty on wetlands titled The Convention on Wetlands of International Importance Especially as Waterfowl Habitat. It is administered by the International Union for Conservation of Nature and Natural Resources. It was signed in the town of Ramsar, Iran in 1971, hence its common name. The Convention includes a list of wetlands of international importance and protocols regarding the management of these wetlands. Australia became a signatory in 1974.
RCT: Resource Condition Target.
Rehabilitation (of waterbodies): Actions that improve the ecological health of a waterbody by reinstating important elements of the environment that existed prior to European settlement.
Restoration (of waterbodies): Actions that reinstate the pre-European condition of a waterbody.

GLOSSARY
Report DWLBC 2007/12 Best Practice Framework for the Monitoring and Evaluation of Water Dependant Ecosystems 1: Framework
66
Riparian zone: That part of the landscape adjacent to a waterbody that influences and is influenced by watercourse processes. This can include landform, hydrological or vegetation definitions. It is commonly used to include the in-stream habitats, bed, banks and sometimes floodplains of watercourses.
Seasonal watercourses or wetlands: Those watercourses and wetlands that contain water on a seasonal basis, usually over the winter/spring period, although there may be some flow or standing water at other times.
SOE: State of Environment.
Stressors: cause significant changes in ecological components, patterns and relationships. Barrett et al. (1976) give this definition: “Stress is defined here as a perturbation (stressor) applied to a system (a) which is foreign to that system or (b) which is natural to that system but applied at an excessive [or deficient] level.” Examples may include changes in: salinity and nutrients, groundwater level, flooding regime and invasion of exotic species.
Surface water: (a) water flowing over land (except in a watercourse), (i) after having fallen as rain or hail or having precipitated in any another manner, (ii) or after rising to the surface naturally from underground; (b) water of the kind referred to in paragraph (a) that has been collected in a dam or reservoir.
Taxa: General term for a group identified by taxonomy, which is the science of describing, naming and classifying organisms.
Vital sign/indicator: Any “information rich” feature of an ecosystem that may be independent or integrative and may be measured or estimated to provide insight into the condition of the ecosystem. Examples may include water quality and the macroinvertebrate community.
Waterbody: Waterbodies include watercourses, riparian zones, floodplains, wetlands, estuaries, lakes and groundwater aquifers.
Water Dependent Ecosystems (WDE): Those parts of the environment, the species composition and natural ecological processes, which are determined by the permanent or temporary presence of flowing or standing water, above or below ground. The in-stream areas of rivers, riparian vegetation, springs, wetlands, floodplains, estuaries and lakes are all water-dependent ecosystems.
Wetlands: Defined by the Act as a swamp or marsh and including any land that is seasonally inundated with water. This definition encompasses a number of concepts that are more specifically described in the definition used in the Ramsar Convention on Wetlands of International Importance. This describes wetlands as areas of permanent or periodic/intermittent inundation, whether natural or artificial, permanent or temporary, with water that is static or flowing, fresh, brackish or salt, including areas of marine water the depth of which at low tides does not exceed six metres.

Report DWLBC 2007/12 Best Practice Framework for the Monitoring and Evaluation of Water Dependant Ecosystems 1: Framework
67
REFERENCES
Barrett, SW, Van Dyne, GM & Odum, EP 1976, ‘Stress ecology’, BioScience, 26(3), pp. 192-94.
DEHAA 1998, State of the environment report for South Australia 1998. Department for Environment, Heritage and Aboriginal Affairs, Adelaide.
Downes, BJ, Barmuta, LA, Fairweather, PG, Faith, DP, Keough, MJ, Lake, PS, Mapstone, BD & Quinn, GP 2002, Monitoring ecological impacts: concepts and practice in flowing waters, Cambridge University Press, Cambridge.
DWLBC 2006, State natural resources management plan. Department of Water, Land and Biodiversity Conservation, Adelaide.
Finlayson, CM & Mitchell, DS 1999, ‘Australian wetlands: the monitoring challenge’, Australian Journal of Ecology, 13, pp. 463 - 468.
Fancy, S 2003, ‘Conceptual models: one approach’, unpublished manuscript. National Parks and Wildlife Service, Washington D.C (on file at Greater Yellowstone Network office, Bozeman MT).
Green, RH 1979, Sampling design and statistical methods for environmental biologists, Wiley, New York.
Gross, JE 2003, ‘Developing conceptual models for monitoring programs’ National Parks Service Inventory and Monitoring Program, Ft Collins, CO, viewed 23 May 2007, <http://science.nature.nps.gov/im/monitor/docs/Conceptual_Modelling.pdf>.
Noon, BR, Spies, TA & Raphael, MG 1999, ‘Chapter 2: Conceptual basis for designing an effectiveness monitoring program’, in BS Mulder, BR Noon, TA Spies, MG Raphael, J Craig, AR Olsen, GH Reeves & HH Welsh (eds), The strategy and design of the effectiveness monitoring program for the Northwest Forest Plan, USDA Forest Service General Technical Report PNW-GTR-437, USDA Forest Service, Pacific Northwest Station, Portland, Oregon, USA, pp. 21-48.
Recknagel, F, He Zhang, B, & Wells, S 2006, ‘Ecological data warehouse (EDW) for water dependent ecosystems in South Australia: the prototype’, School of Earth and Environmental Sciences. University of Adelaide.
Seaman, RL 2002, ‘Wetland inventory for the Mount Lofty Ranges’, Department for Environment and Heritage, Adelaide.
Stephens, SH & Daniel, RG (eds) 2006, ‘Appendix H: Conceptual models and ecological overview of Pacific Island Network ecosystems’, in L Haysmith, FL Klasner, SH Stephens, & GH Dicus, Pacific Island Network vital signs monitoring plan, Natural Resource Report NPS/PACN/NRR – 2006/0003 National Park Service, Fort Collins, Colorado.
Stommel, H 1963, ‘Varieties of oceanographic experience’, Science 139 pp. 572-576.
Thomas, LP, DeBacker, MD, Boetsch, JR & Peitz, DG 2001, ‘Conceptual framework, monitoring components and implementation of a NPS long-term ecological monitoring program’, Prairie cluster prototype program status report, US National Parks Service, viewed 23 May 2007 <http://www.nature.nps.gov/im/units/prcl/pdf/ConceptDesignForDistribution.pdf>.
Wilkinson, RJ, Reynolds, B, & Neal, C 1997, ‘The impact of conifer harvesting and replanting on upland water quality’, R&D Progress Report to EA P2i502/6&7.


