51
Copyright (c) (2014) PE International AG – All rights reserved Best Practice LCA: Impact Assessment Webinar October 1, 2014

Copyright (c) (2014) PE International AG – All rights reserved
Best Practice LCA: Impact Assessment
Webinar
October 1, 2014

Copyright (c) (2014) PE International AG – All rights reserved
Agenda
Short background
• Methodologies: CML, TRACI, ReCiPe,
ILCD/PEF
• Models: USEtox, Riskpoll, AE
Impact categories
• Global Warming (GWP100)
• Photochemical Ozone Creation (POCP)
• Acidification (AP)
• Eutrophication (EP)
• Human and Eco-Toxicity (ETP + HTP)
• Resource depletion (ADP)

Copyright (c) (2014) PE International AG – All rights reserved
Short methodology
background
3

Copyright (c) (2014) PE International AG – All rights reserved
LCA workflow according to ISO 14040/44
Goal and scope definition
Inventory analysis
Impact assessment
LCA framework
Inte
rpre
tation
§4.2 ISO 14044
§4.3 ISO 14044
§4.4 ISO 14044
§4.5
ISO
14044

Copyright (c) (2014) PE International AG – All rights reserved
Human toxicity
Photochemical oxidant formation
Ozone depletion
Climate change
Acidification
Eutrophication
Ecotoxicity
Land use impacts
Species & organism dispersal
Abiotic resources deplection
Biotic resources deplection
LCI
results
Human Health
Biotic & abiotic
natural environment
Biotic & abiotic
natural resources
Biotic & abiotic
manmade resources
Midpoint/Endpoint indicators

Copyright (c) (2014) PE International AG – All rights reserved
• LCIA recommendations, 2011
• Level I: Recommended and satisfactory
• Level II Recommended, some improvements needed
• Level II Recommended, but to be applied with caution
• ILCD and PEF = Identical LCIA
• Emphasis on European methodologies
• heterogeneous continent,
• middle latitude
• ok to represent average global fate
ILCD / PEF
6

Copyright (c) (2014) PE International AG – All rights reserved
• Commissioned by 4 Dutch ministries
• Carried out by:
• CML (University of Leiden, Netherlands)
• Bureau B&G (Fuels and Raw Materials Bureau), Netherlands
• Systems Engineering, Policy Analysis and Management – Delft University of Technology
• History
• Published 1996
• Methodology update in 2001
• Substance updates 2001-2013
• Up until now the PE recommended methodology (excl. US)
• Medium ILCD scores due to less advanced methodologies
CML
7

Copyright (c) (2014) PE International AG – All rights reserved
• Supported by Dutch Government
• PRé Consultants, Amersfoort, Netherlands
• CML, University of Leiden, Netherlands
• RUN, Radboud University Nijmegen Netherlands
• RIVM, Bilthoven, Netherlands
• CML (midpoint) and Ecoindicator (endpoint)
• Currently on version 1.08, 2012
• Better scores than CML in ILCD evaluation for most impacts
ReCiPe
8

Copyright (c) (2014) PE International AG – All rights reserved
• Tool for the Reduction and Assessment of
Chemical and Other Environmental Impacts
• Developed by the U.S. Environmental Protection
Agency (US EPA)
• History
• Work began in 1995 because no US equivalent to
CML
• US EPA decided to begin development of software
• Currently version 2.1
• Application
• Both research and applied
• Default in US/CAN – (almost) not used elsewhere
TRACI
9

Copyright (c) (2014) PE International AG – All rights reserved
Not covered
Impacts
• Water:
• Water assessment methods -
Dec 2, 2014, 16:00 CEST
• Water footprinting in GaBi -
Dec 9, 2014, 16:00 CEST
• Ozone depletion
• Ionizing radiation
• Land use
• Particles / respiratory inorganics
Methodologies
10

Copyright (c) (2014) PE International AG – All rights reserved
Impact categories
11

Copyright (c) (2014) PE International AG – All rights reserved
• Geography
• US: TRACI
• Europe: CML, ReCiPe, Impact World+
• Other regions: Lime
• ILCD/PEF
• ‘Composite’ version
• EN15804 EPDs
• CML
Key influencing factors
Recommendations
12

Copyright (c) (2014) PE International AG – All rights reserved
Global Warming (Radiative Forcing)

Copyright (c) (2014) PE International AG – All rights reserved
• CML, ReCiPe, TRACI all based on IPCC AR4
• ILCD recommended
• 100 year is a value choice, but consensus in science
• Same reference substance – results directly comparable
• NEW: AR5: Assessment Report 5, 2013
• Approved version April 2014
• + 110 substances
• GaBi end 2014 as separate Quantity
• CML + ReCiPe + TRACI will probably follow
• GWP 20 & 100, GTP 20, 50 & 100
Global Warming
14

Copyright (c) (2014) PE International AG – All rights reserved
Global Warming: AR4 AR5
AR4 AR5
Carbon dioxide (CO2) 1 1
Methane (CH4) 25 30
Nitrous oxide (N2O) 298 265
0
10
20
30
40
50
60
70
0-20% 20-40% >40%
Nu
mb
ers
of
sub
stan
ces
Delta intervals
GWP values AR4 -> AR5
15

Copyright (c) (2014) PE International AG – All rights reserved
Smog Creation (Photo Oxidant Formation)

Copyright (c) (2014) PE International AG – All rights reserved
Smog creation
TRACI
• Maximum Incremental Reactivity
(MIR)
• ΔO3 concentration
• O3 eq
• Urban areas in North America
Methodological background
17
CML and ReCiPe
• Photochemical Ozone Creation
Potential (POCP)
• ΔO3 concentration
• CML: C2H4 eq (ethylene)
• ReCiPe: NMVOC eq
• Regional European scenarios

Copyright (c) (2014) PE International AG – All rights reserved
Smog creation
• TRACI covers 900 + 280 non-
specific
• TRACI uses MIR values
• O3 equivalents
• Not comparable in absolute
values to ReCiPe and CML
• Same substances are important
Substance coverage
18
• CML and ReCiPe cover ~125
• CML and ReCiPe use POCP
• Same same but different
• CML: Ethene (C2H4)
• ReCiPe: NMVOC (unspecific)
• CFReCiPe /CFC2H4 = CFCML
• ILCD recommend ReCiPe

Copyright (c) (2014) PE International AG – All rights reserved
POCPs vs. MIRs – same substances important
Smog creation
-200
-100
0
100
200
300
400
500
600
700
800
Bia
cety
l
Met
hyl
met
hac
ryla
te (
MM
A)
Met
hac
ryla
te
Met
hyl
nit
rite
cis-
2-B
ute
ne
Met
hyl
vin
yl k
eto
ne
Fura
n
2-M
eth
yl-2
-bu
ten
e
Bu
tad
ien
e
Xyl
ene
(dim
eth
yl b
enze
ne)
C9
-C1
0 a
rom
ates
Iso
pro
pyl
amin
e
2-C
hlo
rom
eth
yl-3
-ch
loro
pro
pen
e
Cyc
lop
ente
ne
ort
ho
-Eth
ylto
luen
e
par
a-Et
hyl
tolu
ene
Form
ald
eh
yde
(met
han
al)
Pen
tan
ald
ehyd
e
iso
-Bu
ten
e
Iso
ph
oro
ne
1-H
epte
ne
3-M
eth
ylb
uta
no
ic a
cid
1-B
uta
no
l
1-P
rop
ylb
enze
ne
1-P
rop
ano
l
Die
thyl
ene
glyc
ol
Cu
men
e (i
sop
rop
ylb
enze
ne)
NM
VO
C (
un
spec
ifie
d)
Cyc
loh
exan
ol
1,2
,3-P
rop
anet
rio
l (G
lyce
rin
)
Diis
op
rop
ylet
her
Tetr
alin
2-C
hlo
roto
luen
e
Vin
yl c
hlo
rid
e (V
CM
; ch
loro
eth
ene)
Hex
ane
(iso
mer
s)
Bu
tan
e (n
-bu
tan
e)
Ph
thal
ic a
nh
ydri
de
1,2
-Bu
tan
dio
l
Die
than
ola
min
e
1-M
eth
yl-2
-pyr
rolid
on
e
ort
ho
-Cre
sol
Pen
tan
e (n
-pen
tan
e)
Met
hyl
iso
pro
pyl
keto
ne
No
nan
e
Dec
ane
2-E
thyl
-1-h
exan
ol
Do
dec
ane
Ch
loro
pic
rin
Bu
tyri
c ac
id (
bu
tan
e ac
id)
1,1
-Dic
hlo
roet
hyl
ene
Pro
pyl
ene
glyc
ol m
eth
yl e
ther
ace
tate
Pro
pyl
ace
tate
2,4
-Dim
eth
ylp
enta
ne
2,5
-Dim
eth
ylh
exan
e
2,4
-Dim
eth
ylh
epta
ne
Ben
zen
e
Dib
uty
lph
thal
ate
2-M
eth
ylp
rop
ano
ic a
cid
C7
Cyc
lic k
eto
nes
Pro
pio
nic
aci
d (
pro
pan
e ac
id)
2,2
,3 T
rim
eth
ylb
uta
ne
iso
-Pen
tyla
ceta
te
Neo
pen
tan
e
Cyc
loal
kan
es (
un
spec
.)
C9
Cyc
lic k
eto
nes
C1
0 C
yclic
ket
on
es
1-B
uty
lpro
pio
nat
e
Eth
ine
(ace
tyle
ne)
Thio
ben
carb
Hex
ylcy
clo
hex
ane
iso
-Bu
tyl i
sob
uty
rate
3,9
-Die
thyl
un
dec
ane
Hex
adec
ane
Sulp
hu
r d
ioxi
de
tert
iary
-Bu
tyl a
ceta
te
Dic
hlo
rop
rop
ane
Dim
eth
yl s
ucc
inat
e
Dic
hlo
rob
en
zen
e (o
-DC
B;
1,2
-dic
hlo
rob
enze
ne)
Car
bo
n m
on
oxi
de
Cyc
lop
rop
ane
1,1
,1-T
rich
loro
eth
ane
Met
han
e
R 2
25
cb (
dic
hlo
rop
enta
flu
oro
pen
tan
e)
R 4
3-1
0 (d
ecaf
luo
rop
enta
ne)
POCP indexed to average = 100
TRACI
ReCiPe
CML
Average per method
19

Copyright (c) (2014) PE International AG – All rights reserved
Smog creation
GaBi 2011: NOx split into NO and NO2 for truck emissions.
• Heavy trucks in city center emits NO
• CML good for air quality ?!?!
• ReCiPe no effect on air quality ?!?!
• Authors: “ReCiPe assumes average European weather conditions while CML assumes
that the sun always shines”
The nitrogen monoxide (NO) problem
20
NO2 NO NOx Unit
CML 2013 0.028 -0.427 0.028 kg C2H4-eq.
TRACI 2.1 16.8 24.8 24.8 kg O3-eq.
ReCiPe 1.08 1 #N/A 1 kg NMVOC eq.

Copyright (c) (2014) PE International AG – All rights reserved
Acidification

Copyright (c) (2014) PE International AG – All rights reserved
Acidification
• Atmospheric models;
• CML, ReCiPe, AE = Europe,
• TRACI = US
• CML and TRACI
• TRACI use H+; CML converts this to SO2e
• Deposition of acidifying substances; no soil reaction
• ReCiPe
• One step further; includes Base Saturation (BS) of soil
• Higher BS =
• more basic cations
• higher buffer capacity of soil
• neutralize more acid
• Accumulated exceedance (AE), ILCD recommend
• One step further; includes ecosystem sensitivity on national level
Methodological background
22
𝐵𝑆 = 𝐵𝑎𝑠𝑒 𝑐𝑎𝑡𝑖𝑜𝑛𝑠
𝐶𝑎𝑡𝑖𝑜𝑛 𝐸𝑥𝑐ℎ𝑎𝑛𝑔𝑒 𝐶𝑎𝑝𝑎𝑐𝑖𝑡𝑦 (𝐶𝐸𝐶) 𝑥 100
Why is CFSO2 = 1.2 SO2 eq ?!?!
It should say
CFSO2, EU = 1.2SO2-Suisse-eq

Copyright (c) (2014) PE International AG – All rights reserved
Acidification
• TRACI covers the
most substances
• PE has calculated
additional values
and verified with
CML authors
• AE cover fewest
Substance coverage
23
0
2
4
6
8
10
12
14
16
CML ReCiPe TRACI AccumulatedExceedance
No
. of
sub
stan
ces
cove
red
PE Calculated& verified
Methodology
EDIP
19
97
+N
H4
fate
mo
de
l

Copyright (c) (2014) PE International AG – All rights reserved
Acidification
• TRACI and CML
(incl. PE factors)
produce similar
values
• ReCiPe produce
different values
for NO/NOx
Comparison of characterization factors
24
0.0
0.5
1.0
1.5
2.0
2.5
3.0
3.5
Nit
roge
n d
ioxi
de
Nit
roge
n o
xid
es
Sulf
ur
dio
xid
e
Hyd
roch
lori
c ac
id
Am
mo
nia
Hyd
roge
n s
ulf
ide
Hyd
rofl
uo
ric
acid
Nit
ric
oxi
de
Sulf
ur
oxi
de
s (s
ox)
Ph
osp
ho
ric
acid
Sulf
ur
trio
xid
e
Sulf
uri
c ac
id
Nit
ric
acid
Am
mo
niu
m
Am
mo
niu
m n
itra
te
Hyd
roge
n b
rom
ine
SO2
eq
.
Acidification CML (incl. PE)
ReCiPe
TRACI
AE

Copyright (c) (2014) PE International AG – All rights reserved
Eutrophication

Copyright (c) (2014) PE International AG – All rights reserved
Aquatic Eutrophication
Biomass formation; unlimited supply of other nutrients
• ‘Average’ chemical composition of aquatic organisms: C106H263O110N16P
• 1 mol biomass: 16 mol N and 1 mol P
• 1 kg biomass: 6.3% N and 0.9% P
Different reference substance
• CML: kg PO43- eq.
• TRACI kg N eq.
• ReCiPe freshwater: kg P eq.
• ReCiPe marine: kg N eq.
Air emissions
• TRACI air emissions assume 85% removal
• CML and ReCiPe assume no removal
Methodological background
26

Copyright (c) (2014) PE International AG – All rights reserved
Aquatic Eutrophication
• Equal coverage on number
• PE calculation
• Organic substance CxHyOz
• C CO2; H H2O; O H2O & CO2
• PE calculated using COD
• ILCD recommend ReCiPe for
aquatic
Substance coverage
27
0
5
10
15
20
25
30
CML ReCiPe TRACI
PE Calculated and verified
Methodology

Copyright (c) (2014) PE International AG – All rights reserved
Aquatic Eutrophication
• Values can be
converted to
same unit: 16
mole N per 1
mole P
• Values are
virtually
identical
Comparison of characterization factors
28
0.0
0.5
1.0
1.5
2.0
2.5
3.0
3.5
Ph
osp
ha
te e
q.
Eutrophication
CML
ReCiPe
TRACI
Copyright (c) (2014) PE International AG – All rights reserved
Terrestrial Eutrophication
Accumulated Exceedance (AE), ILCD recommended
• Includes ecosystem sensitivity
• Implemented on global average
• 6 substances
29

Copyright (c) (2014) PE International AG – All rights reserved
Toxicity

Copyright (c) (2014) PE International AG – All rights reserved
• UNEP
• Model developers worldwide
• Now at DTU, Denmark
• ILCD + PE recommend
• 100% in TRACI
Toxicity
• Dutch
• CML authors
• Simplebox + USES-LCA
• CML + ReCiPe
• (despite authors involved in USEtox)
31

Copyright (c) (2014) PE International AG – All rights reserved
• Multi-media, steady-state
• Global, continental and regional compartments
• Fate x exposure x effect
Toxicity
32

Copyright (c) (2014) PE International AG – All rights reserved
Toxicity
• USEtox
• Contains many
substances not
characterized
• Flagged = higher
uncertainty
• Many flows are not
implemented in GaBi
• not needed in
2000+ LCAs
Number of substances
33
0
500
1000
1500
2000
2500
3000
3500
Usetox, Human USEtox, Eco CML ReCiPe 1.07 ReCiPe 1.08
Nu
mb
er
of
sub
stan
ces
Number of substances covered in LCIA methods
n/a
Flagged
Recommended
GaBi standard flow list
Copyright (c) (2014) PE International AG – All rights reserved
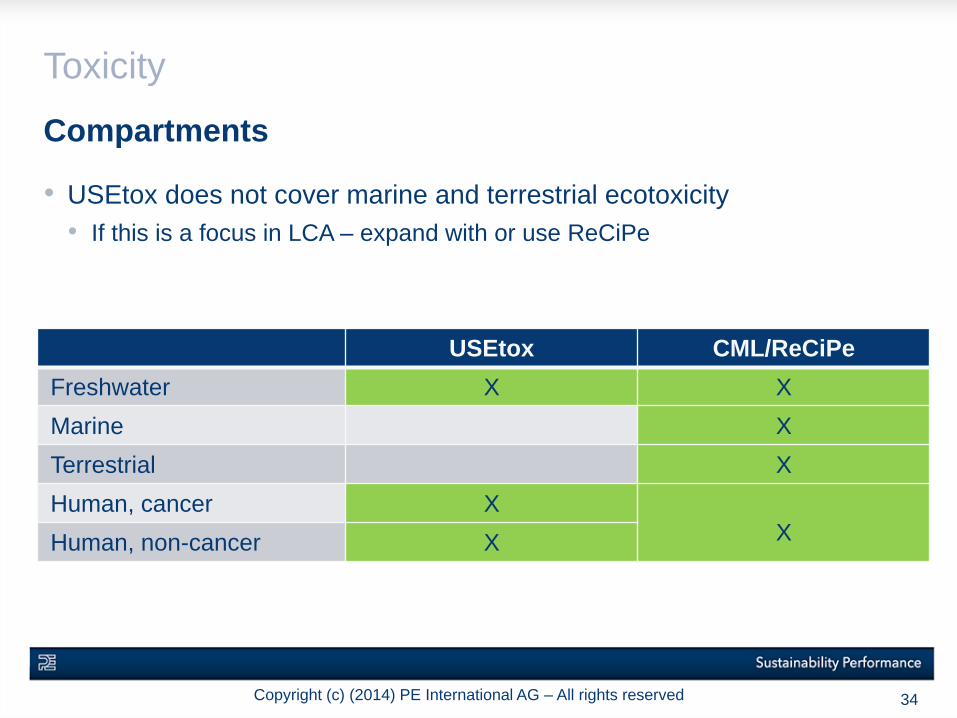
Toxicity
• USEtox does not cover marine and terrestrial ecotoxicity
• If this is a focus in LCA – expand with or use ReCiPe
34
USEtox CML/ReCiPe
Freshwater X X
Marine X
Terrestrial X
Human, cancer X
XHuman, non-cancer X
Compartments

Copyright (c) (2014) PE International AG – All rights reserved
1. Identify key contributing emissions and process steps
2. Display these as percentage breakdown only (no absolute values)
3. Recommendations or conclusions should only be based on this information
4. If there are outliers, double-check with at least one other methodology
PE Methodology Guideline MCG-02-2011
USEtox™ in LCA
35
0% 20% 40% 60% 80% 100%
product B
product AMercury (to air)
Selenium (to air)
Copper (to air)
Barium (to air)
Nickel (to water)
Other

Copyright (c) (2014) PE International AG – All rights reserved
Resource Depletion Potential
36

Copyright (c) (2014) PE International AG – All rights reserved
Resource Depletion Potential
• ADP = 𝐸𝑥𝑡𝑟𝑎𝑐𝑡𝑖𝑜𝑛 𝑟𝑎𝑡𝑒
𝑅𝑒𝑠𝑒𝑟𝑣𝑒𝑠2𝐸𝑥𝑡𝑟𝑎𝑐𝑡𝑖𝑜𝑛 𝑟𝑎𝑡𝑒 𝑆𝑏
(𝑅𝑒𝑠𝑒𝑟𝑣𝑒𝑠 𝑆𝑏) 2
• Ultimate = earth crust default in CML
• Base = meets physical and chemical criteria ILCD recommendation
• Economic = economic sense to extract
• Anthropogenic ADP (AADP)
Methodological background CML
37
Ultimate Base Econ

Copyright (c) (2014) PE International AG – All rights reserved
Resource Depletion
• 47 mineral deposit types
containing several
minerals/metals
• The highest ore grade is mined
first
the value of ore decrease
future is more expensive to
mine
ReCiPe
38
y = -6E+11x + 4E+11R² = 0.9046
0
5E+10
1E+11
1.5E+11
2E+11
2.5E+11
3E+11
3.5E+11
4E+11
4.5E+11
5E+11
0 0.1 0.2 0.3 0.4 0.5 0.6 0.7 0.8
Cu
mu
late
d y
ield
($
)
Ore grade value ($/kg)
Dunitic - ni
1. The more
you mine
2. The lower ore
value you will use

Copyright (c) (2014) PE International AG – All rights reserved
Metal/resource depletion
• CML covers the most
substances
• ReCiPe + AADP less
than half
• And TRACI none
Comparison
39
0
10
20
30
40
50
60
CML ReCiPe TRACI AADP
Nu
mb
er
of
ele
me
nts
Elements

Copyright (c) (2014) PE International AG – All rights reserved
Metal/resource depletion: Compared
• Example: Galvanized steel
• CML = Zinc dominating
• ReCiPe = Iron dominating
• Zinc a little more expensive to mine
(ReCiPe)…
• …but much lower reserves (CML).
• From 4 orders of magnitude to
factor 2 between CFs for Zn and Fe
CML vs. ReCiPe
40
0
20
40
60
80
100
CML ReCiPe
%
Rest
Manganese ore
Iron ore
Zinc ores

Copyright (c) (2014) PE International AG – All rights reserved
Resource depletion
• Rare Earth metals = Not
the rarest in total
abundance
• They do not concentrate
in ores – scattered in
earth crust
• Not available from USGS
• Not in CML, baseline
• Not in ReCiPe
• ILCD: Same factor for all
RE
Rare earth metals
41

Copyright (c) (2014) PE International AG – All rights reserved
• End of Life modelling - Oct 28, 2014, 16:00 CEST/ 11:00 EDT
• Water assessment methods - Dec 2, 2014, 16:00 CEST
• Water footprinting in GaBi - Dec 9, 2014, 16:00 CEST
www.pe-international.com/academy/webinars/
Best Practice LCA
Upcoming webinars
42

Copyright (c) (2014) PE International AG – All rights reserved
z
43
Thank you very much!
GaBi user group on LinkedIn

Copyright (c) (2014) PE International AG – All rights reserved
References and links
• AR4: The Physical Science Basis. Contribution of Working Group I to
the Fourth Assessment Report of the Intergovernmental Panel on
Climate Change
• AR5: Climate Change 2013: The Physical Science Basis. Contribution
of Working Group I to the Fifth Assessment Report of the
Intergovernmental Panel on Climate Change
• http://www.ipcc.ch/
Global Warming Potential

Copyright (c) (2014) PE International AG – All rights reserved
References and links
• CML• Derwent, R.G., M.E. Jenkin & S.M. Saunders, 1996. Photochemical ozone creation potentials for a large number of
reactive hydrocarbons under European conditions. Atmos. Environ. 30 (2): 181–199.
• Derwent, R.G., M.E. Jenkin, S.M. Saunders & M.J. Pilling, 1998. Photochemical ozone creation potentials for organic compounds in Northwest Europe calculated with a master chemical mechanism. Atmos. Environ. 32 (14–15): 2429–2441.
• Jenkin, M.E. & G.D. Hayman, 1999. Photochemical ozone creation potentials for oxygenated volatile organic compounds: sensitivity to variations in kinetic and mechanistic parameters. Atmos. Environ. 33 (8): 1275–1293.
• ReCiPe• Rosalie van Zelm, Mark A.J. Huijbregts, Henri A. den Hollander, Hans A. van Jaarsveld, Ferd J. Sauter, Jaap Struijs,
Harm J. van Wijnen and Dik van de Meent. European characterization factors for human health damage of PM10 and ozone in life cycle impact assessment. Atmospheric Environment 42 (2008): 441-453
• TRACI• Carter W (2007) Development of the SAPRC-07 chemical mechanism and updated ozone reactivity scales, final
report, California Air Resources Board
• Carter W (2008) Estimation of the maximum ozone impacts of oxides of nitrogen
• Carter W (2010a) Email to Jane Bare. Feb 3:2010
• Carter W (2010b) SAPRC atmospheric chemical mechanisms and VOC Reactivity Scales
Summer smog
Copyright (c) (2014) PE International AG – All rights reserved
References and links
• CML• Huijbregts, M., 1999b. Life cycle Impact assessment of acidifying and eutrophying air pollutants. Calculation of
equivalency factors with RAINS-LCA. Interfaculty Department of Environmental Science, Faculty of Environmental Science, University of Amsterdam.
• ReCiPe• Rosalie van Zelm, Mark A.J. Huijbregts, Hans A. van Jaarsveld, Gert Jan Reinds, Jaap Struijs & Dik van de Meent.
Time horizon dependent characterization factors for acidification in life-cycle assessment based on forest plant species occurrence in Europe. Environmental Science & Technology 41 (2007), 922-927.
• EUTREND model of acid deposition following acidifying emission: Van Jaarsveld, JA. 1995. Modelling the long-term atmospheric behaviour of pollutants on various spatial scales. PhD thesis. University of Utrecht, Utrecht, The Netherlands.
• SMART2 model of changes in soil base saturation following acid deposition, Kros J. 2002. Evaluation of biogeochemical models at local and regional scale. PhD thesis. Wageningen University, Wageningen, The Netherlands.
• TRACI• Bare JC, Norris GA, Pennington DW, McKone T (2003) TRACI–the tool for the reduction and assessment of
chemical and other environmental impacts. Journal of Industrial Ecology 6:49–78
• Norris G (2003) Impact characterization in the tool for the reduction and assessment of chemical and other environmental impacts-methods for acidification, eutrophication, and ozone formation. Journal of Industrial Ecology 6:79–101
Acidification

Copyright (c) (2014) PE International AG – All rights reserved
References and links
• CML• Heijungs, R., J. Guinée, G. Huppes, R.M. Lankreijer, H.A. Udo de Haes, A. Wegener Sleeswijk, A.M.M.
Ansems, P.G. Eggels, R. van Duin & H.P. de Goede, 1992. Environmental Life Cycle Assessment of products. Guide and Backgrounds. CML, Leiden University, Leiden.
• ReCiPe• Beusen A (2005). User manual of CARMEN1. National Institute of Public Health and Environ-mental
Protection (RIVM), Bilthoven (Manuscript, not published)
• Crouzet P, Leonard J, Nixon S, Rees Y, Parr W, Laffon, L, Bogestrand J, Kristensen P, Lallana C, Izzo G, Bokn T, Bak J, Lack TJ, Thyssen N (ed.) (1999). Nutrients in European ecosystems. European Environment Agency, Copenhagen, Environmental assessment report, no 4.
• TRACI• Bare JC, Norris GA, Pennington DW, McKone T (2003) TRACI–the tool for the reduction and assessment of
chemical and other environmental impacts. Journal of Industrial Ecology 6:49–78
• Norris G (2003) Impact characterization in the tool for the reduction and assessment of chemical and other environmental impacts-methods for acidification, eutrophication, and ozone formation. Journal of Industrial Ecology 6:79–101
Eutrophication

Copyright (c) (2014) PE International AG – All rights reserved
References and links
• CML• Huijbregts, M.A.J., U. Thissen, J.B. Guinée, T. Jager, D. van de Meent, A.M.J. Ragas, A. Wegener Sleeswijk and L. Reijnders,
2000. Priority assessment of toxic substances in life cycle assessment, I: Calculation of toxicity potentials for 181 substances
with the nested multi-media fate, exposure and effects model USES-LCA. Chemosphere 41: 541-573
• Van Zelm R., Huijbregts M.A.J., Van de Meent D. 2009. USES-LCA 2.0: a global nested multi-media fate, exposure and effects
model. The International Journal of LCA 14, p. 282-284.
• ReCiPe• Huijbregts MAJ, Struijs J, Goedkoop M, Heijungs R, Hendriks AJ, Van de Meent D. 2005. Human population intake fractions
and environmental fate factors of toxic pollutants in Life Cycle Impact Assessment. Chemosphere 61 (10): 1495-1504.
• Van Zelm R, Huijbregts MAJ, Harbers JV, Wintersen A, Struijs J, Posthuma L, Van de Meent D. 2007. Uncertainty in msPAF-
based ecotoxicological freshwater effect factors for chemicals with a non-specific mode of action in life cycle impact
assessment. Integrated Environmental Assessment and Management 3 (2): 203-210.
• Van Zelm R, Huijbregts MAJ, Posthuma L, Wintersen A, Van de Meent D. 2009. Pesticide ecotoxicological effect factors and
their uncertainties for freshwater ecosystems. International Journal of LCA . Vol 14 (1), 43-51
• TRACI• Rosenbaum et al (2008): USEtox – the UNEP-SETAC toxicity model: recommended characterisation factors for human toxicity
and freshwater ecotoxicity in life cycle impact assessment. Int J Life Cycle Assess (2008) 13:532–546
Eco-toxicity

Copyright (c) (2014) PE International AG – All rights reserved
References and links
Ozone Depletion
• WMO (World Meteorological Organization), Scientific Assessment of Ozone Depletion: 2006, Global
Ozone Research and Monitoring Project—Report No. 50, 572 pp., Geneva, Switzerland, 2007
Resource Risk Assessment
• Rosenau-Tornow et al. (2009): Assessing the long-term supply risks for mineral raw materials—a
combined evaluation of past and future trends. Resources Policy 34 (2009) 161–175.
• Nassar et al. (2011): Criticality of the Geological Copper Family. Environmental Science & Technology.
dx.doi.org/10.1021/es203535w.
Land Use Change
• Beck et al. (2010): LANCA® - Land Use Indicator Value Calculation in Life Cycle Assessment – Method
Report. http://www.lbp-gabi.de/files/lanca_website.pdf.
• Koellner et al. (2012): Principles for life cycle inventories of land use on a global scale. Int J Life Cycle
Assess. DOI 10.1007/s11367-012-0392-0

Copyright (c) (2014) PE International AG – All rights reserved
References and links
• CML
• Guinée, J. & R. Heijungs, 1995. A proposal for the definition of resource equivalency factors for use
in product Life-Cycle Assessment. Environmental Toxicology and Chemistry 14 (5): 917–925.
• ReCiPe
• Verhoef E. V.; Dijkema P. J., and Markus A. Reuter; 2004 ; Process Knowledge, System Dynamics,
and Metal Ecology. Industrial Ecology, MIT press Volume 8, Number 1–2.
• USGS, 2004. USGS mineral commodity summaries. U.S. Geological Survey, Denver, CO, United
States.
• TRACI
• Not included
Abiotic Resource Depletion

Copyright (c) (2014) PE International AG – All rights reserved
All rights reserved.
The materials in this communication are subject to copyright protection. No part of
this communication may be reproduced, distributed, or transmitted in any form or
by any means, including photocopying, recording, or other electronic or mechanical
methods, without the prior written permission of PE INTERNATIONAL AG.
51


