BEST PRACTICE MANUAL L L I I G G H H T T I I N N G GPrepared forBureau of Energy Efficiency, (under Ministry of Power, Government of India) Hall no.4, 2 nd Floor, NBCC Tower, Bhikaji Cama Place, New Delhi – 110066. Indian Renewable Energy Development Agency, Core 4A, East Court, 1 st Floor, India Habitat Centre, Lodhi Road, New Delhi – 110003. ByDevki Energy Consultancy Pvt. Ltd., 405, Ivory Terrace, R.C. Dutt Road, Vadodara – 390007. 2006
Light is just one portion of the various electromagnetic waves flying through space. Thesewaves have both a frequency and a length, the values of which distinguish light from other
Incandescence Solids and liquids emit visible radiation when they are heated totemperatures about 1000K. The intensity increases and the appearance become whiter asthe temperature increases.
Electric Discharge: When an electric current is passed through a gas the atoms andmolecules emit radiation whose spectrum is characteristic of the elements present.
Electro luminescence : Light is generated when electric current is passed through certainsolids such as semiconductor or phosphor materials.
Photoluminescence: Radiation at one wavelength is absorbed, usually by a solid, and re-emitted at a different wavelength. When the re-emitted radiation is visible the phenomenonmay be termed either fluorescence or phosphorescence .
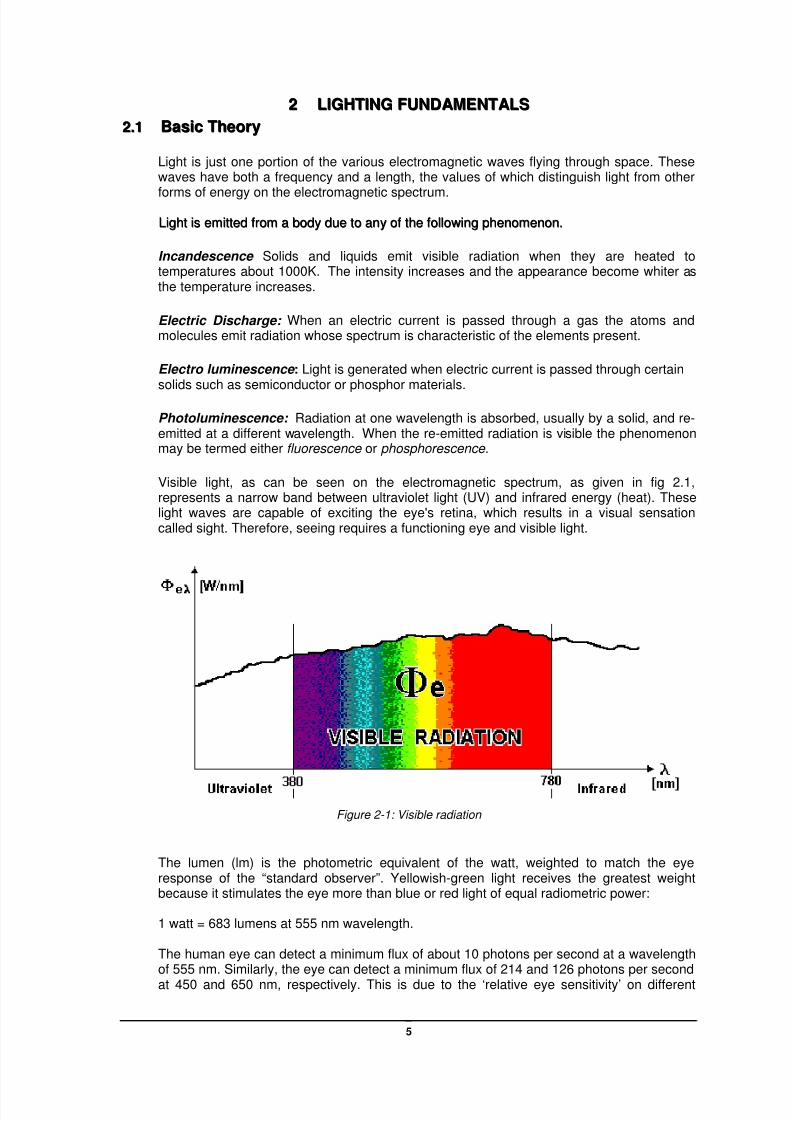
Visible light, as can be seen on the electromagnetic spectrum, as given in fig 2.1,represents a narrow band between ultraviolet light (UV) and infrared energy (heat). Theselight waves are capable of exciting the eye's retina, which results in a visual sensationcalled sight. Therefore, seeing requires a functioning eye and visible light.
Figure 2-1: Visible radiation
The lumen (lm) is the photometric equivalent of the watt, weighted to match the eyeresponse of the “standard observer”. Yellowish-green light receives the greatest weightbecause it stimulates the eye more than blue or red light of equal radiometric power:
1 watt = 683 lumens at 555 nm wavelength.
The human eye can detect a minimum flux of about 10 photons per second at a wavelengthof 555 nm. Similarly, the eye can detect a minimum flux of 214 and 126 photons per second
at 450 and 650 nm, respectively. This is due to the ‘relative eye sensitivity’ on different
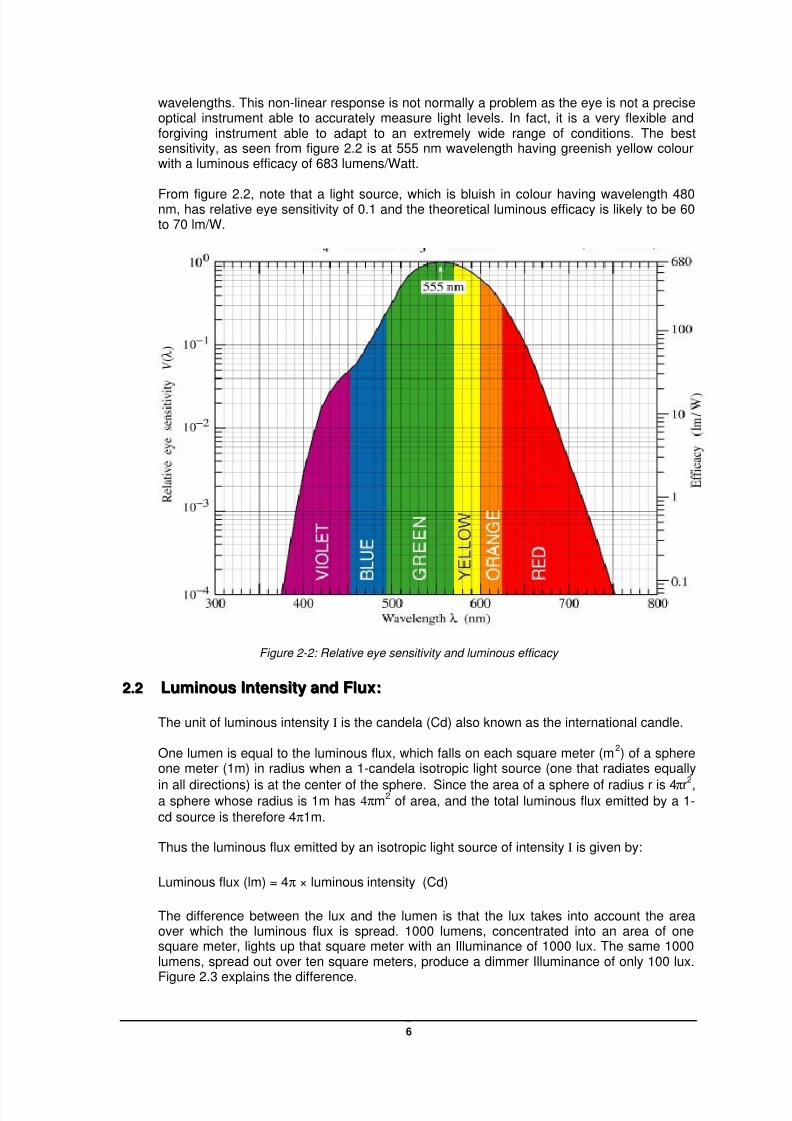
wavelengths. This non-linear response is not normally a problem as the eye is not a preciseoptical instrument able to accurately measure light levels. In fact, it is a very flexible andforgiving instrument able to adapt to an extremely wide range of conditions. The bestsensitivity, as seen from figure 2.2 is at 555 nm wavelength having greenish yellow colourwith a luminous efficacy of 683 lumens/Watt.
From figure 2.2, note that a light source, which is bluish in colour having wavelength 480nm, has relative eye sensitivity of 0.1 and the theoretical luminous efficacy is likely to be 60to 70 lm/W.
Figure 2-2: Relative eye sensitivity and luminous efficacy
The unit of luminous intensity I is the candela (Cd) also known as the international candle.
One lumen is equal to the luminous flux, which falls on each square meter (m2) of a sphere
one meter (1m) in radius when a 1-candela isotropic light source (one that radiates equally
in all directions) is at the center of the sphere. Since the area of a sphere of radius r is 4πr2
,a sphere whose radius is 1m has 4πm
2of area, and the total luminous flux emitted by a 1-
cd source is therefore 4π1m.
Thus the luminous flux emitted by an isotropic light source of intensity I is given by:
Luminous flux (lm) = 4π × luminous intensity (Cd)
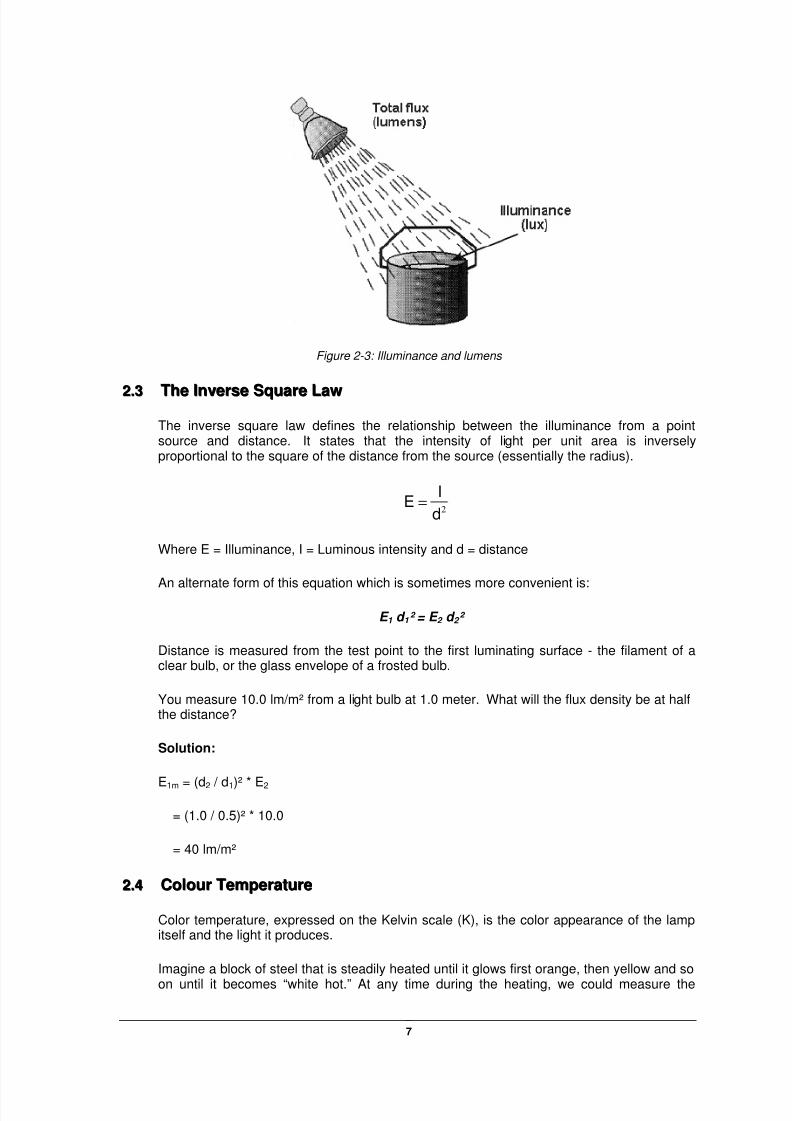
The difference between the lux and the lumen is that the lux takes into account the areaover which the luminous flux is spread. 1000 lumens, concentrated into an area of onesquare meter, lights up that square meter with an Illuminance of 1000 lux. The same 1000lumens, spread out over ten square meters, produce a dimmer Illuminance of only 100 lux.
The inverse square law defines the relationship between the illuminance from a pointsource and distance. It states that the intensity of light per unit area is inverselyproportional to the square of the distance from the source (essentially the radius).
2d
IE =
Where E = Illuminance, I = Luminous intensity and d = distance
An alternate form of this equation which is sometimes more convenient is:
E 1 d 1² = E 2 d 2 ²
Distance is measured from the test point to the first luminating surface - the filament of aclear bulb, or the glass envelope of a frosted bulb.
You measure 10.0 lm/m² from a light bulb at 1.0 meter. What will the flux density be at halfthe distance?
Solution:
E1m = (d2 / d1)² * E2
= (1.0 / 0.5)² * 10.0
= 40 lm/m²
22..44 CCoolloouurr TTeemmppeerraattuurree
Color temperature, expressed on the Kelvin scale (K), is the color appearance of the lampitself and the light it produces.
Imagine a block of steel that is steadily heated until it glows first orange, then yellow and so
on until it becomes “white hot.” At any time during the heating, we could measure the
temperature of the metal in Kelvin (Celsius + 273) and assign that value to the color beingproduced. This is the theoretical foundation behind color temperature.
For incandescent lamps, the color temperature is a "true" value; for fluorescent and high-intensity discharge (HID) lamps, the value is approximate and is therefore called correlatedcolor temperature. In the industry, “color temperature” and “correlated color temperature”
are often used interchangeably. The color temperature of lamps makes them visually"warm," "neutral" or "cool" light sources. Generally speaking, the lower the temperature is,the warmer the source, and vice versa.
22..55 CCoolloouurr RReennddeerriinngg
The ability of a light source to render colour of surfaces accurately can be convenientlyquantified by the colour-rendering index. This index is based on the accuracy with which aset of test colours is reproduced by the lamp of interest relative to a test lamp, perfectagreement being given a score of 100. The CIE index has some limitations, but is the mostwidely accepted measure of the colour rendering properties of light sources.
Table 2-1: Colour Rendering Index
Colourrenderinggroups
CIE general colourrendering Index(Ra)
Typical application
1A Ra > 90 Wherever accurate colour rendering is required e.g. colourprinting inspection
1B 80 < Ra < 90 Wherever accurate colour judgments are necessary or goodcolour rendering is required for reasons of appearance e.g.display lighting
2 60 < Ra < 80 Wherever moderate colour rendering is required
3 40 < Ra < 60 Wherever colour rendering is of little significance but markeddistortion of colour is unacceptable
4 20 < Ra < 40 Wherever colour rendering is of no importance at all andmarked distortion of colour is acceptable
Color temperature is how cool or warm the light source appears. Incandescent lamps havea warmer appearance than mercury vapor yard lights, for example.
A common misconception is that color temperature and color rendering both describe thesame properties of the lamp. Again, color temperature describes the color appearance ofthe light source and the light emitted from it. Color rendering describes how well the lightrenders colors in objects.
An incandescent lamp acts as a ‘grey body’, selectively emitting radiation, with most of itoccurring in the visible region. The bulb contains a vacuum or gas filling. Although thisstops oxidation of the tungsten filament, it will not stop evaporation. The darkening of bulbsis due to evaporated tungsten condensing on the relatively cool bulb surface. With an inertgas filling, the evaporation will be suppressed, and the heavier the molecular weight, themore successful it will be. For normal lamps an argon: nitrogen mixture of ratio 9/1 is usedbecause of its low cost. Krypton or Xenon is only used in specialized applications such ascycle lamps where the small bulb size helps to offset the increased cost, and whereperformance is critical.
Gas filling can conduct heat away from the filament, so low conductivity is important. Gasfilled lamps normally incorporate fuses in the lead wires. A small break can cause anelectrical discharge, which can draw very high currents. As filament fracture is the normalend of lamp life it would not be convenient for sub circuits fuses to fail.
Figure 3-1: Incandescent lamp
Figure 3-2: Energy flow diagram of incandescent lamp
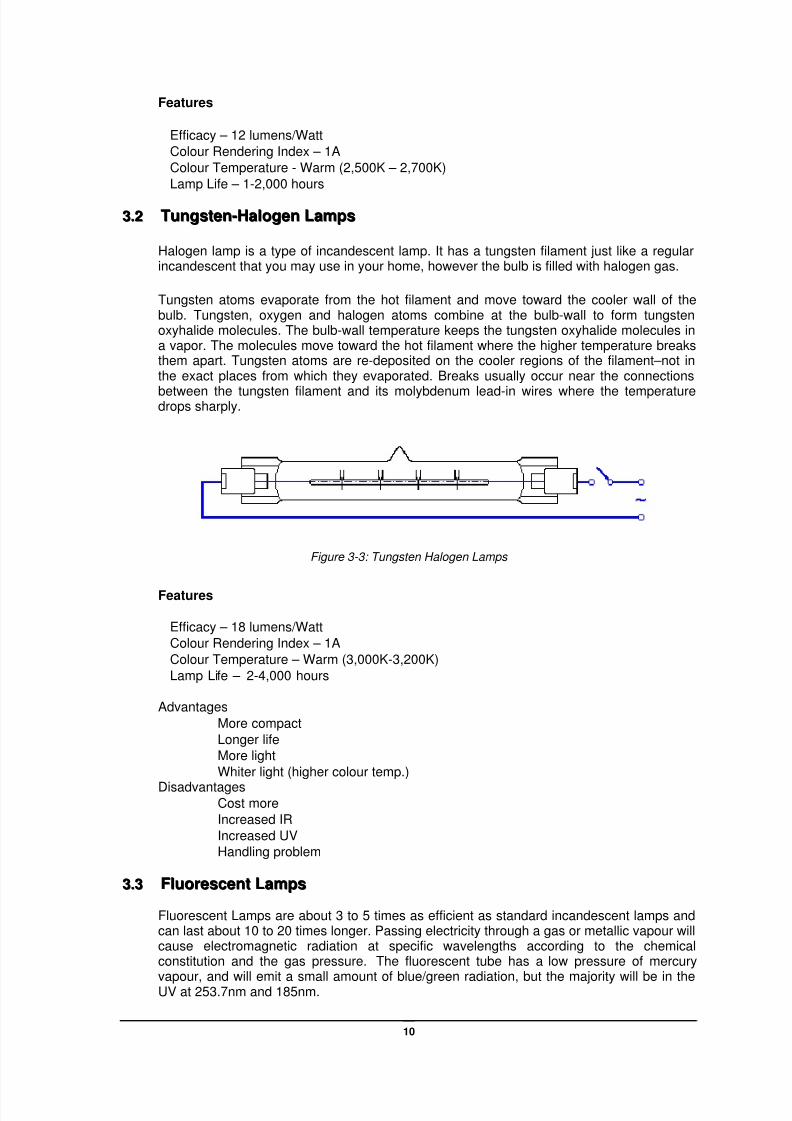
Halogen lamp is a type of incandescent lamp. It has a tungsten filament just like a regularincandescent that you may use in your home, however the bulb is filled with halogen gas.
Tungsten atoms evaporate from the hot filament and move toward the cooler wall of thebulb. Tungsten, oxygen and halogen atoms combine at the bulb-wall to form tungstenoxyhalide molecules. The bulb-wall temperature keeps the tungsten oxyhalide molecules ina vapor. The molecules move toward the hot filament where the higher temperature breaksthem apart. Tungsten atoms are re-deposited on the cooler regions of the filament–not inthe exact places from which they evaporated. Breaks usually occur near the connections
between the tungsten filament and its molybdenum lead-in wires where the temperaturedrops sharply.
Figure 3-3: Tungsten Halogen Lamps
Features
Efficacy – 18 lumens/Watt
Colour Rendering Index – 1A Colour Temperature – Warm (3,000K-3,200K)
Lamp Life – 2-4,000 hours
Advantages
More compact
Longer life More light
Whiter light (higher colour temp.)
Disadvantages Cost more
Increased IR
Increased UV Handling problem
33..33 FFlluuoorreesscceenntt LLaammppss
Fluorescent Lamps are about 3 to 5 times as efficient as standard incandescent lamps andcan last about 10 to 20 times longer. Passing electricity through a gas or metallic vapour willcause electromagnetic radiation at specific wavelengths according to the chemicalconstitution and the gas pressure. The fluorescent tube has a low pressure of mercury
vapour, and will emit a small amount of blue/green radiation, but the majority will be in theUV at 253.7nm and 185nm.
Figure 3-5: Energy flow diagram of fluorescent lamp
The inside of the glass wall has a thin phosphor coating, selected to absorb the UVradiation and transmit it in the visible region. This process is approx. 50% efficient.
Fluorescent tubes are ‘hot cathode’ lamps, since the cathodes are heated as part of thestarting process. The cathodes are tungsten filaments with a layer of barium carbonate.
When heated, this coating will provide additional electrons to help start the discharge. Thisemissive coating must not be over-heated, as lamp life will be reduced. The lamps use asoda lime glass, which is a poor transmitter of UV.
The amount of mercury is small, typically 12mg. The latest lamps are using a mercuryamalgam, which enables doses closer to 5mg. This enables the optimum mercury pressureto be sustained over a wider temperature range. This is useful for exterior lighting as wellas compact recessed fittings.
How do T12, T10, T8, and T5 fluorescent lamps differ?
These four lamps vary in diameter (ranging from 1.5 inches that is 12/8 of an inch for T12 to
0.625 or 5/8 of an inch in diameter for T5 lamps). Efficacy is another area that distinguishesone from another. T5 & T8 lamps offer a 5-percent increase in efficacy over 40-watt T12lamps, and have become the most popular choice for new installations.
Effect of Temperature
The most efficient lamp operation is achieved when the ambient temperature is between 20and 30°C for a fluorescent lamp. Lower temperatures cause a reduction in mercurypressure, which means that less ultraviolet energy is produced; therefore, less UV energy isavailable to act on the phosphor and less light is the result. High temperatures cause a shiftin the wavelength of UV produced so that it is nearer to the visual spectrum. The longerwavelengths of UV have less effect on the phosphor, and therefore light output is alsoreduced. The overall effect is that light output falls off both above and below the optimum
The recent compact fluorescent lamps open up a whole new market for fluorescentsources. These lamps permit design of much smaller luminaires, which can compete with
incandescent and mercury vapour in the market of lighting fixtures having round or squareshapes. Products in the market are available with either built in control gear (CFG) orseparate control gear (CFN).
Figure 3-6: CFL
Features
Efficacy – 60 lumens/Watt
Colour Rendering Index – 1B Colour Temperature – Warm, Intermediate Lamp Life – 7-10,000 hours
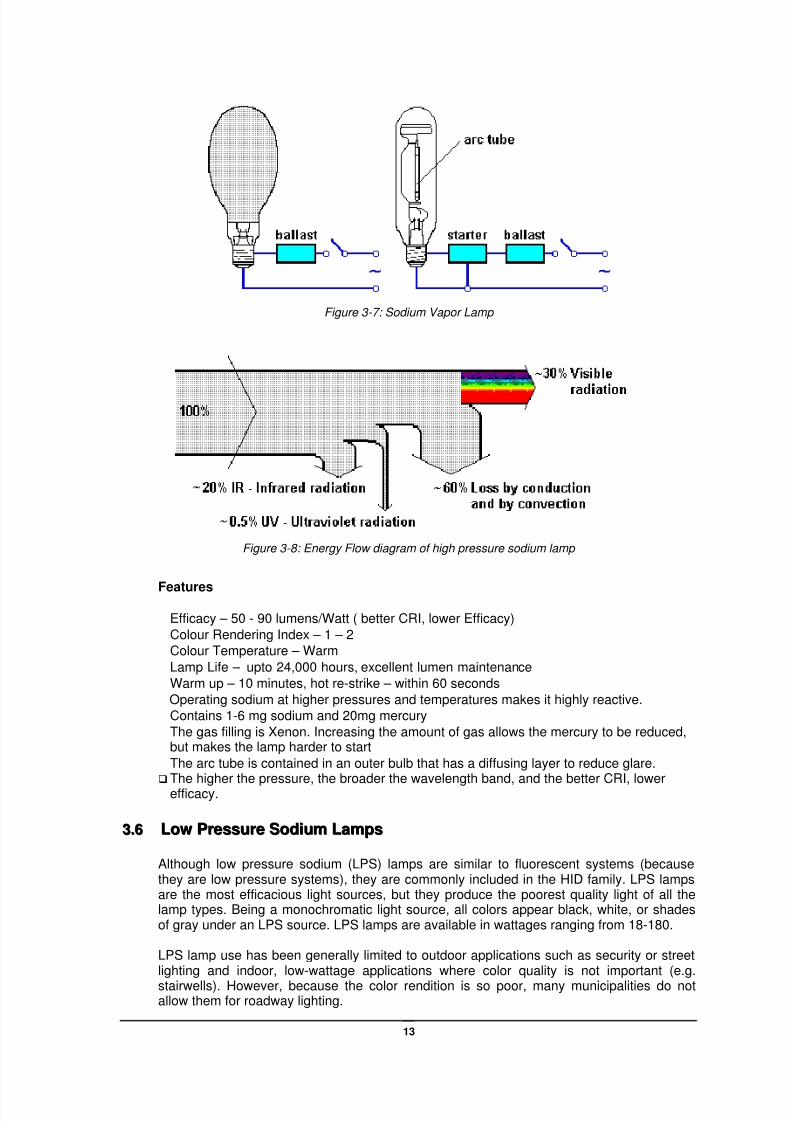
The high pressure sodium (HPS) lamp is widely used for outdoor and industrialapplications. Its higher efficacy makes it a better choice than metal halide for theseapplications, especially when good color rendering is not a priority. HPS lamps differ frommercury and metal-halide lamps in that they do not contain starting electrodes; the ballastcircuit includes a high-voltage electronic starter. The arc tube is made of a ceramic material,which can withstand temperatures up to 2372F. It is filled with xenon to help start the arc,as well as a sodium-mercury gas mixture.
Colour Rendering Index – 1 – 2 Colour Temperature – Warm
Lamp Life – upto 24,000 hours, excellent lumen maintenance
Warm up – 10 minutes, hot re-strike – within 60 seconds Operating sodium at higher pressures and temperatures makes it highly reactive. Contains 1-6 mg sodium and 20mg mercury
The gas filling is Xenon. Increasing the amount of gas allows the mercury to be reduced,but makes the lamp harder to start
The arc tube is contained in an outer bulb that has a diffusing layer to reduce glare. The higher the pressure, the broader the wavelength band, and the better CRI, lower
Although low pressure sodium (LPS) lamps are similar to fluorescent systems (becausethey are low pressure systems), they are commonly included in the HID family. LPS lampsare the most efficacious light sources, but they produce the poorest quality light of all thelamp types. Being a monochromatic light source, all colors appear black, white, or shadesof gray under an LPS source. LPS lamps are available in wattages ranging from 18-180.
LPS lamp use has been generally limited to outdoor applications such as security or streetlighting and indoor, low-wattage applications where color quality is not important (e.g.
stairwells). However, because the color rendition is so poor, many municipalities do notallow them for roadway lighting.
Colour Rendering Index – 3 Colour Temperature – Yellow (2,200K)
Lamp Life – upto 16,000 hours Warm up – 10 minutes, hot re-strike – up to 3 minutes
33..77 MMeerrccuurryy VVaappoouurr LLaammppss
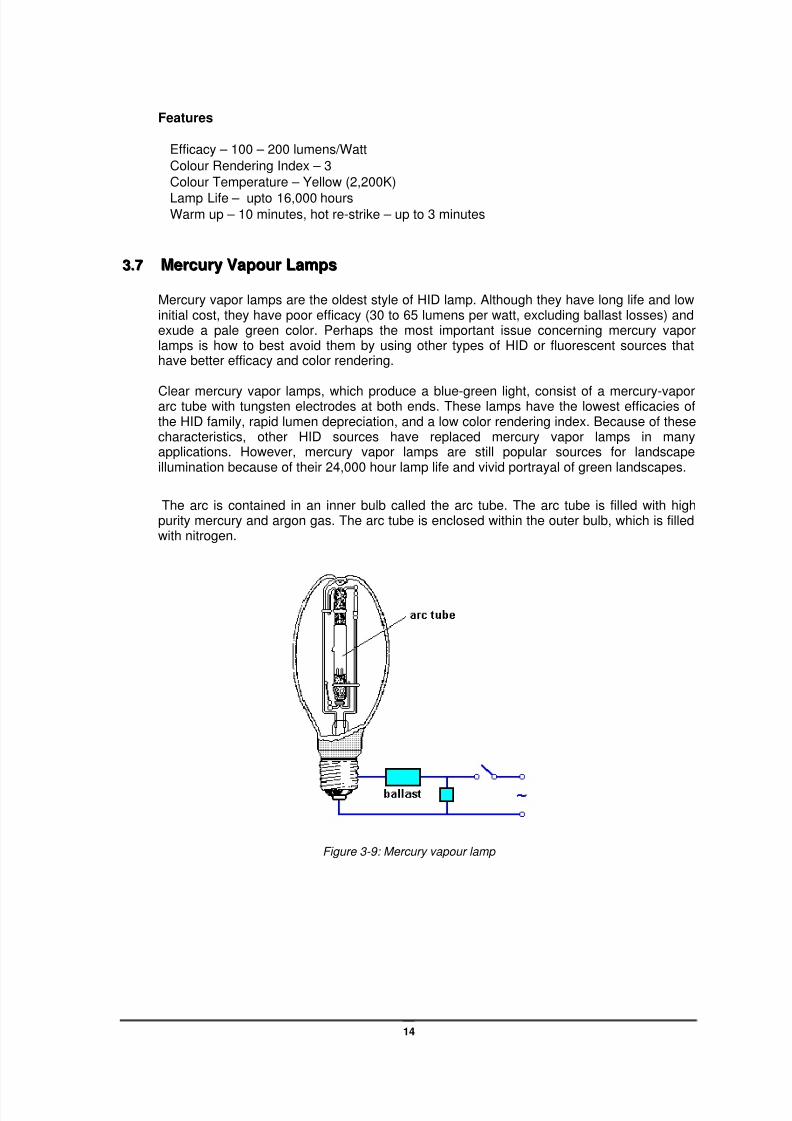
Mercury vapor lamps are the oldest style of HID lamp. Although they have long life and lowinitial cost, they have poor efficacy (30 to 65 lumens per watt, excluding ballast losses) andexude a pale green color. Perhaps the most important issue concerning mercury vaporlamps is how to best avoid them by using other types of HID or fluorescent sources thathave better efficacy and color rendering.
Clear mercury vapor lamps, which produce a blue-green light, consist of a mercury-vaporarc tube with tungsten electrodes at both ends. These lamps have the lowest efficacies ofthe HID family, rapid lumen depreciation, and a low color rendering index. Because of thesecharacteristics, other HID sources have replaced mercury vapor lamps in manyapplications. However, mercury vapor lamps are still popular sources for landscapeillumination because of their 24,000 hour lamp life and vivid portrayal of green landscapes.
The arc is contained in an inner bulb called the arc tube. The arc tube is filled with highpurity mercury and argon gas. The arc tube is enclosed within the outer bulb, which is filledwith nitrogen.
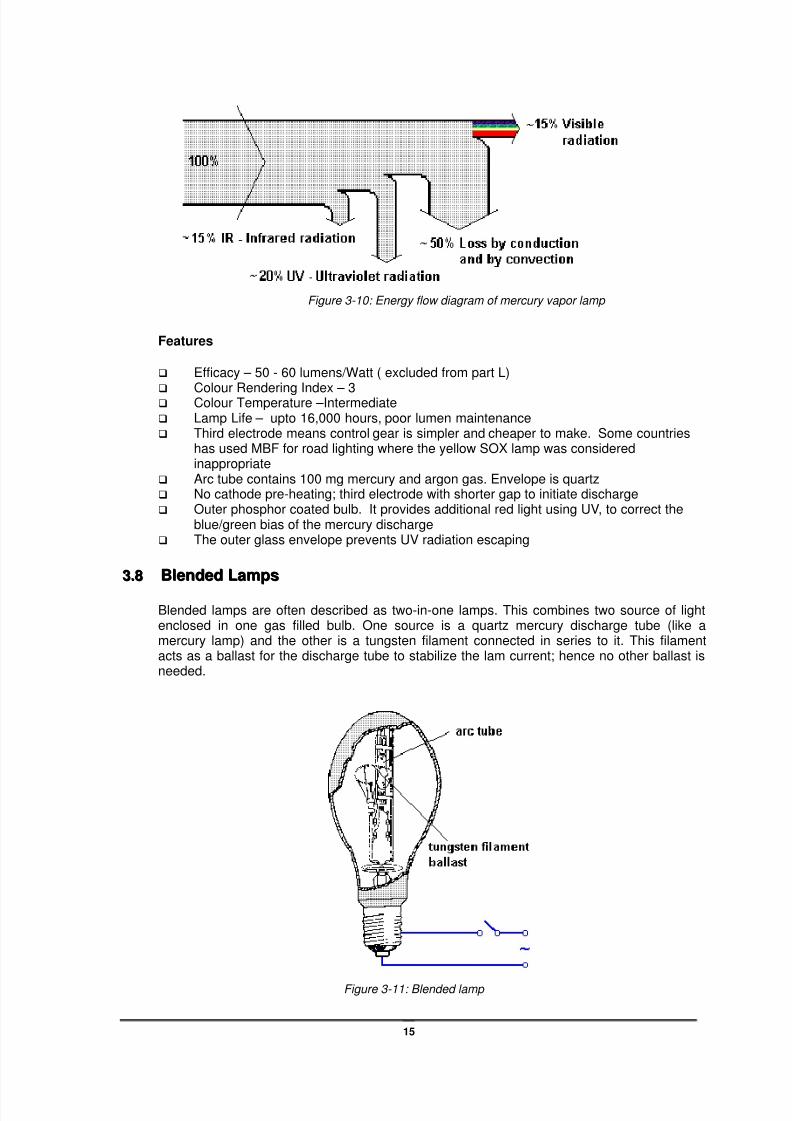
Figure 3-10: Energy flow diagram of mercury vapor lamp
Features
Efficacy – 50 - 60 lumens/Watt ( excluded from part L)
Colour Rendering Index – 3 Colour Temperature –Intermediate Lamp Life – upto 16,000 hours, poor lumen maintenance Third electrode means control gear is simpler and cheaper to make. Some countries
has used MBF for road lighting where the yellow SOX lamp was consideredinappropriate
Arc tube contains 100 mg mercury and argon gas. Envelope is quartz No cathode pre-heating; third electrode with shorter gap to initiate discharge Outer phosphor coated bulb. It provides additional red light using UV, to correct the
blue/green bias of the mercury discharge The outer glass envelope prevents UV radiation escaping
33..88 BBlleennddeedd LLaammppss
Blended lamps are often described as two-in-one lamps. This combines two source of lightenclosed in one gas filled bulb. One source is a quartz mercury discharge tube (like amercury lamp) and the other is a tungsten filament connected in series to it. This filamentacts as a ballast for the discharge tube to stabilize the lam current; hence no other ballast isneeded.
The tungsten filament coiled in construction encircles the discharge tube and is connected inseries with it. The fluorescent powder coating is given on inside of the bulb wall to convert theemitted ultraviolet rays from the discharge tube to visible light. At ignition, the lamp emits onlylight from the tungsten filament and during the course of about 3 minutes, the arc in thedischarge tube runs up to reach full light output.
These lamps are suitable for flame proof areas and can fit into incandescent lamp fixtureswithout any modification.
Features
Typical rating 160 W Efficacy of 20 to 30 Lm/W High power factor of 0.95 Life of 8000 hours
33..99 MMeettaall HHaalliiddee LLaammppss
The halides act in a similar manner to the tungsten halogen cycle. As the temperatureincreases there is disassociation of the halide compound releasing the metal into the arc.The halides prevent the quartz wall getting attacked by the alkali metals.
Features
Efficacy – 80 lumens/Watt
Colour Rendering Index – 1A –2 depends on halide mix
Colour Temperature – 3,000K – 6,000K Lamp Life – 6,000 - 20,000 hours, poor lumen maintenance Warm-up – 2-3 minutes, hot re-strike 10-20 minutes
The choice of colour, size and rating is greater for MBI than any other lamp type
They are a developed version of the two other high intensity discharge lamps, as theytend to have a better efficacy
By adding other metals to the mercury different spectrum can be emitted Some MBI lamps use a third electrode for starting, but other, especially the smaller
display lamps, require a high voltage ignition pulse
Figure 3-13: Energy flow diagram of metal halide lamp
33..1100 LLEEDD LLaammppss
LED technology has improved significantly over the past 5 to 10 years. Light output has
reached a point where LEDs are viable for many applications, especially colored lightapplications. More importantly, LED manufacturers see improvements in light outputcontinuing for years to come such that LEDs could make sense for virtually any lightingapplication.
Basic components are:
• LEDs• Driver (power conversion device)• Control devices (dimming controls, color mixing controls)• Optics• Fixture (housing, including heat sink devices, to contain all components)
An LED driver converts a system voltage (e.g., 120vac) into power required by the LEDsystem. Delivering proper power to an LED system is crucial to maintaining correct lightlevels and life expectancy of the LEDs. The driver also regulates power delivered to the LEDsto counter any fluctuations in system conditions. Drivers also isolate the LED system from thehigh voltage system to reduce shock hazards and make a lighting system safer.
LED lamps are the newest addition to the list of energy efficient light sources. While LEDlamps emit visible light in a very narrow spectral band, they can produce "white light". This isaccomplished with either a red-blue-green array or a phosphor-coated blue LED lamp. LEDlamps last 40,000 to 100,000 hours depending on color. LED lamps have made their wayinto numerous lighting applications including exit signs, traffic signals, under-cabinet lights,and various decorative applications. Though still in their infancy, LED lamp technologies are
rapidly progressing and show promise for the future.
The luminous efficacy of LEDs in comparison with other lamps is given below.
This does not tell the whole story. Efficiency of the complete system must be consideredwhile making comparison. Colored LEDs used in applications such as traffic signals andchannel letters can be up to 90% more efficient than neon and incandescent. This is truebecause these applications have historically filtered white light to get a specific color of light .So most of the light is wasted in the filtering process. Plus, the point source nature of LEDs
offers the opportunity to engineer optically superior fixtures (i.e., less light losses for moreusable light).
Increases in LED efficacy is a major area of research in the industry, and significantimprovements are anticipated for years to come.
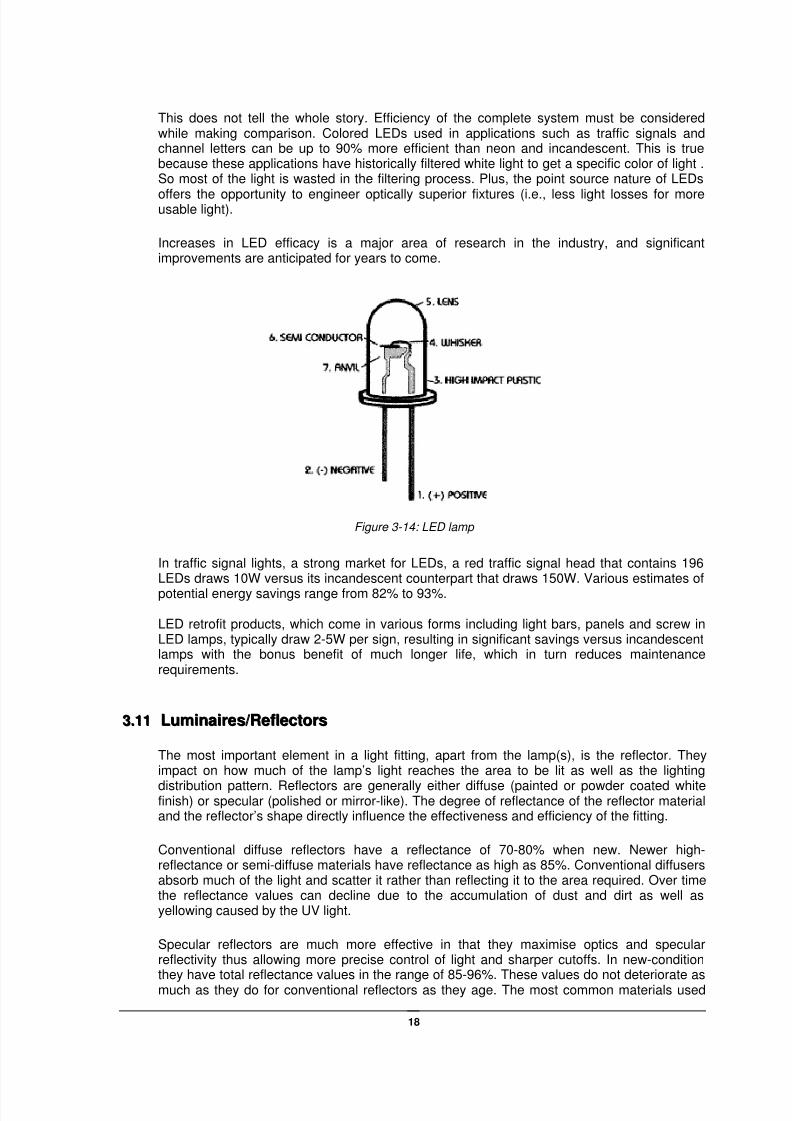
Figure 3-14: LED lamp
In traffic signal lights, a strong market for LEDs, a red traffic signal head that contains 196LEDs draws 10W versus its incandescent counterpart that draws 150W. Various estimates of
potential energy savings range from 82% to 93%.
LED retrofit products, which come in various forms including light bars, panels and screw inLED lamps, typically draw 2-5W per sign, resulting in significant savings versus incandescentlamps with the bonus benefit of much longer life, which in turn reduces maintenancerequirements.
The most important element in a light fitting, apart from the lamp(s), is the reflector. Theyimpact on how much of the lamp’s light reaches the area to be lit as well as the lighting
distribution pattern. Reflectors are generally either diffuse (painted or powder coated whitefinish) or specular (polished or mirror-like). The degree of reflectance of the reflector materialand the reflector’s shape directly influence the effectiveness and efficiency of the fitting.
Conventional diffuse reflectors have a reflectance of 70-80% when new. Newer high-reflectance or semi-diffuse materials have reflectance as high as 85%. Conventional diffusersabsorb much of the light and scatter it rather than reflecting it to the area required. Over timethe reflectance values can decline due to the accumulation of dust and dirt as well asyellowing caused by the UV light.
Specular reflectors are much more effective in that they maximise optics and specularreflectivity thus allowing more precise control of light and sharper cutoffs. In new-conditionthey have total reflectance values in the range of 85-96%. These values do not deteriorate asmuch as they do for conventional reflectors as they age. The most common materials used
are anodized Aluminium (85-90% reflectance) and silver film laminated to a metal substrate(91-95% reflectance). Enhanced (or coated) Aluminium is used to a lesser extent (88-96%reflectance)
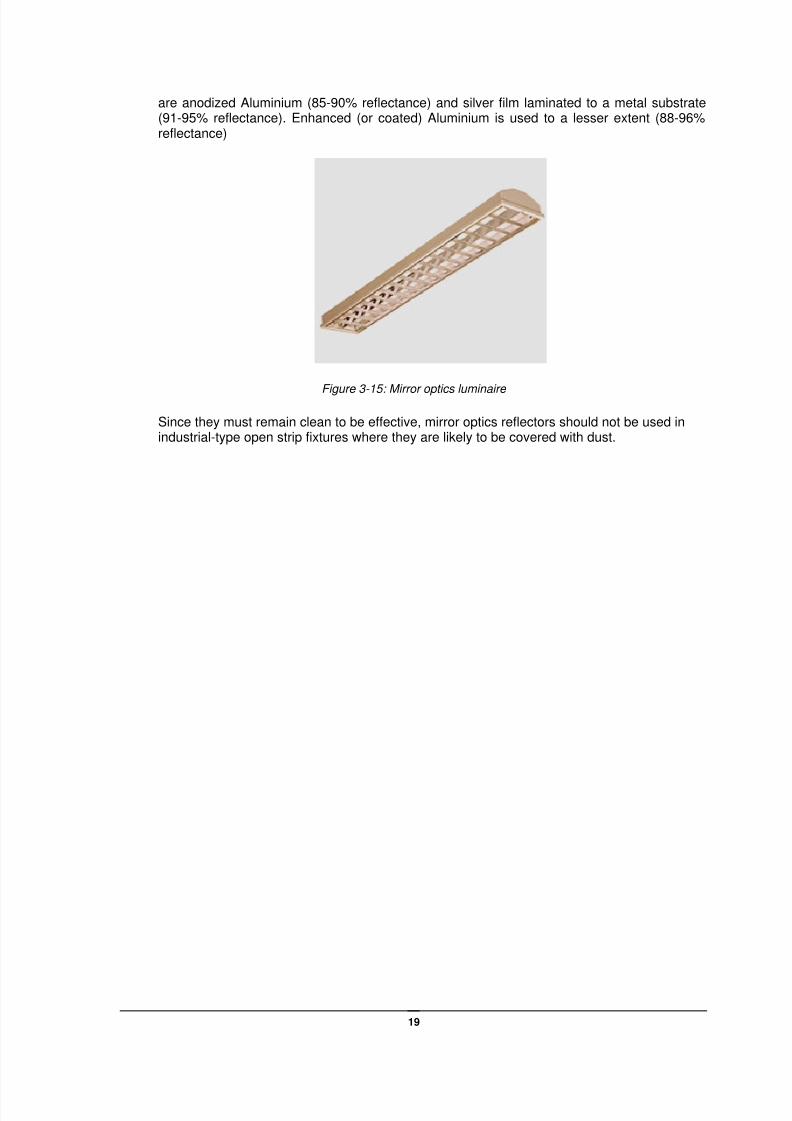
Figure 3-15: Mirror optics luminaire
Since they must remain clean to be effective, mirror optics reflectors should not be used inindustrial-type open strip fixtures where they are likely to be covered with dust.
Every task requires some lighting level on the surface of the body. Good lighting is essentialto perform visual tasks. Better lighting permits people to work with more productivity.However, just saying ‘good lighting’ does not specify how much is good.
Taj Mahal can be viewed in moonlight of 0.2 lux; measuring length using a micrometerrequires 500 to 1000 lux. Typical book reading can be done with 100 to 200 lux. The questionbefore the designer is hence, firstly, to choose the correct lighting level. CIE (CommissionInternational de l’Eclairage) and IES (Illuminating Engineers Society) have publishedrecommended lighting levels for various tasks. These recommended values have since madetheir way into national and international standards for lighting design.
Table 4-1: Recommended lighting levels
Illuminancelevel (lux)
Examples of Area of Activity
20 Minimum service illuminance in exteriorcirculating areas, outdoor stores , stockyards
50 Exterior walkways & platforms.
70 Boiler house.100 Transformer yards, furnace rooms etc.
General Lighting forrooms and areas usedeither infrequentlyand/or casual orsimple visual tasks
150 Circulation areas in industry, stores and stockrooms.
200 Minimum service illuminance on the task300 Medium bench & machine work, general
process in chemical and food industries,casual reading and filing activities.
1500 Very fine bench and machine work,instrument & small precision mechanismassembly; electronic components, gauging &inspection of small intricate parts (may bepartly provided by local task lighting)
Additional localisedlighting for visuallyexacting tasks
3000 Minutely detailed and precise work, e.g. Verysmall parts of instruments, watch making,engraving.
Indian standards IS 3646 & SP-32 describes the illuminance requirements at various workenvironments in detail.
The second question is about the quality of light. In most contexts, quality is read as colourrendering. Depending on the type of task, various light sources can be selected based ontheir colour rendering index.
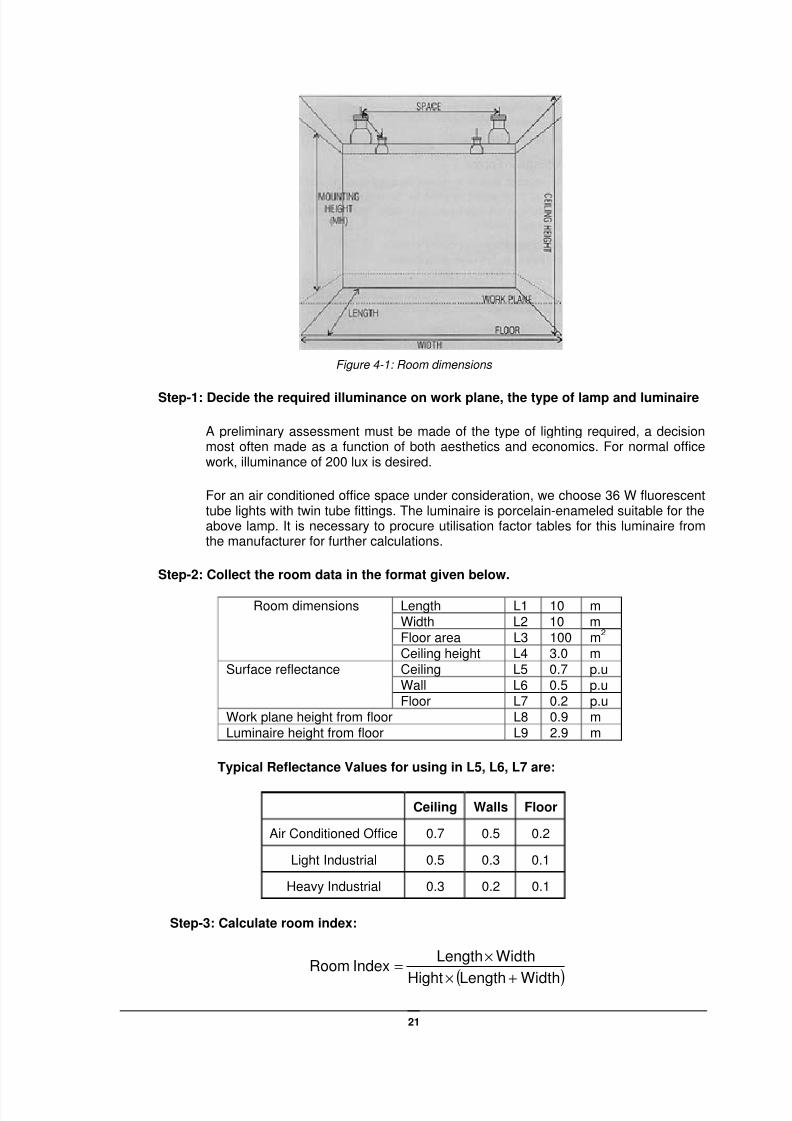
Step-1: Decide the required illuminance on work plane, the type of lamp and luminaire
A preliminary assessment must be made of the type of lighting required, a decisionmost often made as a function of both aesthetics and economics. For normal officework, illuminance of 200 lux is desired.
For an air conditioned office space under consideration, we choose 36 W fluorescenttube lights with twin tube fittings. The luminaire is porcelain-enameled suitable for theabove lamp. It is necessary to procure utilisation factor tables for this luminaire fromthe manufacturer for further calculations.
Step-2: Collect the room data in the format given below.
Length L1 10 mWidth L2 10 mFloor area L3 100 m
2
Room dimensions
Ceiling height L4 3.0 m
Ceiling L5 0.7 p.uWall L6 0.5 p.u
Surface reflectance
Floor L7 0.2 p.uWork plane height from floor L8 0.9 mLuminaire height from floor L9 2.9 m
Typical Reflectance Values for using in L5, L6, L7 are:
Utilisation factor is defined as the percent of rated bare-lamp lumens that exit theluminaire and reach the workplane. It accounts for light directly from the luminaireas well as light reflected off the room surfaces. Manufacturers will supply eachluminaire with its own CU table derived from a photometric test report.
Using tables available from manufacturers, it is possible to determine the utilisationfactor for different light fittings if the reflectance of both the walls and ceiling isknown, the room index has been determined and the type of luminaire is known.For twin tube fixture, utilisation factor is 0.66, corresponding to room index of 2.5.
Step-5: To calculate the number of fittings required use the following formula:
LLFUFF
AEN
××
×=
Where: N = Number of FittingsE = Lux Level Required on Working PlaneA = Area of Room (L x W)F = Total Flux (Lumens) from all the Lamps in one FittingUF = Utilisation Factor from the Table for the Fitting to be UsedLLF = Light Loss Factor. This takes account of the depreciation over time of
lamp output and dirt accumulation on the fitting and walls of the building.
LLF = Lamp lumen MF x Luminaire MF x Room surface MF
Typical LLF Values
Air Conditioned Office 0.8Clean Industrial 0.7Dirty Industrial 0.6
8066030502
100200
..N
×××
×= = 6.2
So, 6 nos twin tube fixtures are required. Total number of 36-Watt lamps is 12.
Step 6: Space the luminaires to achieve desired uniformity.
Every luminaire will have a recommended space to height ratio. In earlier designmethodologies, the uniformity ratio, which is the ratio of minimum illuminance toaverage illuminance was kept at 0.8 and suitable space to height ratio is specifiedto achieve the uniformity. In modern designs incorporating energy efficiency andtask lighting, the emerging concept is to provide a uniformity of 1/3 to 1/10depending on the tasks.
Recommended value for the above luminaire is 1.5. If the actual ratio is more than
the recommended values, the uniformity of lighting will be less.
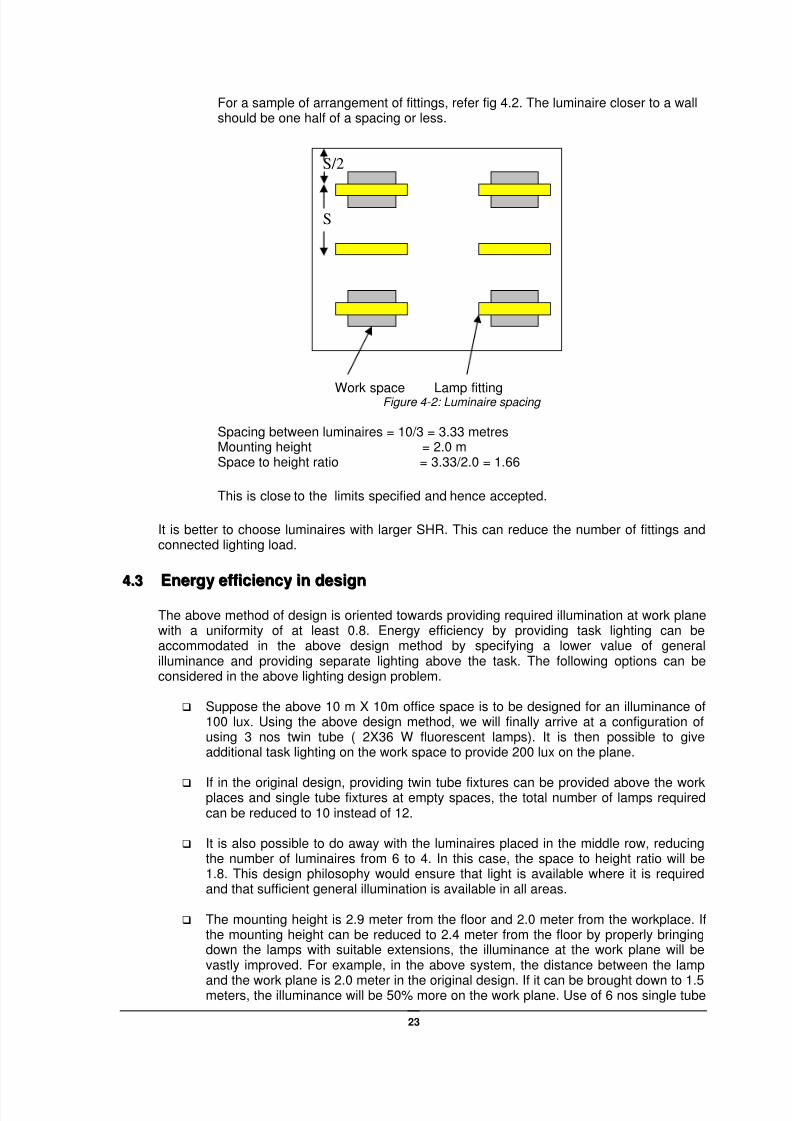
For a sample of arrangement of fittings, refer fig 4.2. The luminaire closer to a wallshould be one half of a spacing or less.
Work space Lamp fittingFigure 4-2: Luminaire spacing
Spacing between luminaires = 10/3 = 3.33 metresMounting height = 2.0 mSpace to height ratio = 3.33/2.0 = 1.66
This is close to the limits specified and hence accepted.
It is better to choose luminaires with larger SHR. This can reduce the number of fittings andconnected lighting load.
44..33 EE
nn
ee
rrgg
yy
ee
ffffiicc
iiee
nn
cc
yy
iinn
dd
ee
ss
iigg
nn
The above method of design is oriented towards providing required illumination at work planewith a uniformity of at least 0.8. Energy efficiency by providing task lighting can beaccommodated in the above design method by specifying a lower value of generalilluminance and providing separate lighting above the task. The following options can beconsidered in the above lighting design problem.
Suppose the above 10 m X 10m office space is to be designed for an illuminance of100 lux. Using the above design method, we will finally arrive at a configuration ofusing 3 nos twin tube ( 2X36 W fluorescent lamps). It is then possible to giveadditional task lighting on the work space to provide 200 lux on the plane.
If in the original design, providing twin tube fixtures can be provided above the workplaces and single tube fixtures at empty spaces, the total number of lamps requiredcan be reduced to 10 instead of 12.
It is also possible to do away with the luminaires placed in the middle row, reducingthe number of luminaires from 6 to 4. In this case, the space to height ratio will be1.8. This design philosophy would ensure that light is available where it is requiredand that sufficient general illumination is available in all areas.
The mounting height is 2.9 meter from the floor and 2.0 meter from the workplace. Ifthe mounting height can be reduced to 2.4 meter from the floor by properly bringingdown the lamps with suitable extensions, the illuminance at the work plane will bevastly improved. For example, in the above system, the distance between the lamp
and the work plane is 2.0 meter in the original design. If it can be brought down to 1.5meters, the illuminance will be 50% more on the work plane. Use of 6 nos single tube
The utility of using natural day lighting instead of electric lighting during the day is well known,but is being increasingly ignored especially in modern air-conditioned office spaces andcommercial establishments like hotels, shopping plazas etc. Industrial plants generally usedaylight in some fashion, but improperly designed day lighting systems can result incomplaints from personnel or supplementary use of electric lights during daytime.
Consider an application that needs an illumination level of 500 lux. To account for losses inreflection and diffusion within the skylight assembly, assume that 40% of the sunlight enteringthe skylight makes its way into the space. Thus, on a bright day, about 2% of the ceiling areaneeds to be skylights. To compensate for low sun angles, hazy conditions, dirty skylights,etc., double this to about 4%. To account for average cloudy conditions, increase this to 10%or 15%.
Some of the methods to incorporate day lighting are:
1. North lighting by use if single-pitched truss of the saw-tooth type is a commonindustrial practice; this design is suitable for latitudes north of 23 i.e. in North India. InSouth India, north lighting may not be appropriate unless diffusing glasses are usedto cut out the direct sunlight.
2. Innovative designs are possible which eliminates the glare of daylight and blend wellwith the interiors. Glass strips, running continuously across the breadth of the roof atregular intervals, can provide good, uniform lighting on industrial shop floors andstorage bays.
Figure 5-1: Day lighting using polycarbonate sheets
3. A good design incorporating sky lights with FRP material along with transparent ortranslucent false ceiling can provide good glare-free lighting; the false ceiling will alsocut out the heat that comes with natural light.
4. Use of atrium with FRP dome in the basic architecture can eliminate the use ofelectric lights in passages of tall buildings.
5. Natural Light from windows should also be used. However, it should be welldesigned to avoid glare. Light shelves can be used to provide natural light without
glare.
Figure 5-3: Concept of Light Shelf to provide Natural Lighting without Glare
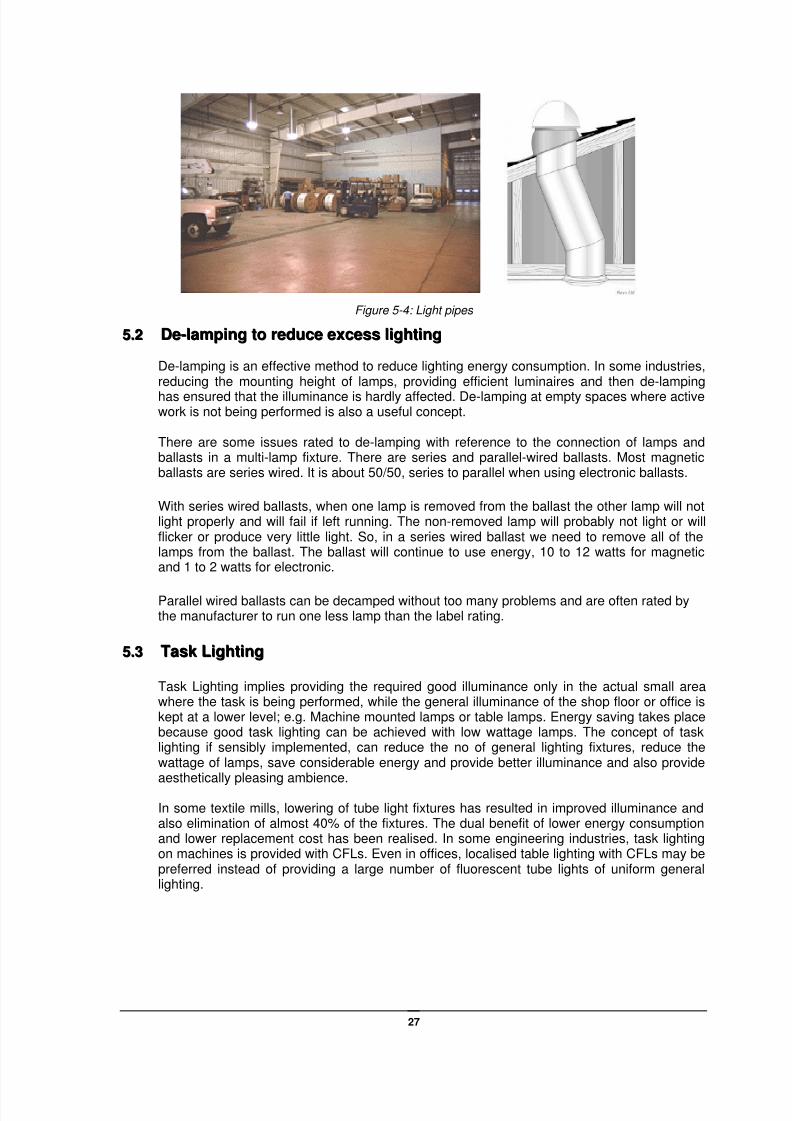
Light pipe: This is a reflective tube that brings clean light from the sky into a room, noneed for lighting or incandescent bulbs. These are Aluminium tubes having sliver lininginside. One 13” light pipe can illuminate about 250 sq.ft of floor area with an illuminanceof 200 lux. A 9” dia pipe can give the same iilluminance over a 100 sq.ft area.
A 4 ft length of light pipe of the above size provides a daytime average of 750 watts worthof light in June, 250 watts in December. If the pipe length increases to 20 ft, 50% of thelight reaches the surface. These are expensive, costing between 150 to 250 dollars andis one of the emerging technologies in day lighting.
De-lamping is an effective method to reduce lighting energy consumption. In some industries,reducing the mounting height of lamps, providing efficient luminaires and then de-lamping
has ensured that the illuminance is hardly affected. De-lamping at empty spaces where activework is not being performed is also a useful concept.
There are some issues rated to de-lamping with reference to the connection of lamps andballasts in a multi-lamp fixture. There are series and parallel-wired ballasts. Most magneticballasts are series wired. It is about 50/50, series to parallel when using electronic ballasts.
With series wired ballasts, when one lamp is removed from the ballast the other lamp will notlight properly and will fail if left running. The non-removed lamp will probably not light or willflicker or produce very little light. So, in a series wired ballast we need to remove all of thelamps from the ballast. The ballast will continue to use energy, 10 to 12 watts for magneticand 1 to 2 watts for electronic.
Parallel wired ballasts can be decamped without too many problems and are often rated bythe manufacturer to run one less lamp than the label rating.
55..33 TTaasskk LLiigghhttiinngg
Task Lighting implies providing the required good illuminance only in the actual small areawhere the task is being performed, while the general illuminance of the shop floor or office iskept at a lower level; e.g. Machine mounted lamps or table lamps. Energy saving takes placebecause good task lighting can be achieved with low wattage lamps. The concept of tasklighting if sensibly implemented, can reduce the no of general lighting fixtures, reduce thewattage of lamps, save considerable energy and provide better illuminance and also provideaesthetically pleasing ambience.
In some textile mills, lowering of tube light fixtures has resulted in improved illuminance andalso elimination of almost 40% of the fixtures. The dual benefit of lower energy consumptionand lower replacement cost has been realised. In some engineering industries, task lightingon machines is provided with CFLs. Even in offices, localised table lighting with CFLs may bepreferred instead of providing a large number of fluorescent tube lights of uniform generallighting.
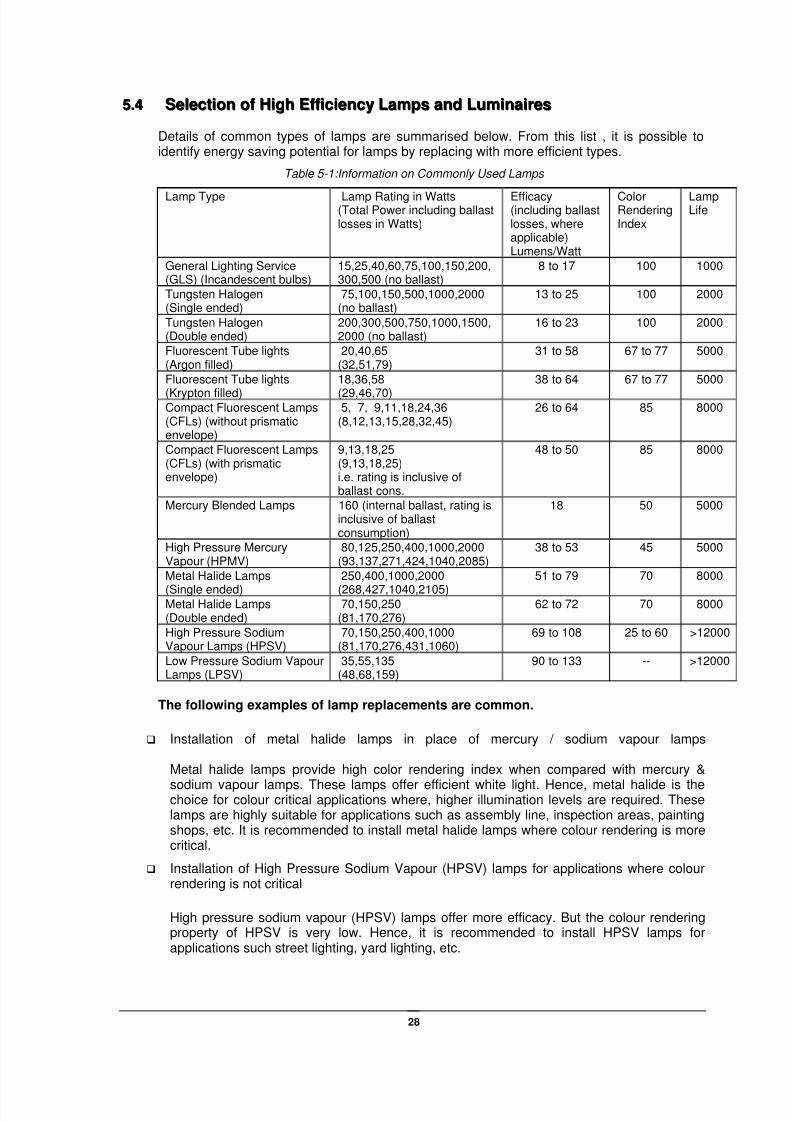
Details of common types of lamps are summarised below. From this list , it is possible toidentify energy saving potential for lamps by replacing with more efficient types.
Table 5-1:Information on Commonly Used Lamps
Lamp Type Lamp Rating in Watts(Total Power including ballastlosses in Watts)
The following examples of lamp replacements are common.
Installation of metal halide lamps in place of mercury / sodium vapour lamps
Metal halide lamps provide high color rendering index when compared with mercury &
sodium vapour lamps. These lamps offer efficient white light. Hence, metal halide is thechoice for colour critical applications where, higher illumination levels are required. Theselamps are highly suitable for applications such as assembly line, inspection areas, paintingshops, etc. It is recommended to install metal halide lamps where colour rendering is morecritical.
Installation of High Pressure Sodium Vapour (HPSV) lamps for applications where colourrendering is not critical
High pressure sodium vapour (HPSV) lamps offer more efficacy. But the colour renderingproperty of HPSV is very low. Hence, it is recommended to install HPSV lamps forapplications such street lighting, yard lighting, etc.
Installation of LED panel indicator lamps in place of filament lamps.
Panel indicator lamps are used widely in industries for monitoring, fault indication,signaling, etc. Conventionally filament lamps are used for the purpose, which has got thefollowing disadvantages
High energy consumption (15 W/lamp) Failure of lamps is high (Operating life less than 10,000 hours) Very sensitive to voltage fluctuations
The LEDs have the following merits over the filament lamps.
Lesser power consumption (Less than 1 W/lamp) Withstand high voltage fluctuation in power supply. Longer operating life (more than 1,00,000 hours)
It is recommended to install LEDs for panel indicator lamps at the design stage.
The types of lamps used depends on the mounting height, colour rendering may also be aguiding factor. Table 5.2 summarises the replacement possibilities with the potential savings.
Table 5-2: Savings by Use of More Efficient Lamps
Existing Lamp Replace by PotentialEnergySavings, %
Compact Fluorescent Lamp (CFL) 38 to 75High Pressure Mercury Vapour (HPMV) 45 to 54Metal Halide 66
GLS (Incandescent)
High Pressure Sodium Vapour (HPSV) 66 to 73Standard Tube light (Argon) Slim Tube light (Krypton) 9 to 11
Tube light (Krypton) 31 to 61High Pressure Mercury Vapour (HPMV) 54 to 61Metal Halide 48 to 73
Tungsten Halogen
High Pressure Sodium Vapour (HPSV) 48 to 84Mercury Blended Lamp High Pressure Mercury Vapour (HPMV) 41
Metal Halide 37High Pressure Sodium Vapour (HPSV) 34 to 57
There may be some limitations if colour rendering is an important factor. It may be noted that,in most cases, the luminaires and the control gear would also have to be changed. Thesavings are large if the lighting scheme is redesigned with higher efficacy lamps andluminaires.
Considerable development work is being done to improve the effectiveness of luminaires. Fortube lights in dust-free areas, luminaires with mirror optics may be used in place of theconventional stove enamel painted trough type luminaires or recessed luminaires with acryliccovers. This measure is well accepted and has been implemented in a large number ofoffices and commercial buildings.
Fig. 5.5 shows the effect of variation of voltage on light output and power consumption forfluorescent tube lights. Similar variations are observed on other gas discharge lamps likemercury vapour lamps, metal halide lamps and sodium vapour lamps; table 5.3
summarises the effects. Hence reduction in lighting feeder voltage can save energy,provided the drop in light output is acceptable. In many areas, night time grid voltagesare higher than normal; hence reduction in voltage can save energy and also provide therated light output. Some manufacturers are supplying reactors and transformers asstandard products. A large number of industries have used these devices and havereported saving to the tune of 5% to 15%. Industries having a problem of higher nighttime voltage can get an additional benefit of reduced premature lamp failures.
Figure 5-5: Effect of Voltage Variation on Fluorescent Tube light Parameters
Table 5-3: Variation in Light Output and Power Consumption
Particulars 10% lower voltage 10% higher voltage
Fluorescent lampsLight output Decreases by 9 % Increases by 8 %Power input Decreases by 15 % Increases by 8 1%HPMV lampsLight output Decreases by 20 % Increases by 20 %Power input Decreases by 16 % Increases by 17 %
Mercury Blended lampsLight output Decreases by 24 % Increases by 30 %Power input Decreases by 20 % Increases by 20 %Metal Halide lamps
Light output Decreases by 30 % Increases by 30 %Power input Decreases by 20 % Increases by 20 %HPSV lampsLight output Decreases by 28 % Increases by 30 %Power input Decreases by 20 % Increases by 26 %LPSV lamps
Light output Decreases by 4 % Decreases by 2 %Power input Decreases by 8 % Increases by 3 %
55..66 EElleeccttrroonniicc BBaallllaassttss
Conventional electromagnetic ballasts (chokes) are used to provide higher voltage to startthe tube light and subsequently limit the current during normal operation. Electronic ballasts are oscillators that convert the supply frequency to about 20,000 Hz to 30,000 Hz.The losses in electronic ballasts for tube lights are only about 1 Watt, in place of 10 to 15Watts in standard electromagnetic chokes. Table 5.4 shows the approximate savings byuse of electronic ballasts.
Table 5-4: Savings by use of Electronic Ballasts
Type of Lamp WithConventionalElectromagnetic ballast
WithElectronicBalla
st
PowerSavings
,Watts
40W Tube light 51 35 1635W Low PressureSodium
48 32 16
70W High PressureSodium
81 75 6
The additional advantage is that the efficacy of tube lights improves at higher frequencies(refer fig.5.6), resulting in additional savings if the ballast is optimised to provide the samelight output as with the conventional choke. Hence a saving of about 15 to 20 Watts pertube light can be achieved by use of electronic ballasts. With electronic ballast, the starter iseliminated and the tube light lights up instantly without flickering.
Figure 5-6:Increase in Light Output from Tube lights at Higher Operating Frequencies
A good number of industries have installed electronic ballasts for tube lights in largenumbers. The operation is reliable, provided the ballasts are purchased from establishedmanufacturers. Electronic ballasts have also been developed for 20W and 65W fluorescent
The loss in standard electromagnetic choke of a tube light is likely to be 10 to 15 Watts.
Use of low loss electromagnetic chokes can save about 8 to 10 Watts per tube light. Thesaving is due to the use of more copper and low loss steel laminations in the choke, leadingto lower losses. A number of industries have implemented this measure.
Automatic control for switching off unnecessary lights can lead to good energy savings.
Simple timers or programmable timers can be used for this purpose. The timings may haveto change, once in about two months, depending upon the season. Use of timers is a veryreliable method of control.
Twilight switches can be used to switch the lighting depending on the availability of daylight.Care should be taken to ensure that the sensor is installed in a place, which is free fromshadows, light beams of vehicles and interference from birds. Dimmers can also be used inassociation with photo-control; however, electronic dimmers normally available in India aresuitable only for dimming incandescent lamps. Dimming of fluorescent tube lights ispossible, if these are operated with electronic ballasts; these can be dimmed usingmotorised autotransformers or electronic dimmers (suitable for dimming fluorescent lamps;presently, these have to be imported).
Infrared and Ultrasonic occupancy sensors can be used to control lighting in cabins as wellas in large offices. Simple infrared occupancy sensors are now available in India. Howeverultrasonic occupancy sensors have to be imported. It may be noted that more sophisticatedoccupancy sensors used abroad have a combination of both infrared and ultrasonicdetection; these sensors incorporate a microprocessor in each unit that continuouslymonitors the sensors, adjusting the sensitivity levels to optimise performance. Themicroprocessor is programmed to memorise the static and changing features of itsenvironment; this ensures that the signals received from repetitive heat and motionequipment like fans is filtered out.
In developed countries, the concept of tube light fixtures with in-built electronic ballast,photo-controlled dimmer and occupancy sensor is being promoted as a package.
The following control methodologies are useful.
General areas
Where day lighting is available, provide day lighting controls. Use continuous dimmingfor spaces with minor motion activity such as reading, writing, and conferencing. Usestepped dimming (on/off switching) for spaces with major motion activity such aswalking and shelf stocking.
Always mount ultrasonic occupancy sensors at least 6 to 8 ft away from HVAC ducts onvibration free surfaces and place so there is no detection out the door or opening of thespace.
In spaces of high occupant ownership such as private offices and conference rooms,always include switches for manual override control of the lighting.
If there is concern that lighting could be turned off automatically or manually whenpeople are still in the space, put in night lighting for safe egress.
Many lighting control devices have specific voltage and load ratings requirements. Besure to specify the device model that matches the correct voltage and load rating for theapplication.
Conference Rooms
Use dual technology occupancy sensors in larger conference rooms for optimaldetection of both small hand motion and larger body movement.
Ceiling or corner-mounted passive infrared occupancy sensors are used for mediumand small conference rooms.
Always include switches that provide manual override control of the lighting.
Cubicles
Control plug loads such as task lighting, computer monitors, portable fans and heaterswith an occupancy sensor controlled plug strip.
Mount personal occupancy sensor beneath binder bin or desk and position so that itcannot detect motion outside cubicle area.
Restrooms
Use ceiling mounted ultrasonic sensors for restrooms with stalls.
Exterior Lighting Control
Use a lighting control panel with time clock and photocell to control exterior lighting toturn on at dusk and off at dawn and turn non-security lighting off earlier in the eveningfor energy savings.
The Fluorescent tube lights in use presently in India are of the T12 (40w) and T8 (36W).T12 implies that the tube diameter is 12/8” (33.8mm), T8 implies diameter of 8/8” (26mm)and T5 implies diameter of 5/8” (16mm). This means that the T5 lamp is slimmer than the36W slim tube light. The advantage of the T5 lamps is that due to its small diameter,luminaire efficiencies can be improved by about 5%. However, these lamps are about50mm shorter in length than T12 and T8 lamps, which implies that the existing luminairescannot be used. In addition, T5 lamp can be operated only with electronic ballast. Theselamps are available abroad in ratings of 14W, 21W, 28W and 35W. The efficiency of the35W T5 lamp is about 104 lm/W (lamp only) and 95 lm/W (with electronic ballasts), whilethat of the 36W T8 lamp is about 100 lm/W (lamp only) and 89 lm/W (with electronicballast). This may appear to be a small improvement of about 7%, but with the use ofsuper-reflective aluminium luminaire of higher efficiency, T5 lamps can effect an overallefficiency improvement ranging from 11% to 30%. T5 lamps have a coating on the insideof the glass wall that stops mercury from being absorbed into the glass and the phosphors.This drastically reduces the need for mercury from about 15 milligrams to 3 milligrams perlamp. This may be advantageous in countries with strict waste disposal laws.
In Europe, the T5 lamps are being used in good numbers in place of 4 foot, 36W T8 lamps.Their shorter lengths permit integration in standard building modules. With new miniatureballasts, luminaires are light and flat, saving space and also resources used for theirproduction. The U.S.A. has been slow in accepting this technology, as the 4 foot, T8 lampsconsume only about 35 Watts. Secondly, the focus in the U.S.A. has generally been onbetter optic control, rather than on lamp efficiency.
Maintenance is vital to lighting efficiency. Light levels decrease over time because of aginglamps and dirt on fixtures, lamps and room surfaces. Together, these factors can reducetotal illumination by 50 percent or more, while lights continue drawing full power. Thefollowing basic maintenance suggestions can help prevent this.
• Clean fixtures, lamps and lenses every 6 to 24 months by wiping off the dust.• Replace lenses if they appear yellow.• Clean or repaint small rooms every year and larger rooms every 2 to 3 years. Dirt
collects on surfaces, which reduces the amount of light they reflect.• Consider group re-lamping. Common lamps, especially incandescent and fluorescent
lamps lose 20 percent to 30 percent of their light output over their service life. Manylighting experts recommend replacing all the lamps in a lighting system at once. Thissaves labor, keeps illumination high and avoids stressing any ballasts with dyinglamps.
High bay fixtures of 250 W HPSV lamps were used for illumination in shop floor. It wasdecided to replace some of the existing asbestos roof sheets with translucentpolycarbonate sheets. Total of 6 nos transparent sheets of 3.0 m X 0.5 m area wereused. The following table summarises energy saving.
Table 6-1: Natural lighting
Description Unit Qty.
Power consumption of lamp+ ballast Watts 285Total strips installed nos 2Total number of lamps switched off nos 8Daily operating hours hours 8
Energy saved per day kWh 18.2Annual energy savings ( @ 300 days/annum) kWh 5472Annual energy cost saving ( @ Rs 5.0/kWh) Rs 27,300Investment Rs 14,000Payback period months 6
Additional benefits include better lamp life, lower replacement cost etc.
After a survey of the illuminance level in the plants and offices, trials were taken by
reducing the mounting height of selected tube lights by 1 metre and removing one tubelight and choke from the twin fixture. Reflective film (Aluminium foil) was applied on theinside of the fixture to improve reflection.
In fixtures with acrylic diffusers, holes were drilled in a symmetrical fashion and one tubelight was removed. It was found that the illuminance on the working plane was almostsimilar to the original levels with the twin tube lights.
Over a period of two years, about 1400 tube lights were removed. Total investment forlowering the fixtures, reflective films etc was Rs 1.0 lakhs. Annual energy saving wasfound to be 3,70,000 kWh.
The coffee shop of a commercial building was lighted by 25.60 cm x 120 cm, recessedluminaires, each with two magnetic ballasts and four 40 W cool white, T12 lamps. Lightingis used only from Monday to Friday beginning at approximately 7AM and continuingthrough approximately 6PM. The building's east and west facades are more than 70%glazing which provides abundant natural daylight to the buildings interior During theafternoon one or more of the three lighting circuits is usually switched off for a shortperiod (30 to 60 minutes).
The new controllable lighting system replaced the inefficient magnetic ballasts and poorcolor rendering 40W T12 cool white lamps with a single electronic dimming ballast andtwo high color rendering (85CRI) 32W T8 lamps in each luminaire. The building was
divided into five linear north-south zones, with each zone of five luminaires controlled by asingle ceiling mounted photo sensor. The photo sensor regulates the light level (to aminimum of 20%) for the ballasts in each zone based on the available light measured in
its conical field of view. The target illuminance was 300 lux. The overall lighting powersavings (nearly 76%) is a result of converting to a more efficient electronic ballast/lampssystem, adding ballast dimming capabilities, and tuning light levels through de-lamping.The old system of magnetic ballasts and 40W T12 lamps consumed a maximum of 4.65kW (186 watts/luminaire). The new system at full output was measured to consume amaximum of 1.5 kW (60 watts/luminaire). The graphical representation of energy profile is
A paper manufacturing plant has a connected lighting load of nearly 370 kW. This consistsof fluorescent fittings, HPSV,HPMV & CFL lamps for plant, office and area lighting. Thelighting load is fed from 3.3 kV bus by 4 nos. of LT transformers. These transformers havelighting loads apart from other loads. Each transformer is connected to a Lighting circuitDistribution box. The total actual load varies between 300 to 350 kW during night. Metersare fitted at each DB to measure power consumption.
The voltage levels at lighting DBs vary between 225 & 240 V. Lighting loads consume lesspower at lower voltages. The plant lighting voltages were at a level, which could be broughtdown further. The installation of lighting voltage controllers, of different kVA, on each DBbrought down the lighting consumption by 20%. The output voltages were set at 210 V.
Particulars Actual energy savingsNo. of DB lighting circuits = 4Total Power consumption = 338 kW
After installationTotal Power consumption= 275 kWAnnual Total energy savings, lakh kWh = 2.45Annual Cost savings, Rs. lakh = 4.89Cost of Implementation, Rs. lakh = 12.37Simple payback period, Year = 2 year 6 months
6.9 Street lighting modifications at Municipal Corporation
Conventionally, streetlight planning in Vadodara Municipal Corporation was not systematic – it was normally quantity based and not lighting design based. Photometric & Installationterms were totally ignored and the Selection criteria for Lamps & Luminaires ignored.
Pole height 8.5 to 10 MetersMounting height 7 to 8 metersSpan between Poles 30 MetersOver hang 1.5 to 3 MetersAngle of Tilt 15 DegreesWattage of Luminaries 250 W MV/SV
Illumination Very poor, Less than 10 lux
VMC realized the need for uniform & required level of illumination with increased energyefficiency. As a part of this innovation, VMC decided to develop street lighting on newroads in a scientific and systematic manner by implementing “Code of practice for lighting of Public thoroughfares IS 1944 (Part I & II), 1970”.
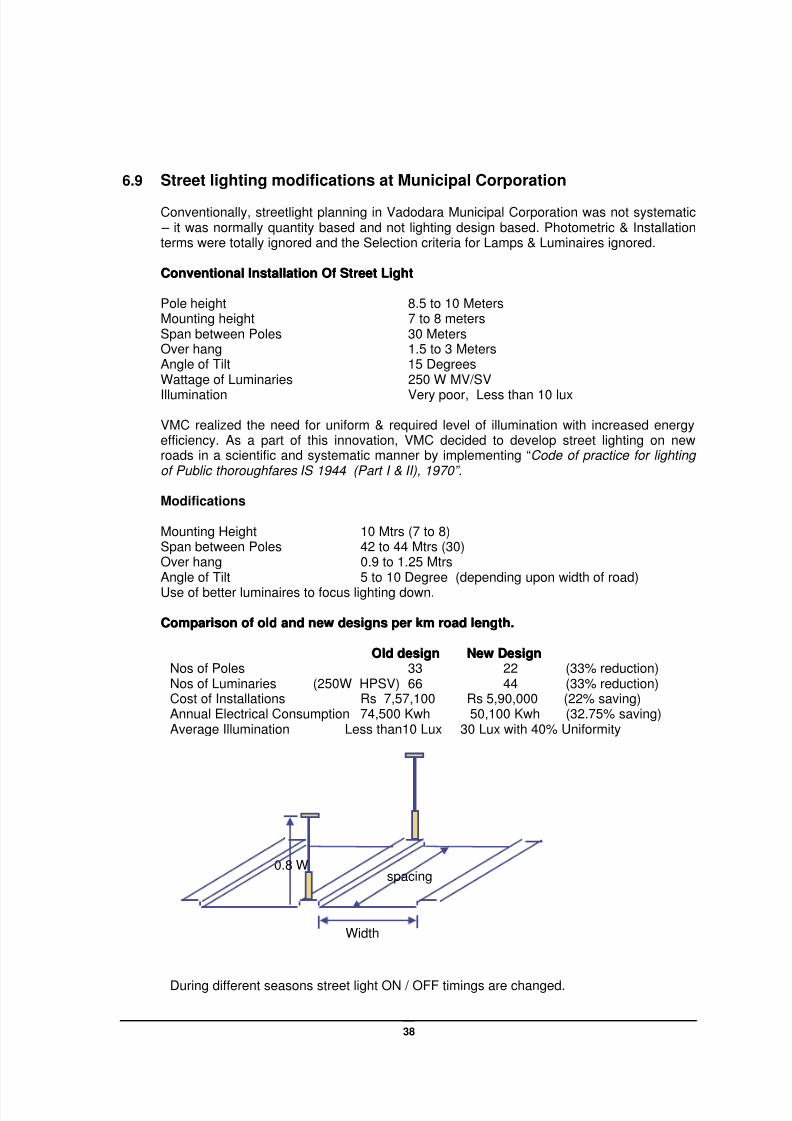
Modifications
Mounting Height 10 Mtrs (7 to 8)Span between Poles 42 to 44 Mtrs (30)Over hang 0.9 to 1.25 MtrsAngle of Tilt 5 to 10 Degree (depending upon width of road)
The ON time varies from 6:00 pm during winters to 7:45 pm during summers. The OFF time varies from 7:15 am during winters to 5:30 am during summers. It is necessary to fix ON / OFF timings for the entire year according to sunset and
sunrise timings. For this purpose annual programmable time switches are preferable rather than
the conventional manual ones to switch ON & OFF exactly at the required timings
throughout the year. Almost 5 to 10% savings are achieved by using annual programmable time
switch.
The entire capital cost of Rs. 24.1 Million spent to install street lighting on 21 major roadsis recoverable in terms of electrical saving within 54 months.
6.10 LED Lamps for signage lighting
Advance Transformer Company, Rosemont, Illinois, manufactures lighting products and aleader in LED drivers. When it came to renovate its corporate identity sign displayed on its
headquarters building, the company decided to take a new approach by using light emittingdiode (LED) technology.
Advance's 15+ year-old channel-letter sign originally employed neon as its light source, withletter-shaped neon tubes illuminating a number of blue plastic "letter lenses" mounted onthe outside of the building.
But after renovating the sign with LumiLeds LEDs powered by its own Advance signPRO™LED drivers, the resulting improvements in sign brightness and efficiency were literallyastounding to every one familiar with the pre-LED and post-LED signs. In the prototypephase, by configuring the LED equivalent of the original neon system and found that itburned 5-6 times brighter than the neon. They subsequently brought the LED wattage downto an optimal lumen output level for the application, but have still been amazed at how
much brighter and more evenly lit the new sign is relative to its predecessor. Working withlocal sign company Quantum Graphics of Alsip, Illinois, LEDs were mounted on the metalinserts and the assemblies were installed with the blue plastic "letter lenses" on the outsideof the building, replacing the old neon tubes. The compact, lightweight Advance signPROLED drivers were mounted inside the building, about 6 to 8 feet remote from the sign itself,in the junction boxes spaced along the length of the sign and formerly occupied by thelarge, heavy and unwieldy neon power supplies. At a later stage of the project, new blueplastic "letter lenses" were installed as well, replacing the older, faded lenses. Reflecting itsownership by parent company Philips Electronics, the new "Philips-Advance" sign ultimatelyrequired about 750 LEDs driven by roughly 25 40-watt and 25-watt Xitanium drivers.
A typically non-traditional application for LEDs based on the large (3 foot 6 inch) height ofthe sign's letters, the benefits of the conversion have been substantial—e.g., greatly
improved energy-efficiency, reduced maintenance requirements, and tremendouslyenhanced sign brightness and impact. The use of LEDs reduced the sign's input watts from3,500 to 1,000. In other words, with LEDs, they are enjoying 3-4 times more lumen outputthan the old neon sign offered at only 1/3 of the input power, which has translated to over$1,500 a year in combined energy savings and reduced maintenance costs.