36
Best Practice pH, DO, CO 2 and Turbidity Measurement Solutions Mettler-Toledo Process Analytics Achieving the Highest Level of Performance in Bioreactor Process Control
Best
Pra
ctic
e
pH, DO, CO2
and TurbidityMeasurement
Solutions
Mettler-ToledoProcess Analytics
Achieving the Highest Level of Performance in Bioreactor Process Control
2 Pharmaceutical Industry METTLER TOLEDO Best Practice
Publisher / Production Mettler-Toledo AG
Process Analytics
Im Hackacker 15
CH-8902 Urdorf
Switzerland
IllustrationsMettler-Toledo AG
Clearviewstock I Dreamstime.com
Pooh1 I Dreamstime.com
Subject to technical changes
© Mettler-Toledo AG 04/2012
Contents
Page
Process Analytical Technology (PAT) and Intelligent Sensor Management (ISM)
Achieving PAT Goals with Process Analytics Equipment 4
Management of Sensor Assets 8
Case study: Enhanced Reliability with Digital Sensors 9
Process Analytics for Fermentation
Maintaining Optimal Growth Conditions During Fermentation 11
pH
Reliable pH Measurement for Optimized Growth 12
pH Control in Fermentation Plants 13
Case study: Improving Yield in Fermentation Processes at Werthenstein Chemie AG 14
Case study: Reduced Batch Losses in Biopharmaceuticals Production 16
Dissolved Oxygen
Accurate Oxygen Measurement Improves Process Safety and Saves Energy 18
Simplified Oxygen Control in Bioreactors with Optical Technology 19
Optical Oxygen Measurement - Illuminate Your Process Control 21
Case study: Improved Fermentation Control in Amino Acid Production 25
Carbon Dioxide
Safe Levels of CO2 for Optimal Growth and Higher Yield 27
Case study: In situ CO2 Measurements to Determine Growth Phase of Yeast Cells 28
Turbidity
Biomass Monitoring with Turbidity for Higher Yield 30
Improved Fermentation Control with Backscattered Light Turbidity Sensor 31
Case study: Increase Production Rate and Yield by Monitoring Optical Density In-line 33

Intro
duct
ion
3Pharmaceutical Industry METTLER TOLEDO Best Practice
Achieving the Highest Level of Performance in Bioreactor Process Control
In pharmaceutical operations, it is crucial that process reliability is always high and consistent. Central to this aim is timely measurement of analytical parameters. Although analysis of grab samples offers accurate results, it is time-consuming, carries the possibility of sample contamination, and does not supply continuous, real-time data. On the other hand, in-line measurement using process analytical equipment reduces the workload of laboratory staff; measures directly in the process, eliminating the possibility of false readings due to contamination; and supplies a constant stream of real-time measurements, allowing rapid corrective action when necessary. Most significantly, in-line analytical measurements enable reliable, repeatable production of high quality pharmaceutical products, batch after batch.
METTLER TOLEDO has many decades’ experience in developing and manufacturing analytical measurement solutions that meet the particular needs of the pharmaceutical industry. Through listening to our customers across the globe, we have continued to innovate and improve our sensors and transmitters. This long-standing experience led to the development of the Intelligent Sensor Management (ISM) concept, a technology embedded into our measurement systems that provides a wide range of benefits including predictive diagnostics, pre-calibration of sensors, and electronic documentation for compliance purposes.
This booklet contains a collection of documents related to bioreactor process control. It highlights different analytical measurement challenges during biopharmaceutical fermentation that pharmaceutical companies may face when endeavoring to optimize their manufacturing operations. Several critical processes are outlined in case studies, in which solutions and their implementation are detailed. The booklet serves to help managers, engineers and technicians find the most appropriate measurement solutions to make their processes smarter, faster and more cost-effective.
In this booklet you will find out how to achieve:• Reliable, repeatable fermentation processes • Better process understanding• Optimal growth conditions• Batch-to-batch consistency • Increased yield• Easy traceability• Error-free documentation• Energy savings with optimum control of air intake• Compliance with regulations
Achieving PAT Goalswith Process Analytics Equipment
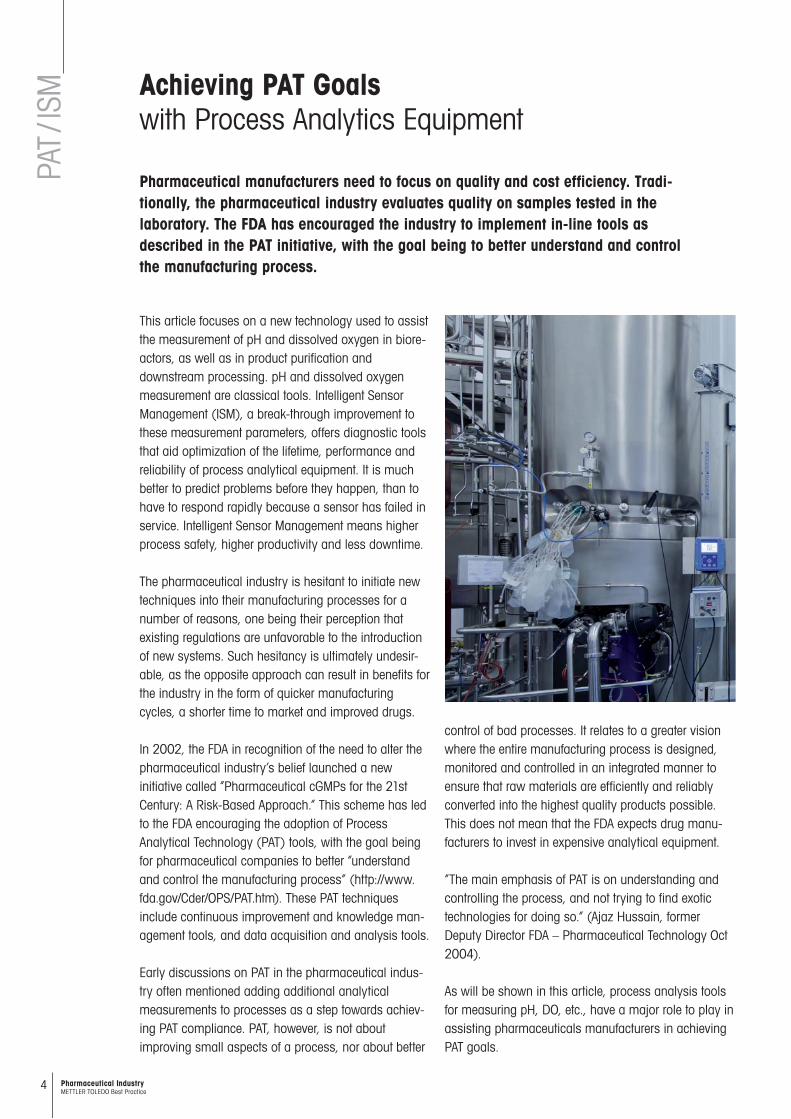
Pharmaceutical manufacturers need to focus on quality and cost efficiency. Tradi-tionally, the pharmaceutical industry evaluates quality on samples tested in the laboratory. The FDA has encouraged the industry to implement in-line tools as described in the PAT initiative, with the goal being to better understand and control the manufacturing process.
4
PAT /
ISM
Pharmaceutical Industry METTLER TOLEDO Best Practice
This article focuses on a new technology used to assist the measurement of pH and dissolved oxygen in biore-actors, as well as in product purification and downstream processing. pH and dissolved oxygen measurement are classical tools. Intelligent Sensor Management (ISM), a break-through improvement to these measurement parameters, offers diagnostic tools that aid optimization of the lifetime, performance and reliability of process analytical equipment. It is much better to predict problems before they happen, than to have to respond rapidly because a sensor has failed in service. Intelligent Sensor Management means higher process safety, higher productivity and less downtime.
The pharmaceutical industry is hesitant to initiate new techniques into their manufacturing processes for a number of reasons, one being their perception that existing regulations are unfavorable to the introduction of new systems. Such hesitancy is ultimately undesir-able, as the opposite approach can result in benefits for the industry in the form of quicker manufacturing cycles, a shorter time to market and improved drugs.
In 2002, the FDA in recognition of the need to alter the pharmaceutical industry’s belief launched a new initiative called “Pharmaceutical cGMPs for the 21st Century: A Risk-Based Approach.” This scheme has led to the FDA encouraging the adoption of Process Analytical Technology (PAT) tools, with the goal being for pharmaceutical companies to better “understand and control the manufacturing process” (http://www.fda.gov/Cder/OPS/PAT.htm). These PAT techniques include continuous improvement and knowledge man-agement tools, and data acquisition and analysis tools.
Early discussions on PAT in the pharmaceutical indus-try often mentioned adding additional analytical measurements to processes as a step towards achiev-ing PAT compliance. PAT, however, is not about improving small aspects of a process, nor about better
control of bad processes. It relates to a greater vision where the entire manufacturing process is designed, monitored and controlled in an integrated manner to ensure that raw materials are efficiently and reliably converted into the highest quality products possible. This does not mean that the FDA expects drug manu-facturers to invest in expensive analytical equipment.
“The main emphasis of PAT is on understanding and controlling the process, and not trying to find exotic technologies for doing so.” (Ajaz Hussain, former Deputy Director FDA – Pharmaceutical Technology Oct 2004).
As will be shown in this article, process analysis tools for measuring pH, DO, etc., have a major role to play in assisting pharmaceuticals manufacturers in achieving PAT goals.

5Pharmaceutical Industry METTLER TOLEDO Best Practice
PAT /
ISM As in the impedance example above, sensors with
high wear can be replaced pre-emptively before they fail during operation, resulting in less frequent un-scheduled downtimes. The level of maximum tolerable wear can be set for each measurement point individu-ally, adapting to the level of confidence required for the process. As a result, maintenance strategy can be changed from a passive, costly and unpredictable workflow, to a fully proactive and optimized proce-dure. This is an example of continuous improvement – an element of the PAT initiative.
Part of the function of the sensor wear parameter is to monitor the frequency of CIP and SIP cycles. These are critical to proper function of pH and DO sensors in batch processes; however, they can be detrimental to a sensor’s slope and lead to improper measure-ments and early-stage sensor failure. To overcome this, plant operators would traditionally turn to man-ual documentation of a sensor’s history and rely on this to schedule maintenance. ISM sensors have a built-in CIP and SIP counter which detects when the sensor is exposed to heat cycles. This data is stored in the imbedded chip and is automatically uploaded to the transmitter. When the maximum set number of cycles is exceeded, an alarm condition is raised. As a result, using a sensor that could potentially fail in the process can be avoided.
Intelligent Sensor Management as a PAT tool In pharmaceutical manufacturing, the downstream-processing phase is usually the most expensive, it is thus a very interesting area for implementing PAT tools and a technique with a view to reducing production cycle times and hence costs.
In order to help achieve this, analytical measurement points must supply accurate, real-time information to enable the earliest possible detection of drift from desired process parameters. Further, the sensors should be easy to maintain, have a long lifetime and be highly reliable, as unplanned production downtimes due to sensor failure are substantial cost factors.
The presence of an analog-to-digital converter and a memory are a revolution in digital pH and DO mea-surement. Sensors with inductive, non-contact plug-in connections are on the market to avoid problems such as moisture ingress and corrosion. Further, a low impedance digital signal is not affected by humidity. METTLER TOLEDO’s digital ISM sensors focus on very sophisticated diagnostics and offer a solution to the time-consuming task of calibration and maintenance.
Sensors with ISM functionality carry their own specific data on an imbedded integrated chip along with cali-bration data and data on the current process, and convey this to the connected transmitter.
ISM technology is able to provide expert information that is tailor-made for each measuring point. Using the “advanced diagnostics” measurement function, the ISM system saves all relevant data related to the sensor and the process, and displays this on the graphical interface of the transmitter in a detailed yet clear manner. This allows the measurement point to be optimized on an ongoing basis, as all critical situ-ations can be predicted allowing action to be taken before production is interrupted. For example, for pH measurement, monitoring the reference system is es-sential. ISM provides in-line glass impedance and ref-erence monitoring. This data is summarized graphi-cally in a sensor spider diagram and displayed on the transmitter (Fig. 1). Should either or both impedance readings stray too far toward the center point on the spider diagram – an indication of impending malfunc-tion – the sensor can be replaced before it fails.
Determining sensor wearA diagnostics parameter called “sensor wear” gives an indication as to how much the exposure of a sensor to a process has altered the sensor’s condition (Fig. 2).
Fig. 2: Proactive maintenance via sensor wear monitor
Fig. 1: Visualized reference system monitoring via sensor spider diagram

6
PAT /
ISM
Pharmaceutical Industry METTLER TOLEDO Best Practice
iSense Asset SuiteAs the signal from ISM sensors is digital, a simple connection via a USB port to a PC or laptop is possi-ble. This allows the sensor to interface with METTLER TOLEDO’s iSense Asset Suite software, which provides access to various analyses, calibration and documen-tation tools. The Key Performance Table allows the evaluation of the condition of an ISM sensor at a glance, without the need of a transmitter. The iSense software has a further useful feature; it allows a sensor to be calibrated via the PC / laptop. As an accurate pre-calibration in the lab yields better sensor performance in the field, this is a significant advantage to large bio-reactors and provides another step towards achieving the goals of PAT.
Optical oxygen sensorsDuring fermentation processes, air feed and agitator speed are adjusted on the basis of the measured DO concentration value in order to achieve optimal growth conditions for the microorganisms. Mammalian cell cultures – the use of which is on the increase in the pharmaceutical industry – are much more sensitive to changes in their environment than are bacterial cul-tures, and their growth is significantly slower. It is precisely in the case of batch runs of up to five weeks that optical oxygen sensors can fully demonstrate their inherent strength, namely negligible drift over time. The stable measurement enables batch-to-batch consis-tency – another goal of PAT – and the maintenance of optimal growth conditions.
The built-in ISM technology in the sensor allows for quick start-up thanks to the “Plug and Measure” feature and offers the advanced diagnostics mentioned above. ISM helps in deciding whether a sensor is safe for reuse in the next batch or whether it is advisable to carry out maintenance such as membrane
iSense Asset Suite
LED Sensor tip
Detector Emitted
O2 sensitivelayer
fluorescence light
O2
O2
O2
Principle of optical oxygen measurement: The heart of the optical sensor is an oxygen sensitive layer containing immobilized molecules. They absorb light from a light emitting diode and are able to release this energy as light at a different wavelength (fluorescence). The fluorescence depends on the amount of oxygen that is present in the environment of the marker molecules. This effect allows determination of the oxygen concentration in the sample media.
replacement. Furthermore, the optical sensor offers maximum availability, since no pre-polarization time is required as is the case with polarographic sensors.

PAT /
ISM
7Pharmaceutical Industry METTLER TOLEDO Best Practice
Measuring point verificationAn ISM verification kit allows the qualification of the measuring point independently of the sensor, as required by GMP rules. A set of five devices simulate two fixed values at different temperatures as well as various error states. Important ISM parameters such as the SIP/CIP counter and the Dynamic Lifetime Indicator can also be verified.
Turbidity sensorsIn situ turbidity sensors deliver a real-time reading of the amount of light scattered by a suspension of cells. The correlation with an optical density mea-surement is excellent, as the turbidity of a cell sus-pension is directly related to cell mass. Knowing turbidity means that the microbial activity in a con-tinuous culture can be controlled via the regulation of nutrient feed and withdrawal rate of the culture from the bioreactor. If this activity is modeled into the process, then in situ turbidity measurement is also consistent with the goals of PAT.
ConclusionThe recommendations in the PAT initiative are just that, recommendations; they are not stipulations. However, this does not mean that the pharmaceuti-cal industry should maintain their hesitant approach to implementing new procedures until legislation forces them otherwise.
As shown above, the use of process analytical sensors with ISM technology can bring about a better under-standing of bioprocesses, and better in situ monitor-ing, which are prerequisites for feedback control and consistent quality. It is the understanding and use of the data which METTLER TOLEDO technology provides that makes it compatible with PAT. Further, ISM sensors help improve batch quality, reduce unsched-uled production downtimes and lessen the mainte-nance burden, all of which are also commensurate with the PAT initiative.
ISM verification kit
8 Pharmaceutical Industry METTLER TOLEDO Best Practice
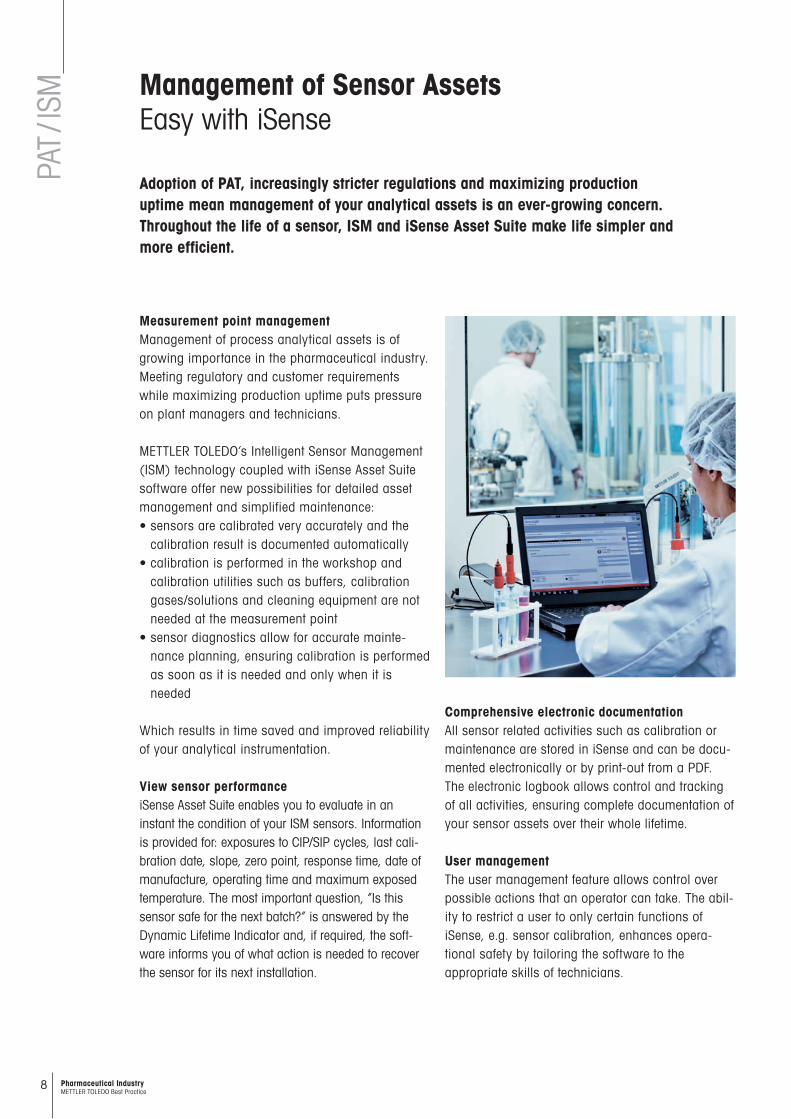
Measurement point managementManagement of process analytical assets is of growing importance in the pharmaceutical industry. Meeting regulatory and customer requirements while maximizing production uptime puts pressure on plant managers and technicians.
METTLER TOLEDO’s Intelligent Sensor Management (ISM) technology coupled with iSense Asset Suite software offer new possibilities for detailed asset management and simplified maintenance: • sensors are calibrated very accurately and the
calibration result is documented automatically• calibration is performed in the workshop and
calibration utilities such as buffers, calibration gases/solutions and cleaning equipment are not needed at the measurement point
• sensor diagnostics allow for accurate mainte-nance planning, ensuring calibration is performed as soon as it is needed and only when it is needed
Which results in time saved and improved reliability of your analytical instrumentation.
View sensor performanceiSense Asset Suite enables you to evaluate in an instant the condition of your ISM sensors. Information is provided for: exposures to CIP/SIP cycles, last cali-bration date, slope, zero point, response time, date of manufacture, operating time and maximum exposed temperature. The most important question, “Is this sensor safe for the next batch?” is answered by the Dynamic Lifetime Indicator and, if required, the soft-ware informs you of what action is needed to recover the sensor for its next installation.
Comprehensive electronic documentationAll sensor related activities such as calibration or maintenance are stored in iSense and can be docu-mented electronically or by print-out from a PDF. The electronic logbook allows control and tracking of all activities, ensuring complete documentation of your sensor assets over their whole lifetime.
User management The user management feature allows control over possible actions that an operator can take. The abil-ity to restrict a user to only certain functions of iSense, e.g. sensor calibration, enhances opera-tional safety by tailoring the software to the appropriate skills of technicians.
Management of Sensor AssetsEasy with iSense
Adoption of PAT, increasingly stricter regulations and maximizing production uptime mean management of your analytical assets is an ever-growing concern. Throughout the life of a sensor, ISM and iSense Asset Suite make life simpler and more efficient.
PAT /
ISM

9Pharmaceutical Industry METTLER TOLEDO Best Practice
Chinese API producerZhejiang Hisun Pharmaceutical Co. Ltd. was estab-lished in 1956. It is located in Taizhou, an emerging port city in the middle of China’s south-eastern coast. Hisun produces a diverse range of products including anti- tumor, cardio- vascular, anti-infection and immuno- suppressant treatments. The company actively explores overseas markets and has established strategic cooperative relationships with Lily, Pfizer, Merck and Bayer amongst others.
pH and DO measurement During the fermentation stages of pilot testing and production, Hisun pay particular attention to maintain-ing the correct pH and DO levels due to the considerable influence these parameters have on fermentation yield. For pH and DO measurement, Hisun have used in-line measurement systems from METTLER TOLEDO for many years.
Over this period, Hisun purchased InPro 3253 pH elec-trodes, InPro 68001 DO sensors and the corresponding transmitters, and they were very satisfied with the perfor-mance of the systems. However, asset management of the sensors was problematic and calibration records were kept in notebooks which could easily be misplaced. Due to there being too many human factors it was impossible to understand in detail the use of each elec-trode and sensor. As a result, there was often no time to purchase spare parts when it came to replacement and the facility had no contingency in this regard.
From analog to digitalIn 2009, Hisun began making the switch from METTLER TOLEDO’s analog sensors to our digital Intelligent Sensor Management (ISM) sensors. The fea-tures of ISM were exactly what Hisun required.
Enhanced Reliabilitywith Digital Sensors
The risk of human error for pharmaceutical manufacturers does not just apply to production. Inadequate measure ment system documentation can be a significant headache. For a Chinese API producer, the advantages of digital sensors and asset management software were obvious – time saved, simpler maintenance, and docu-mentation at the touch of a button.
PAT /
ISM
A microprocessor in the head of each ISM probe stores all relevant sensor and calibration data as well as the measurement values recorded during the process. The data is transmitted digitally to an ISM compatible transmitter which displays diagnostic information on the condition of the sensor. This allows engineers to quickly determine if a probe requires cleaning, calibra-tion or has to be replaced before the next batch starts; making maintenance planning and stock control significantly easier.
Case Study

10 Pharmaceutical Industry METTLER TOLEDO Best Practice
iSense Asset SuiteOf even greater use to Hisun is the iSense Asset Suite software for ISM sensors. With iSense, a record of every sensor calibration as well as the entire history of each sensor used at the facility is stored in the software. With complete and reliable documenta-tion for each sensor easily accessible, requirements of regulatory standards are simply met.
Sensor documentation is not the only function of iSense. The software performs accurate pre-calibration in the lab, which yields better sensor performance in the process and also means that pre-calibrated probes
can be stored for quick exchange later. Li Hui, Technology Center Measurement Supervisor at Hisun is pleased with the new system. “In the past, operators conducted calibration using buffer solutions at site which was often polluted, and the calibration result was not particularly satisfactory. Now that calibration can be conducted using the iSense software, we only need to bring the sensor to the workroom for calibra-tion. The software is easy to operate and saves a great deal of time.” As Hisun continue to make the switch from analog to digital in-line measurement sensors, they will benefit further from predictive maintenance and competent sensor asset management, and can put their calibration notebooks in the wastebasket.
1) An optical dissolved oxygen sensor specifically for biofermenta-tion use is now available. The InPro 6860i features drift-free measurement, ISM predictive diagnostics for pre-batch verifica-tion, and an analog nA output which connects to existing biocontrollers.
InPro 6850i DO sensor InPro 3253i pH electrode
PAT /
ISM

11Pharmaceutical Industry METTLER TOLEDO Best Practice
Ferm
enta
tion
The use of mammalian cell cultures is on the increase in the biopharmaceutical industry. Such cells are much more sensitive to changes in their environment than bacterial cultures; consequently, measurement requirements are significantly higher. Reliable monitoring and control are therefore crucial for achieving and maintaining ideal growth conditions.
During fermentation processes, data from analytical measurement systems enables the maintenance of consistent living conditions for the production of microorganisms or suspended cells. Important parameters for monitoring the physiochemical envi-ronment are pH, dissolved oxygen, dissolved carbon dioxide, and turbidity. Control of these four para-meters leads to maximized process yield, batch to
AlkalineAcid
Trb CO2
pH DO
Air
Typical setup for bioreactor control
Maintaining Optimal Growth ConditionsDuring Fermentation
batch consistency, reduced product loss and quicker batch runs.
In bioprocess engineering, conditions and requirements demand that in-line sensors must be sterilization toler-ant and have a hygienically polished surface. In addition, stable and reliable low-maintenance sensors are key necessities in biofermentation applications.
12 Pharmaceutical Industry METTLER TOLEDO Best Practice
pH Reliable pH Measurementfor Optimized Growth
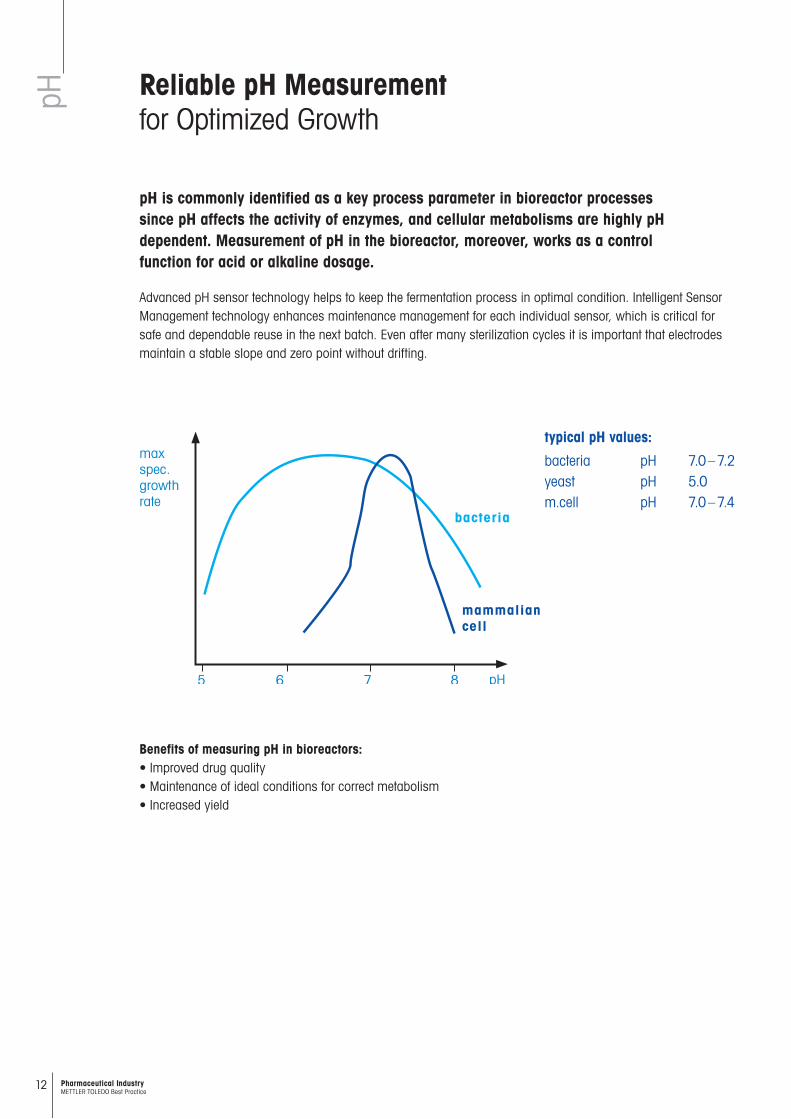
pH is commonly identified as a key process parameter in bioreactor processes since pH affects the activity of enzymes, and cellular metabolisms are highly pH dependent. Measurement of pH in the bioreactor, moreover, works as a control function for acid or alkaline dosage.
Benefits of measuring pH in bioreactors: • Improved drug quality • Maintenance of ideal conditions for correct metabolism • Increased yield
typical pH values:
bacteria pH 7.0 – 7.2yeast pH 5.0m.cell pH 7.0 – 7.4
maxspec.growthrate
bacteria
mammaliancell
5 6 7 8 pH
Advanced pH sensor technology helps to keep the fermentation process in optimal condition. Intelligent Sensor Management technology enhances maintenance management for each individual sensor, which is critical for safe and dependable reuse in the next batch. Even after many sterilization cycles it is important that electrodes maintain a stable slope and zero point without drifting.
13Pharmaceutical Industry METTLER TOLEDO Best Practice
pH
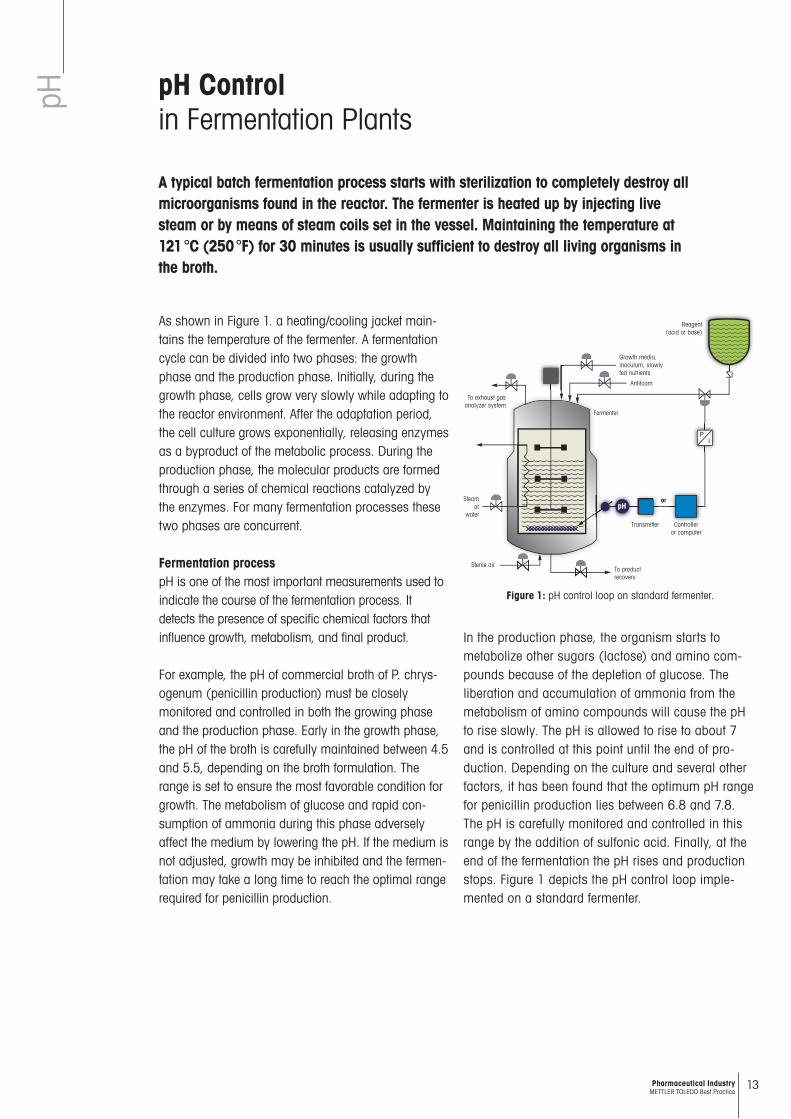
As shown in Figure 1. a heating/cooling jacket main-tains the temper ature of the fermenter. A fermentation cycle can be divided into two phases: the growth phase and the production phase. Initially, during the growth phase, cells grow very slowly while adapting to the reactor environment. After the adaptation period, the cell culture grows exponentially, releasing enzymes as a byproduct of the metabolic process. During the produc tion phase, the molecular products are formed through a series of chemical reactions catalyzed by the enzymes. For many fermentation processes these two phases are concurrent.
Fermentation process pH is one of the most important measurements used to indicate the course of the fermentation process. It detects the presence of specific chemical factors that influence growth, metabolism, and final product.
For example, the pH of commercial broth of P. chrys-ogenum (penicillin production) must be closely monitored and controlled in both the growing phase and the production phase. Early in the growth phase, the pH of the broth is carefully maintained between 4.5 and 5.5, depending on the broth formulation. The range is set to ensure the most favorable condition for growth. The metabolism of glucose and rapid con-sumption of ammonia during this phase adversely affect the medium by lowering the pH. If the medium is not adjusted, growth may be inhibited and the fermen-tation may take a long time to reach the optimal range required for penicillin production.
pH Control in Fermentation Plants
A typical batch fermentation process starts with sterilization to completely destroy all micro organisms found in the reactor. The fermenter is heated up by injecting live steam or by means of steam coils set in the vessel. Maintaining the temperature at 121 °C (250 °F) for 30 minutes is usually sufficient to destroy all living organisms in the broth.
lZ
PI
XXXXXXXXXXXXXXXX
) ) ) ) ) ) ) ) ) ) ) ) ) ) ) )) ) ) ) ) ) ) ) ) ) ) ) ) ) ) )) ) ) ) ) ) ) ) ) ) ) ) ) ) ) )) ) ) ) ) ) ) ) ) ) ) ) ) ) ) )) ) ) ) ) ) ) ) ) ) ) ) ) ) ) )) ) ) ) ) ) ) ) ) ) ) ) ) ) ) )) ) ) ) ) ) ) ) ) ) ) ) ) ) ) )) ) ) ) ) ) ) ) ) ) ) ) ) ) ) )) ) ) ) ) ) ) ) ) ) ) ) ) ) ) )) ) ) ) ) ) ) ) ) ) ) ) ) ) ) )
pH
To exhaust gasanalyzer system
Steamor
water
Sterile airTo product recovery
Transmitter
Fermenter
Antifoam
Growth media,inoculum, slowlyfed nutrients
Reagent(acid or base)
Controlleror computer
or
Figure 1: pH control loop on standard fermenter.
In the production phase, the organism starts to metabolize other sugars (lactose) and amino com-pounds because of the depletion of glucose. The liberation and accumulation of ammonia from the metabolism of amino compounds will cause the pH to rise slowly. The pH is allowed to rise to about 7 and is controlled at this point until the end of pro-duction. Depending on the culture and several other factors, it has been found that the optimum pH range for penicillin production lies between 6.8 and 7.8. The pH is carefully monitored and controlled in this range by the addition of sulfonic acid. Finally, at the end of the fermentation the pH rises and production stops. Figure 1 depicts the pH control loop imple-mented on a standard fermenter.
14 Pharmaceutical Industry METTLER TOLEDO Best Practice
pH
In the biotechnology and pharmaceutical industries, an increasing demand for extremely precise measurement of the pH value has been detected over recent years. pH is crucial to the yield of many processes, not least in fermentation. A Swiss customer, Werthenstein Chemie AG, tested a pre-pressurized liquid electro-lyte from METTLER TOLEDO. Enthusiastic about its performance they switched and replaced competitor products.
Improving Yield in FermentationProcesses at Werthenstein Chemie AG
Werthenstein Chemie AG is a subsidiary company of Merck & Co. At their site in Switzerland approximately 100 scientists, engineers as well as technical and administrative employees work in close cooperation with the mother company in order to develop new drugs.
The company focuses on the development of new pro-cesses and the pilot production of pharmaceutical agents for preclinical testing and clinical studies. Active agents are either derived by chemical synthesis or are biopharmaceutical agents generated in a fermentation process.
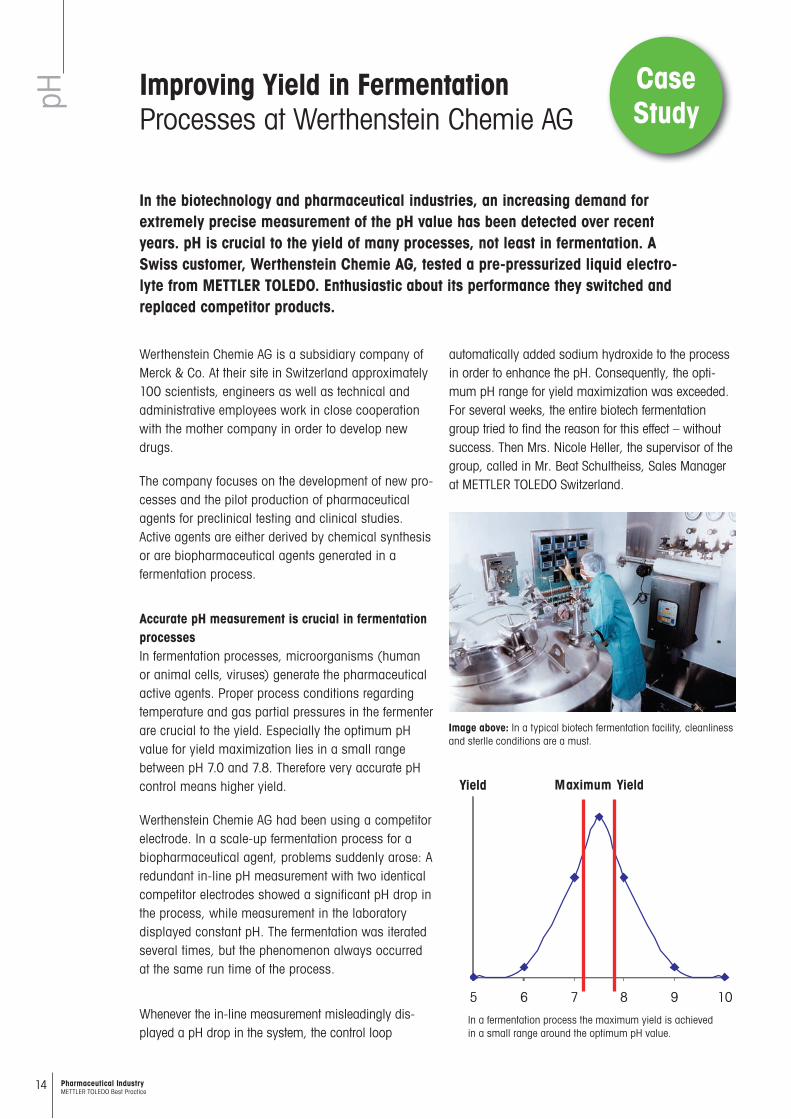
Accurate pH measurement is crucial in fermentation processes In fermentation processes, microorganisms (human or animal cells, viruses) generate the pharmaceutical active agents. Proper process conditions regarding temperature and gas partial pressures in the fermenter are crucial to the yield. Especially the optimum pH value for yield maximi zation lies in a small range between pH 7.0 and 7.8. Therefore very accurate pH control means higher yield.
Werthenstein Chemie AG had been using a competitor electrode. In a scale-up fermentation process for a biopharmaceutical agent, problems suddenly arose: A redundant in-line pH measurement with two identical competitor electrodes showed a significant pH drop in the process, while measurement in the laboratory displayed constant pH. The fermentation was iterated several times, but the phenomenon always occurred at the same run time of the process.
Whenever the in-line measurement misleadingly dis-played a pH drop in the system, the control loop
Image above: In a typical biotech fermentation facility, cleanliness and sterlle conditions are a must.
In a fermentation process the maximum yield is achieved in a small range around the optimum pH value.
Maximum Yield
5 6 7 8 9 10
pH
Yield
automatically added sodium hydroxide to the process in order to enhance the pH. Consequently, the opti-mum pH range for yield maximization was exceeded. For several weeks, the entire biotech fermentation group tried to find the reason for this effect – without success. Then Mrs. Nicole Heller, the supervisor of the group, called in Mr. Beat Schultheiss, Sales Manager at METTLER TOLEDO Switzerland.
Case Study

15Pharmaceutical Industry METTLER TOLEDO Best Practice
pH
He suggested replacing the competitor product with METTLER TOLEDO’s InPro 32531 with pre-pressurized liquid electrolyte. “Nobody knew what exactly happened in the process”, Beat told us. “Since many stability prob-lems of the pH measurement are related to the reference system, and the competitor product was not pre-pres-surized, I was pretty sure we could overcome the problem with the pre-pressurized InPro 3253”.
Advantages of an electrode designed for pH measure-ment under sterile conditionsThe InPro 3253 preserves the important benefits of the InPro 3200, such as high accuracy and long lifetime, and also has a pre-pressurized reference system. Since the reference electrolyte of the entire InPro 3250 series is no longer a gel but a liquid, it was possible to utilize a diaphragm with smaller pores. This reinforces this series with higher pressure specifications, up to an overpres-sure of 4 bar (58 psi).
The series also offers an extended range of pH mem-brane glasses. In the case of our Swiss customer, the InPro 3253 was chosen. Its glass membrane consists of a “biopharma” glass, which was developed in order to minimize zero point shift of the electrode after sterilization.
pH
Nicole Heller from the biotech fermentation group of Werthenstein Chemie AG was pleased to see that with the METTLER TOLEDO electrode, exact pH mea-surement was still functioning successfully, and process reliability was recovered. “It gives us even more security to know that we have nearly no zero point shift after sterilization due to the new glass”. The reason for the failure of the competitor product was identified through the fact that after a certain run time, due to a biologic process, suddenly the ion activity in the medium changed. In a non-pres-surized pH electrode, this can disturb the equilibrium of ion diffusion in the diaphragm and, depending upon the extent of the activity change, substantially influence the pH signal. A pre-pressur-ized reference system eliminates this effect by guaranteeing a constant ion diffusion driven by the overpressure inside the electrode. Also, the head of the biotechnology plant, Mr. Markus Tanner, is con-vinced: “In the future, we will only utilize InPro 3253 in this process, and we will check where else in our facility we can use it. The MaxCert package with its biocompatibility certificate even allows a simple change in validated processes”.
1) This electrode is now available in an ISM version.

16 Pharmaceutical Industry METTLER TOLEDO Best Practice
pH Reduced Batch Lossesin Biopharmaceuticals Production
Mammalian cell fermentation using dis posable bioreactors requires highly reliable analytical sensors. For a major bio pharmaceuticals producer, Intelligent Sensor Management technology has eliminated pH measurement concerns, increased pro-duct yield and reduced batch losses.
pH
quantity of fluid. The electrode features an integral platinum auxiliary electrode (solution ground) which eliminates ground loop problems and allows the sensor to simultaneously measure ORP (redox).
Growth in disposable bioreactors The rise of disposable bioreactors since the first models appeared in the late 90s has been dramatic. Current annual growth of 17 % to 20 % is predicted to continue, helped by manufacturers producing larger vessel sizes and adding more technically com-plex bioreactor technology. Advantages of using disposable bio reactors for mammalian cell fermenta-tions over conventional bioreactors are numerous, and include: reduced changeover time, multiple product development, increased safety and cleanli-ness, and higher ROI.
The development of single-use pH and dissolved oxygen analytical sensors for disposable bio reactors faces many technical difficulties, so multiple-use sensors are commonly employed. However, utilizing conventional pH electrodes can be challenging. Failure of an electrode during fermentation can lead to batch loss and the waste of an expensive reactor. In addition, electrodes must be connected to a par-ticular transmitter, as the transmitter retains the calibration data for a specific sensor. These issues present problems that production technicians would obviously prefer not to have. For one of the world’s leading biotech companies, METTLER TOLEDO’s Intelligent Sensor Management (ISM) technology has erased these concerns.
Advanced sensor for the biopharma industryOur customer uses 2,000 L disposable reactors for the production of specialty biopharmaceuticals. They use METTLER TOLEDO’s pressurized liquid electrolyte InPro 3253i SG electrode and M800 transmitter for pH moni toring. Pressurization of the electrolyte pre-vents penetration of the fermentation medium into the electrode’s reference system, extending its life-time. Pressurization also ensures constant cleaning of the diaphragm due to the outflow of a very low
Case Study
17Pharmaceutical Industry METTLER TOLEDO Best Practice
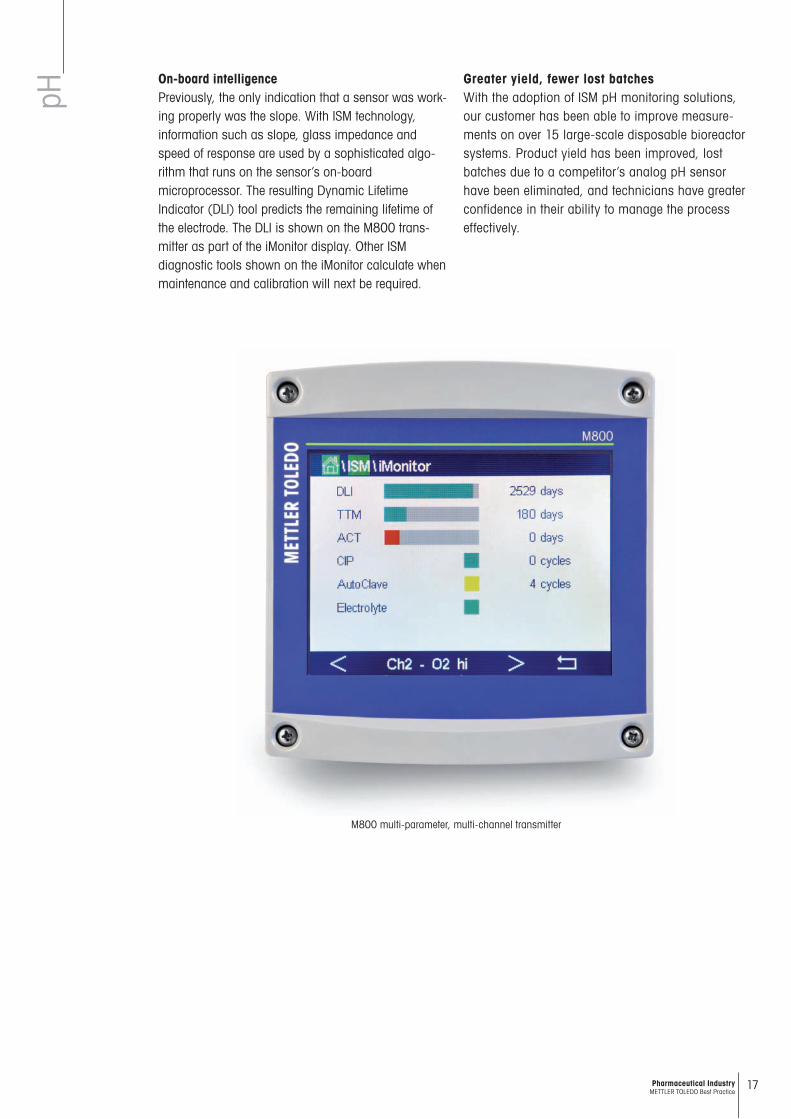
M800 multi-parameter, multi-channel transmitter
pHOn-board intelligencePreviously, the only indication that a sensor was work-ing properly was the slope. With ISM technology, information such as slope, glass impedance and speed of response are used by a sophisticated algo-rithm that runs on the sensor’s on-board microprocessor. The resulting Dynamic Lifetime Indicator (DLI) tool predicts the remaining life time of the electrode. The DLI is shown on the M800 trans-mitter as part of the iMonitor display. Other ISM diagnostic tools shown on the iMonitor calculate when maintenance and calibration will next be required.
Greater yield, fewer lost batchesWith the adoption of ISM pH monitoring solutions, our customer has been able to improve measure-ments on over 15 large-scale disposable bio reactor systems. Product yield has been improved, lost batches due to a competitor’s analog pH sensor have been eliminated, and technicians have greater confidence in their ability to manage the process effectively.

18 Pharmaceutical Industry METTLER TOLEDO Best Practice
DO sensors based on an optical measurement technique are becoming the preferred choice in the pharmaceuti-cal industry. The main advantage of optical DO technology is minimal drift over time, which is vital for ensuring accurate DO values throughout long fermentation runs and for batch to batch consistency. The fast response of optical sensors means changes in dissolved oxygen level are noticed quickly and corrective action can be rap-idly implemented. Negligible drift enabling batch consistency, fast response and low maintenance make optical sensors highly suitable for monitoring batch fermentations.
The optical DO sensor shows higher measurement performance compared to amperometric sensors
Benefits of measuring DO in bioreactors:• Prevent hyper-oxygenation • Control of aerobic fermentation • Cost-effective use of air compressors
Accurate Oxygen MeasurementImproves Process Safety and Saves Energy
Dissolved oxygen control is important for maintaining an adequate supply of oxy-gen to the broth during fermentation. The control of an air compressor by a DO sensor allows significant savings in energy costs by only supplying as much oxygen as needed for the cultures.
Dis
solv
ed O
xyge
n
Drastically improved drift compared to amperometric systems
Drift less than 0.5% / week
Significantly faster response time
T98=<20s from air to N2
1 2 3
100
80
70
60
Air S
at. %
Time / Weeks
12:33 12:35 12:38 12:41 12:44 12:47 12:50 12:53 12:56
25
20
15
10
5
0
02 [
%]
Time / min

19Pharmaceutical Industry METTLER TOLEDO Best Practice
Simplified Oxygen Controlin Bioreactors with Optical Technology
Successful mammalian cell fermentation requires careful control of the physico-chemical properties of the medium, such as dissolved oxygen (DO). The long batch durations necessitate low maintenance sensors with minimal drift. DO sensors based on optical technology are ideal for this purpose.
BackgroundProcess analytics during fermentation serves to main-tain consistent living conditions for the suspended cells or microorganism. This includes monitoring and control of the physicochemical environment such as the level of pH, dissolved oxygen (DO), and dissolved carbon dioxide. Neglecting control of these parameters could potentially impact final product quality. In-line measurement can be employed to maintain the culture in its optimal state.
Cell cultures require oxygen for the production of energy from organic carbon sources. Given oxygen’s poor solubility in water, the control of oxygen (air) flow must be carefully regulated to ensure it does not become a rate-limiting factor in the process. In con-trast, a hyper-oxygenated bioreactor air supply can irreversibly impact culture performance and can simply be a waste of energy used for running the air compressor.
Mammalian cells are large, slow growing and very shear-sensitive in comparison with microbial fer-mentation. Product concentration (titer) is usually very low, and toxic metabolites such as ammonium and lactate are produced during growth. The biore-actor for mammalian cells needs well-controlled homogeneous environmental conditions (correct temperature, pH, DO, and redox potential). Due to the slow growth rate, batch duration can be up to three weeks; therefore, in-line sensors must be very stable throughout the whole run.
Optical technology DO sensorIn respect of DO measurement, sensors that utilize optical measurement technology offer significant advantages over amperometric technology, as shown in table 1 on the next page.
METTLER TOLEDO’s optical oxygen sensors are designed for the requirements of the pharmaceutical industry. The heart of the sensors is an oxygen-sensi-tive layer containing immobilized marker molecules. These molecules absorb light from a light-emitting diode and are able to release this energy as light of a different wavelength (fluorescence). The time delay between light absorption and emittance is dependent on the partial pressure of oxygen present in the medium. Instead of membrane body, inner body, and electrolyte found in amperometric sensors, only one component, the OptoCap (which contains the oxygen-sensitive molecules), has to be replaced from time to time as a consumable.
Dis
solv
ed O
xyge
n
20 Pharmaceutical Industry METTLER TOLEDO Best Practice
Amperometric technology Optical technology Benefits of optical technology
Medium drift rate Very low drift rate and Highly suited to long batch runs shorter response time
Frequent membrane and Electrolyte-free Low maintenance (OptoCap exchangeelectrolyte exchange. after 6 – 7 months). Risk of electrolyte leakage. No risk of electrolyte leakage.
6 hours pre-polarization prior No polarization needed Ready for measuring when connectedto calibration and measurement to a transmitter, even after autoclaving. Works out of the box. High availability.
Table 1: Amperometric vs optical technology
Dis
solv
ed O
xyge
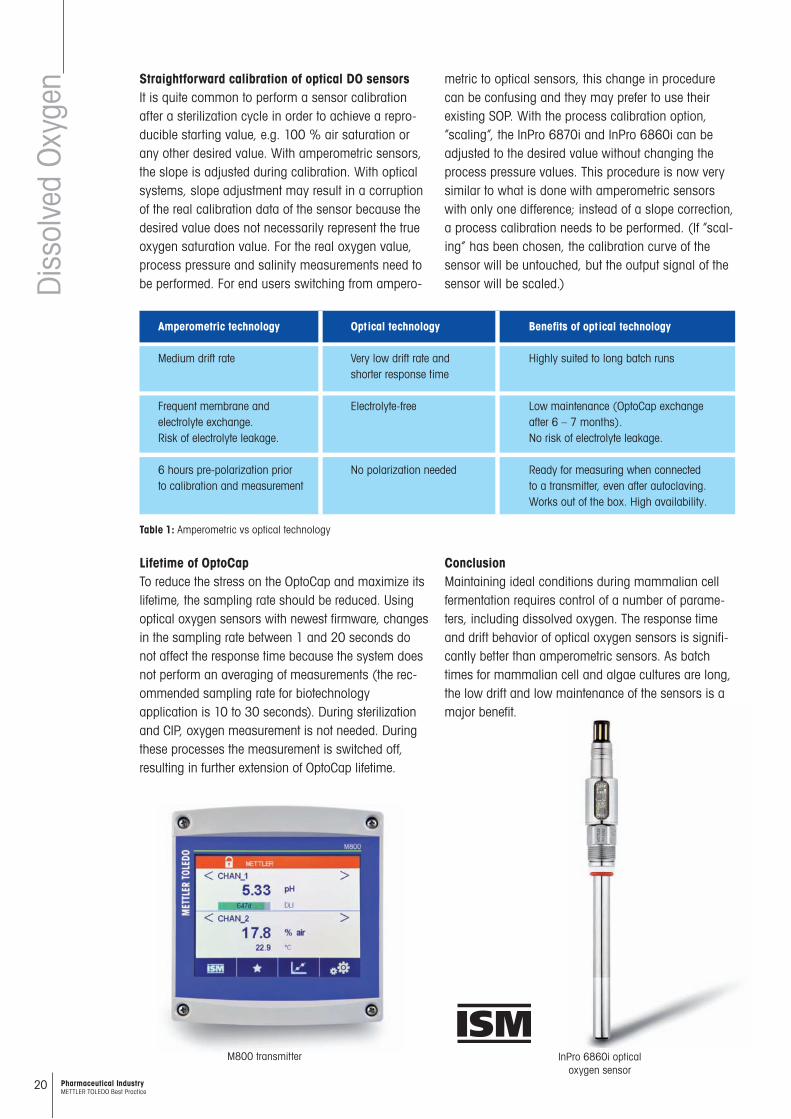
n Straightforward calibration of optical DO sensorsIt is quite common to perform a sensor calibration after a sterilization cycle in order to achieve a repro-ducible starting value, e.g. 100 % air saturation or any other desired value. With amperometric sensors, the slope is adjusted during calibration. With optical systems, slope adjustment may result in a corruption of the real calibration data of the sensor because the desired value does not necessarily represent the true oxygen saturation value. For the real oxygen value, process pressure and salinity measurements need to be performed. For end users switching from ampero-
metric to optical sensors, this change in procedure can be confusing and they may prefer to use their existing SOP. With the process calibration option, “scaling”, the InPro 6870i and InPro 6860i can be adjusted to the desired value without changing the process pressure values. This procedure is now very similar to what is done with amperometric sensors with only one difference; instead of a slope correction, a process calibration needs to be performed. (If “scal-ing” has been chosen, the calibration curve of the sensor will be untouched, but the output signal of the sensor will be scaled.)
Lifetime of OptoCapTo reduce the stress on the OptoCap and maximize its lifetime, the sampling rate should be reduced. Using optical oxygen sensors with newest firmware, changes in the sampling rate between 1 and 20 seconds do not affect the response time because the system does not perform an averaging of measurements (the rec-ommended sampling rate for biotechnology application is 10 to 30 seconds). During sterilization and CIP, oxygen measurement is not needed. During these processes the measurement is switched off, resulting in further extension of OptoCap lifetime.
M800 transmitter InPro 6860i optical oxygen sensor
ConclusionMaintaining ideal conditions during mammalian cell fermentation requires control of a number of parame-ters, including dissolved oxygen. The response time and drift behavior of optical oxygen sensors is signifi-cantly better than amperometric sensors. As batch times for mammalian cell and algae cultures are long, the low drift and low maintenance of the sensors is a major benefit.

21Pharmaceutical Industry METTLER TOLEDO Best Practice
Optical Oxygen Measurement Illuminate Your Process Control
For many decades, oxygen measurement systems based on amperometric technol-ogy have been a reliable and easy to use solution in many applications. But the interest of the market in new solutions has grown in line with increasing require-ments for reliability, user friendliness and cost efficiency in demanding biotech processes. Optical measurement technology has significant advantages over amperometric technology. This article explains what these advantages are and why optical measurements are replacing amperometric systems.
Ener
gy
1. Excitation with light
2. Energy Transfer
3. Relaxation through energy transfer
O2
O2
Figure 1: Fluorescence quenching
Dis
solv
ed O
xyge
n
A natural phenomenonFluorescence is a natural phenomenon of many organic and inorganic substances. It is present in many situations in our daily life such as illumination for watches and security features for bank notes.
Optical sensors for dissolved oxygen (DO) measure-ment use the principle of fluorescence quenching. This technology was first published in 1931 but it took nearly 70 years to be suitable for process ana-lytical sensors. Over the past decade, this technology has increasingly entered the process analytical mar-ket since it offers important advantages compared to other technologies in terms of stability, user friendli-ness and cost efficiency.
From light to oxygen measurementIn order to measure the dissolved oxygen in a liquid, it is necessary that oxygen is in contact with the chromophore inside the sensor and influences the fluorescence properties. To achieve this, the chromo-phore is embedded in an oxygen permeable matrix in the sensor tip. The chromophore is illuminated by an LED inside the sensor and the fluorescence light is measured with a photo detector inside the sensor.
Oxygen is able to penetrate into the sensor tip and interact with the chromophore. Without oxygen, most of the absorbed energy is released as fluorescence.

22 Pharmaceutical Industry METTLER TOLEDO Best Practice
The more oxygen is present, the less fluorescence light appears, hence the shorter is the fluorescence lifetime.
For the calculation of the oxygen partial pressure in most process analytical sensors only the change of the fluorescence lifetime is used. The change in the intensity of the fluorescence is less accurate and thus not suitable for accurate measurement.
To measure the fluorescence lifetime it is necessary to modulate the intensity of the excitation light. As a con sequence, the intensity of the fluorescence is also modulated. The detector now measures a sinus shaped curve describing the intensity change. The time between the maximum intensity of the excitation and the maximum intensity of the fluorescence is used for calculating the oxygen value. This time shift or phase shift is not linearly correlated to the oxygen concentration (see Fig. 2).
In amperometric systems the measured current is linearly correlated to the oxygen value. In optical sys-tems the phase decreases exponentially with increasing oxygen concentration. This decrease is described by the Stern–Volmer equation.
Calibration, a challenge for optical systemsDepending on the process conditions such as oxy-gen level, temperature or use of cleaning solutions,
Dis
solv
ed O
xyge
n the readings from an oxygen sensor exhibit drift. For amperometric and optical systems the reasons drift occurs are different. Whereas in amperometric sen-sors the progressive degradation of the electrolyte or the membrane are the most important drift factors, in optical systems the degradation of the chromophore is the reason for the sensor drift. An important drift factor is the measurement itself. If the chromophore transfers the energy to the oxygen molecule, the oxy-gen molecule becomes more aggressive and is able to destroy the chromophore or the matrix. This effect is greater the higher the oxygen concentration or temperature is. Also, high temperature or treatment with cleaning agents may influence the drift of the sensing element. These factors result in a change of the fluorescence intensity and the phase of the sig-nal over time. To ensure accurate measurement over the whole measurement range, accurate calibration is necessary. The newest systems are able to deter-mine the degradation of the chromophore and automatically compensate for sensor drift.
Calibration in amperometric sensors is quite easy. The linear correlation between the measured current and the oxygen concentration can be described with the zero value and the slope. In most amperometric sensors the zero current results in a zero oxygen reading. A slope correction with an air calibration is sufficient to reach the required accuracy in many applications. If high accuracy at very low oxygen levels is needed, a zero point calibration is necessary.
In optical oxygen measurement the correlation of the oxygen value to the measured phase is not linear. The individual calibration curve of a sensor depends on several factors: the phase at 100 % air, the phase at zero and additional factors that describe the shape of the curve.
Figure 2: Fluorescence signals measured in the sensor.
Sens
or S
igna
l
Time0.1 µs0.1 µs
ReferencePhase shift Low oxygen
High oxygen
70
60
50
40
30
20
10
Phas
e sh
ift
10 20 30 40 50 60 70 80 90 100 110 120 % Air
Figure 3: Correlation between the measured signal and the oxygen concentration.
23Pharmaceutical Industry METTLER TOLEDO Best Practice
Dis
solv
ed O
xyge
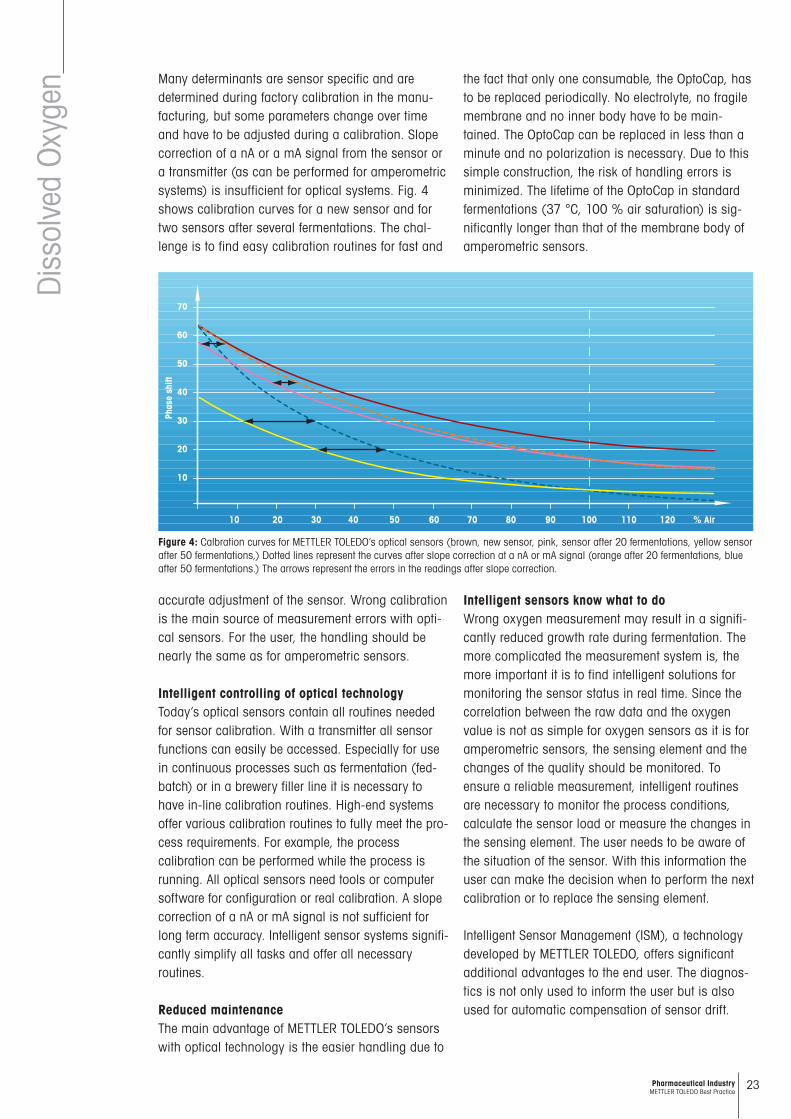
n Many determinants are sensor specific and are determined during factory calibration in the manu-facturing, but some parameters change over time and have to be adjusted during a calibration. Slope correction of a nA or a mA signal from the sensor or a transmitter (as can be performed for amperometric systems) is insufficient for optical systems. Fig. 4 shows calibration curves for a new sensor and for two sensors after several fermentations. The chal-lenge is to find easy calibration routines for fast and
accurate adjustment of the sensor. Wrong calibration is the main source of measurement errors with opti-cal sensors. For the user, the handling should be nearly the same as for amperometric sensors.
Intelligent controlling of optical technologyToday’s optical sensors contain all routines needed for sensor calibration. With a transmitter all sensor functions can easily be accessed. Especially for use in continuous processes such as fermentation (fed-batch) or in a brewery filler line it is necessary to have in-line calibration routines. High-end systems offer various calibration routines to fully meet the pro-cess requirements. For example, the process calibration can be performed while the process is running. All optical sensors need tools or computer software for configuration or real calibration. A slope correction of a nA or mA signal is not sufficient for long term accuracy. Intelligent sensor systems signifi-cantly simplify all tasks and offer all necessary routines.
Reduced maintenanceThe main advantage of METTLER TOLEDO’s sensors with optical technology is the easier handling due to
the fact that only one consumable, the OptoCap, has to be replaced periodically. No electrolyte, no fragile membrane and no inner body have to be main-tained. The OptoCap can be replaced in less than a minute and no polarization is necessary. Due to this simple construction, the risk of handling errors is minimized. The lifetime of the OptoCap in standard fermentations (37 °C, 100 % air saturation) is sig-nificantly longer than that of the membrane body of amperometric sensors.
Intelligent sensors know what to doWrong oxygen measurement may result in a signifi-cantly reduced growth rate during fermentation. The more complicated the measurement system is, the more important it is to find intelligent solutions for monitoring the sensor status in real time. Since the correlation between the raw data and the oxygen value is not as simple for oxygen sensors as it is for amperometric sensors, the sensing element and the changes of the quality should be monitored. To ensure a reliable measurement, intelligent routines are necessary to monitor the process conditions, calculate the sensor load or measure the changes in the sensing element. The user needs to be aware of the situation of the sensor. With this information the user can make the decision when to perform the next calibration or to replace the sensing element.
Intelligent Sensor Management (ISM), a technology developed by METTLER TOLEDO, offers significant additional advantages to the end user. The diagnos-tics is not only used to inform the user but is also used for automatic compensation of sensor drift.
70
60
50
40
30
20
10
Phas
e sh
ift
10 20 30 40 50 60 70 80 90 100 110 120 % Air
Figure 4: Calbration curves for METTLER TOLEDO’s optical sensors (brown, new sensor, pink, sensor after 20 fermentations, yellow sensor after 50 fermentations,) Dotted lines represent the curves after slope correction at a nA or mA signal (orange after 20 fermentations, blue after 50 fermentations.) The arrows represent the errors in the readings after slope correction.
24 Pharmaceutical Industry METTLER TOLEDO Best Practice
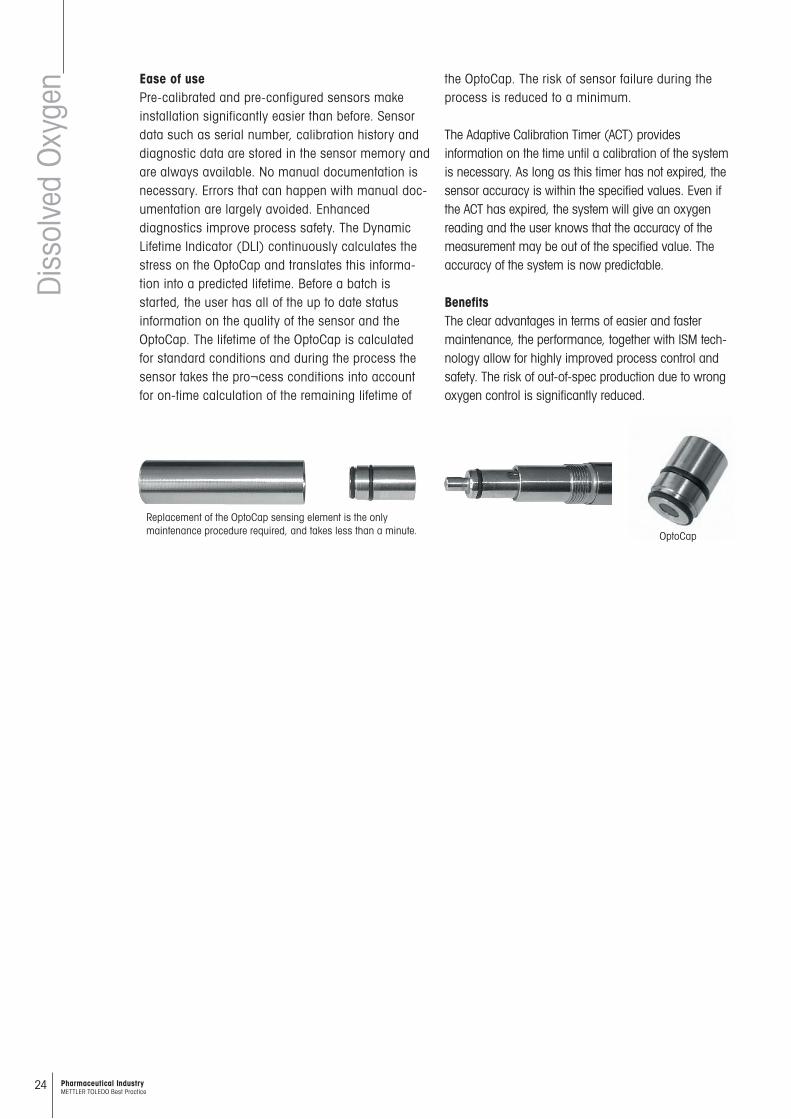
Replacement of the OptoCap sensing element is the onlymaintenance procedure required, and takes less than a minute. OptoCap
Dis
solv
ed O
xyge
n Ease of usePre-calibrated and pre-configured sensors make installation significantly easier than before. Sensor data such as serial number, calibration history and diagnostic data are stored in the sensor memory and are always available. No manual documentation is necessary. Errors that can happen with manual doc-umentation are largely avoided. Enhanced diagnostics improve process safety. The Dynamic Lifetime Indicator (DLI) continuously cal culates the stress on the OptoCap and translates this informa-tion into a predicted lifetime. Before a batch is started, the user has all of the up to date status information on the quality of the sensor and the OptoCap. The lifetime of the OptoCap is calculated for standard conditions and during the process the sensor takes the pro¬cess conditions into account for on-time calculation of the remaining lifetime of
the OptoCap. The risk of sensor failure during the process is reduced to a minimum.
The Adaptive Calibration Timer (ACT) provides information on the time until a calibration of the system is necessary. As long as this timer has not expired, the sensor accuracy is within the specified values. Even if the ACT has expired, the system will give an oxygen reading and the user knows that the accuracy of the measurement may be out of the specified value. The accuracy of the system is now predictable.
BenefitsThe clear advantages in terms of easier and faster maintenance, the performance, together with ISM tech-nology allow for highly improved process control and safety. The risk of out-of-spec production due to wrong oxygen control is significantly reduced.

25Pharmaceutical Industry METTLER TOLEDO Best Practice
Improved Fermentation Controlin Amino Acid Production
Maintaining the ideal dissolved oxygen concentration during fermentation is vital for increasing yield. A Chinese biochemical producer tested an optical DO sensor to ascertain its benefits. They noted that compared with polarographic probes, the opti-cal sensor provides greater control over fermentation and requires less maintenance.
Importance of DO in fermentationAnhui BBCA Biochemical Co. Ltd. is one of the leading processing enterprises in China for the production of biochemical products. Established in 1998 in Bengbu, Anhui province the company employs over 10,000 people over a number of facilities. For the production of amino acids amongst other products, the company has developed low-temperature liquefaction, filtrate fer-mentation technology. In aerobic fermentation during amino acid production control, dissolved oxygen level is one of the most important parameters for maximiz-ing production yield. Facility engineers at Anhui BBCA Biochemical need to ensure adequate but not excess oxygen (which would mean unnecessary use of air compressors) is being fed to the vessel to optimize microbial growth and metabolism. This requires an accurate and reliable in-line DO measurement system with high repeatability.
Maintenance load in DO measurementBing Dixiang, a technical engineer at Anhui BBCA Biochemical, was interested in comparing the perfor-mance of an optical DO sensor with the polarographic sensor they had been using. “During fermentation, the dissolved oxygen level is more meaningful when it is a relative value rather than an absolute value. But this requires setting the dissolved oxygen fermented by different batches at the same value, so as to conduct comparison and analysis on the fermentation data. However, when the fermentation in each tank is com-pleted the dissolved oxygen sensor will, to some extent, drift and the reading may be too high in some cases. This means that calibration of the DO sensor is required prior to loading each tank, which increases maintenance work and reduces productivity. And if the sensor membrane or electrolyte has been replaced, polarization time is required. I wanted to find out what advantages could be gained from using optical DO sensors instead.”
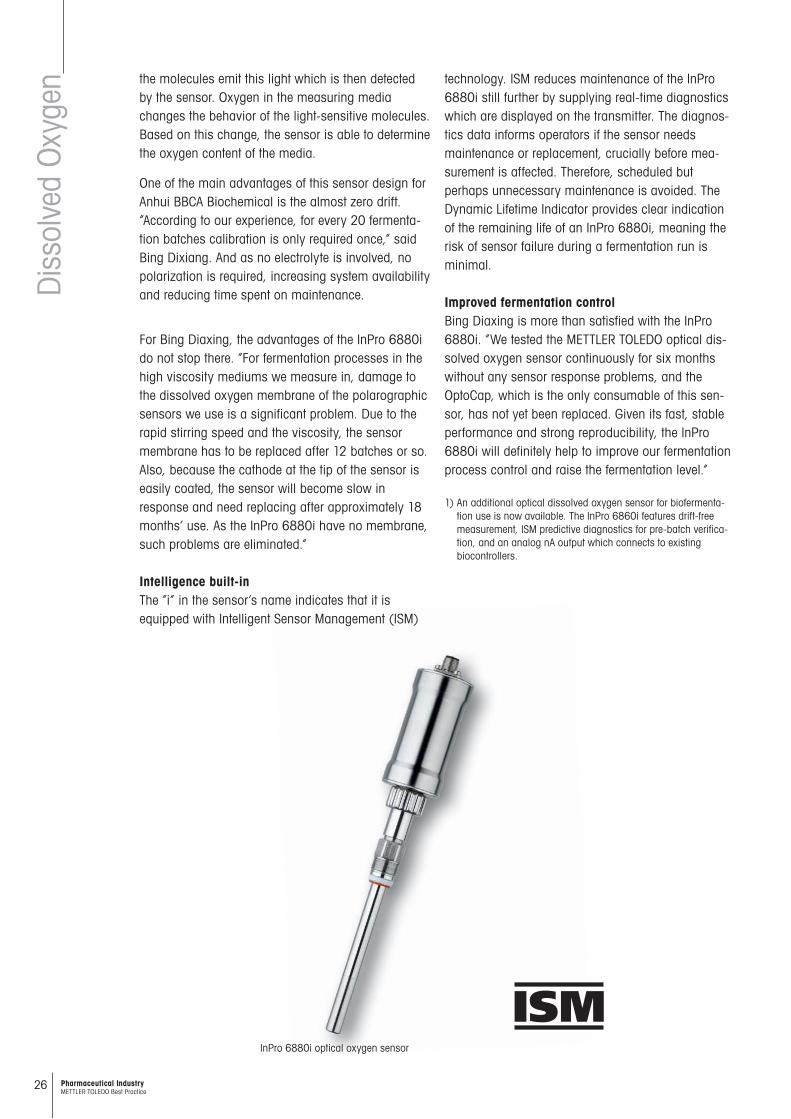
Higher stability with optical DO sensorsBing Dixiang ran a six-month trial of a METTLER TOLEDO InPro 6880i1 sensor and M400 transmitter. The probe utilizes the phenomenon of fluorescence quenching to accurately determine DO. Light-sensitive molecules embedded in the replaceable sensing element, the OptoCap, absorb light from the sensor’s internal LED. After a fraction of a second,
Dis
solv
ed O
xyge
n Case Study
26 Pharmaceutical Industry METTLER TOLEDO Best Practice
the molecules emit this light which is then detected by the sensor. Oxygen in the measuring media changes the behavior of the light-sensitive molecules. Based on this change, the sensor is able to determine the oxygen content of the media.
One of the main advantages of this sensor design for Anhui BBCA Biochemical is the almost zero drift. “According to our experience, for every 20 fermenta-tion batches calibration is only required once,” said Bing Dixiang. And as no electrolyte is involved, no polarization is required, increasing system availability and reducing time spent on maintenance.
For Bing Diaxing, the advantages of the InPro 6880i do not stop there. “For fermentation processes in the high viscosity mediums we measure in, damage to the dissolved oxygen membrane of the polarographic sensors we use is a significant problem. Due to the rapid stirring speed and the viscosity, the sensor membrane has to be replaced after 12 batches or so. Also, because the cathode at the tip of the sensor is easily coated, the sensor will become slow in response and need replacing after approximately 18 months’ use. As the InPro 6880i have no membrane, such problems are eliminated.”
Intelligence built-in The “i” in the sensor’s name indicates that it is equipped with Intelligent Sensor Management (ISM)
InPro 6880i optical oxygen sensor
technology. ISM reduces maintenance of the InPro 6880i still further by supplying real-time diagnostics which are displayed on the transmitter. The diagnos-tics data informs operators if the sensor needs maintenance or replacement, crucially before mea-surement is affected. Therefore, scheduled but perhaps unnecessary maintenance is avoided. The Dynamic Lifetime Indicator provides clear indication of the remaining life of an InPro 6880i, meaning the risk of sensor failure during a fermentation run is minimal.
Improved fermentation controlBing Diaxing is more than satisfied with the InPro 6880i. “We tested the METTLER TOLEDO optical dis-solved oxygen sensor continuously for six months without any sensor response problems, and the OptoCap, which is the only consumable of this sen-sor, has not yet been replaced. Given its fast, stable performance and strong reproducibility, the InPro 6880i will definitely help to improve our fermentation process control and raise the fermentation level.”
1) An additional optical dissolved oxygen sensor for biofermenta-tion use is now available. The InPro 6860i features drift-free measurement, ISM predictive diagnostics for pre-batch verifica-tion, and an analog nA output which connects to existing biocontrollers.
Dis
solv
ed O
xyge
n
27Pharmaceutical Industry METTLER TOLEDO Best Practice
Safe Levels of CO2
for Optimal Growth and Higher Yield
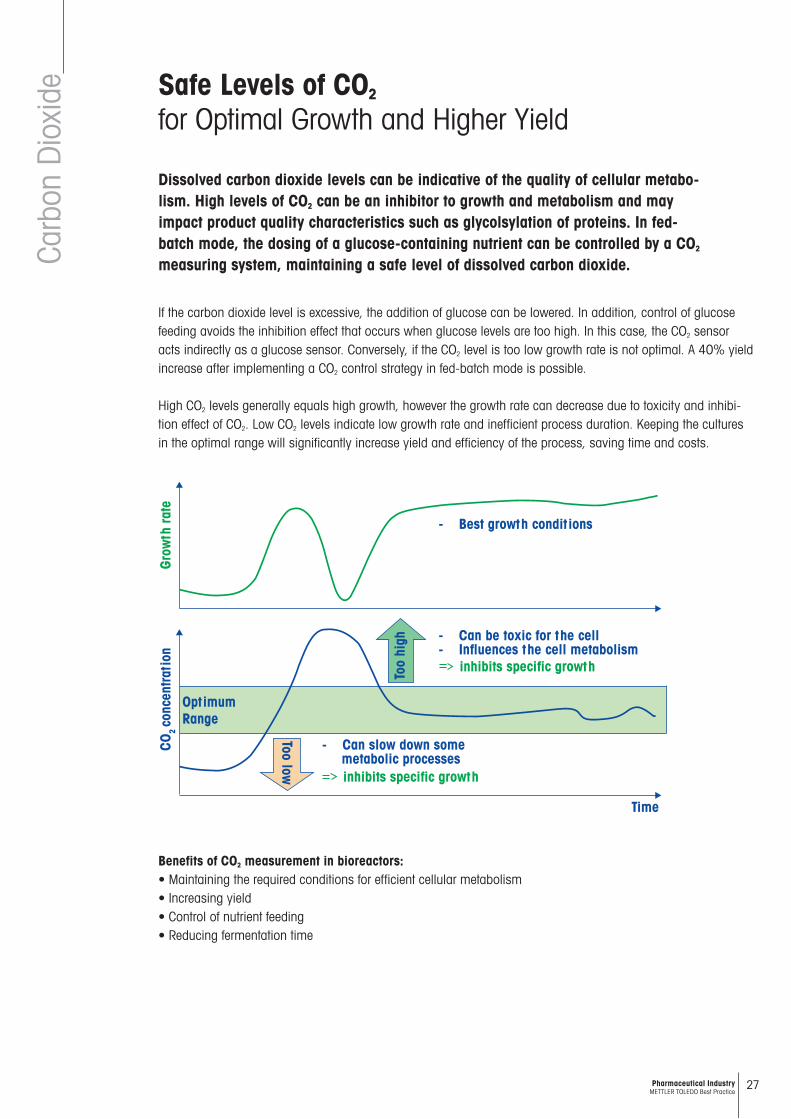
Dissolved carbon dioxide levels can be indicative of the quality of cellular metabo-lism. High levels of CO2 can be an inhibitor to growth and metabolism and may impact product quality characteristics such as glycolsylation of proteins. In fed-batch mode, the dosing of a glucose-containing nutrient can be controlled by a CO2 measuring system, maintaining a safe level of dissolved carbon dioxide.
Benefits of CO2 measurement in bioreactors:• Maintaining the required conditions for efficient cellular metabolism • Increasing yield • Control of nutrient feeding • Reducing fermentation time
Grow
th ra
teCO
2 co
ncen
trati
on
OptimumRange
Too low
Too
high
- Best growth conditions
Time
- Can slow down some metabolic processes
inhibits specific growth
- Can be toxic for the cell- Influences the cell metabolism
inhibits specific growth
Carb
on D
ioxi
de
If the carbon dioxide level is excessive, the addition of glucose can be lowered. In addition, control of glucose feeding avoids the inhibition effect that occurs when glucose levels are too high. In this case, the CO2 sensor acts indirectly as a glucose sensor. Conversely, if the CO2 level is too low growth rate is not optimal. A 40% yield increase after implementing a CO2 control strategy in fed-batch mode is possible.
High CO2 levels generally equals high growth, however the growth rate can decrease due to toxicity and inhibi-tion effect of CO2. Low CO2 levels indicate low growth rate and inefficient process duration. Keeping the cultures in the optimal range will significantly increase yield and efficiency of the process, saving time and costs.
28 Pharmaceutical Industry METTLER TOLEDO Best Practice
In situ CO2 Measurementsto Determine Growth Phase of Yeast Cells
In conjunction with pH and dissolved oxygen, in situ measurement of dissolved CO2 is a critical parameter in evaluating the respiratory efficiency of microorgan-isms in cell cultures. Virginia Bioinformatics Institute utilized the METTLER TOLEDO in situ CO2 measurement system to study Saccharomyces cerevisiae (yeast) cells in batch cultures in order to accurately and reproducibly determine the growth phase of cultures as a function of CO2.
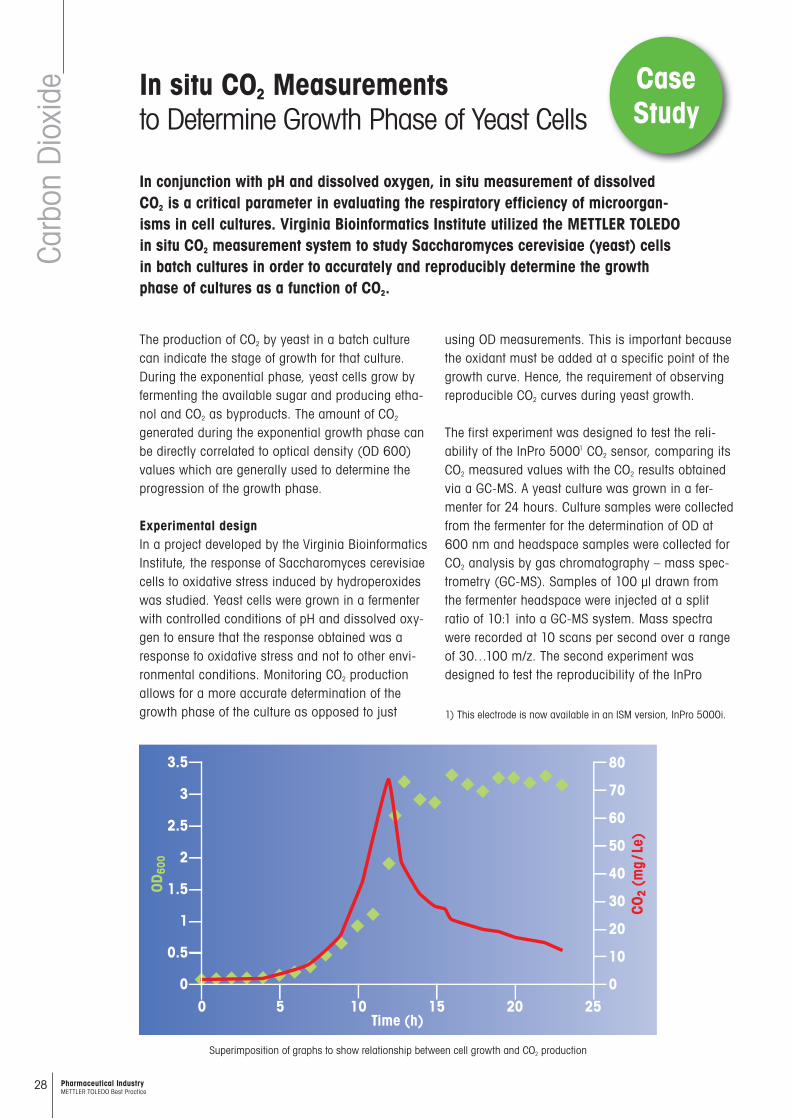
The production of CO2 by yeast in a batch culture can indicate the stage of growth for that culture. During the exponential phase, yeast cells grow by fermenting the available sugar and producing etha-nol and CO2 as byproducts. The amount of CO2 generated during the exponential growth phase can be directly correlated to optical density (OD 600) values which are generally used to determine the progression of the growth phase.
Experimental designIn a project developed by the Virginia Bioinformatics Institute, the response of Saccharomyces cerevisiae cells to oxidative stress induced by hydroperoxides was studied. Yeast cells were grown in a fermenter with controlled conditions of pH and dissolved oxy-gen to ensure that the response obtained was a response to oxidative stress and not to other envi-ronmental conditions. Monitoring CO2 production allows for a more accurate determination of the growth phase of the culture as opposed to just
using OD measurements. This is important because the oxidant must be added at a specific point of the growth curve. Hence, the requirement of observing reproducible CO2 curves during yeast growth.
The first experiment was designed to test the reli-ability of the InPro 50001 CO2 sensor, comparing its CO2 measured values with the CO2 results obtained via a GC-MS. A yeast culture was grown in a fer-menter for 24 hours. Culture samples were collected from the fermenter for the determination of OD at 600 nm and headspace samples were collected for CO2 analysis by gas chromatography – mass spec-trometry (GC-MS). Samples of 100 μl drawn from the fermenter headspace were injected at a split ratio of 10:1 into a GC-MS system. Mass spectra were recorded at 10 scans per second over a range of 30…100 m/z. The second experiment was designed to test the reproducibility of the InPro
1) This electrode is now available in an ISM version, InPro 5000i.
3.5
3
2.5
2
1.5
1
0.5
0
80
70
60
50
40
30
20
10
00 5 10 15 20 25
Time (h)
OD60
0
CO2
(mg
/Le)
Superimposition of graphs to show relationship between cell growth and CO2 production
Carb
on D
ioxi
de Case Study

29Pharmaceutical Industry METTLER TOLEDO Best Practice
5000 CO2 sensor. Two yeast cultures were grown in fermenters for 24 hours. Culture samples were collected for the determination of OD 600, and CO2 measurements were recorded.
Results easier handling and less contamination riskAutumn Clapp, the Fermentation Microbiologist for the Virginia Bioinformatics Institute at Virginia Tech in Blacksburg, VA stated, ”The results obtained from the METTLER TOLEDO InPro 5000 CO2 sensor were much easier to obtain that those from GC-MS. Using the InPro 5000, there is less chance of contamina-tion to the culture as the sensor may be sterilized within the fermenter. In order to take samples from the fermenter for GC-MS analysis, a syringe must be introduced into the system which may introduce contamination. The InPro 5000 CO2 sensor and 5100e transmitter interface also lends to easy
Carb
on D
ioxi
de readouts with no wait time as compared to GC-MS, and there is also no need for extensive data process-ing that is sometimes involved with GC-MS results.”
Benefits of the METTLER TOLEDO in situ CO2 systemThe METTLER TOLEDO in situ CO2 system provides an accurate measure of dissolved carbon dioxide production that is comparable to a GC-MS, but the METTLER TOLEDO unit has several obvious advan-tages. The clearest advantage is that the InPro 5000 sensor is present inside the fermenter and provides real-time measurement data that can be collected instantly, whereas an off-line system creates a lag time in the generation of results. The in situ CO2 sys-tem also is engineered with the highest possible hygienic design which virtually eliminates contami-nation where the off-line systems require user sampling that may compromise the fermentation.
5100e carbon dioxide transmitter with InPro 5000 carbon dioxide sensor.

30 Pharmaceutical Industry METTLER TOLEDO Best Practice
Biomass Monitoringwith Turbidity for Higher Yield
The density of biomass during fermentation is often a key variable, primarily because it provides information on the growth rate and/or product formation defin-ing the status of the fermentation.
Benefits of measuring turbidity in bioreactors:• Specifies abnormal growth conditions • Indicates batch end• Increased yield on each batch• Reduced risk of batch losses due to immediate and continuous monitoring of the cell concentration• Reduced costs due to optimized and exact dosage of nutrients for the cells• Reduced costs due to in-line measurement versus lab sampling
In-line turbidity sensors provide an alternative to traditional off-line OD measurement techniques which are sub-ject to limitations such as poor linearity. Sensors utilizing backscattered NIR light to depict true cell mass deliver a continuous real-time reading throughout the entire fermentation. This way, the activity of the cell culture can be controlled via the regulation of nutrient feed and withdrawal rate of the culture from the bioreactor.
With continuous turbidity measurement, yield will be increased as the process can be kept at peak growth conditions.
OD o
ff–lin
e
Fermentation time
OD in
–lin
e
80
60
40
20
50 10 15 20
0.5
1.5
2.5
Turb
idity

31Pharmaceutical Industry METTLER TOLEDO Best Practice
Improved Fermentation Controlwith Backscattered Light Turbidity Sensor
In biotechnological fermentation processes, real-time information on cell concen-tration is crucial for constant product quality and higher yield. This information is typically used for applying a defined nutrient feed program, for determining the end point of the fermentation, and for early alarming in case of abnormal growth characteristics. The backscattered light absorption methodology has proven to pro-vide a more continuous picture over the whole fermentation time, whereas the latter one suffers from resolution problems, especially at high cell concentrations.
ProcessAerobic fermentation of E. coli bacteria for the produc-tion of recombinant human insulin requires several changes of the nutrient feed program depending on the current overall bacteria concentration. Process data:
• 150 l production fermenter, typical fermentation time 18…20 hours
• Aeration rate: around 100…110 l/min. • Stirrer speed: 300 rpm • Sensor ports: METTLER TOLEDO sockets located at
fermenter bottom to minimize disturbing effect of air bubbles
An in-line OD light absorption probe with an optical path length of 5 mm was installed to follow the con-centration increase. In order to check the feasibility of this probe, in-line readings were compared with clas-sical off-line OD measurements by applying defined sample dilutions, 10 mm cuvettes and a measure-ment wavelength of 660 nm. The comparison of in-line and off-line OD values as shown in Figure 1, clearly demonstrates the inadequate measurement performance of this in-line probe:
Main drawback of the in-line OD light absorption measurement:• The in-line signal reaches its saturation level after 8 to
10 hours whereas the off-line OD values clearly shows that cell concentration is still increasing in this time-frame and fermentation end is reached not until 15 hours
• Consequently, the signal provided by the in-line OD light absorption system is inadequate for this mea-surement task and relying on these data bears the risk of losing yield
Figure 2 confirms this issue by showing the non-linear correlation of in-line and off-line OD data.
0
0.5
1
1.5
2
2.5
0 10 20 30 40 50 60 70 80
OD off–line, 10 mm path length, 660 nm
OD i
n–li
ne,
5 m
m p
ath
leng
th,
NIR
Fig. 2: Correlation diagram in-line OD by light absorption vs. off-line OD: loss of resolution at high concentrations.
Turb
idity
0
10
20
30
40
50
60
70
80
0 5 10 15 20
Fermentation time [h]
OD o
ff–li
ne
0
0.5
1
1.5
2
2.5
OD in
–lin
e
OD off–line OD in–line
Fig. 1: Comparison of in-line and off-line OD values during a typical fermentation run.

32 Pharmaceutical Industry METTLER TOLEDO Best Practice
The METTLER TOLEDO solutionThe METTLER TOLEDO in-line sensor types InPro 8100 and InPro 8200 overcome this resolution prob-lem by using backscattered light technology instead of a light absorption based OD measurement. Fiber optic backscattered light sensors are designed with-out any cutout for an absorption path, and consequently the risk of non-linear response and possible coating of the cutout at high cell concentra-tions is eliminated. The measurement is based on the scattering (reflectance) of NIR light by the cells. The intensity of the backscattered light increases with fermentation time because more scattering “points” with a higher accumulation are close to the light collecting optical fiber as cell concentration increases. Figure 3 clarifies this principle:
In the above described E. coli fermentation, an InPro 8100 was used together with a Trb8300 transmitter. Before installing the sensor into the fermenter, the system was calibrated offline by using a 5-point cali-bration procedure with bacteria suspensions of known concentrations and respectively known OD values (for details on recommended calibration pro-cedure see also 1). In order to check the accuracy of the METTLER TOLEDO system, in-line readings were once again compared with classical off-line OD measurements by applying the same photometric set-up as before. The comparison of in-line and
Fig. 3: Working principle of METTLER TOLEDO fiber optic backscattered light sensors:1: Stainless steel sensor shaft containing light emitting and
receiving fiber optics2: Light scattering particles in a process liquid
optical fibers
optical fiber
1
2
off-line OD values, as shown in Figure 4, clearly shows the convincing and superior performance of backscattered light technology:
• The METTLER TOLEDO in-line measurement follows the offline OD reference measurement over the whole fermentation time. There is no loss of reso-lution at high concentrations.
Advantages at a glanceThe METTLER TOLEDO in-line backscattered light system consisting of an InPro 8100 or InPro 8200 sensor, combined with a Trb 8300 transmitter offers:• Optimized fermentation control and end-point
determination due to a wide linear real-time mea-surement response.
• Simple process adaption due to excellent correla-tion with standard OD laboratory measurements.
• Rapid system setup with intuitive transmitter operation and application tailored calibration routines.
0
10
20
30
40
50
60
70
80
0 5 10 15 20Fermentation time [h]
OD
off–
line
0102030405060708090100
Trb
8300
/ In
Pro
8100
in–l
ine
OD off–line Trb 8300 / InPro 8100 in–line
Fig. 4: Comparison of in–line backscattered light system and off-line CD values during a typical fermentation run.
Figure 5 confirms the excellent linearity between OD off-line values and backscattered light in-ine values
0
10
20
30
40
50
60
70
80
90
100
0 20 40 60 80
OD off–line, 10 mm path length, 660 nm
Trb
8300
/ In
Pro
8100
in–l
ine
Fig. 5: Correlation diagram in-line backscattered light system vs. OD off-line, regression coefficient R2 – 0.9961.
Turb
idity

33Pharmaceutical Industry METTLER TOLEDO Best Practice
Increase Production Rate and Yield by Monitoring Optical Density In-line
Failure to continuously monitor cell mass during fermentation can have a severe effect on product synthesis. In-line OD monitoring helps achieve optimum process control, production rate and yield.
Importance of controlling cell massLiyang Vitasweet Bioengineering Corporation is a manu-facturing, R & D, sales and technological support company based in the Jiangsu province of China. They specialize in the production of pharmaceutical interme-diates, vitamins and amino acids. Bioengineers at Liyang Vitasweet realized that during the fermentation of L-phenylalanine, the key to maximizing production rate and yield was to accurately monitor and control cell mass. Monitoring cell mass off-line meant regularly grabbing a sample of the media, measuring the optical density in the laboratory and then making adjustments to the fermentation process. Due to the time intervals between measurements and the time involved in the measuring task itself, synthesis rate and yield were being adversely affected. What they required was a fast and reliable method of in-line OD measurement.
Precise calibrationLiyang Vitasweet installed a METTLER TOLEDO InPro 8100 optical density sensor and Trb 8300 transmit-ter. But before they could use the measurement system in-line they had to perform accurate calibra-tion of the sensor. During phenylalanine fermentation, several grab samples were taken at different times for range calibration. Purified water and a solution of the basic fermentation material were used as zero-point calibration liquids. The next step was to place the optical density sensor in a seeding tank and compare the in-line OD measurements with the off-line values. At this point, the in-line data fluctuated due to the influence of air bubbles caused by the stirring of the media. However, once this was compensated for, the results showed a precise correlation with off-line measurements.
Turb
idity Case
Study
34 Pharmaceutical Industry METTLER TOLEDO Best Practice
InPro 8100 turbidity sensor Trb 8300 turbidity transmitter
Turb
idity
Real-time OD measurementThe measuring point was then installed in the fer-mentation tank, where further testing showed in-line measurements matched those taken off-line. Now the in-line data could replace the off-line measuring of OD. Lu Feng of Liyang Vitasweet Bioengineering said, “Real-time data collection and analysis allows us to obtain information on the nutrient consumption of unit cell mass and product formation, based on which adjustments are made to the fermentation pro-cess so as to control the cell density and to improve
the conversion rate. This can shorten the fermenta-tion period and reduce energy consumption.”
Fast reaction to process driftImproved product yield and reduced energy consump-tion have not been the only benefits for Liyang Vitasweet; the METTLER TOLEDO optical density measuring system allows their bioengineers to react instantly to out-of-spec drifts in cell mass. Further, the switch from an off-line to an in-line system frees time for the bioengineers, allow-ing them to concentrate on other tasks.

35Pharmaceutical Industry METTLER TOLEDO Best Practice
Not
es
For more information
Mettler-Toledo AGProcess AnalyticsIm Hackacker 10CH-8902 UrdorfTel. +41 44 729 62 11Fax +41 44 729 66 36
The METTLER TOLEDO Process Analytics website for the pharmaceutical industry is packed with information on how our in-line measurement solu-tions improve process reliability, increase production yield and reduce operating costs.
Visit our Pharmaceutical Competence Center to: • Discover our extensive portfolio of sensors and transmitters. • Download white papers and application notes, watch videos and webinars. • Find out how intelligent measurement solutions can prevent batch losses and simplify
sensor documentation.
In-line Analytics Website Dedicated to the Pharmaceutical Industry
www.mt.com/pro_pharma


