BEST PRACTICES FOR DEVELOPING THE ENGINEER’S ESTIMATE FINAL REPORT VOLUME I SCDOT Research Project 661 FHWA-SC-07-03 (Volume I) Karl Edward Niedzwecki And Lansford C. Bell Department of Civil Engineering Clemson University June 2007
Transcript
BEST PRACTICES FOR DEVELOPING THE ENGINEER’S ESTIMATE
FINAL REPORT
VOLUME I
SCDOT Research Project 661 FHWA-SC-07-03 (Volume I)
Karl Edward Niedzwecki And
Lansford C. Bell
Department of Civil Engineering Clemson University
June 2007
ABSTRACT The research project “Best Practices for Developing the Engineering Estimate”
was executed by Clemson University on behalf of the South Carolina Department of
Transportation (SCDOT). The primary objective of this research project was to
investigate the strengths and weaknesses of two types of estimating methods being
utilized today by state department of transportations (DOT) nationwide. These two types
of estimating methods are the unit cost line item approach, which the SCDOT utilizes,
and the cost-based approach. The unit cost line item approach uses a formulated line
item estimate price, based on historical data, multiplied by the anticipated quantity to
reach a final unit price. Whereas, the cost-based estimating approach takes into account
production rates, crew compositions, fuel cost adjustments, haul distances, and other
factors before applying a cost value to a line item estimate.
This research report identifies accuracy obtained, resources expended, and
methodologies utilized when implementing either type of estimating approach.
Information on both estimating types was found by the research team by reviewing
literature on this topic, making site visits to other state DOT’s, and distributing a survey
questionnaire. This was done so the research team could gather enough evidence in order
to suggest to the SCDOT if a change was needed in their estimating methodologies. The
responses to the survey questionnaire from all responding states are included in this
report as well. The recommendation to the SCDOT is that there is no compelling
evidence to suggest that SCDOT adopt a cost-based/combination estimating approach
when preparing the engineer’s estimate.
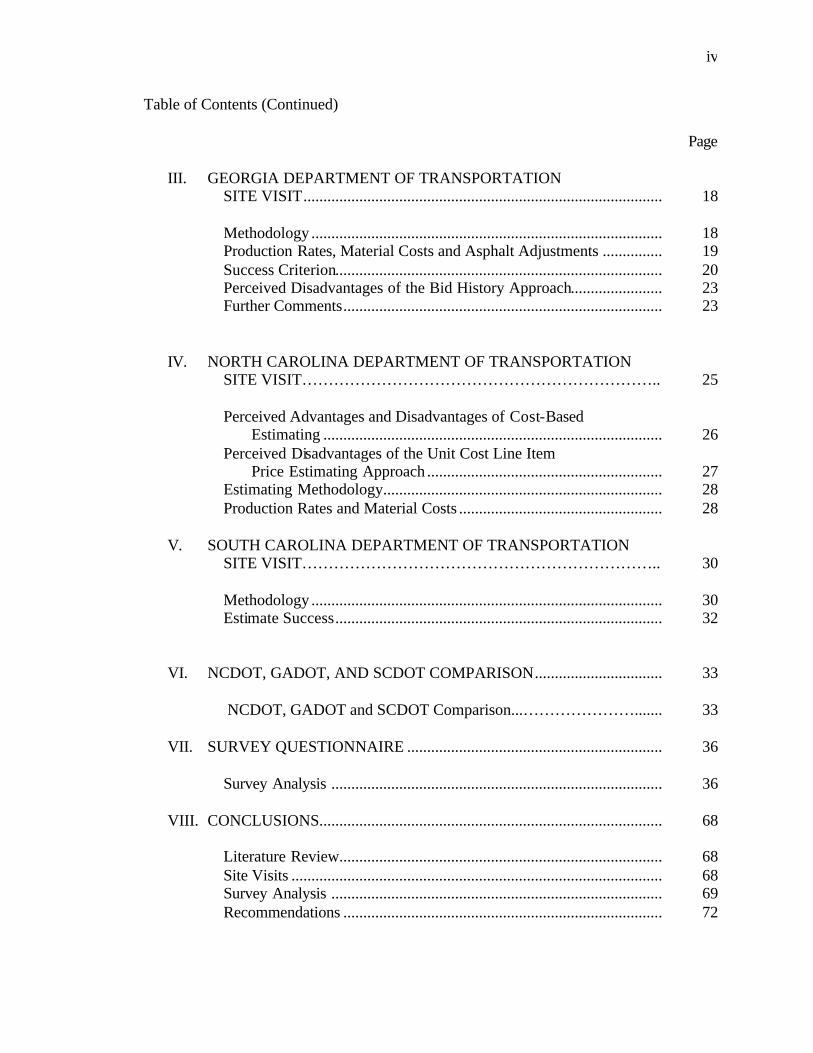
TABLE OF CONTENTS
Page
TITLE PAGE........................................................................................................... i ABSTRACT............................................................................................................. ii LIST OF TABLES………………………………………………………………… vi LIST OF FIGURES ................................................................................................. vii CHAPTER
I. INTRODUCTION………………………………………………………. 1
Problem Statement ............................................................................... 2 Objectives and Scope of Research....................................................... 3 Research Methodology ........................................................................ 4 Research Steering Committee .............................................................. 5
II. LITERATURE REVIEW ........................................................................ 6
Transportation Research Board Website Search.................................. 6 TRISS Website Search......................................................................... 10 SCDOT Standard Specifications .......................................................... 10 Research Previously Executed by Clemson University....................... 12 Research Previously Executed by Auburn University......................... 13 FHWA Publications ............................................................................. 14 AACE Publications .............................................................................. 15 AASHTO Publications ......................................................................... 16 Fuel and Asphalt Trends ...................................................................... 16
iv
Table of Contents (Continued)
Page
III. GEORGIA DEPARTMENT OF TRANSPORTATION SITE VISIT.......................................................................................... 18
Methodology ........................................................................................ 18 Production Rates, Material Costs and Asphalt Adjustments ............... 19 Success Criterion.................................................................................. 20 Perceived Disadvantages of the Bid History Approach....................... 23 Further Comments................................................................................ 23
IV. NORTH CAROLINA DEPARTMENT OF TRANSPORTATION SITE VISIT………………………………………………………….. 25
Perceived Advantages and Disadvantages of Cost-Based Estimating ..................................................................................... 26 Perceived Disadvantages of the Unit Cost Line Item Price Estimating Approach ........................................................... 27 Estimating Methodology...................................................................... 28 Production Rates and Material Costs ................................................... 28
V. SOUTH CAROLINA DEPARTMENT OF TRANSPORTATION SITE VISIT………………………………………………………….. 30
VI. NCDOT, GADOT, AND SCDOT COMPARISON................................ 33
NCDOT, GADOT and SCDOT Comparison...…………………....... 33
VII. SURVEY QUESTIONNAIRE ................................................................ 36
Survey Analysis ................................................................................... 36 VIII. CONCLUSIONS...................................................................................... 68
Literature Review................................................................................. 68 Site Visits ............................................................................................. 68 Survey Analysis ................................................................................... 69 Recommendations ................................................................................ 72
v
Table of Contents (Continued)
Page APPENDICES ......................................................................................................... 74 A. Oman Bid Tabs Professional Plus ............................................................ 75 B. Bid Comparison Graphs........................................................................... 77 C. Site Visit Questionnaire ........................................................................... 79 D. Engineer’s Estimate Questionnaire .......................................................... 81 E. Adjustment Index..................................................................................... 89 F. Excerpt from NDOTs’ 2001 Standard Specifications………………….. 91 BIBLIOGRAPHY.................................................................................................... 99
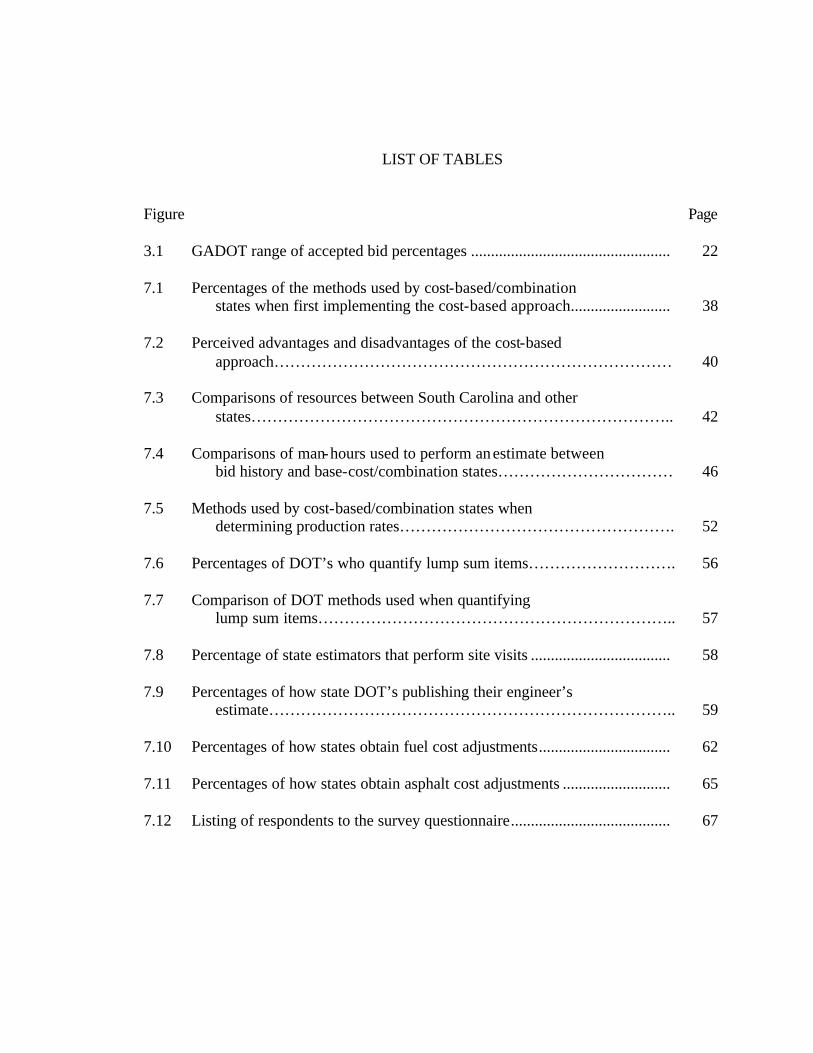
LIST OF TABLES
Figure Page
3.1 GADOT range of accepted bid percentages .................................................. 22 7.1 Percentages of the methods used by cost-based/combination states when first implementing the cost-based approach......................... 38 7.2 Perceived advantages and disadvantages of the cost-based approach………………………………………………………………… 40 7.3 Comparisons of resources between South Carolina and other states…………………………………………………………………….. 42
7.4 Comparisons of man-hours used to perform an estimate between bid history and base-cost/combination states…………………………… 46
7.5 Methods used by cost-based/combination states when determining production rates……………………………………………. 52
7.6 Percentages of DOT’s who quantify lump sum items………………………. 56
7.7 Comparison of DOT methods used when quantifying lump sum items………………………………………………………….. 57
7.8 Percentage of state estimators that perform site visits ................................... 58
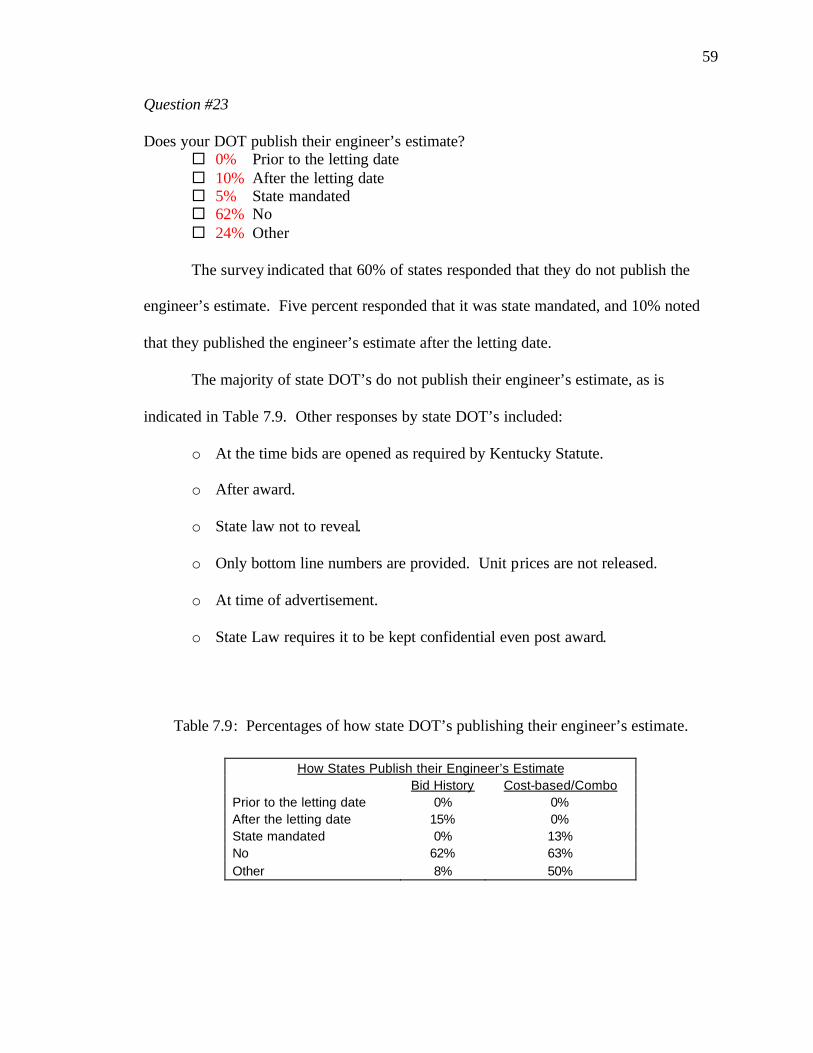
7.9 Percentages of how state DOT’s publishing their engineer’s estimate………………………………………………………………….. 59
7.10 Percentages of how states obtain fuel cost adjustments................................. 62
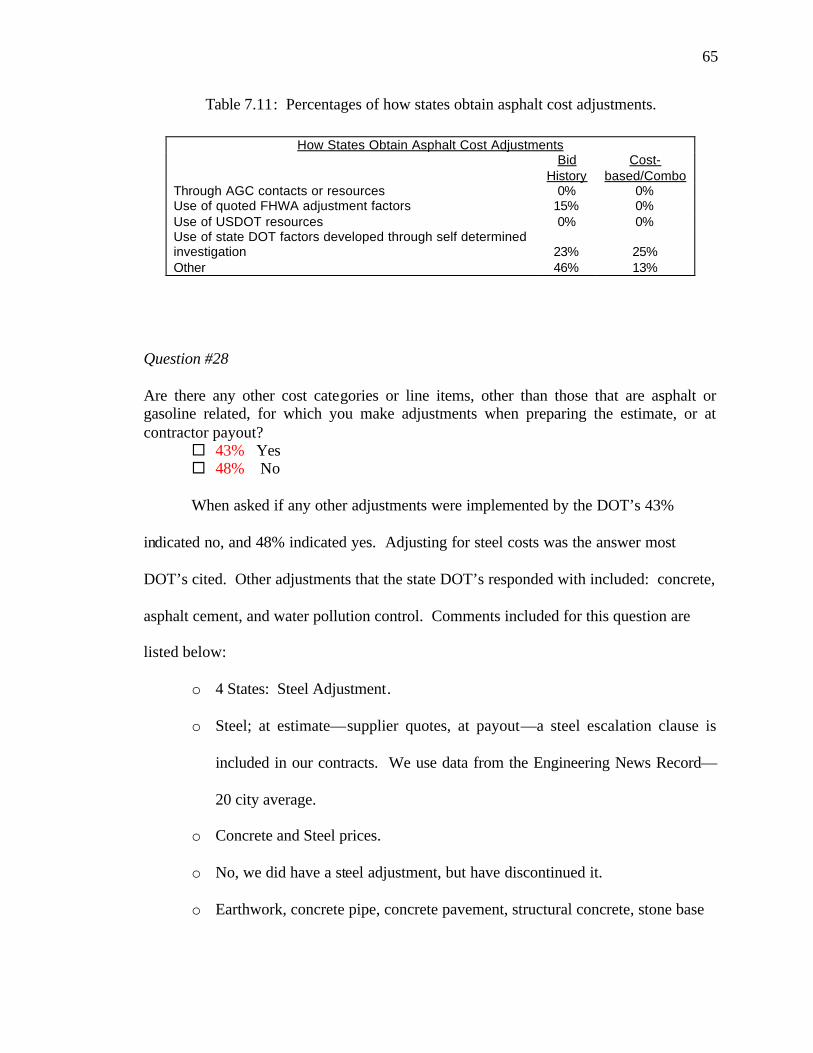
7.11 Percentages of how states obtain asphalt cost adjustments ........................... 65
7.12 Listing of respondents to the survey questionnaire........................................ 67
7.1 Comparison of average lettings per year........................................................ 43
7.2 Comparisons of average monthly estimates .................................................. 45
7.3 States DOT’s where the low bid falls within 10% of the engineer’s estimate 50-75 % of the time……………………………….. 49
7.4 States DOT’s where the low bid falls within 10% of the engineer’s estimate 40-50% of the time................................................... 50
CHAPTER I
INTRODUCTION
When state estimators formulate an engineer’s estimate for transportation projects
they may choose from several different approaches to estimate the cost of a specific
project. The state DOT’s surveyed in this study use two main types of estimating
practices The first approach is called the unit cost line item approach. This approach
uses a formulated line item estimate price multiplied by the anticipated quantity to get the
final unit price. The estimated price used for the line item is often comprised of an
average unit price based upon historical bid data. The remaining line items estimated for
that particular project are then summed to obtain the final engineer’s estimate. This
approach is very useful since it incorporates historical information when determining
common line items that show up on most DOT estimates.
The second common type of estimating practice is called the cost-based
estimating approach. The cost-based estimating approach is nearly identical to the
contractor’s approach to estimating. This approach defines the labor, material, and
equipment costs by taking into account location, production rates, crew sizes, haul times,
equipment rates, and other information sources before applying a cost value to a line
item. Questions have arisen as to the cost-effectiveness and labor intensiveness of this
approach. Practitioner’s expressed various opinions regarding these questions (which
will be discussed in this study), but no absolutes as apparently most states utilize a
combination of both approaches. In particular, the South Carolina Department of
2
Transportation (SCDOT) currently implements a unit cost line item approach when
developing the engineer’s estimate, but wanted to investigate the approach taken by other
states that utilize the cost-based method. This research project was initiated to gather
information from various DOT’s in order to explore and to compare the strengths and
weakness of these two estimating methods.
Problem Statement
Currently SCDOT implements a unit cost line item approach when developing
their engineer’s estimate. The primary advantage of this approach is that it requires
minimal manpower to compute and is believed to be reasonably accurate. However,
there are three basic concerns, or perhaps disadvantages, to the SCDOT unit cost line
item estimating approach. The first concern is that unit cost line item estimating relies on
historical bid data, and this data includes unbalanced unit prices. The second issue of
concern is that unit prices may differ considerably with the quantity of materials required.
The final concern with this approach is that the unit prices in the historical database may
have been influenced by economic factors that are no longer applicable. Because of these
potential disadvantages of using the unit cost line item approach, the SCDOT wanted to
explore the cost-based approach to estimating to discover if the potential benefits of a
cost-based approach outweigh the perceived cost issues. It is believed that the primary
disadvantage of the cost-based approach is that implementation is very manpower
intensive. However, this problem could be offset by the possible advantages of this
approach that include higher estimate accuracy and a better legal ground when rejecting
bids that are more than the engineer’s estimate. To discover new information, a survey of
state DOT’s was necessary to ascertain first what resources were being expended by the
3
states that fe lt that they were successful when developing the ir engineer’s estimate, and
secondly to determine from this new first hand information if any adjustments to
SCDOT’s current practice would improve their estimating procedures.
Objectives and Scope of Research
The primary objective for the research project, "Best Practices for Developing the
Engineer's Estimate,” was to investigate the general advantages and disadvantages of the
unit cost line item estimating approach as compared to the cost-based estimating
approach and to try and assess the accuracy of each method based upon the data from a
survey of DOT’s. The secondary objective was to develop specific “best practices” for
improving the accuracy of the SCDOT unit cost approach to developing the engineer’s
estimate based upon a statistical comparison of data provided by SCDOT. This would
include examining relationships between the costs of fuel and asphalt bid line items,
including the use of subcategories for bid line items such as clearing and grubbing.
Alternatives to the bid letting process will be examined including the stipulation of given
or maximum lump sum amount for line items such as mobilization, and guidelines for
applying engineering judgment and/or database cost adjustment indices to the estimating
process will be developed. The research reported herein will focus on the primary
objective, and provides the insight that will be reported in a subsequent study that will
focus on the second research objective. The emphasis of this research study was to
develop and utilize a survey targeting state DOT’s nationwide, and to analyze the
information received to form conclusions about the two types of estimating methods.
4
Research Methodology
This research study involved several integrated and ongoing tasks. These tasks
included an extensive literature review, site visits to the Georgia (GADOT) and North
Carolina (NCDOT) Departments of Transportation, development and distribution of a
survey questionnaire, and the interpretation of this data.
The literature review was designed to probe detailed resources that dealt with
defining the engineer’s estimate, comparing and contrasting alternative approaches to
estimate generation, and identifying previous research endeavors relating to the research
objectives. Most of this effort focused upon pursuing sources suggested by SCDOT over
the internet. As part of this effort the research team attended the annual Transportation
Estimator’s Association Conference which was he ld in Daytona Beach, Florida. This
conference provided an exceptional opportunity for two graduate students to make
contacts with other state DOT’s estimators, and gather perspective and suggestions on
related literature.
The SCDOT suggested that site visits be pursued to the states that bordered the
state of South Carolina because it was believed that both the GADOT and the NCDOT
utilized a cost-based estimating approach. The research team contacted both states, and
executed site visits. These site visits helped gain insight into the approaches of these
DOT’s and their perspective on the use of cost-based estimating methodology.
The SCDOT was instrumental in motivating the development of a new survey to
be sent to all state departments of transportation in the United States. This research study
documents this effort and the responses obtained. The survey was focused to gain a
better perspective into what methods and basic assumptions other states were utilizing
5
and to assess the variations in their approaches to developing engineering estimates.
Their responses were grouped together in order to see whether any correlations existed
between the two estimating approaches, their methodologies, resources expended, and
success rate.
Research Steering Committee
Jim Frick formed and led a Research Steering Committee composed of engineers
from the SCDOT. This group provided direction and feedback to the research team on a
regular basis. The principal investigator, Dr. Lansford Bell, was instrumental to the
success of the progress reports and survey development. Progress reports were
forwarded quarterly to the research committee to update the committee on the research
team’s progress. The Research Steering Committee and the research team met every
three months to discuss recent progress and to decide a path forward for future progress
reports. The Steering Committee also helped critique the research team’s methodology
and also helped distribute the survey questionnaire.
CHAPTER II
LITERATURE REVIEW
A comprehensive literature search was executed using the sources cited in the
research proposal to the South Carolina Department of Transportation (SCDOT). These
included the proceedings of the Transportation Research Board (TRB), the
Transportation Research Information Services (TRIS), the South Carolina Department of
Transportation (SCDOT), the Federal Highway Administration (FHWA), the Association
for Advancement of Cost Engineering (AACE), the American Association of State
Highway and Transportation Officials (AASHTO), the Auburn University Archives, and
Clemson University Library databases. The purpose of this search was to find
background information that would help in defining the scope of the project, and to better
understand the workings of the engineer’s estimate, types of estimates, and price trends in
oil and asphalt in today’s marketplace.
Transportation Research Board Website Search
This website was first consulted for information on the best practices for an
engineering estimate and fue l and asphalt cost trends and relationships. Several
keywords were used: engineer’s estimate, cost estimating, unit price estimates,
estimators, estimating methods, cost estimators, the engineer’s cost estimate, fuel and
asphalt trends. Most of these keywords had several links, but many were not related to
the project at hand.
7
Many papers, reports, and research projects were discovered when investigating
this website, but very few actually related to the overall topic. Some of these articles
included topics such as the cost of estimating vehicles on the road, bridge management
(13), cost estimating for underground transit, and others. One article discussed that in
the 1980’s the FHWA allowed state departments of transportation freedom to investigate
innovative contracting approaches (12).
An article identified as a result of this search was NCHRP Synthesis 331,
Statewide Highway Letting Program Management, A Synthesis of Highway Practice by
Stuart Anderson, TTI and Byron Blaschke, College Station, Texas. This report
summarizes available information on statewide highway letting programs, which are
defined as a set of highway projects in advanced stages of design that have a target date
for construction bid. This report contains information from three different sources: a
review of the literature pertaining to letting program management conducted with a
specific focus on processes and techniques, a survey questionnaire, and selected
interviews with five state highway agencies (SHAs) that includes Arkansas, Connecticut,
Kansas, New York, and Texas (1).
The NCHRP research survey included questions on contract award considerations
including criteria for rejecting bids, analyzing bids that appear unbalanced, identifying
collusion, and determining bid responsiveness (1). This report illustrates different states’
standards for accepting or rejecting bids. This report states that most SHAs will award
the bid to the lowest responsive and responsible bidder. Some 70% of the SHAs claimed
that they may not always award the contract the lowest bidder. The selected following
approaches were illustrated in NCHRP Synthesis 331.
8
Maryland’s DOT approach:
Bids 10% over or 15% under the engineer’s estimate require a written
justification, which must be approved and signed by the procurement officer. If
the bid is substantially above the 10% allowance, the design office may write a
justification letter, requesting all bids be rejected. The letter, including a detailed
explanation of the discrepancy, must be approved by the Assistant Attorney
General’s Office and the procurement officer. When a bid is rejected, notification
is distributed to all bidders.
Kansas’s DOT approach:
Kansas does not automatically reject bids that are over the estimate. If a bid is
over the estimate we handle the review on a case by case basis. There may be
cases where the estimate was too low due to conditions that were not known at the
time the estimate was prepared. There may be other factors. Kansas DOT looks at
the bids and if we decide it is to the state’s advantage to award rather than reject
and relet, we will do that. One bid does not cause that bid to be automatically
rejected. Since we have the estimate, we can use that for comparison of the bid.
Texas’s DOT approach:
Texas’s DOT has developed a computer program that analyzes certain items in
the bid to determine if unbalancing may have occurred. If the program indicates
that unbalancing did occur, further analysis is done using [the computer program]
Primavera. The schedule deve loped by the department to estimate the job is used
with the contractor’s unit bid prices. The net present value of the cash flows is
9
calculated. If the cash flows reveal that the second bidder may be lower, we give
the low bidder the chance to present the ir case using their construction schedule.
If the cash flows still favor the second bidder, the bid is rejected.
Ohio’s DOT approach is following laws that state that the DOT will not award a
bid if it is 5% over the engineer’s estimate (1).
When the bids appear to be unbalanced most states conduct a bid line item
analysis. New York and Pennsylvania use manual calculations when analyzing
unbalanced bids. Maryland’s DOT uses this approach (1):
System). This software is used to create a graph and listing of the bids compared
to the engineer’s estimate and to each other. The Maryland DOT can also utilize
the system to create reports on past bidding history, market prices, price
differential in geographical locations, etc. Maryland has a BAMS (Bid Analysis
Management System) team, which is made up of individuals from several
disciplines, such as, [the] Construction, Bridge, Highway, Design, and
Information Technology divisions. The team is to meet on a regular basis to
review the graph and listing of pertinent Maryland projects. In addition to the
team’s review, the administering design office also reviews the same materials.
Recommendations are made and documented as needed.
This report illustrates diversity in the fact that some states allow certain
percentage criteria above or below the engineer’s estimate that bids must meet or the bids
10
can be rejected immediately. The report also suggests that some states will work with the
contractors to find why their bids are either too low or too high. Other states will just
reject the bids and readvertise.
TRIS Website Search
The TRIS search could not be considered successful. Information was found, but
it really does not relate to the overall objectives of the research project. The keywords
used in this search were: engineer’s estimate, unit price estimating, construction cost
estimating, cost estimating, estimating methods, cost estimators, and fuel and asphalt
trends or relationships. Most articles found on this webpage were linked to articles
located on other databases such as the TRB.
SCDOT Standard Specifications
The SCDOT Standard Specifications for Highway Construction (2) discusses the
bidding process by stating that bidding requirements for construction contracts over
$10,000 will be advertised for 3 weeks in at least one newspaper. SCDOT reserves the
right to advertise for longer if it is deemed necessary. The basic component of the
advertisement states the time and place where bids will be received as well as a
description of the work being bid on. Other basic facts in the advertisement include the
cost of plans and proposals with prequalification requirements.
Under prequalification requirements all bidders must first be prequalified through
SCDOT before they are allowed to submit a bid. Previous performance with contractors
who have worked with SCDOT before will be reported to the Director of Construction.
Also included are the contents of proposal forms that show the specific quantities of work
11
to be performed and the time allotted to finish. The dates and the times of the opening
bid are also available. Other topics include the pre-bid conference date and times,
proposal guarantees stating that a bid bond is required to 5% of the submitted bid.
Irregular proposals are also discussed, especially stating that unbalanced bids will be
rejected. This section also states that if collusion is discovered among the contractors
that those contractors are automatically disqualified.
Section 103 includes the award and execution of the contract. This section states
that all bids will be based on bid unit prices. The award of the contract will go to the
lowest responsible and qualified bidder. The successful bidder will be notified within
thirty days by mail. The remainder of the section goes into bond requirements and
insurance and proposal discussions.
Continuing on this subject in the 2004 Code of Regulations State Register
Volume 28, Issue 9, Chapter 63 are regulations for the Department of Highway and
Public Transportation. Article 8 is for the Disadvantaged Business Enterprise Program
which has references to the engineer’s estimate. Two sections that deal with the current
research topic, Section 63-711 and Section 63-712.
Section 63-711 explains the bid evaluation. The bid evaluation states that if the
lowest responsible bidder is within 10 % of the engineer’s estimate, that contractor will
receive the bid. It also states that preference will be given to a responsible South
Carolina contractor over an out of state bid, if it does not exceed the out of state bid by
2.5%. If the department does not wish to award a bid, then the department reserves the
right to readvertise the bid.
12
Section 63-712 discusses negotiations of low bids. This section basically says
that if the lowest responsible bidder’s bid is over 10% of the engineer’s estimate, the
department will meet with the bidder to determine why the bid is over and maybe work
with the contractor to make the bid within 10%. Also any bids 30% over the engineer’s
estimate will not be considered unless there was an error in the calculations (2).
Research Previously Executed by Clemson University
This is a summary of a previous project by Dr. Bell and Charles Skipper titled
Long Range Program Cost Estimating Methodology for SCDOT, July 2003.
The South Carolina Department of Transportation had in the past used a
conceptual or “rule of thumb” approach for estimating the cost of highway improvement
projects. The recently completed research executed by Clemson University produced a
cost estimating model that is based on historical bid line item data for 58 construction
projects that were let to contract between January 1996 and April 2000.
Widening, interstate, and interchange projects from all seven state districts were
included in the study. The model is based on historical line item bid data that were
entered into a 336 page spreadsheet database that consisted of approximately 17,000 data
entries. The data were analyzed and eventually transformed into parametric equations,
cost averages and ranges, and estimating guidelines. The model provides estimating
guidance for nineteen cost categories: clearing and grubbing, remove and dispose
asphalt, remove and dispose concrete, remove and dispose bridges, excavation, mucking,
asphalt pavement, concrete pavement, painting, control of intersections, bridge
construction, storm drainage, curb and gutter, sidewalks, guardrail, underdrain, erosion
control, move items, and mobilization and traffic control.
13
The model was formulated as an Excel spreadsheet. Basic model input includes
project lane miles. For most of the nineteen cost categories the user is given a selection
of 4 values (none, low, medium, high) from which to choose a data entry, with a
description of what constitutes low, medium, and high. These suggested values were
determined from a regression analysis of the bid line item data (3).
Research Previously Executed by Auburn University
Another information source included a thesis written by Phillip Moon at Auburn
University in 1972 titled “An Introductory Analysis of the Behavior of the Alabama
Highway Industry.” The purpose of this thesis was to determine how to minimize
instability in the construction industry. One of the most significant instabilities identified
was the fluctuation in the number of projects let to bid over a given period of time. The
author attempts to explain the reasons for the “feast or famine” concept in the
construction industry, and how to eliminate it. Implementing a long range approach to
letting a stable number of projects per a year was identified as a possible solution to
decreasing instability. The author also produced a function for Alabama that helps give
an upper bound on the number of projects to let at certain times based on a given level of
capital and labor.
This thesis includes unit price trends in bids for the years from 1950-1970 in
Alabama. This research examined cost trends for different types of materials and the
number of jobs let. Another trend examined was the number of available projects to the
amount of bond financing allowed for construction. Other factors examined were whether
the project was a state, federal-aid, or interstate project. The interstate bid prices were
significantly higher than the federal-aid or state projects. The author also examined bid
14
prices in different counties to determine trends. There was a definite difference in the bid
prices in different counties. The more affluent counties had higher bid prices than the
smaller counties. This factor had more impact on bid price than location or terrain.
One conclusion of the thesis’ author was that when the number of projects let to
contract increases, bid unit prices increase. Conversely, when fewer projects are let to
contract, bid prices lower. The author suggests letting the same volume of work
continuously throughout the year. A major problem is that during the winter month’s
projects seemingly always decrease. The author counters saying that this would allow
more time for pre-construction needs like steel fabrication, extended planning, etc. The
author concludes that more research would have to be performed to determine whether
the costs of winter work versus the costs of continuous letting of projects would be more
beneficial. The author makes the claim that future estimates for construction should
include project location, project type, and time of year.
FHWA Publications
The Federal Highway Administration (FHWA) provides bidding guidelines in a
document entitled “Guidelines on Preparing Engineer’s Estimate, Bid Reviews and
Evaluation.” This document outlines the options an engineer can use when making an
estimate. It states that the engineer’s estimate is a crucial part of the bidding process
because it dictates how much money will be allocated for projects, and everything else
will be based off this initial engineer’s estimate. Three types of estimating methods are
discussed: actual cost approach, historical data approach, and combination approach.
Also discussed are the reasons for the engineer’s estimate to remain confidential, and
why the accuracy of an engineer’s estimate is important. The FHWA states that the
15
engineer’s estimate must be within plus or minus ten percent of the low bid fifty percent
of the time.
This document discusses the bid analysis and contract award procedures that the
states should follow. Assessing competition, considering re-advertisement, comparison
of bid prices, and unbalancing of unit bid prices are included under this topic. The
FHWA considers the competition excellent if there are six bids within twenty percent of
the low bid. Considering re-advertisement may be a good choice if there are no
appropriately priced bids because the public interest is always put first. Bid prices should
be compared to determine if the contractors are submitting consistent prices on the
different projects that they bid. Unbalancing of unit prices should be examined (4).
AACE Publications
A search using the Association for the Advancement of Cost Engineering
(AACE) website identified a number of relevant publications. Most of these articles
contained information about the cost estimating procedures, but not specifically the
engineer’s estimate used by public agencies. The articles consisted of estimating
technologies including neural networks for cost estimation, cost control articles, defining
the scope of estimating procedures, how labor and project locations should be put into a
cost estimate, and tools used for cost estimating. These are all good articles, but they do
not specifically reference the engineer’s estimate or the types of estimating procedures
used.
16
AASHTO Publications
A search of the American Association of State Highway and Transportation
Officials (AASHTO) website produced some articles pertaining to the research project.
One of the publications, Project Cost Estimating, A Synthesis of Highway Practice,
related to the research project and discussed cost estimating (5). It examines how several
states develop the bid. The publication discusses why states need a strategic approach to
estimating, stating that all projects are variable. It also states that there are several stages
to the bid with conceptual estimating being the first step; basically it goes through an
example and states where improvements in the system are needed in estimating. It claims
that in order for the DOT’s to be more productive with their resources they need to have
specific written guidelines for the engineer to follow when developing the engineer’s
estimate.
Other articles were found through the AASHTO website linking to the TEA
website. This site had documents written by estimating engineers in different DOT’s
around the country and gives tips on how to get better estimates.
Fuel and Asphalt Trends
Articles were identified relating to the present prices of fuel and how it affects the
prices of asphalt. Some articles tracked the increase in asphalt over each decade. There
were websites that included the prices of unleaded and diesel gas over the past year. Also
there were sites that showed that construction must go on, and how material price
increases have affected producer profits and decisions around the globe (6). Basically,
projects tha t were bid just a couple of years ago are seeing their profit disappear due to
the unexpected rise in gasoline and asphalt prices. Maintenance of current equipment is
17
essential in lowering costs in the asphalt industry because with costs rising it is harder to
purchase new equipment (6). Some DOT sites show the fuel prices for the past months
and have the same thing for asphalt prices. The second research objective includes all of
this data and will be addressed in a separate report.
CHAPTER III
GEORGIA DEPARTMENT OF TRANSPORTATION
SITE VISIT
During a meeting with Mr. George Bradfield and Mr. Wade Harris in Atlanta, GA
on Monday, January 30, 2006, many questions were posed pertaining to why the Georgia
Department of Transportation (GADOT) prefers to use a cost-based estimating approach
and how it has improved their letting process. Many explanations were given, but the
main driving force behind why the GADOT utilizes a cost-based approach was the fact
that they were experiencing problems with contractors unbalancing bids with mistaken
quantities and production costs. GADOT wanted to implement an estimating approach
that would let the industry know they were carefully monitoring the bid letting process.
According to the GADOT, cost-based estimating emulates the procedures contractors use
when estimating, which in turn helps to increase accuracy and reduce re- lets. The
GADOT foresees a learning curve of anywhere between six months to three years in
order to fully implement a cost-based approach, but GADOT’s personnel believe that the
benefits of a cost-based estimating system greatly outweigh the use of a unit cost line
item estimating approach.
Methodology
The GADOT cost-based estimating methodology is straightforward and provides
GADOT with an accurate engineer’s estimate to use as a benchmark during the letting
process. GADOT approaches cost-based estimating in a similar manner to contractors by
19
first defining labor, material, and equipment costs for items they are pricing. GADOT
believes that defining these costs and having accurate production rate costs will increase
the accuracy of the engineer’s estimate. GADOT generally adheres to the 80-20 rule
when estimating projects, stating that eighty percent of the cost can be captured in twenty
percent of the bid line items. GADOT uses a cost-based estimating method for the 20%,
which make up 80% of the overall bid cost. For the remaining 80% of the items,
GADOT utilizes a unit cost line item approach. Once the basic engineer’s estimate is
developed, using the 80-20 rule, the costs for the labor, materials, and equipment and
other factors must be finalized. To finalize these costs and production rates accordingly,
the GADOT specifically examines jobsite conditions, historical job production rates, and
special restrictions included in the project specifications when creating the engineer’s
estimate. These factors are then collected and compared to similar projects to check for
consistency among the line item estimates. Once these factors are accounted for, the
GADOT includes the costs for overhead, profit, bonds, insurance, and contingency
factors. The GADOT believes that defining these costs is essential to the accuracy of the
overall engineer’s estimate.
Production Rates, Material Costs and Asphalt Adjustments
The GADOT believes that maintaining current production rate records helps
increase the accuracy of the engineer’s estimate. Investigating contractor records from
previously completed federal projects is the primary method the GADOT utilizes when
determining production rates. Production rates are kept up to date by continually
researching these records which GADOT believes can be a big advantage in increasing
the accuracy of the engineer’s estimate. GADOT also investigates cycle times when
20
formulating production rates as well. This information assis ts GADOT in estimating
production rates involved with transportation cycles and cyclical labor.
GADOT receives material and equipment cost quotes from rental rate blue books,
the Caterpillar Performance Handbook, and from telephone inquiries to manufacturers.
The GADOT’s main concern when calling the manufacturers directly is that the
manufacturers may quote higher prices to the DOT and then provide lower costs to the
contractor’s. GADOT usually applies a 20% discount rate to the quoted price to account
for these discounts when formulating an estimate to account for such costs.
For asphalt adjustments, GADOT generally makes telephone inquiries and talks
with distributors when obtaining pricing data. If there are still questions about the
validity of the asphalt quotes, GADOT will call other states to make sure the quotes are
acceptable. Once the asphalt adjustments are established, the estimating of line items that
include asphalt can be adjusted properly. Asphalt adjustments will be discussed further
in a second report by Clemson University.
Success Criterion
GADOT does not measure the effectiveness or success of their engineer’s
estimate by comparing the accuracy of the engineers estimate to the low bid. The
GADOT measures estimate effectiveness by examining the total percentages of bids that
fall above or below the engineer’s estimate depending on the number of bidding parties.
GADOT defines success as the ability to fit their data to the curve this method produces.
Using a figure like Figure 3.1 or Appendix B, GADOT can quickly examine the bid
percentages over or under the engineer’s estimate and determine if it is an exorbitant
amount. If the bids are too high, GADOT will re- let the projects. Figure 3.1 illustrates
21
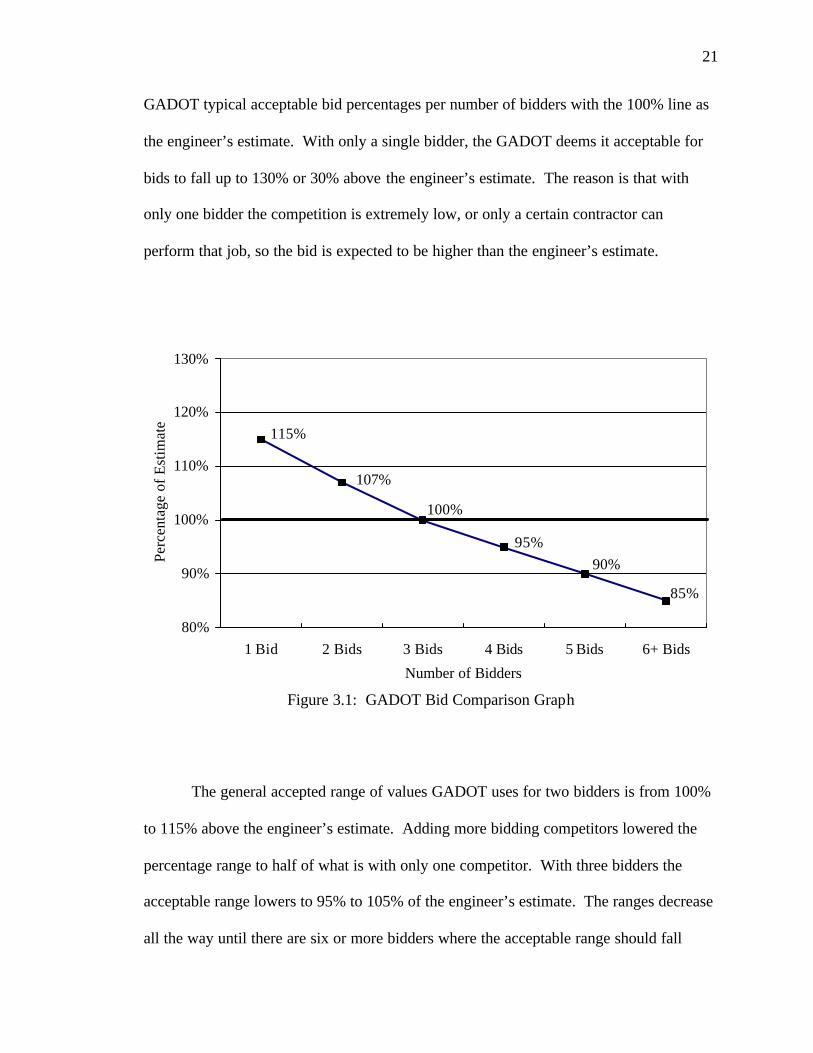
GADOT typical acceptable bid percentages per number of bidders with the 100% line as
the engineer’s estimate. With only a single bidder, the GADOT deems it acceptable for
bids to fall up to 130% or 30% above the engineer’s estimate. The reason is that with
only one bidder the competition is extremely low, or only a certain contractor can
perform that job, so the bid is expected to be higher than the engineer’s estimate.
Figure 3.1: GADOT Bid Comparison Graph
The general accepted range of values GADOT uses for two bidders is from 100%
to 115% above the engineer’s estimate. Adding more bidding competitors lowered the
percentage range to half of what is with only one competitor. With three bidders the
acceptable range lowers to 95% to 105% of the engineer’s estimate. The ranges decrease
all the way until there are six or more bidders where the acceptable range should fall
90%95%
100%
115%
107%
85%
80%
90%
100%
110%
120%
130%
1 Bid 2 Bids 3 Bids 4 Bids 5 Bids 6+ Bids
Number of Bidders
Perc
enta
ge o
f Est
imat
e
22
within 80% to 95% of the engineer’s estimate. These ranges can be found in Table 3.1.
This illustrates the belief that if more competition is present then bids become more
competitive becoming more advantageous for the DOT. GADOT feels that these are
acceptable values for the bids and if the graph is satisfied, then the estimating method
they are using is performing satisfactorily.
Table 3.1: GADOT Range of Accepted Bid Percentages
Number of Bidders
Range (%)
1 100-130 2 100-115 3 95-105 4 90-105 5 85-95
6+ 80-95
Due to this method of gauging success, GADOT saved 30 million dollars last year
according to their effectiveness standards. It was also noted by GADOT personnel that as
the quantities of work increase, the bids should be more evenly distributed. On jobs with
smaller quantities, bids should tend to be more dispersed. Also, a major problem noted
by the GADOT when comparing the engineer’s estimate and the bidder’s estimates was
errors in estimated bid item quantities. When quantities are stipulated incorrectly,
contractors do not hesitate to unbalance their bids.
23
Perceived Disadvantages of the Unit Bid History Approach GADOT addressed a number of concerns with employing historical data to create
an engineer’s estimate. GADOT specifically cited that every individual project contains
specifications and plans tha t are most likely unrelated to most other projects. Historical
data is built with information from all projects and an average is taken. That number then
becomes the unit price for that particular estimate. GADOT believes that a unit cost line
item approach does not take into account restrictions and special conditions of job
specific criteria. GADOT also believes that the historical data does not take into account
special situations such as lane closures on major roadways or possibly only being able to
work at night which can cause the line item to either be under or over estimated.
GADOT believes that with each restriction there is an additional cost associated with the
estimate. GADOT also believes that unit cost line item historical data is also susceptible
to time because state and federal specifications are always changing and older historical
data might bring the average up or down. According to the GADOT, the primary
problem with unit cost line item estimating is that it attempts to relate an average cost to
projects that are not related at all, which can lower the engineer’s estimate accuracy
because of too much variability between historical data. These perceived inconsistencies
are reasons why GADOT believes in using the cost-based approach for estimating
projects.
Further Comments
GADOT has employed the cost-based approach for over thirty years. GADOT
typically has 360 lettings per year and four estimator’s working on these estimates.
GADOT does not have any handbooks or reports that they use when cost-based
24
estimating. GADOT mentioned that Illinois has a manual for cost estimating, but it
would only be useful for their state due to the fact that every state has different
specifications and regulations. Mr. George Bradfield recently developed a small booklet
for the state of Maine on the basic cost-based estimating approach. GADOT firmly
believes that the only way to estimate successfully is through some form of cost-based
estimating.
CHAPTER IV
NORTH CAROLINA DEPARTMENT OF
TRANSPORTATION SITE VISIT
The research team met with Mr. Ron Davenport and Mr. Ray Arnold from the
North Carolina Department of Transportation (NCDOT) on February 10, 2006 to discuss
the methodology and approaches used by the NCDOT to prepare the engineer's estimate.
Many similarities were found to the approaches used by the GADOT. The meeting
started with Mr. Davenport and Mr. Arnold answering questions forwarded to them by
the research team (Appendix C). Beginning in the early 1980's, cost-based estimating
was introduced to the NCDOT to reduce bid-rigging because contractors believed that the
DOT engineer's estimate used only bid averages. NCDOT needed a way to show the
contractors that their engineer's estimates were not only based on bid averages but
included production rates, labor wages, and equipment rates. The answer for the NCDOT
was to switch from a pure unit cost line item approach to a cost-based estimating method.
The NCDOT began cost-based estimating by first experimenting with earthwork in order
to gain accurate production rates. They have now successfully expanded cost-based
estimating to mobilization, structural, traffic control, erosion control, signing, and
specialty items. NCDOT made it clear that each individual project is specific and must
be estimated accordingly. Because of this, the NCDOT uses many forms of the 80-20
rule. Depending on the specific project at hand, the NCDOT could use a cost-based
26
estimating approach for 30% of the line items to as little as 10% of the line items
depending on that individual project.
Perceived Advantages and Disadvantages
Of Cost-Based Estimating
Cost-based estimating was adopted by the NCDOT more than 25 years ago and is
still in use today due to the numerous benefits the NCDOT believes this approach brings
to their engineer’s estimate. The biggest advantage in using a cost-based estimating
approach, as expressed by NCDOT, is that it allows the DOT to estimate project costs in
a manner similar to that used by the bidding contractors. The NCDOT feels this
estimating method allows the DOT more legal justification when disputes arise about
production rates, material costs, or material quantities with contractors. According to the
NCDOT, a cost-based estimate is extremely beneficial in market flux situations because
it allows the estimator to reflect current economic conditions by altering certain line
items. Also, as would be expected, NCDOT believes that cost-based estimating is more
effective when there is minimum job related historical data available in the database.
Although the NCDOT recognizes that a number of benefits are associated with
cost-based engineering, some disadvantages of this method were cited by NCDOT
personnel. One disadvantage of cost-based estimating is that the estimator must have a
working knowledge of construction practices in order to formulate an accurate cost-based
estimate. Another drawback viewed is that a 100% cost-based estimate cannot be
performed due to the amount of time it would take to complete such an estimate.
NCDOT stated that it takes them approximately a half a day to estimate a resurfacing
project, one to two days to complete an estimate on a bridge resurfacing project, and
27
three to five days to complete estimates on larger projects. Even though a cost-based
estimate is more time consuming than a unit price estimate, NCDOT believes that the
benefits of a cost-based estimate greatly outweigh the unit cost line item approach.
Perceived Disadvantages of the Unit Cost
Line Item Price Estimating Approach
NCDOT discussed many reasons why they do not use unit cost line item
estimating practices on every line item for their projects. The main reason is that if
contractors suspected that NCDOT used historical data, the NCDOT believes that
contractors could artificially inflate the market annually. Another reason believed by the
NCDOT, is that historical data is often outdated and does not reflect current market
considerations. Market rates are always changing, meaning that equipment rates,
material rates, and labor rates which are included in the historical database could be
inaccurate. Not only are market trends changing, but so are construction indexes and
department of transportation specifications. Therefore, the NCDOT believes that line
item average prices based on this old information or historical data could be inaccurate.
When historical data cannot be found for certain project line items, the NCDOT believes
that the unit cost line item approach, in this case, might lead to inaccurate assumptions
applied to some line items. NCDOT does utilize a unit cost line item estimating
approach, but only on small line items, and uses cost-based estimating for the more
significant line items.
28
Estimating Methodology
NCDOT's estimating methods closely resemble the techniques contractors use to
fairly and accurately determine the cost of a project. NCDOT executes its cost-based
estimating process by first examining the plans and specifications to determine quantities
and procedures. Once the procedures are determined for a specific type of work such as
earthwork, the haul times and production rates are determined. A site visit is then
conducted to determine any site specific conditions that could constrain the construction
process. The quantities are then placed into a spread sheet and material costs, equipment
costs, and labor costs are determined. The remaining line items are determined using
historical data estimates and using databases in software applications such as Heavy Bid,
Transport, and Oman systems software. The cost-based and unit cost estimates are then
combined to determine the overall estimate. The resulting engineer’s estimate is then
compared to historical prices of projects whose size, location, and site conditions are
similar to the project being estimated. Finally, if the engineer’s estimate is within
acceptable DOT standards, that estimate is used as a median when compared to the
contractors’ bids in order to determine which contractor will be awarded the project.
Production Rates and Material Costs
The production rates for the NCDOT are maintained within a database created by
NCDOT personnel a few years ago. The database contains crew compositions and wage
rates for certain activities and is updated annually. NCDOT production rate information
is gathered from certified payrolls versus present labor rates. NCDOT also uses the
project inspector’s knowledge of rates on site as well as predetermined crew composition
29
and equipment databases. All relevant information is then gathered before the final
production rate is determined for a certain activity.
Material, aggregate, labor, concrete/concrete component, asphalt mix, and
equipment costs are updated semi-annually or annually. To calculate accurate haul
distances, NCDOT utilizes maps showing the mileage from every NCDOT project to all
asphalt plants, quarries, and sand pits. The NCDOT also keeps in contact with other state
DOT’s, FHWA, and TEA if questions arise with respect to any costs or issues pertaining
to any project. NCDOT obtains aggregate costs by contacting and receiving quotes from
all state suppliers every year and updating the database. NCDOT tracks cost fluctuations
for concrete/concrete component cost in order to gain a realistic cost estimate. NCDOT
also updates all asphalt mix costs through their internal databases for different Super
paves used in North Carolina. Equipment costs are gathered by contacting distributors
and reviewing Rental Rate Blue Book for Construction Equipment, Contractor’s
Equipment Cost Guide, Cost Reference Guide, and the Means Heavy Construction Cost
Data.
CHAPTER V
SOUTH CAROLINA DEPARTMENT OF
TRANSPORTATION SITE VISIT
After meeting with the Georgia (GADOT) and North Carolina (NCDOT)
Departments of Transportation the research team believed it would be beneficial to more
fully clarify the South Carolina Department of Transportation (SCDOT) estimating
approach in order to compare and contrast the two estimating methods more effectively.
On June 28, 2006 the research team met with Mr. Jim Frick and Mr. Jamie Kendall to
discuss how the SCDOT prepares their engineer’s estimate. The SCDOT defines the
engineer’s estimate as “an estimate of the reasonable or fair cost to construct a project
used as a benchmark to evaluate the low bid.” The SCDOT has four divisions of
estimating who prepare the engineer’s estimate. The road design division or the
estimates and specifications group is the largest with three to four estimators. Of the four
divisions, this division handles 90% of the estimating duties. The other three specialty
divisions include bridge design, traffic engineering, and bridge maintenance. Last year
the SCDOT reported developing 268 engineer’s estimates, or about 22 projects per month
on average.
Methodology
SCDOT currently uses a unit cost line item estimating approach when preparing
their engineer’s estimate. Their methodology starts with reviewing plans and
specifications for the proposed project. This review allows the estimators to gauge the
31
types and amounts of quantities required for the project. Once the quantities are
determined for the line items, SCDOT tabulates the bids. Historical data is reviewed by
looking through Microsoft Access databases to find line item histories that pertain to the
project. The three low bidders are shown in the historical data for each line item price
with the lowest bid usually being recorded. Using the AASHTO Software PES and LAS
the SCDOT can separate out and organize all related historical line item data. Once this
data is organized, it is sent into an SCDOT developed program that integrates Microsoft
Access and Excel. The DOT estimators using this program can then identify a single line
item from the project they are estimating and find historical prices based on job type,
length, type of material, by date, county, and many more distinctions. After the estimator
defines these job parameters, the computer program will compute an average price for
that particular line item. This line item is then checked for accuracy with other line items
with similar parameters. The line item quantity is then graphed versus unit price data
against historical data. A line is then fit to the curve of the resulting points, and the
regression analysis r squared value is checked to see how close it is to one. If that value
is close to one, then the estimated price is acceptable, and the estimator moves on to the
next line item. Line items pertaining to fuel and asphalt are usually checked against the
fuel and asphalt curve as well. The SCDOT also examines the Bureau of Labor Statistics
and Federal Highway Administration (FHWA) price trends when estimating to ensure the
line item estimates are consistent with current trends in order to enhance the estimate
accuracy. Once all items are estimated following this procedure an engineer’s estimate is
the result.
32
Estimate Success
SCDOT views a successful engineer’s estimate as one that follows the FHWA
guidelines stating that the engineer’s estimate must be within plus or minus ten percent of
the low bid fifty percent of the time (6). SCDOT total engineer’s estimate accuracy
decreased versus total low bid in the early 2000’s but improved in 2003. That year the
total low bids were even with the total engineer’s estimate. Also during that year the
SCDOT received the 2003 Engineer’s Estimate Outstanding Achievement Award
presented by the FHWA. In 2004, the total low bids were 5.71% higher than the
engineer’s estimate, and in 2005 the total engineer’s estimate was equal to the total low
bids. The SCDOT has shown to be exceptionally accurate when preparing the engineer’s
estimate.
CHAPTER VI
NCDOT, GADOT, AND SCDOT COMPARISON
The NCDOT approach to developing the engineer’s estimate is almost identical to
the approach used by the GADOT. Both DOT’s use a mixture of cost-based and unit
cost line item approaches which originated in the early 1980’s because of contractor
collusion and bid-rigging problems suspected during that time. Both states agree that
cost-based estimating illustrates to the contractors the DOT is carefully monitoring the
bidding process. The primary difference between NCDOT and the GADOT is that the
NCDOT uses more computer software programs to store data such as production rates,
material costs, and equipment costs than the GADOT. The GADOT only utilizes
computer software when finding historical unit price averages for common line items.
When estimating for materials, both agencies utilize maps depicting haul distances from
every quarry, asphalt plant, and sand pit in their respective state to the specific project
being estimated. NCDOT does not apportion any discount on materials when
formulating an engineer’s estimate, but the GADOT apportions at least a 20% discount
on material costs because they believe the contractor receives this discount from the
supplier. These are the main differences between the NCDOT and the GADOT when
formulating an engineer’s estimate.
NCDOT, GADOT, and SCDOT Comparison
SCDOT uses a unit cost line item approach to estimating while the NCDOT and
GADOT utilize a cost-based approach. The NCDOT and the GADOT claim they can use
34
anywhere from an 80-20 rule approach to a modified 90-10 approach depending on the
type of project being estimated. NCDOT uses computer programs such as Heavy Bid
and Transport, while GADOT uses Oman Bid Systems (Appendix A) when estimating
the 80% of the line items that are common using historical data. The SCDOT uses the
Transport programs PES and LAS to filter and organize historical data, but not to finalize
their estimate. Production rates are determined by both the NCDOT and the GADOT and
are not determined by the SCDOT. For material costs both the NCDOT and GADOT
contact suppliers to receive quotes. The SCDOT utilizes historical cost data when
estimating these costs.
NCDOT and SCDOT both utilize predetermined fuel/asphalt adjustment factors
included in their state DOT specification standards. NCDOT was considering changing
the adjustment factors for fuel and asphalt, but they determined that the ir numbers were
still applicable. The factors for diesel and unleaded fuel were the same for the NCDOT
and SCDOT. If any questions arose on any of the estimates for fuel/asphalt prices, all
states claim to maintain good communication with other state DOT’s to check prices.
The DOT’s interviewed explained many views of how to compare the engineer’s
estimate to the bids received for work were explained by the DOT’s interviewed. The
NCDOT views the engineer’s estimate as the median estimate during the bidding process.
According to the NCDOT, their engineer’s estimate should fall in the middle of the bids,
and if this occurs they believe that their estimating methods are performing satisfactorily.
The GADOT views the engineer’s estimate as a benchmark for bidders and measures
engineer’s estimate effectiveness by looking at the total percentages of bids that fall
above or below the engineer’s estimate depending on the number of bidding parties. The
35
SCDOT views the engineer’s estimate as a benchmark to evaluate the low bid. No matter
what views are considered by any state DOT, the ultimate goal is to maintain a solid
estimating methodology that will assist in developing an accurate engineer’s estimate.
CHAPTER VII
SURVEY QUESTIONNAIRE
The primary objective of the survey questionnaire forwarded to each state
department of transportation (DOT) was to determine the means and methods utilized by
state DOT’s when developing their engineer’s estimate. This objective is addressed
throughout the survey to specifically identify the procedures followed when
implementing a cost-based estimating methodology. Defining the estimate accuracy and
expected amount of resources expended when estimating with either approach was an
objective of the survey as well. Another objective of the survey was to determine how
state DOT’s implement fuel and asphalt cost adjustments. Gasoline prices have been
fluctuating recently, and the survey asks how state DOT’s estimate for these kind of
market conditions and what methodologies are utilized. The 30 questions included in the
survey were designed to interpret these objectives, and the following survey
questionnaire analysis extracts these points. Twenty-two state DOT’s responded to the
survey.
Survey Analysis
Question #1
What is the primary estimating approach performed by your DOT? ¨ 10% Cost-based ¨ 60% Bid History (Line Item) ¨ 30% Combination ¨ 0% Other:__________________
37
The estimating approach utilized most often from the questionnaire responses was
the bid history approach, as shown by 60% of respondents. The other 40% was made up
of cost-based estimating states (10%), and combination approaches (30%).
Question #2
What percentage of projects do you perform with the selected approach from question #1?
Of the states using bid history, ten states claimed they were 100% bid history, two
states responded that they were 90% bid history and 10% other. Of the states respond ing
that they used a cost-based approach; one was 70% bid history and 30% cost-based, and
the other was 80% cost-based and 20% bid history. Of the remaining states that use the
combination approach two claimed to be 80% cost-based and 20% bid history, one was
90% bid history and 10% cost-based, one was 100% combination, another was 100% bid
history, and one was 100% cost-based. These percentages indicate that the states
reporting that they use the bid history approach mainly perform 100% line item estimates.
But the states using cost-based or the combination approach utilize similar combinations
of bid history. For the purpose of this analysis the states responding that they implement
a cost-based approach will be grouped together with the states using a combination
approach. The reason for this grouping is to form two groups for which a comparative
analysis can be performed.
% 10 20 30 40 50 60 70 80 90 100
Cost-Based
Line Item
Other
38
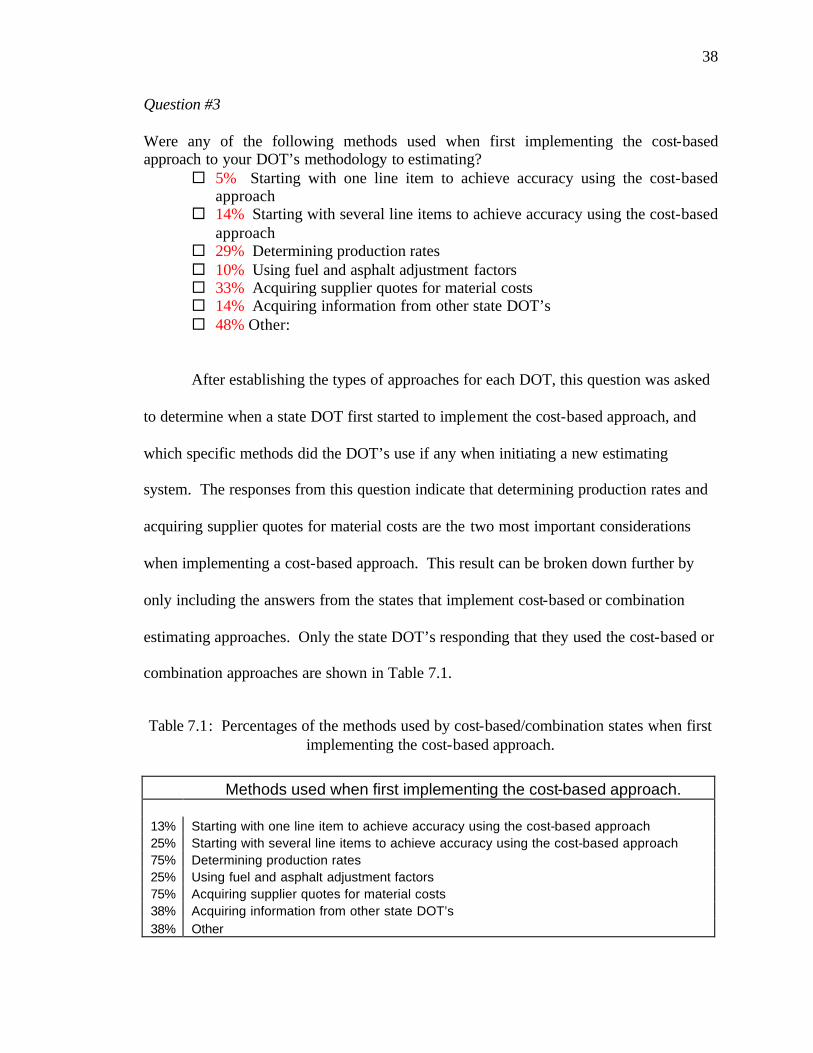
Question #3
Were any of the following methods used when first implementing the cost-based approach to your DOT’s methodology to estimating?
¨ 5% Starting with one line item to achieve accuracy using the cost-based approach
¨ 14% Starting with several line items to achieve accuracy using the cost-based approach
¨ 29% Determining production rates ¨ 10% Using fuel and asphalt adjustment factors ¨ 33% Acquiring supplier quotes for material costs ¨ 14% Acquiring information from other state DOT’s ¨ 48% Other:
After establishing the types of approaches for each DOT, this question was asked
to determine when a state DOT first started to implement the cost-based approach, and
which specific methods did the DOT’s use if any when initiating a new estimating
system. The responses from this question indicate that determining production rates and
acquiring supplier quotes for material costs are the two most important considerations
when implementing a cost-based approach. This result can be broken down further by
only including the answers from the states that implement cost-based or combination
estimating approaches. Only the state DOT’s responding that they used the cost-based or
combination approaches are shown in Table 7.1.
Table 7.1: Percentages of the methods used by cost-based/combination states when first implementing the cost-based approach.
Methods used when first implementing the cost-based approach.
13% Starting with one line item to achieve accuracy using the cost-based approach 25% Starting with several line items to achieve accuracy using the cost-based approach 75% Determining production rates 25% Using fuel and asphalt adjustment factors 75% Acquiring supplier quotes for material costs 38% Acquiring information from other state DOT’s 38% Other
39
This question illustrates that the DOT’s who utilize cost-based/combination
approaches believe that determining production rates (75%) and acquiring supplier quotes
for material costs (75%) were the most important when first implementing a cost-based
approach. It becomes clearer with the high percentages of answers that production rates
and material costs are critical components of cost-based estimating. Acquiring
information from other state DOT’s (38%) was considered an appropriate strategy as
well. Using fuel and asphalt adjustments (25%) was considered by some states, but was
not one of the two main approaches used when implementing a cost-based approach.
Another determination is that instead of initiating a cost-based estimate with one line
item (13%), most state DOT’s preferred to use estimates from several line items (25%).
Georgia and North Carolina stated that starting with one line item should come first in
order to obtain accuracy, and then using that same methodology to continue to cost-based
estimate using multiple line items. Other responses from DOT’s that were not listed as
options on the questionnaire included: consulting with field construction engineers and
industry representatives, study of similar projects, developing accurate catalogs of labor,
equipment, and material prices, and estimator training programs.
Question #4
Are there any perceived advantages or disadvantages for using the cost-based estimating approach that persuaded your DOT to implement it over the bid history approach? (1=Strongly Disagree, 5=Strongly Agree) This question was asked to obtain insight on what the DOT’s believed were
advantages and disadvantages of implementing a cost-based approach. Table 7.2
illustrates the answers received from ten states describing their opinions of the cost-based
approach. Labeling each statement as a one indicates a low certainty level, while labeling
40
each statement a five indicates a high certainty level. The numbers in the right column
display the average results from DOT’s responding to this question.
Table7.2: Perceived advantages and disadvantages of the cost-cased approach.
Perceived Advantages and Disadvantages of the Cost-Based Approach 1 2 3 4 5 A) The cost-based approach is more cost effective. 2.8 B) The cost-based approach improves estimate accuracy. 3.6 C) The cost-based approach accounts for fluctuating costs of materials. 4.0 D) The cost-based approach requires additional equivalent man-hours. 3.8 E) Cost-based estimating should only be utilized for major line items. 3.5 F) Cost-based estimating approaches estimating similar to the contractor's approach. 3.5
The DOT’s responding to this question indicated that they are indifferent to the
statement that the cost-based approach is more cost-effective (2.8). The states responding
indicated a higher sense of certainty to the statements that the cost-based approach
improves estimate accuracy (3.6), accounts for fluctuating costs of materials (4.0),
requires additional equivalent man-hours (3.8), should only be used for major line items
(3.5), and that the cost-based approach is similar to the contractor’s estimating approach
(3.5). The main point that needs to be recognized is the fact that the DOT’s responding
felt the cost-based approach may not be cost effective and may require more man-hours
for execution. This point is important because states considering the transition to a cost-
based system, should know a learning curve is involved as indicated by both the GDOT
and NCDOT in recent personal interviews.
41
Question #5
If your DOT has been using a cost-based approach, how long has your DOT been using it?
¨ 5% Just Starting ¨ 10% Phasing implementation presently ¨ 0% 1-5 years ¨ 0% 5-10 years ¨ 10% 10-20 years ¨ 48% Other:
When asked how long state DOT’s have been using the cost based approach, it
appears that states are either implementing a cost-based approach presently or have been
using this approach for more than 10 years, and in some cases over 20 years. This result
shows that states usually stay with the estimating procedure they have been using, and are
not anxious to change. This also illustrates that the survey responses are from states that
have been using this approach for a long period of time and know what the effects of
changing to a cost-based approach consist of.
Question #6
In your opinion, regardless of method, how much manpower does it take to obtain an estimate using your DOT’s current method?
tab reported: that they rationally estimate 65% of projects, earthwork, paving and bridge
work are majority of estimate cost, using a cost-based approach to earthwork and paving
and using bid history for remainder of estimate.
Question #12
What percentage of the time, when utilizing a cost-based estimating approach does the low bid fall within plus or minus 10% of the engineer’s estimate?
Question twelve responses indicate that 10% of the responding states receive low
bids falling within plus or minus 10% of the engineer’s estimate 50-75% of the time
when cost-based estimating. The FHWA states that 50% of the time the low bid must fall
within plus or minus 10% of the engineer’s estimate; in this case it does not. Forty-three
percent of the states responded with the other tab. One state reported that 75-85% of the
bids that they receive fall within plus or minus 10% of the engineer’s estimate; another
state said that it does not track this statistic. When just tracking the cost-
based/combination states responses, the survey showed that 25% had 50-75%, and that
38% were below 50%.
Question #13 What percentage of the time, when using the bid history approach, does the low bid fall within plus or minus 10% of the engineer’s estimate?
When using bid history the low bid falls within plus or minus 10% of the
engineer’s estimate 50-75% of the time for 48% of the states responding to this survey.
Twenty-four percent of the states receive low bids within these parameters 40-50% of the
time. There seems to be a major improvement from the states using a cost-based
approach as opposed to the states using the bid history approach when examining this
statistic. When just examining the bid history states, 75% had bids falling within 10% of
the engineer’s estimate 50-75% of the time. This is a big difference compared to the 25%
of cost-based/combination states.
The purpose of posing this question was to determine if the states receive low bids
within plus or minus 10% of the engineer’s estimate. This outcome can be used as a
success criterion as stated in the FHWA “Guidelines on Preparing the Engineer’s
Estimate.” For the purpose of this research, the state DOT’s expressing that the low bids
they receive that fall within 10% of the engineer’s estimate 50-75% of the time, will be
considered “successful”, and those that state that they fall below this criteria will be
looked at as “average” performers. Any trends or comparisons have been identified when
comparing these two groups.
Figure 7.3 represents the state DOT’s where the low bid falls within 10% of the
engineer’s estimate 50-75% of the time. These states are shown as either implementing a
cost-based approach (CB) or a bid history approach (BH) to estimating. Also illustrated
in this figure are the numbers of lettings per year versus the number of full time
equivalent estimators these DOT’s employ. There does not seem to be any relationship
between the type of estimating each DOT’s utilized and the number of lettings and full
time estimators. It is apparent from the figure that cost-based states definitely have more
49
lettings per year than the bid history states, but they do not have more estimators. This
figure also indicates that, regardless of estimating approach, there seems to be no
relationships when comparing lettings per year and number of full time estimators.
Figure 7.3: States DOT’s where the low bid falls within 10% of the engineer’s estimate 50-75% of the time.
Figure 7.4 illustrates the state DOT’s where the low bid falls within 10% of the
engineer’s estimate 40-50% of the time. These states are shown as either implementing a
cost-based/combination approach (CB) or a bid history approach (BH) to estimating.
These particular states are perceived to be average performers when estimating their
engineer’s estimate. There appears to be no relationship with these states when
comparing the number of lettings versus number of full time estimators. Figure 7.4 also
States where the Low Bid falls within 10% of the Engineer's Estimate 50-75% of the Time
0
200
400
600
800
1000
Nu
mb
er o
f L
etti
ng
's
02468101214161820
Fu
ll T
ime
Est
imat
or'
s
Lettings 130 110 350 75 120 268 900 500
FTE's 2 0.5 5 2 5.5 3 3 4 2 4
BH BH BH BH BH BH BH BH CB CB
50
illustrates that 25% of the BH states are average performers while 38% of the CB states
are average performers.
Figure 7.4: States DOT’s where the low bid falls within 10% of the
engineer’s estimate 40-50% of the time.
Question # 14 Does your DOT follow the FHWA Guidelines on Preparing the Engineer’s Estimate?
¨ 52% Yes ¨ 19% No ¨ 14% Sometimes ¨ 14% Other
When asked which states follows the FHWA guidelines, responses indicated that
52% say they follow the FHWA guidelines, 19% stated they do not, 14% sometimes, and
15% giving explanations. One state DOT reported that the FHWA guidelines are not
sufficiently clear and decisive. Another state DOT reported that their award criteria is
that the low bid must fall within 7% of the engineer’s estimate, and that awards made
States where the Low Bid Falls within 10% of the Engineer's Estimate 40-50% of the Time
0
100
200
300
400
500
600
700
800
Nu
mb
er o
f Let
tin
gs
0
1
2
3
4
5
6
7
8
9
Fu
ll T
ime
Est
imat
or'
s
Lettings 250 129 289 750 215
FTE's 2 4 3 8 4 3
BH BH BH CB CB CB
51
outside of this range require justification. Another state has developed its own estimating
manual. Overall 52% follow the guidelines presented by the FHWA when estimating.
Fifty percent of the cost-based/combination states and 58% of the bid history states
follow these guidelines.
Question # 15
Does your DOT utilize production rates when determining an estimate? ¨ 43% Yes ¨ 57% No
The answers were almost even, but 43% of the responding state DOT’s use
production rates, and 57% do not. This statistic clearly illustrates the importance of
production rates to each estimating method. Of the states using the cost-
based/combination approach, 100% said they utilize production rates when performing an
estimate, as compared to 8% of states using the bid history approach. One state reported
that they are just beginning to implement cost-based estimating on selected items for
which production rates would be a consideration.
Question #16
Are any of the following methods used when determining production rates? ¨ 39% Crew compositions ¨ 38% Haul distances ¨ 14% Contractor Payroll Data ¨ 33% Inspector’s Logs ¨ 38% Contacting material suppliers ¨ 10% Fuel price indexes ¨ 33% Rental Rate Blue Book for Construction Equipment ¨ 14% Contractor’s Equipment Cost Guide ¨ 5% Cost Reference Guide ¨ 19% Means Heavy Construction Cost Data ¨ 52% Other
52
This question examines how states obtain production rate statistics. This
information is important given that production rates were one of the key factors
associated with cost-based approach in questions three and fifteen. Crew compositions,
haul distances, inspector’s logs, contacting material suppliers, and the use of the Rental
Rate Blue Book all were selected by about 40% of the responding states as important
criteria when estimating production rates. Fifty-two percent of the states selected the
“other” tab which included: reference guides and means are last resort, contacting
department’s construction personnel, estimator’s experience from work as an inspector,
and the designer’s experience. All of these are different ways that were unlisted as
methods that state DOT’s use when obtaining production rates. Table 7.5 lists the cost-
based/combination states separately to identify how they prepare production rates.
Table 7.5: Methods used by cost-based/combination states when determining production rates.
Methods Used When Determining Production Rates Cost-Based/Combo Crew Compositions 75% Haul Distances 88% Contractors Payroll 38% Inspectors Logs 75% Contacting Material Suppliers 100% Fuel Price Indexes 25% Rental Rate Blue Book 88% Contractor's Equipment Cost Guide 38% Cost Reference Guide 13% Means Heavy Construction Cost Data 50%
53
As indicated in Table 7.5 cost-based/combination states utilize crew
compositions, haul distances, inspector’s logs, contacting material suppliers, and rental
rate blue books when determining production rates. The states responding felt that these
measures were the most important when estimating production rates. These items need to
be addressed when converting to a cost-based approach and a database should be
developed to track of the actual attained production rates.
Question #17
How often does your DOT update production rates? ¨ 10% Annually ¨ 5% Bi-Annually ¨ 0% Monthly ¨ 62% Other
When states were asked how often they updated production rates, 10% responded
updates annually, 5% biannually, and 62% updated production rates differently. Most
states responded that it varied and depended on the project or as needed, and there was no
set time period for updating these costs. Seven states do not update these rates at all.
Question # 18
How does your DOT obtain material costs from suppliers? ¨ 62% Contacting material supplier by telephone ¨ 5% Contacting material supplier in person ¨ 5% Contacting other DOT’s ¨ 48% Other
Another important question to ask addressed was how state DOT’s obtain
material costs for estimates. Sixty-two percent of the states responding said they
contacted the material suppliers by telephone, 5% contacted material suppliers in person,
and 5% contacted other DOT’s. Other methods (48%) being used among the states
54
responding was the use of bid history, review trade magazines, newspapers, investment
literature, Poten and Partners, discussions with field personnel, email, subcontractors, and
examining previous invoices. Telephone was the best way for the respondents to gain
material cost prices from the suppliers; some states assumed that contractors are given
discounts and included or excluded this information from the bid.
Question #19
How often do you update these costs? ¨ 0% Annually ¨ 0% Bi-Annually ¨ 19% Monthly ¨ 62% Other
When asked how often the DOT’s updated material costs, the most common
answer was as needed by the project being estimated. There was no real update time
other than 20% of the states stated that they update material costs every month. While
62% of the states responding reported that they used other methods. Six states said they
updated these costs by project or as needed, four states do not update these costs,
checking historical data instead, and one state updates after every letting. States update
costs in many ways, but the most common answer was as needed or by project.
Question #20
Does your DOT quantify lump sum items such as traffic control, mobilization, and clearing and grubbing?
¨ 38% Yes ¨ 24% No ¨ 19% Sometimes ¨ 24% Other
55
It was found that 38% of the DOT’s claimed that they do quantify these items,
24% said they do not, and 19% said that they do sometimes.
Table 7.6 suggests that bid history states have a higher variation in their approach.
Cost-based/combination states consistently quantify these items or they do not. This
outcome shows that each state DOT quantifies these items differently, and that there is no
uniform approach. When just identifying the cost-based/combination group, 50% of the
state DOT’s responding quantified these lump sum items as compared to 33% of bid
history approach states. Clearly the cost-based/combination group believes that
quantifying these items is important.
Other responses included:
o Traffic control is quantified.
o Mobilization and maintenance and traffic are lump sum, but not clearing and
grubbing.
o Clearing and grubbing acres are quantified, but removal items are not.
o Clearing and grubbing are quantified, and traffic control is quantified sometimes.
o The DOT rationally estimates these items if they are a major cost on the project.
o Mobilization is calculated as a percentage of construction item costs.
o Clearing and grubbing is lump sum, traffic control can be lump sum or unit prices,
mobilization are always lump sum.
56
Table 7.6: Percentages of DOT’s who quantify lump sum items.
Does the DOT Quantify Lump Sum Items Bid History Cost-based/Combo Yes 31% 50% No 23% 25% Sometimes 31% 0% Other 8% 50%
Question #21
If so, how does your DOT quantifying traffic control, mobilization, and clearing and grubbing?
¨ 48% Acreage ¨ 5% Land use classifications ¨ 29% Lane closure setups ¨ 38% Number of cones, barrels, or barriers ¨ 48% Other
Of the state DOT’s responding how they specifically quantify these items, 50%
stated that they quantify lump sum items using acreage, 40% quantify using number of
cones, barrels, or barriers, and 30% quantify lane closure setups.
Table 7.7 illustrates the differences in the two approaches and what methods each
approach uses when quantifying lump sum items. Acreage (63%), lane closures (50%),
and number of cones, barrels, or barriers (63%) are utilized by the cost-
based/combination states. The bid history approach states primarily utilize acreage when
quantifying lump sum items. Other responses included the following:
o Pre-cast barriers are separate pay items along with message boards and cones,
barrels, flagging, etc are not.
o Mobilization is a lump sum item. Traffic Control is paid for by the unit
(square footage of signs), by other quantities (linear foot of barricades,
57
number of raised pavement markers, etc) and by lump sum (includes barrels,
movement of signs, etc.).
o Traffic items are required by the FHWA to split out.
o Clearing and grubbing are by the acre. Traffic control is based on quantifiable
items such as barrels and barrier plus contract duration, mobilization is based
solely as a percentage of the total contract value depending on the type and
complexity of the work being performed
o Sometimes acreage is used for clearing and grubbing only.
Table 7.7: Comparison of DOT methods used when quantifying lump sum items.
Methods of Quantifying Lump Sum Items Bid History Cost-based/Combo Acreage 38% 63% Land use classifications 0% 13% Lane closure setups 15% 50% Number of cones, barrels, or barriers 23% 63% Other 54% 38%
Question #22 How often do your estimators perform site visits prior to estimate development?
¨ 38% Every project ¨ 14% Major projects ¨ 14% Special condition projects ¨ 5% Owner required projects ¨ 33% Other
This question addressed the amount of time the state’s estimators perform site
visits. Interestingly 38% of the states polled said that their estimators perform site visits
58
for every project, and the next highest response was for major and special condition
projects.
When examining the different approaches it is apparent that the states utilizing the
bid history approach perform site visits 46% of the time (Table 7.8). Overall the bid
history states perform more site visits than the states utilizing the cost-based approach.
Other responses from responding states were as follows:
o 3 States: never
o Site visits are on an “as needed basis”.
o Rarely done.
o It is extremely rare that there would be time to visit a project site during the
estimating process. We do have a video log of our roadways and we do have
discussions about the project with the designers, the construction engineers
and the materials engineers. During the summer we visit.
o Very few.
o Designer’s preference and complexity of the project.
o Project estimates are prepared by the design team who are intimately familiar
with the project and make multiple site visit s throughout the design process.
Table 7.8: Percentage of state estimators that perform site visits.
State Estimators Performing Site Visits Bid History Cost-based/Combo Every project 46% 25% Major projects 8% 25% Special condition projects 15% 13% Owner required projects 8% 0% Other 23% 50%
59
Question #23
Does your DOT publish their engineer’s estimate? ¨ 0% Prior to the letting date ¨ 10% After the letting date ¨ 5% State mandated ¨ 62% No ¨ 24% Other
The survey indicated that 60% of states responded that they do not publish the
engineer’s estimate. Five percent responded that it was state mandated, and 10% noted
that they published the engineer’s estimate after the letting date.
The majority of state DOT’s do not publish their engineer’s estimate, as is
indicated in Table 7.9. Other responses by state DOT’s included:
o At the time bids are opened as required by Kentucky Statute.
o After award.
o State law not to reveal.
o Only bottom line numbers are provided. Unit prices are not released.
o At time of advertisement.
o State Law requires it to be kept confidential even post award.
Table 7.9: Percentages of how state DOT’s publishing their engineer’s estimate.
How States Publish their Engineer’s Estimate Bid History Cost-based/Combo Prior to the letting date 0% 0% After the letting date 15% 0% State mandated 0% 13% No 62% 63% Other 8% 50%
60
Question #24
How does your DOT implement fuel adjustments? ¨ 14% When preparing the estimate ¨ 62% At payout to contractor’s
When the state DOT’s were asked how they implement fuel cost adjustments,
60% of the states polled said that they implement fuel cost adjustments at contractor
payout, and 15% said they include this factor when preparing the estimate. Seven states
replied that they did not use fuel adjustments. Other responses included:
o Currently only during construction.
o Based on similar projects in area which recently let (2-3) months.
o Fuel adjustments are not currently included in the estimate. After
prerequisites are met, and at contractor’s request, fuel cost adjustments are
calculated and paid at payout.
o Contractor has the option to participate in fuel cost provisions. At time of
signing contract, the contractor must indicate if they wish to participate, and if
so, how much of bid is fuel. If participating, each progress payment is
modified to the market value vs. the market at the time the project was bid.
o Fuel factors are not used; however we try to account for higher fuel costs
when preparing the estimate. The anticipated length of the project with
reference to time, scope of work, asphalt plant quotes, etc influence estimates
in reference to fuel prices.
o When preparing the estimate and at payout to contractor’s, at estimate—we
use the blue book rental rate for our equipment costs. Fuel is included in the
61
operating cost. At payout—a fuel escalation clause is included in our
contracts.
o When the change in the fuel adjustment varies over $0.15 from the index at
the time of the letting.
o Fuel risk is not estimated since the contractors risk is mitigated by our special
provision, payments are made or credits collected based on the index change
over the life of the contract.
o Also adjusted at project completion.
Question #25
If your state DOT implements fuel adjustments, how does your DOT obtain the specific adjustment factors? ¨ 0% Through AGC contacts or resources* ¨ 14% Use of quoted FHWA adjustment factors
(http://www.fhwa.dot.gov/programadmin/contracts/ta50803.htm) ¨ 5% Use of USDOT resources ¨ 29% Use of state DOT factors developed through self determined
investigation* ¨ 38% Other
An interesting survey indication was that no state DOT obtained fuel adjustment
factors through the Association of General Contractors resources. Ten percent of the
DOT’s polled said that they obtained the adjustment factors through use of quoted
FHWA adjustment factors, 5% said they used USDOT resources, 30% of the DOT’s have
in-house methods for determining fuel adjustments, and 40% said they used some of the
previous methods or other methods. Other methods of obtaining fuel cost information
included: past projects, ENR-20 city average, formulas, Platts Diagram, Poten and
Partners, industry, and investigating other state DOT’s.
62
Table 7.10 illustrates that bid history approaches (23%) use quoted FHWA
adjustment factors when obtaining a fuel adjustment and no cost-based/combination
states did. Some cost-based/combination states (13%) utilized USDOT resources when
obtaining fuel adjustments and 0% of bid history states did. More bid history states used
state DOT factors developed through self determined investigation (38%) than cost-
based/combination states (13%). Most states used other methods that are described in the
previous paragraph. Appendixes E and F examples of adjustment factors.
Table 7.10: Percentages of how states obtain fuel cost adjustments.
How States Obtain Fuel Cost Adjustments
Bid
History Cost-
based/Combo Through AGC contacts or resources 0% 0% Use of quoted FHWA adjustment factors 23% 0% Use of USDOT resources 0% 13% Use of state DOT factors developed through self determined investigation 38% 13% Other 38% 38%
Question #26
How does your DOT implement asphalt related cost adjustments? ¨ 24% When preparing the estimate ¨ 48% At payout to contractor’s
Asphalt adjustments were said to be adjusted by 45% of the state DOT’s at payout
to contractors, and 25% of the states responded that they consider asphalt cost
adjustments when preparing the estimate. Other state DOT responses included the
following:
o Based on similar projects in area which recently let (2-3) months.
63
o Estimated asphalt adjustments are included in the estimate, but actual cost
adjustments are calculated and paid at payout.
o Costs are modified at time of Engineer’s Estimate, but are not modified on the
contract.
o Fuel factors are not used; however we try to account for higher fuel costs
when preparing the estimate. The anticipated length of the project with
reference to time, scope of work, asphalt plant quotes, etc influence estimates
in reference to fuel prices.
o Supplier quotes.
o Special provision allows for payments or credits for AC based on index from
bid date to when material is placed. The risk is not estimated since contractor
is protected if AC rises.
o 4 States: Not currently adjusting asphalts.
o We publish a monthly asphalt price with each contract and make adjustments
to the contractors bid price for asphalt items if the base price increases or
decreases throughout the project.
o A line item is contained in the bid proposal titled “Asphalt Adjustment Cost”.
At time of Construction the constructor must provide documentation of his
costs to the department.
64
Question #27 If your state DOT implements asphalt related cost adjustments, how does your DOT obtain the specific adjustment factors? ¨ 0% Through AGC contacts or resources* ¨ 10% Use of quoted FHWA adjustment factors
(http://www.fhwa.dot.gov/programadmin/contracts/ta50803.htm) ¨ 0% Use of USDOT resources ¨ 24% Use of state DOT factors developed through self determined
investigation* ¨ 33% Other
None of the states consult with the AGC when obtaining asphalt adjustments. Ten
percent of the DOT’s polled said that they obtained the adjustment factors through use of
quoted FHWA adjustment factors, 20% of the DOT’s have in-house methods for
determining fuel adjustments, and 35% said they used some of the previous methods or
other methods. Other methods of obtaining asphalt cost information included: past
projects, ENR-20 city average, Asphalt Weekly Monitor, refineries, Poten and Partners,
industry, and investigating other state DOT’s.
Table 7.11 illustrates the percentages of cost-based/combination states relying on
their own in-house factors (25%) and other methods (13%) when obtaining asphalt
adjustments. Bid history states used quoted FHWA adjustment factors (15%), state in-
house factors (23%), and other methods (46%). These are almost exactly the same
percentages that were recorded for fuel adjustments.
65
Table 7.11: Percentages of how states obtain asphalt cost adjustments.
How States Obtain Asphalt Cost Adjustments
Bid
History Cost-
based/Combo Through AGC contacts or resources 0% 0% Use of quoted FHWA adjustment factors 15% 0% Use of USDOT resources 0% 0% Use of state DOT factors developed through self determined investigation 23% 25% Other 46% 13%
Question #28
Are there any other cost categories or line items, other than those that are asphalt or gasoline related, for which you make adjustments when preparing the estimate, or at contractor payout?
¨ 43% Yes ¨ 48% No
When asked if any other adjustments were implemented by the DOT’s 43%
indicated no, and 48% indicated yes. Adjusting for steel costs was the answer most
DOT’s cited. Other adjustments that the state DOT’s responded with included: concrete,
asphalt cement, and water pollution control. Comments included for this question are
listed below:
o 4 States: Steel Adjustment.
o Steel; at estimate—supplier quotes, at payout—a steel escalation clause is
included in our contracts. We use data from the Engineering News Record—
20 city average.
o Concrete and Steel prices.
o No, we did have a steel adjustment, but have discontinued it.
o Earthwork, concrete pipe, concrete pavement, structural concrete, stone base
66
o Price adjustments for fuel, steel, and asphalt cement. Risk is not estimated,
since owner has mitigated this risk by using the special provision for price
adjustment. Payments or credits are handled over the life of the contact.
o “Water Pollution Control” is a line item which allocates money for the
purpose which is paid to the contractor during presentation of the work. It is a
cost plus item.
Question #29 Would you be willing to share any specific procedures, reports, fuels and asphalt adjustment factors, or handbooks for the method that your DOT uses as guidelines for estimating? Most state DOT’s were willing to share information on request. Question #30 Please provide the following information:
The comprehensive literature review conducted by the author identified a number
of useful background publications. However, the literature review did not specifically
identify publications that examine why a state agency would adopt one estimating
approach to developing the engineer’s estimate in favor of another. Bidding procedures
used by the various states are well documented in the literature. Clemson University
executed a research project that focused on long range cost estimating that was unit price
as opposed to crew, cost, and labor productivity based. Most state agencies account for
fluctuations in fuel and asphalt prices through provisions in their standard specifications.
No references were identified that stated how a state agency should modify the engineer’s
estimate to take recent price fluctuations into account. Recent national events indicate
that significant fluctuations in fuel prices can occur within a relatively short period of
time.
Site Visits
The primary objective of the research project was to examine two types of
estimating approaches, and to identify their individual strengths and weaknesses. The
site visits to Georgia (GADOT) and North Carolina (NCDOT) Departments of
Transportations enabled the research team to personally investigate states that implement
a different estimating approach than the SCDOT. The research team discovered that
69
some of the cost-based estimating approaches used by the GADOT and NCDOT
appeared to have merit, and might be useful for the SCDOT. The GADOT and NCDOT
believe that their estimating approach is effective, and should be implemented by all state
estimators. The methodology seems straightforward, but the GADOT discussed that a
learning curve of half a year to three years was needed to become accurate at cost-based
estimating. Both states felt that once this method is established, it will help increase the
accuracy of the engineer’s estimate. The site visits gave the perspective that a cost-based
estimating approach is a good fit for the states visited, but the research team remained
unconvinced that a switch by the SCDOT would be beneficial. Further analysis was
needed to verify these methodologies of cost-based estimating, so a survey questionnaire
was forwarded to all state departments of transportation nationwide.
Survey Analysis
The goal of the survey questionna ire was to gain knowledge and insights into the
cost-based and unit cost line item estimating approaches, and to extract any pertinent
information that could possibly sway a DOT to switch estimating methods. The survey
questions were asked to determine means and methods associated with a cost-based
approach, and to discern the actual accuracy and resources expended for this approach.
It was discovered that 60% of the states responding utilized the unit cost line item
(bid history) approach, whereas 40% performed a combination of either methods or a
cost-based approach.
When first implementing a cost-based estimating approach some additional
procedures must be implemented. The data from Table 7.1 in the survey questionnaire
suggests that when employing a cost-based estimating approach, production rates and
70
material costs should be determined. Table 7.5 illustrates that crew composition, haul
distances, inspector’s logs, contacting material suppliers, and the use of the Rental Rate
Blue Book were most commonly used by cost-based/combination states when
determining their production rates. The reporting states also suggested that these
production rates are typically updated by project or updated as needed. Determining
material cost quotes was also deemed important by the responding states. Data shows
that material cost quotes were normally found by contacting the material suppliers by
telephone, with a small portion of respondents suggesting that they received the material
cost quotes from other sources such as magazines, television, and other medias.
Knowing what kind of resource expenditures can be expected when first
managing a cost-based estimate is very important. Table 7.4 suggests that more man-
hours expended could be expected when developing an estimate using the cost-based
approach rather than a unit cost line item approach to estimating. Question seven
reiterates this finding when 25% of cost-based/combination states answered that they had
experienced increased man-hours spent when first implementing a cost-based approach.
Table 7.4 illustrates another important finding. States answered with a low certainty that
the cost-based approach is more cost-effective. Also 25% of the cost-based/combination
states in question eight responded that increased costs were identified per project when
implementing a cost-based approach. This correlation is a small, but few states
responded to these questions. This low response could be interpreted as respondents not
wanting to identify this information because of fear that their states would be associated
with any response given, their method may be secretive, or they did not know. It can be
71
ascertained form the data that implementing a cost-based estimating approach might
increase costs and labor.
The research team felt that since SCDOT compares their engineer’s estimate
success to how well their engineer’s estimate follows the guidelines set forth by the
FHWA, that a success or accuracy criterion would be the states whose bids fell within the
engineer’s estimate 10% of the time, over 50% of the time. Figure 7.3 illustrates a
surprising statistic that 75% of unit cost line item states obtained accuracy 50%, whereas
only 25% of cost-based states obtained acceptable accuracy. This statistic suggests that a
unit cost line item approach to estimating is more accurate than utilizing a cost-based
approach. Another interesting statistic that can be formed from Figures 7.3 and 7.4 is that
states who obtain better accuracy utilize 0.98 estimators per one-hundred lettings, and the
states attaining less accuracy utilize 1.29 estimators per one-hundred lettings. In this
instance states who employ fewer estimators achieve higher accuracy. It also appears
that, from very limited data from these figures, that cost-based states utilize 0.79
estimators per one-hundred lettings, whereas unit cost line item states utilize 1.68
estimators per one-hundred lettings. This result could indicate that some states have
inexperienced staff members. Examining Table 7.3, cost-based estimating states had one
more estimator on staff, and an average of about two-hundred more lettings per year than
unit cost line item states.
The remainder of the survey analysis examined quantifying lump sum items, and
gathering information into how states implement adjustments for fuel and asphalt costs.
This information will be analyzed in the form of a parallel second research report being
prepared by Clemson University.
72
Recommendations
When the research proposal was initially established there was recognition by the
SCDOT that their estimating method contained a few disadvantages, and they were
willing to address their concerns by investigating an alternative approach to estimating.
This alternative approach was the cost-based estimating approach. The surrounding
states of Georgia and North Carolina utilized this approach, and it would be convenient
for a research team to investigate alternate methodologies. SCDOT’s intent was to
understand more completely the strengths and weaknesses of this approach compared to
their estimating approach. The site visits were executed to determine whether a cost-
based estimating approach was more accurate, and to find out the amount of resources
that would need to be expended to implement this method if it was deemed more
acceptable
After site visits with the GADOT and the NCDOT, the research team believed
that implementing some sort of a cost-based estimating approach, with respect to the 80-
20 rule, should be addressed by the SCDOT. But after reviewing the results from the
survey questionnaire, it became clear that the SCDOT should not try and implement a
cost-based estimating approach when developing the engineer’s estimate. Table 7.3
indicates that the number of resources available to SCDOT was comparable to other state
DOT’s who utilize a unit cost line item estimating approach that were surveyed. It was
found that 75% of the unit cost line item states obtained accuracy as opposed to 25% of
the states utilizing a cost-based approach. It was also found that implementing a cost-
based estimating approach could require more monetary risk and increased labor. There
are many perceived advantages to cost-based estimating, but most of the states who are
73
implementing this method have been using it for over ten years and can be considered
experts with this type of estimating. These states have readily available data and solid
methodologies already established. For a state DOT to implement this type of method
would require a steep learning curve. Considering the success of SCDOT’s methodology
this type of change seems unnecessary. Since SCDOT, GADOT, and NCDOT view the
accuracy and success of the engineer’s estimate differently, comparing their accuracy or
success is not viable. In conclusion, there is no compelling evidence from the survey
questionnaire to suggest that SCDOT adopt a cost-based or cost-based/combination
approach, to preparing the engineer’s estimate.
APPENDICES
75
Appendix A
Oman Bid Tabs Professional Plus GADOT uses this computer software developed by Oman Services Inc.,
www.omanco.com, which has the capability to link GADOT historical data to a
spreadsheet. Since GADOT uses a an 80-20 approach on most projects they are able to
tell the program to retrieve line item prices for select time periods, locations, and project
sizes. The program then retrieves a price for that line item which is an average price for
the selected variables. These average prices are used for 80% of the line items which
account for only 20% of the cost, enabling the estimator to spend the majority of the time
on cost-based estimates for the more significant line items.
76
OVERVIEW
A companion product to BidTabs Professional, BidTabs PLUS is add-on module (program) allowing you to set up a spreadsheet of pay items with multiple columns of prices. You can import the pay item data for an upcoming job from an electronic format such as Expedite or Excel and then load pay item prices (averages) from BidTabs Professional in four different columns.
The pay item averages are based on parameters defined by the user, such as state average prices in a county or region, a competitor's prices and many others. By viewing what past prices have been for pay items, a user can very quickly determine approximate project size and get a feel for average prices or competitors prices for an upcoming job.
Program Highlights
Import Data – Easily import pay item data from a DOT bid disk or from a spreadsheet file, or pick pay items (batch load) from a master database or add pay items one at a time. Quantity Parameters – When loading averages for all pay items you can enter a quantity percentage over/under the current project quantity that the system will use when calculating pay item averages. You can also enter project size ranges to calculate lump sum items.
Specific Pay Item - When loading averages for specific pay items you can quickly view all items that make up the average price for a pay item. You then have the ability to "dial in" the weighted average by excluding specific prices that you feel are too low or too high and may skew the price. Category Totals - Easily create and display subtotals for each category of work. Quickly break down and review each category of work for a more in-depth understanding of work to be performed.. Reports – Compare different pricing scenarios for any project or print a listing of pay items falling outside user-defined parameters.
Show Records Found - Display the number of records that were found when calculating the average price for each pay item based on the criteria that you set
Import/Export - Import and export pay item data from and to other programs and files including Expedite and spreadsheet files.
Metric Conversion – Easily switch between English and Metric units of measure at any time
77
Appendix B
Bid Comparison Graphs GADOT defines success as the ability to fit their data to the curve produced by
the bid comparison method. The bid comparison is set up with percentage of Engineer’s
Estimate on the y-axis and number of bids per project on the x-axis (Figure B). The
Engineer’s Estimate is used as the benchmark meaning that it is 100%. The percentages
show are the maximum, average, and minimum accepted bids compared to the Engineer’s
Estimate. This is done from one bidder to 6 plus bidders using all let projects per year.
Underneath the bids per project is the number of projects that was let that had only one
bidder and how much they accounted for in millions. GADOT then looks at the graphs
curve and compares it to the acceptable values that are predetermined. These acceptable
values are; for one bidder ranging from 100% to 130% of the Engineer’s Estimate, 2
bidders ranging from 100% to 115%, 3 bidders ranging from 95% to 105%, 4 bidders
ranging from 90% to 105%, 5 bidders ranging from 85% to 95%, and 6+ bidders ranging
from 80% to 95%. They feel that these are acceptable values for the bids and if the graph
is satisfied then the estimating method they are using is working accurately.
78
Figure B
79
Appendix C
Site Visit Questionnaire
1. Why does GA DOT use the cost estimating approach?
2. Advantages, Benefits of this approach as opposed to historical data method (line
item)?
3. Disadvantages?
4. History, how long has GA DOT used this method?
5. How has it influenced time (man-hours)? More or less time spent?
6. Explain the methodology of the cost estimating approach? Any diagrams,
flowcharts that we could look at?
7. Procedures, reports, or handbooks for this method that GA DOT uses?
8. Thoughts on 80-20, 70-30 approaches used by other states.
9. Any extra costs associated with this method?
10. Is this method more cost effective?
11. Are GA DOT engineer estimates usually on target with bids? Over/under.
12. Fuel adjustments?
13. Asphalt related cost adjustments?
14. Any specific data pertaining with exact percentages with respect to estimate
accuracy?
15. The number of estimates prepared monthly and the man-hours expended to
prepare those estimates?
16. How are production rates determined?
80
17. How do you update databases?
18. Do you have any example databases that we could look at?
81
Appendix D
Engineer’s Estimate Questionnaire
South Carolina Department of Transportation
INTRODUCTION The South Carolina Department of Transportation (SCDOT) currently uses a unit price line item (or “bid history”) approach for developing the engineer’s estimate. In an effort to improve our estimating procedures, a research project was initiated with the Department of Civil Engineering, Clemson University, to examine alternative approaches to preparing the engineer’s estimate, including what is termed the “cost-based” estimating approach whereby the agency essentially replicates the labor crew approach taken by the contractor. As part of this research project, this brief survey was developed. All responses to this questionnaire will remain confidential. A summary of responses will be prepared and distributed to those participating; however, agencies will not be identified. Please return the completed survey by mail or e-mail to Dr. Lansford Bell at Clemson University. Contact Dr. Bell if you have any questions related to survey execution. A response by July 14, 2006 will be greatly appreciated. Lansford Bell Department of Civil Engineering Clemson University Clemson, SC 29634 Email: [email protected] Fax: 864-656-2670 Tel: 864-656-3330
82
DEFINITIONS Described below are definitions of terminology used in the questionnaire survey. Cost-based estimate: Using this approach the transportation agency essentially replicates the estimating process utilized by the bidding contractor. Labor, materials, and equipment costs are determined using crew designations, wage rates, internal equipment rental/ownership rates, labor productivity, and equipment productivity data. Unit Cost Line Item Estimate (Bid History): Under this approach the agency inserts estimated unit costs for the bid line items into a spreadsheet that includes item description and estimated work quantities for each line item, and line item costs are summed to compute the estimated project cost. The unit price estimates are derived from a large database of historical unit price bid items. The 80-20 Rule: For most projects 80 percent of the costs are found in 20% of the line items. Cost-based estimating is done on that 20%, and bid history data is utilized for the remaining 80%. Low Bid: Lowest qualified bid that is accepted by the DOT. Production rates: The amount of work that can be completed in a single labor hour, based on crew composition, equipment ratings, and other conditions. Engineer’s Estimate: The estimate produced by the state DOT engineers. FHWA Guidelines: Guidelines that state the engineer's estimate should be within +/- 10 percent of the low bid for at least 50 percent of the projects.
83
SURVEY QUESTIONNAIRE Directions: Please place an X in any box that applies to your state DOT, if other is chosen please expand on your answer. 1. What is the primary estimating approach performed by your DOT?
2. What percentage of projects do you perform with the selected approach from question
#1?
3. Were any of the following methods used when first implementing the cost-based
approach to your DOT’s methodology to estimating? ¨ Starting with one line item to achieve accuracy using the cost-based approach ¨ Starting with several line items to achieve accuracy using the cost-based
approach ¨ Determining production rates ¨ Using fuel and asphalt adjustment factors ¨ Acquiring supplier quotes for material costs ¨ Acquiring information from other state DOT’s ¨ Other:_________________________________________________________
% 10 20 30 40 50 60 70 80 90 100 Cost-Based Line Item Other
1 2 3 4 5 The cost-based approach is more cost effective. The cost-based approach improves estimate accuracy. The cost-based approach accounts for fluctuating costs of materials. The cost-based approach requires additional equivalent man-hours. Cost-based estimating should only be utilized for major line items. Cost-based estimating approaches estimating similar to the contractors approach.
84
5. If your DOT has been using a cost-based approach, how long has your DOT been using it? ¨ Just Starting ¨ Phasing implementation presently ¨ 1-5 years ¨ 5-10 years ¨ 10-20 years ¨ Other: ________
6. In your opinion, regardless of method, how much manpower does it take to obtain an
7. If you have recently adopted a cost based approach, what has been the impact on your
estimating effort? On average over a given project: ¨ Increased man-hours ¨ Reduced man-hours ¨ Same man-hours spent
8. If you have recently adopted a cost based approach, have additional costs been
incurred to execute cost based estimates? ¨ Increased cost ¨ Reduced cost ¨ Same cost
9. How many estimates does your DOT prepare monthly?
¨ 0-10 ¨ 10-20 ¨ 20-30 ¨ 30 or more ¨ Other:________
10. How many equivalent man-hours are expended to prepare those estimates? ¨ 0-20 ¨ 20-30 ¨ 30-40 ¨ 40 or more:______ ¨ Other:________
85
11. Does your DOT employ any form of the 80-20 rule for estimating? ¨ Yes ¨ No Explain:_______________________________________________________________________________________________________________________________________________________________________________________________
12. What percentage of the time, when utilizing a cost-based estimating does the low bid fall within plus or minus 10% of the engineer’s estimate? ¨ 30 -40% ¨ 40-50% ¨ 50-75% ¨ Other:________
13. What percentage of the time, when using the bid his tory approach, does the low bid
fall within plus or minus 10% of the engineer’s estimate? ¨ 30 -40% ¨ 40-50% ¨ 50-75% ¨ Other:________
14. Does your DOT follow the FHWA Guidelines on Preparing the Engineer’s Estimate?
¨ Yes ¨ No ¨ Sometimes ¨ Other:________
15. Does your DOT utilize production rates when determining an estimate?
¨ Yes ¨ No
16. Are any of the following methods used when determining production rates?
¨ Crew compositions ¨ Haul distances ¨ Contractor Payroll Data ¨ Inspector’s Logs ¨ Contacting material suppliers ¨ Fuel price indexes ¨ Rental Rate Blue Book for Construction Equipment ¨ Contractor’s Equipment Cost Guide ¨ Cost Reference Guide ¨ Means Heavy Construction Cost Data ¨ Other:_________________________________________________________
17. How often does your DOT update production rates? ¨ Annually ¨ Bi-Annually ¨ Monthly ¨ Other:________
18. How does your DOT obtain material costs from suppliers?
¨ Contacting material supplier by telephone ¨ Contacting material supplier in person ¨ Contacting other DOT’s ¨ Other:_________________________________________________________
______________________________________________________________ 19. How often do you update these costs?
20. Does your DOT quantify lump sum items such as traffic control, mobilization, and
clearing and grubbing? ¨ Yes ¨ No ¨ Sometimes ¨ Other:________
21. If so, how does your DOT quantifying traffic control, mobilization, and clearing and grubbing? ¨ Acreage ¨ Land use classifications ¨ Lane closure setups ¨ Number of cones, barrels, or barriers ¨ Other:_________________________________________________________
______________________________________________________________ 22. How often do your estimators perform site visits prior to estimate development?
¨ Every project ¨ Major projects ¨ Special condition projects ¨ Owner required projects ¨ Other:_________________________________________________________
23. Does your DOT publish their engineer’s estimate? ¨ Prior to the letting date ¨ After the letting date ¨ State mandated ¨ No ¨ Other:_________________________________________________________
______________________________________________________________ 24. How does your DOT implement fuel adjustments?
¨ When preparing the estimate ¨ At payout to contractor’s Explain:_______________________________________________________________________________________________________________________________________________________________________________________________
25. If your state DOT implements fuel adjustments, how does your DOT obtain the
specific adjustment factors? ¨ Through AGC contacts or resources* ¨ Use of quoted FHWA adjustment factors (http://www.fhwa.dot.gov/programadmin/contracts/ta50803.htm) ¨ Use of USDOT resources ¨ Use of state DOT factors developed through self determined investigation* ¨ Other:_________________________________________________________
26. How does your DOT implement asphalt related cost adjustments? ¨ When preparing the estimate ¨ At payout to contractor’s Explain:_______________________________________________________________________________________________________________________________________________________________________________________________
88
27. If your state DOT implements asphalt related cost adjustments, how does your DOT obtain the specific adjustment factors? ¨ Through AGC contacts or resources* ¨ Use of quoted FHWA adjustment factors
(http://www.fhwa.dot.gov/programadmin/contracts/ta50803.htm) ¨ Use of USDOT resources ¨ Use of state DOT factors developed through self determined investigation* ¨ Other:_________________________________________________________
28. Are there any other cost categories or line items, other than those that are asphalt or
gasoline related, for which you make adjustments when preparing the estimate, or at contractor payout? ¨ Yes ¨ No Explain:_______________________________________________________________________________________________________________________________________________________________________________________________
29. Would you be willing to share any specific procedures, reports, fuels and asphalt
adjustment factors, or handbooks for the method that your DOT uses as guidelines for estimating?
30. Please provide the following info rmation: Name:____________________________________________________________ Title:_____________________________________________________________ Telephone #:_______________________________________________________ E-mail: ___________________________________________________________
89
Appendix E
Adjustment Index
Idaho Fuel Price Adjustment 7/06 A. Description. Fuel Price Adjustments will be applied to partial and final payments for contract items categorized in Section B, as a payment to the Contractor or a credit to the Department. Work performed by the Contractor at its own expense will not be eligible for fuel price adjustments. B. Categories of Bid Items. The following fuel usage rates for the applicable items, as determined, will be used to determine fuel price adjustments:
Item Description Categories Fuel Usage Rate English Gal/Unit
Fuel Usage Rate Metric
Gal/Unit Excavation including topsoil 0.29 CY 0.38 m3 Excavation – Rock (must be specifically identified as such in contract)
0.39 CY 0.51 m3
Borrow 0.29 CY 0.38 m3 Base 0.63 Ton 0.69 t Surface treatments including sealcoats 0.02 SY; 1.47 Ton 0.0167 m2; 1.62 t Concrete Pavements 0.03 SY per inch of
depth 0.025 m2 per 25mm. of depth
Concrete (all concrete paid by the CY or m3)
0.98 CY 1.27 m3
Plantmix pavements 2.6 Ton 2.86 t Piledriving 0.12 gal per ft 0.39 gal per m Rotomilling / Pulverizing / Mixing 0.02 SY per inch of
C. Fuel Index. A current fuel index (CFI) will be established by the Department for each month. The CFI will be the price of No. 2 diesel fuel, as reported in Oil Price Information Services for the first Monday of the month.
The base fuel index (BFI) will be the CFI for the month the contract was awarded.
D. Computing the Fuel Price Adjustment. If the ratio of CFI/BFI falls between 0.80 and 1.20 inclusive, no fuel adjustment will be made for that pay estimate. If the ratio is less than 0.80 a credit to the Department will be computed. If the ratio is greater than 1.20,
90
additional payment to the Contractor will be computed. Credits and payments are computed as follows:
a. The quantity of work done for each pay estimate for the contract items identified in Section B is identified from the pay estimate.
b. The gallons of fuel used for that pay estimate are computed for each of the contract items identified in Section B by applying the unit fuel usage factors categorized in Section B to the quantity of work performed.
c. The total gallons (Q) of fuel used for that pay estimate will be summed for the applicable contract items, as determined, in Section B.
d. The Fuel Price Adjustment credit or payment is computed from the following formulas:
Contractor Payment: FA = ((CFI/BFI)-1.20) x Q x BFI Department Credit: FA = ((CFI/BFI)-0.80) x Q x BFI Where: FA = Fuel Price Adjustment
CFI = Current Fuel Index BFI = Base Fuel Index Q = Total gallons of fuel used for the pay estimate
E. Basis of Payment. A Fuel Price Adjustment payment to the Contractor will be made as a dollar amount for each pay estimate. A Fuel Price Adjustment credit to the Department will be deducted as a dollar amount for each pay estimate from any sums due to the Contractor.
F. Final Fuel Price Adjustment: Upon completion of the work under the contract, any difference between the estimated quantities and the final quantities will be determined. An average CFI, calculated from the CFI for all the pay estimates that the fuel price adjustment was applied, is used in accordance with the procedure set forth in Section D. A final fuel price adjustment will be made on the final estimate.
91
Appendix F
Excerpt from NDOTs’ 2001 Standard Specifications The following is an excerpt from NDOTs’ 2001 Standard Specifications for Road and Bridge Construction describing our specifications for fuel escalation: 109.05 Fuel Escalation. The Fuel Escalation Clause, as described herein, may be enacted when requested by the Contractor or deemed necessary by the Department. Enactment of the Fuel Escalation Clause will only be considered when the increase or decrease of the “Contract Price” for fuel as defined herein exceeds 25%. The use of the price adjustment provisions developed for the Fuel Escalation Clause are intended to minimize the cost effects of price uncertainty to the Contractor and the Department, for fuel used in the construction of this contract. The price adjustment provisions are not intended to compensate the Contractor for what would be considered normal day-to-day fluctuations or seasonal changes. The price adjustment provisions are not intended to serve as a guarantee for full compensation for fuel price fluctuations but are intended to provide for a sharing, by the Department, in a portion of the Contractor’s risk which could result from unusual price fluctuations. The price adjustment provisions do not serve to relieve the Contractor of risks associated with fluctuation in prices beyond the amount adjusted by the provisions. If the Fuel Escalation Clause is activated, the clause will apply from the period of time the unusual price for fuel began, until the end of the contract. Fuel Escalation Clause Contract fuel costs will be adjusted upward or downward on a bi-weekly basis. To accomplish this adjustment the Department will determine, for each contract, a “Fuel Factor Percentage” that represents an estimated percent of fuel cost by type of construction. The “Fuel Factor Percentage” will be applied to each bi-weekly progress payment balance due (excluding payments for stockpiled materials) to determine a “Bi-weekly Fuel Cost.” The bi-weekly fuel adjustment shall be calculated by comparing a “Contract Price” to an “Adjustment Price” to determine a percent of increase or decrease. The adjustment will be determined by the Department using the average diesel (No. 2 fuel oil) price postings for Reno and Las Vegas as provided by Oil Price Information Services. The method for calculating the “Bi-weekly Fuel Adjustment” will be as described in the following paragraphs: (a) Fuel Factor Percentage (Ffp). The “Fuel Factor Percentage” (Ffp) will be an estimated fuel factor as a percentage of cost by type of construction as determined by the Department. The “Fuel Factor Percentage” will be specified in the Special Provisions. (b) Bi-Weekly Fuel Cost (Bfc). The “Bi-Weekly Fuel Cost” (Bfc) will be the contract bi-weekly progress payment balance due (excluding payments for stockpiled materials) multiplied by the “Fuel Factor Percentage.”
92
(c) Base Price (Bp). The “Base Price” (Bp) for fuel will be determined weekly using the prices posted on Monday of each week. (d) Contract Price (Cp). The “Contract Price” (Cp) for fuel will be established for the week during which the bid opening is held. The “Contract Price” will be determined using the “Base Price” of fuel for the week of the bid opening averaged with the “Base Price” of fuel recorded for the previous three weeks. (e) Adjustment Price (Ap). The “Adjustment Price” (Ap) will be the average of the “Base Prices” recorded during the bi-weekly progress payment period. (f) Compensation Formula. The compensation payable as part of each bi-weekly progress payment will be subject to increase or decrease in accordance with the following provisions for fuel price fluctuations exceeding 25%. The bi-weekly fuel adjustment will be determined in accordance with the following formula: For an increase in fuel adjustment prices that exceed 25% of the “Contract Price” (Cp):
A = (Ap/Cp – 1.25)* Bfc For a decrease in fuel adjustment prices that exceed 25% of the “Contract Price” (Cp):
A = (0.75 – Ap/Cp)* Bfc Where: A=Bi-weekly fuel adjustment in dollars rounded to the nearest dollar.
(g) Compensation Adjustment. The adjustment in compensation for fuel shall also be subject to the following:
1. Payment of compensation provided herein will be made as part of the progress payment. The Contractor shall be liable to the state for decreased compensation adjustments and the Department may deduct the amount thereof from any monies due or that may become due the Contractor.
1. The maximum adjustment allowed under the terms of this specification occurs when the “Adjusted Price” exceeds the “Contract Price” by 75%. The Department reserves the right to cancel the contract whenever the adjustment exceeds 75%. The contract may be canceled in part or in whole by the Department. If the Department elects to cancel the contract, in part or in whole, price adjustments shall not be allowed for other than major bid items. Adjustments to major bid items shall be in accordance with Subsection 104.02.
The following is an excerpt from NDOTs’ Standard Specifications pull sheets that modify our specifications for fuel escalation described above.
93
109.05 Fuel Escalation. The Fuel Escalation Clause is not in effect for this contract, therefore this Subsection of the Standard Specifications is hereby deleted. Delete for construction estimate greater than $250,000
(a) Fuel Factor Percentage (Ffp). The Department has established a Fuel Factor Percentage@ of % for this contract. The following is an excerpt from NDOTs’ 2001 Standard Specifications for Road and Bridge Construction describing our specifications for asphalt escalation: 401.05.02 Asphalt Escalation. The use of the price adjustment provisions as developed and implemented herein are intended to minimize the cost effects of price uncertainty to the Contractor and the Department for “Asphalt Cement” used in the construction of the contract. The price adjustment provisions are not intended to serve as a guarantee for full compensation for “Asphalt Cement” price fluctuations but are intended to be a sharing, by the Department, in a portion of the Contractor’s risk which could result from potentially volatile price fluctuations that might occur throughout the duration of the contract. The price adjustment provisions do not serve to relieve the Contractor of risks associated with fluctuation in prices beyond the amount adjusted by the provisions. This adjustment shall be full compensation for any and all price fluctuations, including but not limited to taxes, transportation, and delays. The price adjustment provisions are only applicable to “Asphalt Cement”; they are not applicable to liquid asphalt or emulsified asphalt. The term “Asphalt Cement” as used herein is applicable to AC grades, AC-20P, and PG grades as specified in Subsection 703.03.02. The progress payment will be adjusted upward or downward, as calculated by the “Total Bi-Weekly Adjustment.” These adjustments will be determined by the Department using price posting for crude oil provided by Oil Price Information Services and AMOCO Crude Oil Price Bulletins. The sources used by the Department to determine the crude oil price at any given time will be the average of the price postings for Midway Sunset Crude, Buena Vista Crude, Utah Black Wax and West Texas & New Mexico Sour. The adjustment will be made by comparing a “Basic Materials Index” to a “Bi-Weekly Materials Adjustment Index.” The method for making this comparison is described in the following paragraphs: (a) A “Basic Materials Index” will be determined by the Department on a weekly basis. The “Basic Materials Index” in effect for the week a contract bid opening occurs will be the “Basic Materials Index” for that contract. The “Basic Materials Index” shall be arrived at by averaging the Monday posting of the current week and the Monday posting of the three previous weeks. The “Basic Material Index” price for “Asphalt Cement” will be available on an informational basis to interested parties but said prices shall not be available prior to the first regular business day of the week of the bid opening. The price may be obtained by contacting the Construction Division in the Department’s General Headquarters, 1263 S. Stewart Street, Carson City, Nevada 89712, phone (775) 888-7460.
94
(b) During the time that the “Asphalt Cement” is paid for on this contract, the Department shall maintain crude oil price postings to be used to obtain a “Bi-Weekly Materials Adjustment Index.” The “Bi-Weekly Materials Adjustment Index” shall be arrived at by averaging the Monday posting of the current week and the Monday posting of the three previous weeks and shall be compared with the “Basic Materials Index” price to determine a “Bi-Weekly Material Price Adjustment.” (c) The compensation payable for said “Asphalt Cement” will be subject to increase or decrease in accordance with the following provisions for “Asphalt Cement” price fluctuations exceeding 20%. The adjustment in compensation will be determined in accordance with the following formula for “Asphalt Cement” included in the progress payment: Total Bi-Weekly Adjustment = AQ For an increase in the Bi-Weekly Materials Adjustment Index exceeding 20% of the Basic Materials Index: A = [Bp—Bi (1.20)]* F For a decrease in the Bi-Weekly Materials Adjustment Index exceeding 20% of the Basic Materials Index: A = [Bi (.80)—Bp]* F Where: A =“Bi-Weekly Material Price Adjustment” in dollars per metric ton (ton)
of “Asphalt Cement” rounded to the nearest dollar.
Bi =“Basic Materials Index” for the week in which the bid opening for the contract occurred (Dollars per barrel of crude oil). This is calculated as noted in paragraph (a) above.
Bp =“The Bi-Weekly Materials Adjustment Index” which pertains to the period during which the quantity subject to adjustment is included in the progress payment (Dollars per barrel of crude oil). This is calculated as noted in paragraph (b) above.
F =6.2 barrels of crude oil per metric ton (5.6 barrels of crude oil per ton) of “Asphalt Cement.”
Q =Quantity in metric tons (tons) of “Asphalt Cement” included in the progress payment.
(d) The adjustment in compensation shall also be subject to the following:
1. The compensation adjustments provided herein, will be shown separately on the progress payment. The Contractor shall be liable to the State for decreased compensation adjustments and the Department may deduct the amount thereof from any monies due or that may become due the Contractor.
95
2. The maximum adjustment allowed under the terms of this specification occurs when the “Bi-Weekly Materials Adjustment Index” exceeds the “Basic Materials Index” by 75%. The Department reserves the right to cancel the contract whenever the 75% adjustment is exceeded. The contract may be canceled in part or in whole by the Department. If the Department elects to cancel the contract, in part or in whole, price adjustments shall not be allowed for other than major bid items. Adjustments to major bid items shall be in accordance with Subsection 104.02
(e) The contract unit price for “Asphalt Cement” will be considered to include the initial cost of the “Asphalt Cement” and all costs for furnishing, hauling, handling, spreading, and mixing of the material as required. Changes in the cost of “Asphalt Cement” that occur between the date of bid opening and the date the material is paid for will be addressed using the adjustment provisions previously described. The following is an excerpt from NDOTs’ Standard Specifications pull sheets that modify our specifications for asphalt escalation described above.
401.05.02 Asphalt Escalation. The Asphalt Escalation Clause is not in effect for this contract, therefore this Subsection of the Standard Specifications is hereby deleted. In if less than 450 metric tons (500 tons) of total asphalt cement on contract
This Subsection of the Standard Specifications is in effect for this contract with the following modifications: Delete if no asphalt escalation
Asphalt Cement@ is not a bid item on this contract and is not included in the progress payment, however, compensation or deduction will be made for Asphalt Cement@ price fluctuations as specified therein.
The value for AQ@ in subparagraph (c) is hereby deleted and the following substituted therefore:
Q = Quantity in metric tons (tons) of Asphalt Cement@ that were used
on the project during the progress payment period. The quantity, in metric tons (tons), of Asphalt Cement@ will be calculated using the approved mix design and the following formula:
Q = Wet tons used x % Asphalt / 100
[1 + (% Asphalt + % Mineral Filler) / 100] The following is an excerpt from NDOTs’ Standard Specifications pull sheets that define NDOTs’ steel escalation clause, which was established in 2004.
109.09 Steel Escalation. The Steel Escalation Clause, as described herein, may be enacted when requested by the Contractor or deemed necessary by the Department. Enactment of the Steel Escalation Clause will only be considered when the
96
"Adjustment Price" is more than a 10% increase or decrease from the ABenchmark Price@ for steel as defined herein.
The use of the price adjustment provisions developed for the Steel Escalation Clause are intended to minimize the cost effects of price uncertainty to the Contractor and the Department, for most steel used in the construction of this contract. The price adjustment provisions are not intended to compensate the Contractor for what would be considered normal day-to-day fluctuations or seasonal changes. The price adjustment provisions are not intended to serve as a guarantee for full compensation for steel price fluctuations but are intended to provide for a sharing, by the Department, in a portion of the Contractor's risk which could result from unusual price fluctuations. The price adjustment provisions do not serve to relieve the Contractor of risks associated with fluctuation in prices beyond the amount adjusted by the provisions.
If the Steel Escalation Clause is activated, the clause will apply from the period of time the unusual price for steel began, until the end of the contract.
The price adjustment provisions will only apply to reinforcing steel, structural steel, overhead sign structures, steel piling, steel poles for luminaires and traffic signals, dowel bars and tie bars for concrete pavement, and beam elements and metal posts for guardrail. No other steel materials are covered by this price adjustment provision. Edit items per contract
Steel Escalation Clause
The progress payment will be adjusted upward or downward as calculated by the "Steel Cost Adjustment." The adjustment will be determined by the Department using the average of the 20-City Average for Grade 60, #4 Reinforcing Bars@ and Hot-Rolled Carbon Steel Plate@ from Engineering News-Record, published in the fourth weekly publication of the month. The adjustment will be calculated by comparing the "Benchmark Price" to the "Adjustment Price."
The method for calculating the "Steel Cost Adjustment" will be as described in the following paragraphs:
(a) Benchmark Price (BP). The Benchmark Price@ (BP) will be the current published price at the time bids are opened.
The "Benchmark Price" for steel will be available on an informational basis to interested parties. The price may be obtained by contacting the Construction Division in the Department's Headquarters, 1263 South Stewart Street, Carson City, NV 89712, Phone No. (775) 888-7460.
(b) Adjustment Price (AP). The Adjustment Price@ (AP) will be the
published price for the month that the steel is shipped from the mill.
The Contractor shall submit copies of the mill or warehouse invoices, showing the shipping dates and quantity shipped, for all steel referenced above. These invoices shall cover all steel materials to be placed. The Contractor shall also submit documentation showing where the steel will
97
be placed and the theoretical waste of the material in the fabrication process.
(c) Compensation Formula. The compensation payable as part of each bi-
weekly progress payment will be subject to increase or decrease in accordance with the following provisions for steel price fluctuations exceeding 10%. The bi-weekly steel adjustment will be determined in accordance with the following formula:
For an increase in steel adjustment prices that exceed 10% of the "Benchmark Price" (BP):
A = BP(1.10)] * Q/100?[AP -
For a decrease in steel adjustment prices that exceed 10% of the "Benchmark Price" (BP):
A = - AP] * Q/100?[(0.90)BP
Where: A = "Steel Cost Adjustment" in dollars rounded to the
nearest dollar AP = "Adjustment Price" in dollars per 100 pounds BP = "Benchmark Price" in dollars per 100 pounds Q = Quantity of steel material in pounds
(d) Compensation Adjustment. The adjustment in compensation for steel
shall also be subject to the following:
1. Payment of compensation provided herein will be made as part of the progress payment. The Contractor shall be liable to the state for decreased compensation adjustments and the Department may deduct the amount thereof from any monies due or that may become due the Contractor.
2. The maximum adjustment allowed under the terms of this
specification occurs when the "Adjustment Price" exceeds the "Benchmark Price" by 75%.
The Department reserves the right to cancel the contract whenever the adjustment exceeds 75%. The contract may be canceled in part or in whole by the Department. If the Department elects to cancel the contract, in part or in whole, price adjustments will not be allowed for other than major bid items. Adjustments to major bid items will be in accordance with Subsection 104.02.
3. The contract unit prices will be considered to include the initial
cost of the steel used and all costs for furnishing, hauling, manufacturing, fabrication, shipping, storage, etc. of the material as required. Changes in the cost of steel that occur between the date of bid opening and the date the material is shipped from the
98
mill will be addressed using the adjustment provisions previously described.
4. No steel cost adjustments will be made for any items
manufactured from steel having a mill shipping date prior to the bid date of the contract. The maximum quantity of steel material that this provision will apply to will be theoretical plan quantity shown in the plans or as determined.
BIBLIOGRAPHY 1. Anderson, Stuart D., and Byron C. Blaschke. NCHRP Synthesis 331 Statewide Highway Letting Program Management. Texas Transportation Institute, 2004. 2. South Carolina Department of Transportation Standard Specifications for Highway Construction. 2000. 3. Bell, Lansford C., and Charles O. Skipper. Long Range Program Cost Estimating Methodology for SCDOT. Diss. Clemson Univ., 2003. 4. "Guidelines for Preparing an Engineer's Estimate." (2004). 13 Sept. 2005 <http://www.fhwa.dot.gov/programadmin/contracts/ta508046.htm>. 5. Schexnayder, Cliff J., Sandra L. Weber, and Christine Fiori. Project Cost Estimating A Synthesis of Highway Practice. Diss. Arizona State Univ., 2003. 6. "Oil Prices Can's Keep Contractors Down." 17 Sept. 2005 <http://www.asphalt.com/TEA/oilprice.html>. 7. “Pilot Program - Publish Range for Engineers Estimate.” 16 March 2006 < http://www.udot.utah.gov/index.php/m=c/tid=616/item=20356/d=full> 8. “Engineer’s Construction Cost Estimate.” NJDOT Design Manual for Bridges and Structures: 1.38-1. <http://www.state.nj.us/transportation/eng/documents/BDMM/pdf/ bmsec38.pdf> 9. “Engineer’s Estimate.” Maryland State Highway Administration July 2006:104. <http://www.sha.state.md.us/businesswithsha/bizStdsSpecs/desManualStdPub/ publicationsonline/oots/TCDDM/pdfs/part5.pdf> 10. “Management of the Engineer’s Estimate.” 30 Jan. 2004 < http://www.oregon.gov/ODOT/HWY/SEOPL/docs/guides/ee-policy.pdf> 11. Bradfield, George. “Estimate Preparation: Cost Based Estimates and Their Value.” < http://tea.cloverleaf.net/NewsLetters/Estimate%20Preparation.htm> 12. Hancher, Donn E. “Contracting Methods for Highway Construction” TR News. Nov. 1999. <www.trb.org/publications/millennium/00023.pdf>
100
13. “The New Ontario Bridge Management System.” TRB Transportation Research Circular 498. < pubsindex.trb.org/document/view/default.asp?lbid=684665> 14. “Transportation Construction Contracts.” <www.trb.org/publications/millennium/00121.pdf>