105
Best Practices HPC and introduction to the new system FRAM Ole W. Saastad, Dr.Scient USIT / UAV / ITF / FI Sept 6 th 2016 Sigma2 - HPC seminar

Best Practices HPC and introduction to the new system FRAM
Ole W. Saastad, Dr.Scient
USIT / UAV / ITF / FI
Sept 6th 2016
Sigma2 - HPC seminar

Universitetets senter for informasjonsteknologi
Introduction
• FRAM overview
• Best practice for new system, requirement for application
• Develop code for the new system
– Vectorization

Universitetets senter for informasjonsteknologi
Strategy for FRAM and B1
• FRAM with Broadwell processors
– Take over for Hexagon and Vilje
– Run parallel workload in 18-24 mnts.
– Switch role to take over for Abel & Stallo
– Run throughput production when B1 comes on line

Universitetets senter for informasjonsteknologi
Strategy for FRAM and B1
• B1 massive parallel system
– Processor undecided
• AMD ZEN, OpenPOWER, ARM, KNL, Skylake
• Strong focus on vectors for floating point
• Performance is essential
– Will run the few large core count codes
• Typical job will used 10k+ cores
• Interconnect InfiniBand or Omnipath

Universitetets senter for informasjonsteknologi
FRAM overall specs
• Broadwell processors
– AVX2 just like Haswell, including FMA
• Island topology
– 4 islands
– approx 8k cores per island
• Close to full bisection bandwidth within the island
• Run up to 8k core jobs nicely
• Struggle with jobs requiring > 8k cores
Universitetets senter for informasjonsteknologi
FRAM overall specs
• 1000 compute nodes, 32000 cores
• 8 large memory nodes, 256 cores
• 2 very large memory nodes, 112 Cores
• 8 accelerated nodes, 256 Cores + CUDA cores
• A total of 32624 cores for computation ≈ 1 Pflops/s
• 18 watercooled racks

Universitetets senter for informasjonsteknologi
FRAM overall specs
• 2.4 PiB of local scratch storage, DDN EXAScaler
•
• LUSTRE file system /work (and local software)
• /home and /project mounted from Norstore
• Expected performance is ∼ 40 GiB/s read / write

Universitetets senter for informasjonsteknologi
Lenovo nx360m5 direct water cooled

Universitetets senter for informasjonsteknologi
Compute nodes – processor
• Dual socket motherboard
• Intel Broadwell E5-2683v4 processors
• 2.1 GHz, 16 cores, 32 threads
• Cache: L1 64kiB , L2 256 kiB , L3/last level 40 MiB
• AVX2 (256 bits vectors), FMA3, RDSEED, ADX

Universitetets senter for informasjonsteknologi
Compute nodes - memory
• Single memory controller per socket
• 4 memory channels per socket
• 8 x 8G dual ranked 2400 MHz DDR4 memory
• Total of 64 GiB Cache coherent memory in 2 NUMA nodes
• Approx 120 GiB/s bw (7.5 GiB/s per core)

Universitetets senter for informasjonsteknologi
Compute nodes - Interconnect
• Mellanox Connect X-4 EDR (100 Gbits/s) InfiniBand
• PCIe3 x 16 , 15.75 GiB/s per direction
• Close to 10 GiB/s bw (0.625 GiB/s per core)
• Island topology

Universitetets senter for informasjonsteknologi
Large memory nodes
• Dual Intel E5-2683v4 processors
• 8 x 32 G dual ranked 2400 MHz DDR4 memory
• Total of 512 GiB cache coherent memory in 2 NUMA nodes
• 1920 GiB Solid State Disk as local scratch storage

Universitetets senter for informasjonsteknologi
Very large memory nodes
• Quad Intel E7-4850v3 processors, 14 cores, 2.2 GHz
• 56 cores in total
• 96 x 64 G LRDIMM Memory
• Total of 6 TiB cache coherent memory in 4 NUMA nodes
• 14 TiB Disk as local scratch storage

Universitetets senter for informasjonsteknologi
Accelerated nodes
• Dual Intel E5-2683v4 processors
• 8 x 16 G dual ranked 2400 MHz DDR4 memory
• Total of 128 GiB Cache coherent memory in 2 NUMA nodes
• 2 x NVIDIA K80 cards (Most probably PASCAL based cards will be installed, TBD), full CUDA support.
Universitetets senter for informasjonsteknologi
Local IO
• 2 x DDN EXAScalers
• LUSTRE file system with native InfiniBand support
• InfiniBand RDMA
• 2.45 PiB of storage
• 49.9 GiB/s sequential write
• 52.9 GiB/s sequential read
• Provide /work and cluster wide software
• NO backup

Universitetets senter for informasjonsteknologi
Remote IO
• Provided by Norstore
• Expected to be LUSTRE
• Performance estimate is about 40 GiB/s read/write
• Provide
– /home
– /projects
• Full backup, snapshots, redundancy
• A range of file access services
– POSIX, object storage, etc

Universitetets senter for informasjonsteknologi
Software
• Intel parallel studio
– Compilers and libraries
– Tuning and analysis tools
– Intel MPI
• GNU tools
– Compilers, libraries and debuggers
– Common GNU utilities

Universitetets senter for informasjonsteknologi
Software
• Message Passing Interface, MPI
– Intel
– OpenMPI
• Mellanox InfiniBand stack
– Mellanox services for collectives
– OpenMPI ok, intelMPI ??

Universitetets senter for informasjonsteknologi
Software
• SLURM queue system
– Minor changes from today’s user experience
• Modules
– Expect changes, work in progress
• User environment
– Could be a mode for scientists and a mode for developers, undecided.

Universitetets senter for informasjonsteknologi
Support
• RT tickets as before
• Tickets handled by Sigma2 and metecenter members
• Advanced user support as before
• Training will be arranged by Sigma2

Universitetets senter for informasjonsteknologi
Best Practice for HPC
• How to utilize the system in a best possible way
• How to schedule your job
• How to allocate resources
• How to do Input and Output
• How to understand your application

Universitetets senter for informasjonsteknologi
Understand your application
• The following is valid for any application
• These tools can be used on any application
• Optimal use of the system is important when resources are limited
• Sigma2 might require performance review

Universitetets senter for informasjonsteknologi
Understand your application
• Memory footprint
• Memory access
• Scaling – threads, shared memory
• Scaling – MPI, interconnect, collectives
• Vectorization
• Usage of storage during run
• Efficiency as a fraction of theoretical performance

Universitetets senter for informasjonsteknologi
Step by step application insight
• Starting with simple tools
– time
– top
– iostat
– strace
– MPI snapshop
– Intel SDE
• Progressing with tools like performance reports
• Finishing with Intel vector advisor, amplifier and tracer

Universitetets senter for informasjonsteknologi
Time spent and memory
• Timing is a key in performance tuning
• /usr/bin/time
• Man time
• Very simple syntax : /usr/bin/time ./prog.x

Universitetets senter for informasjonsteknologi
Time spent and memory
• Default format gives:
%Uuser
%Ssystem
%Eelapsed
%PCPU (%Xtext+%Ddata %Mmax)k
%Iinputs+%Ooutputs
(%Fmajor+%Rminor)pagefaults
%Wswaps

Universitetets senter for informasjonsteknologi
Time spent and memory
• %Uuser
– Total number of CPU-seconds that the process spent in user mode.
%Ssystem
– Total number of CPU-seconds that the process spent in kernel mode.
%Eelapsed
– Elapsed real time
(in [hours:]minutes:seconds).

Universitetets senter for informasjonsteknologi
Time spent and memory
• %PCPU (%Xtext+%Ddata %Mmax)k
– Percentage of the CPU that this job got, computed as (%U + %S) / %E.
%Iinputs+%Ooutputs
– Number of file system inputs by the process.
(%Fmajor+%Rminor)pagefaults
%Wswaps

Universitetets senter for informasjonsteknologi
Time spent and memory
• %Fmajor pagefaults
– Number of major page faults that occurred while the process was running. These are faults where the page has to be read in from disk.

Universitetets senter for informasjonsteknologi
Time spent and memory
• %Rminor pagefaults
– Number of minor, or recoverable, page faults. These are faults for pages that are not valid but which have not yet been claimed by other virtual pages. Thus the data in the page is still valid but the system tables must be updated.
–

Universitetets senter for informasjonsteknologi
Time spent and memory
• %Wswaps
– Number of times the process was swapped out of main memory.
Universitetets senter for informasjonsteknologi
Time spent and memory
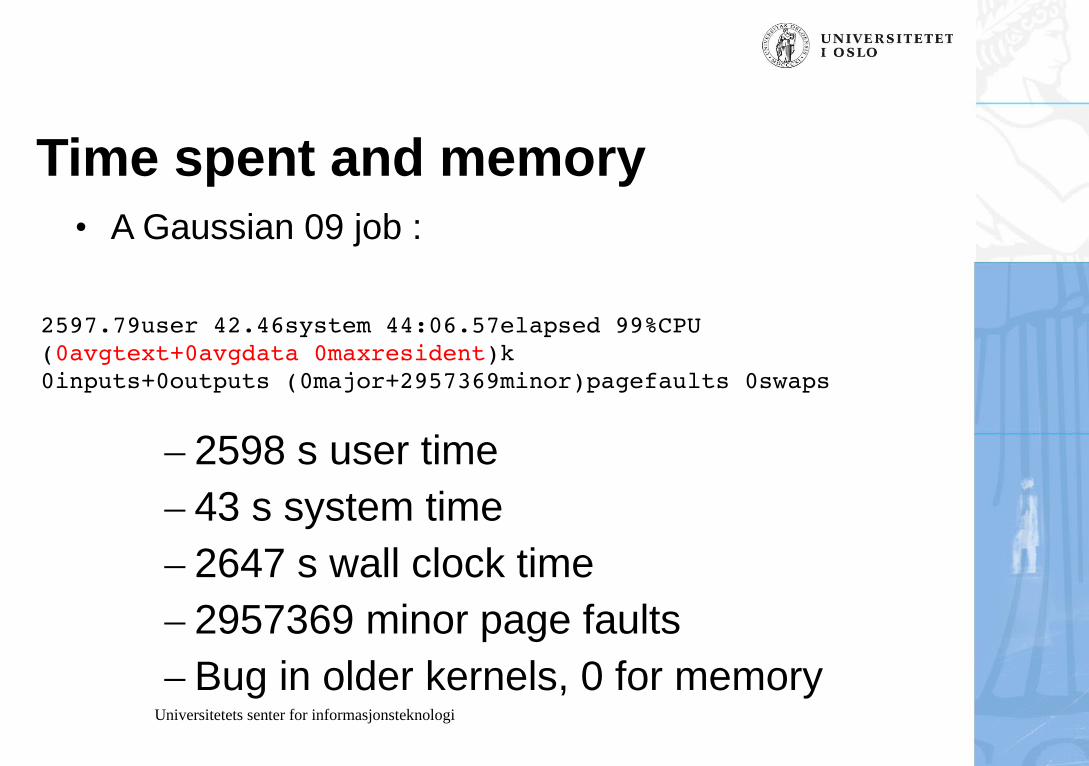
• A Gaussian 09 job :
– 2598 s user time
– 43 s system time
– 2647 s wall clock time
– 2957369 minor page faults
– Bug in older kernels, 0 for memory
2597.79user 42.46system 44:06.57elapsed 99%CPU (0avgtext+0avgdata 0maxresident)k 0inputs+0outputs (0major+2957369minor)pagefaults 0swaps

Universitetets senter for informasjonsteknologi
Time spent and memory
• An evolution run :
– Maximum resident memory : 220 MB
– Kernel : 3.10.0-327.28.3.el7.x86_64
13.89user 1.63system 1:27:26elapsed 0%CPU (0avgtext+0avgdata 220352maxresident)k1768848inputs+17336outputs (462major+87335minor)pagefaults 0swaps

Universitetets senter for informasjonsteknologi
Memory, cache and data
• While you can address and manipulate a single byte,
• The smallest amount of data transferred is 32 or 64 bytes
• Do not waste data in cachelines
• Do all the work on data while they are in the cache
• Running from memory is equal to a clock of 10 MHz

Universitetets senter for informasjonsteknologi
Memory and page faults
• Major and minor page faults
– Remember output from /usr/bin/time ?
2597.79user 42.46system 44:06.57elapsed 99%CPU (0avgtext+0avgdata 0maxresident)k 0inputs+0outputs (0major+2957369minor)pagefaults 0swaps

Universitetets senter for informasjonsteknologi
Minor page fault
• Minor page faults are unavoidable
• Page is in memory, just a memory admin by OS
• Little cost
• A huge number of these is often a sign of ineffective programming

Universitetets senter for informasjonsteknologi
Memory and page faults
• Major page faults means to little memory for your working set!
• Showstopper !
• Avoid at all cost, slows down your system to halt
• Submit job on a node/system with more memory!

Universitetets senter for informasjonsteknologi
Memory footprint
• “top” is your friend
• Man top will give help
• top is the mostly used tool for memory monitoring

Universitetets senter for informasjonsteknologi
Memory footprint
top - 14:25:07 up 5 days, 9 min, 3 users, load average: 32.86, 24.14, 11.82Tasks: 427 total, 3 running, 424 sleeping, 0 stopped, 0 zombieCpu(s):100.0%us, 0.0%sy, 0.0%ni, 0.0%id, 0.0%wa, 0.0%hi, 0.0%si, 0.0%stMem: 264353776k total, 260044844k used, 4308932k free, 186688k buffersSwap: 25165812k total, 0k used, 25165812k free, 624240k cached
PID USER PR NI VIRT RES SHR S %CPU %MEM TIME+ COMMAND 13857 olews 25 0 246g 245g 768 R 3197 97.5 198:10.13 stream.large.x 8573 olews 15 0 12848 1336 800 R 1 0.0 0:10.22 top

Universitetets senter for informasjonsteknologi
Memory footprint
Mem: 264353776k total, 260044844k used, 4308932k free, 186688k buffersSwap: 25165812k total, 0k used, 25165812k free, 624240k cached
Mem: Total amount of installed physical memory on System in this case 252 GigaBytes
Of which 248 GigaByes are used by user processes 180 MB is used by buffers and 4.11 GB are free
Swap: None of the swap memory is used

Universitetets senter for informasjonsteknologi
Memory footprint
PID USER PR NI VIRT RES SHR S %CPU %MEM TIME+ COMMAND 13857 olews 25 0 246g 245g 768 R 3197 97.5 198:10.13 stream.large.x 8573 olews 15 0 12848 1336 800 R 1 0.0 0:10.22 top
My application is using :
Virtual memory 246 GigaBytesResident memory : 245 GigaBytes
Universitetets senter for informasjonsteknologi
Memory footprint
• VIRT - Virtual memory
The total amount of virtual memory used by the task. It includes all code, data and shared libraries plus pages that have been swapped out.
This is the total footprint of everything, and can be regarded as maximum possible size.

Universitetets senter for informasjonsteknologi
Memory footprint
• RSS - Resident memory
The non-swapped physical memory a task has used.RES = CODE + DATA
When a page table entry has been assigned a physical address, it is referred to as the resident working set.
This the important number, this is what is actually used. Large unused data segment might be swapped out and not reside in physical memory.

Universitetets senter for informasjonsteknologi
More on 'top'
• S – Status which can be one of :
– 'D' = uninterruptible sleep
– 'R' = running
– 'S' = sleeping
– 'T' = traced or stopped
– 'Z' = zombie
D is not good at all, it means disk waitZ is very bad, they cannot be killed, even by kill -9
Universitetets senter for informasjonsteknologi
More on 'top'
• % CPU
– The task's share of the elapsed CPU time since the last screen update, expressed as a percentage of total CPU time.
• % MEM
– A task's currently used share of available physical memory
• TIME
–
• COMMAND

Universitetets senter for informasjonsteknologi
More on 'top'
TIME
– Total CPU time the task has used since it started.
• COMMAND
– Display the command line used to start a task or the name of the associated program.

Universitetets senter for informasjonsteknologi
Input Output during run
• The /work is fast and should be used during runs
• /home and /projects are mounted from Norstore
• Stage data to /work before runs
• Local node storage can be used in special cases

Universitetets senter for informasjonsteknologi
Input Output during run
• How mush IO is done durnign a run ?
• How many files are open ?
• How is data in files accessed ?

Universitetets senter for informasjonsteknologi
Open files
• Which files have my application opened ?
– /usr/sbin/lsof is your friend
– lsof lists all open files
– lsof
• Options for selecting output
• Type of files
• User
• Many many more , read man page

Universitetets senter for informasjonsteknologi
Open files - lsof examples
• lsof -u olews
COMMAND PID USER FD TYPE DEVICE SIZE NODE NAMExterm 9118 olews cwd DIR 0,28 32768 37087057 /xanadu/home/olews/benchmark/Streamxterm 9118 olews rtd DIR 8,1 4096 2 /xterm 9118 olews txt REG 8,1 351464 2850820 /usr/bin/xtermxterm 9118 olews mem REG 8,1 134400 1995244 /lib64/ld-2.5.soxterm 9118 olews mem REG 8,1 1699880 1995245 /lib64/libc-2.5.soxterm 9118 olews mem REG 8,1 23360 1995247 /lib64/libdl-2.5.so
This is only a selection of the quite long output. Tools like grep etc can be handy, but lsof has many options for selectiong output.

Universitetets senter for informasjonsteknologi
Open files - lsof examples
• lsof -c more -a -u olews -d 0-1000
COMMAND PID USER FD TYPE DEVICE SIZE NODE NAMEmore 12316 olews 0u CHR 136,76 78 /dev/pts/76more 12316 olews 1u CHR 136,76 78 /dev/pts/76more 12316 olews 2u CHR 136,76 78 /dev/pts/76more 12316 olews 3r REG 0,28 15088 374577 /xanadu/home/ olews/benchmark/Stream/stream.large.f
This is a selection of the output, just for the utility 'more', only regular files are reported. We want to know what happen to the open fortran source code file.

Universitetets senter for informasjonsteknologi
File IO – what's going on ?
• Open files
– Found using lsof
• IO Operations on open files
– OS calls
• How to look into operations on the open files ?
– Trace OS calls

Universitetets senter for informasjonsteknologi
Random read is your enemy !
• A disk can do about 150 IO operations per sec
– This number is not increasing yearly !
• At record size 1 M this is 150 MB/s – more than the disk can do anyway => random == sequential
• At record size 4k this is 600 kB/s => grind to a standstill ! This is just a Showstopper!
Universitetets senter for informasjonsteknologi
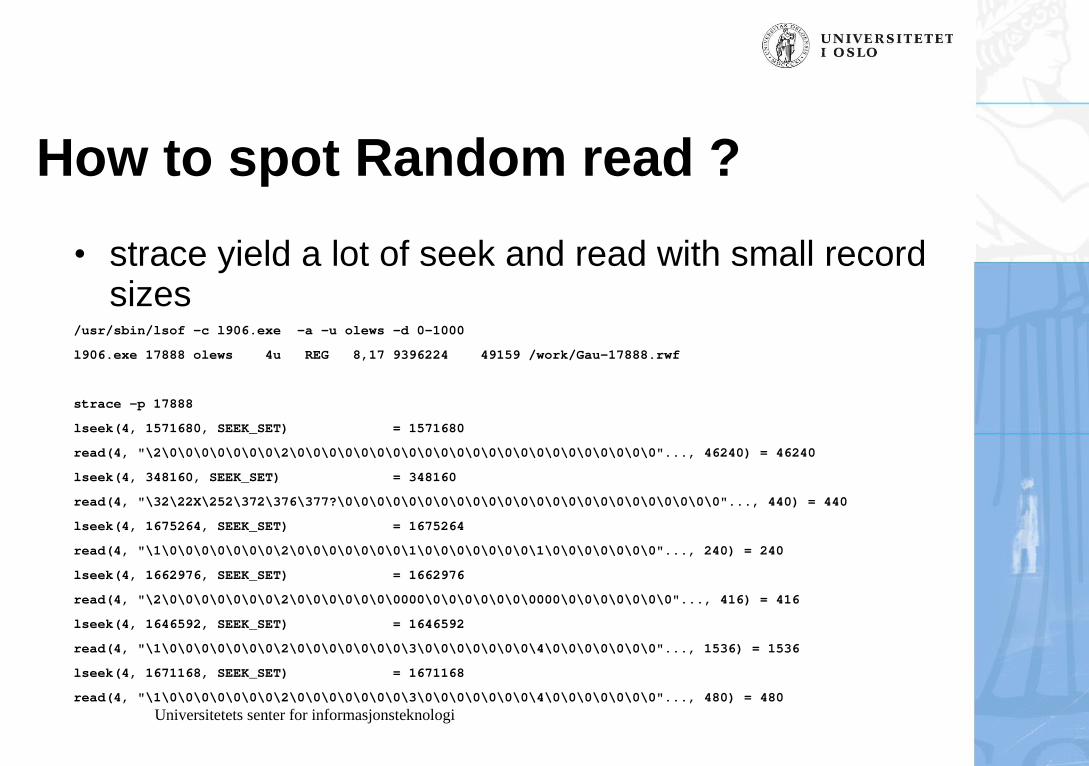
How to spot Random read ?
• strace yield a lot of seek and read with small record sizes
/usr/sbin/lsof -c l906.exe -a -u olews -d 0-1000
l906.exe 17888 olews 4u REG 8,17 9396224 49159 /work/Gau-17888.rwf
strace -p 17888
lseek(4, 1571680, SEEK_SET) = 1571680
read(4, "\2\0\0\0\0\0\0\0\2\0\0\0\0\0\0\0\0\0\0\0\0\0\0\0\0\0\0\0\0\0\0\0"..., 46240) = 46240
lseek(4, 348160, SEEK_SET) = 348160
read(4, "\32\22X\252\372\376\377?\0\0\0\0\0\0\0\0\0\0\0\0\0\0\0\0\0\0\0\0\0\0\0\0"..., 440) = 440
lseek(4, 1675264, SEEK_SET) = 1675264
read(4, "\1\0\0\0\0\0\0\0\2\0\0\0\0\0\0\0\1\0\0\0\0\0\0\0\1\0\0\0\0\0\0\0"..., 240) = 240
lseek(4, 1662976, SEEK_SET) = 1662976
read(4, "\2\0\0\0\0\0\0\0\2\0\0\0\0\0\0\0000\0\0\0\0\0\0\0000\0\0\0\0\0\0\0"..., 416) = 416
lseek(4, 1646592, SEEK_SET) = 1646592
read(4, "\1\0\0\0\0\0\0\0\2\0\0\0\0\0\0\0\3\0\0\0\0\0\0\0\4\0\0\0\0\0\0\0"..., 1536) = 1536
lseek(4, 1671168, SEEK_SET) = 1671168
read(4, "\1\0\0\0\0\0\0\0\2\0\0\0\0\0\0\0\3\0\0\0\0\0\0\0\4\0\0\0\0\0\0\0"..., 480) = 480

Universitetets senter for informasjonsteknologi
Scaling - Speedup
• Run time and core count
• Wall time and cpu time
• Always use wall time for timing
• Record wall time and core count
Universitetets senter for informasjonsteknologi
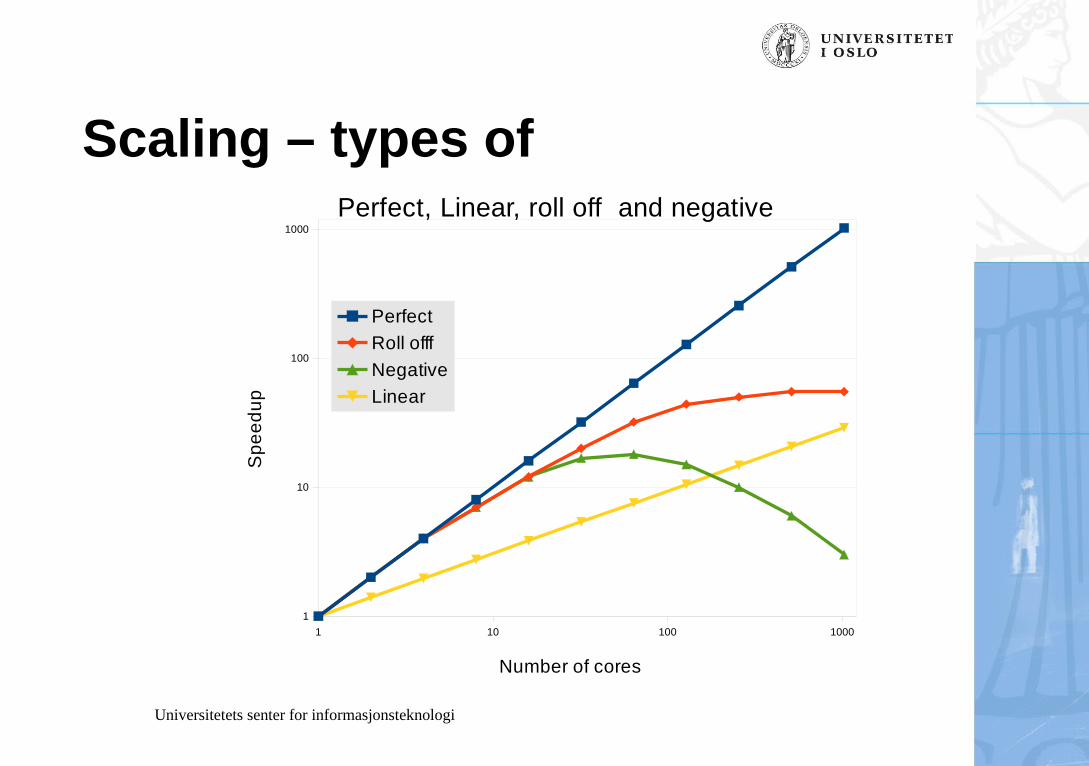
Scaling – types of
1 10 100 1000
1
10
100
1000
Perfect, Linear, roll off and negative
Perfect
Roll offf
Negative
Linear
Number of cores
Sp
ee
du
p

Universitetets senter for informasjonsteknologi
Scaling – wall / run time
4 8 16 32 64
0
50
100
150
200
250
300
350
400
VASP benchmarking
Number of cores
Ru
n tim
e [se
co
nd
s]

Universitetets senter for informasjonsteknologi
Scaling – speedup
4 8 16 32 64
0
2
4
6
8
10
12
14
16
18
Vasp benchmarking
Scaling
Measured
Perfect
Number of cores
Sp
ee
du
p

Universitetets senter for informasjonsteknologi
Scaling
• Perfect scaling
– Scale to a tuning point
– Where does it roll off
– Can it scale to very large core count ?
– 8k cores ?
– You need to know this number when applying for quota !

Universitetets senter for informasjonsteknologi
Scaling
• Linear scaling
– What is the angle of the scaling line ?
– Scale to a tuning point
– Where does it roll off
– Can it scale to very large core count ?
– 8k cores ?
– You need to know this number when applying for quota !

Universitetets senter for informasjonsteknologi
Scaling - Poor scaling
• Roll off or negative
– Can a better interconnect help ?
– Maybe you can rewrite application or change algorithm ?
– Another application ?
– Get help !
– Apply for quota on a throughput system?

Performance report
• Load the performance report module module load perf-reports
• Run your program with perf-reportperf-report mpirun -np 4 bin/bt.B.4.mpi_io_simpleperf-report my-threaded-program.xperf-report my-serial-program.x
• Locate the report filesbt.B.4_4p_2015-04-27_12-24.txtbt.B.4_4p_2015-04-27_12-24.htmlmy-threaded-program.x_4p_2015-04-27_12-24.*

Performance report
• The text file can be read by humans:
Summary: bt.B.4.mpi_io_simple is I/O-bound in this configurationCPU: 41.9% |===|MPI: 4.5% |I/O: 53.6% |====|

Performance report

Performance report
• A performance report is expected to be submittted with applications for quota on FRAM
• Performance report using a typical input data set

MPI Snapshot
• Intel MPI snapshot is a simple tool for MPI analysis
• Link your program with -profile=vt
• mpirun -mps -np 16 ./prog.x
• Human readable report produced

Universitetets senter for informasjonsteknologi
Running applications
• Smart queueing
• Smart job setup
• Scaling
• Effective IO
• Big data handling

Ask only for what you need
• Queue system allocate and prioritise based on your footprint
• Footprint is based on
– number of cores/nodes
– Memory
– Wall time
• Large footprint means longer wait time in queue

Carefully consider the IO load
• /work, /home and /projects file system are unhappy with millions of small files
• If you use millions of temporary files ask for local scratch
• Do not put millions of small files on a parallel file system unless you absolutely need to do so.
• Make an archive with tar or similar

Using archives and not directories
• Python works nicely with archives
def extractFromTarball(self, tarname, filename): tarball = tarfile.open(tarname)) return tarball.extractfile(filename)
tarball = tarfile.open(tarname)filesintarball = tarball.getnames()
tarname="test.tar.gz"f = extractFromTarball(tarname, "foo.txt")foo = f.read()

Effective IO
• How much IO is your application doing ?
• Few large files or millions of small files ?
• Where are the files placed ?
• Copying of remote files ?
• Archiving many files to one large
– Python and Lua works well on archives
• Do the files compress ?
– Not all files compress well

Universitetets senter for informasjonsteknologi
Questions ?
Time for discussion

Universitetets senter for informasjonsteknologi
BREAK !
Universitetets senter for informasjonsteknologi
Application development
• Best practices for application development
• Compiler usage – compiler flags, core generation
• Vectorization
• Threading
• MPI

Compiler usage
• Parallel – 16 to 20 cores in a node
– Vectorisation
– OpenMP
– MPI
• More and more focus on vectorisation

Vector performance Development

Universitetets senter for informasjonsteknologi Copyright © 2015, Intel Corporation. All rights reserved. *Other names and brands may be claimed as the property of others. Optimization Notice
Compiler Auto-VectorizationSIMD – Single Instruction Multiple Data
5/26/20153
• Scalar mode– one instruction produces
one result
• SIMD processing– with SSE or AVX instructions
– one instruction can produce multiple results
+ +
c(:) = a(:) + b(:)
a
b
a+b
+
do i=1,MAX
c(i)=a(i)+b(i)
end do

Programming for the future
• Broadwell has 16 cores and 32 theads
– 256 bits vector unit
– 16 32 bits floats wide
– Fused Multiply add

Programming for the future
• Pure MPI may yield too many ranks
– Large memory demand
• Pure threads may scale weakly
– OpenMP scaleing is often limited
• Hybrid multi threaded MPI
• Small number of MPI rank per node, a number of threads per rank
Programming for the future
• Vectorization vital for performance
– Scalar code perform at 1/16 performance
• OpenMP 4.0 introduces SIMD directives
• All OpenMP programming facilities now apply to SIMD
• Vectorization is made easier with OpenMP, just like threading was made simpler.

Universitetets senter for informasjonsteknologi
Single lane filled = Scalar codeAll lanes filled = vectorized code
This is only 26 lanes,a vector can have 32
Imagine a single file of cars – this is what you have is you run scalar code!!

Universitetets senter for informasjonsteknologi
Speedup with vectorization
• Double precision 64 bit floats
– Broadwell (256 bits vectors) : 4x
– Skylake/KNL (512 bits vector) : 8x
– ARM (2048 bits vector) : 32x
• For single precision these numbers double
– Broadwell : 8x
– Skylake/KNL : 16x

Universitetets senter for informasjonsteknologi
Efficiency check
• How many flops per byte do you perform in your loops ?
• Memory bandwidth is about 100 GiB/s
• Performance is about 1 Tflops/s
• At least 10 flops per byte ➡ 80 flops/double
• Try running a perf test using : a=b, a*b, log a, sin a & a^b (where a and b are 64 bits floats 0 & 1)

Programming for the future
• Vectorization vital for performance
– Scalar code perform at 1/8 or 1/16 performance
• OpenMP 4.0 introduced SIMD directives
• All OpenMP programming facilities now apply to SIMD
• Vectorization is made easier with OpenMP, just like threading was made simpler.

Programming – OpenMP 4.0
• OpenMP 4.0 SIMD
!$omp simd reduction(+:sum) do i = 1,n x = h*(i-0.5) sum = sum + f(x) enddo pi = h*sum

Programming - OpenMP 4.0
• OpenMP 4.0 SIMD
!$omp simd reduction(+:sum) do i = 1,n x = h*(i-0.5) sum = sum + f(x) enddo pi = h*sum

Programming – OpenMP 4.0 • OpenMP 4.0 SIMD
module func_f contains!$omp declare simd f function f(x) real(8) :: f real(8) :: x f = (4/(1+x*x)) end function fend module func_f

Programming - Intel tuning tools
• Compiler – only time the source code is read
• -qopt-report5 -qopt-report-phase=vec
• Read the *.optrpt files !

Universitetets senter for informasjonsteknologi
Vectorization report from compiler
• Compiler optimization report:
• LOOP BEGIN at computepi.f90(11,3)
remark #15301:
OpenMP SIMD LOOP WAS VECTORIZED
• Report provide clues about vectorized and none vectorized loops

Universitetets senter for informasjonsteknologi
Which loops to study ?
• A profiler will inform you about where time is spent
• Intel Vector Advisor will provide information about vectorization and time spent in loops
• Need separate training to learn to use this

Intel XE-Advisor

Universitetets senter for informasjonsteknologi
Estimating overall efficiency
• How much of the processor’s theoretical performance is utilised ?
• How many floating point instructions are executed during the wall time?
• How many floating point instructions could theoretical been executed ?
• How large fraction of theoretical is executed ?

Universitetets senter for informasjonsteknologi
Estimating overall efficiency
• Simple test program, flops count known:
Function Mflops/s Efficiency %
• Mul: 854.9492 2.0552
Div: 747.7584 1.7975
Power: 7888.0415 18.9616
Log: 9126.1285 21.9378
• More calculation yield higher efficiency !

Universitetets senter for informasjonsteknologi
Intel Software Development Emulator
• SDE can count the floating point instruction executed
• Very simple to run :
• sde -bdw -iform 1 -omix myapp_mix.out -top_blocks 5000 -- ./prog.x
• Output need some analysis as it’s long and not human friendly
Universitetets senter for informasjonsteknologi
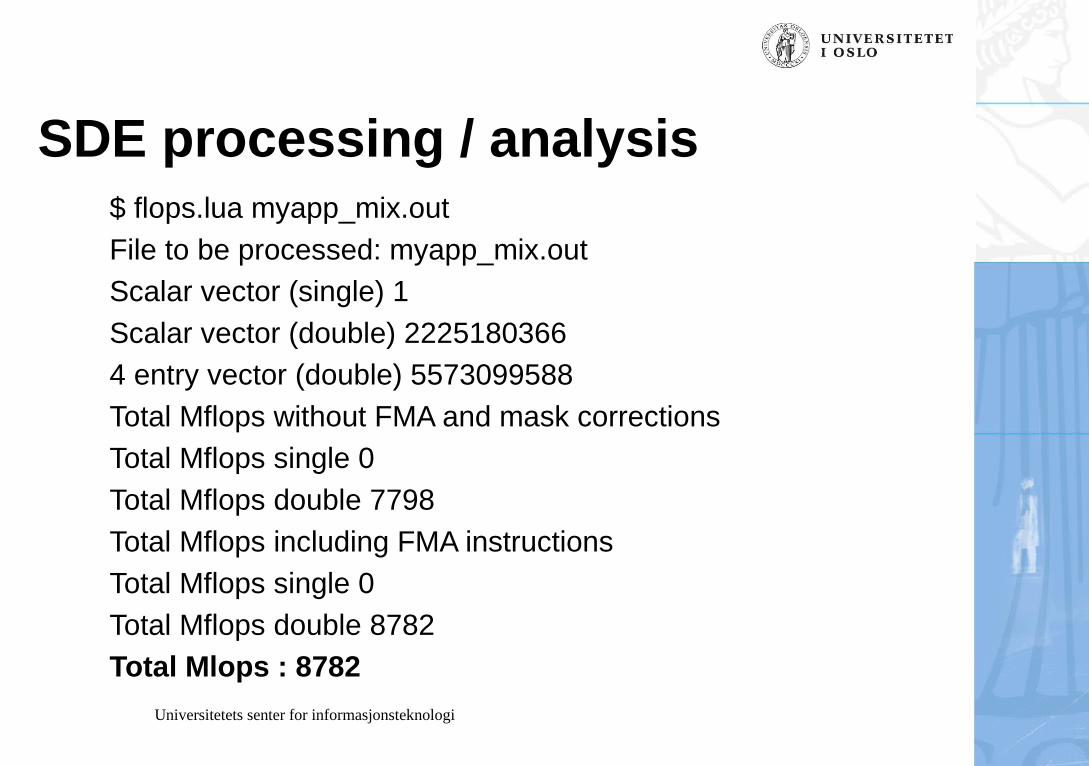
SDE processing / analysis $ flops.lua myapp_mix.out
File to be processed: myapp_mix.out
Scalar vector (single) 1
Scalar vector (double) 2225180366
4 entry vector (double) 5573099588
Total Mflops without FMA and mask corrections
Total Mflops single 0
Total Mflops double 7798
Total Mflops including FMA instructions
Total Mflops single 0
Total Mflops double 8782
Total Mlops : 8782

Universitetets senter for informasjonsteknologi
Threading analysis
• Measure the scaling as function of # threads
• OpenMP scalingis generally lower than with MPI
• Test OpenMPscaling separatelywhen testing Hybridprograms 1 10 100 1000
1
10
100
1000
Perfect
Roll offf
Negative
Linear
Number of cores
Sp
ee
du
p

Universitetets senter for informasjonsteknologi
Threading analysis
• Intel Thread checker tool
• Intel XE-Inspector
– Checks threads, locks, sharing, false sharing, deadlocks etc
• GUI based
• Need separate training to go through this tool

Intel XE-Inspector

Universitetets senter for informasjonsteknologi
Memory access, processor efficiency
• Intel Vtune Amplifier
• A very powerful tool
• Complex, can be overwhelming, or even intimidating
• Takes time to learn
• Can pinpoint and solve detailed performance problems down to instruction level
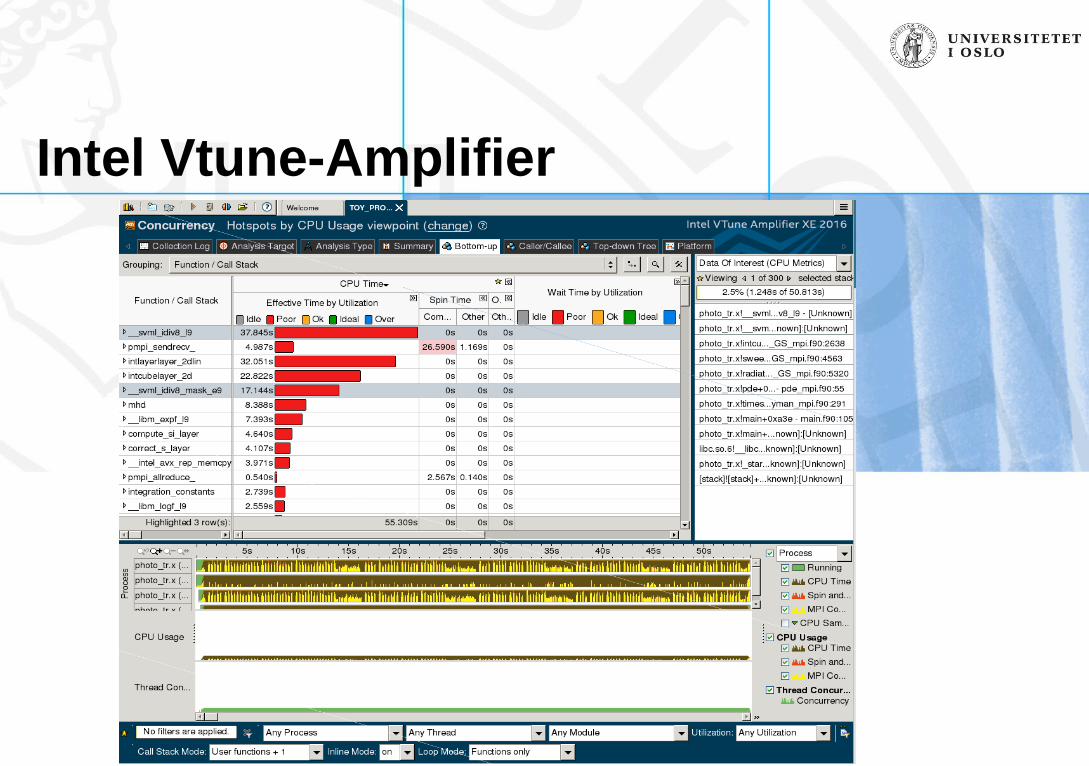
Intel Vtune-Amplifier

Universitetets senter for informasjonsteknologi
Intel tools
• Intel provide good training sessions in using their tools
• Separate training is needed to learn these tools
• Welcome tomorrow !
Programming - Intel MPI tuning tools
• Trace Analyser
• Checks the MPI communication
• Trace all MPI calls
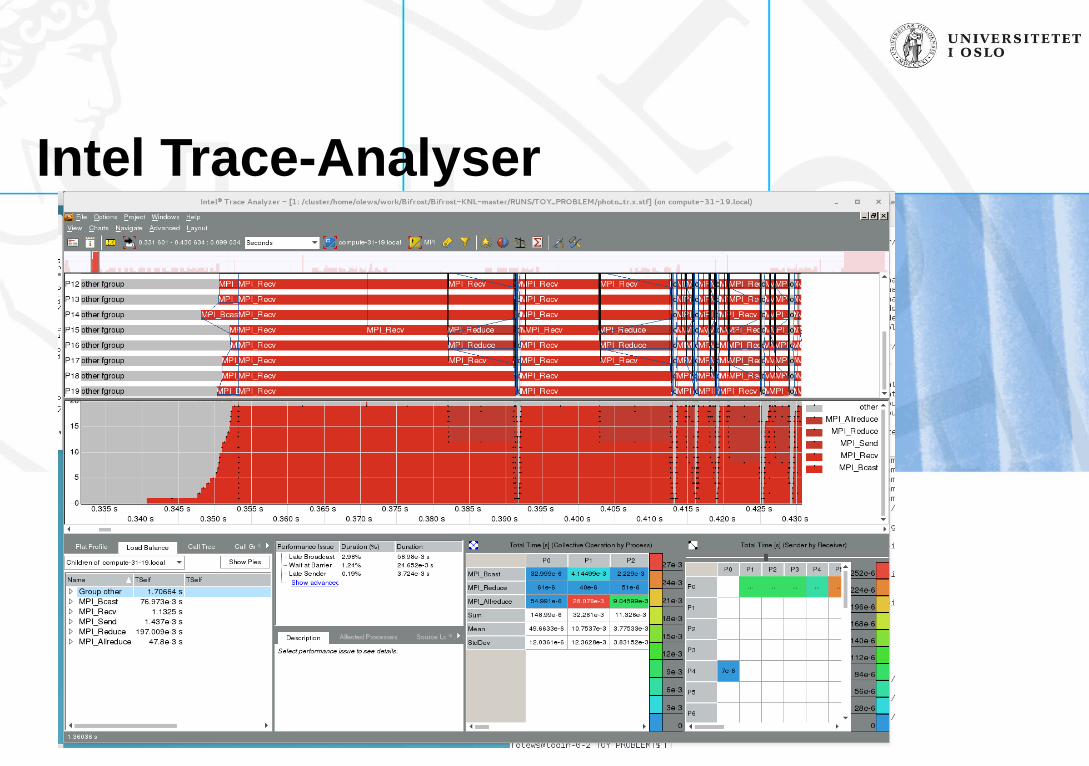
Intel Trace-Analyser

Universitetets senter for informasjonsteknologi
Intel trace analyser
• Will provide nice insight in MPI communications
• Display imbalances
• Display collectives – wait times easy to spot
• Provide MPI function statistics, timing etc
• Relatively easy to use compare to the Vtune amp.

Universitetets senter for informasjonsteknologi
Intel tools
• Intel provide good training sessions in using their tools
• Separate training is needed to learn these tools
• Attend tomorrow


