44
Best Practices - Risk Management Pharmaceutical Industry Date: 30 Nov, 2011
Best Practices - Risk Management
Pharmaceutical Industry
Date: 30 Nov, 2011
Risk Management
• Qualitative Risk Management
• Quantitative Risk Management
Schedule
Cost
Case Study: WTC Vehicle Security Center
Overview
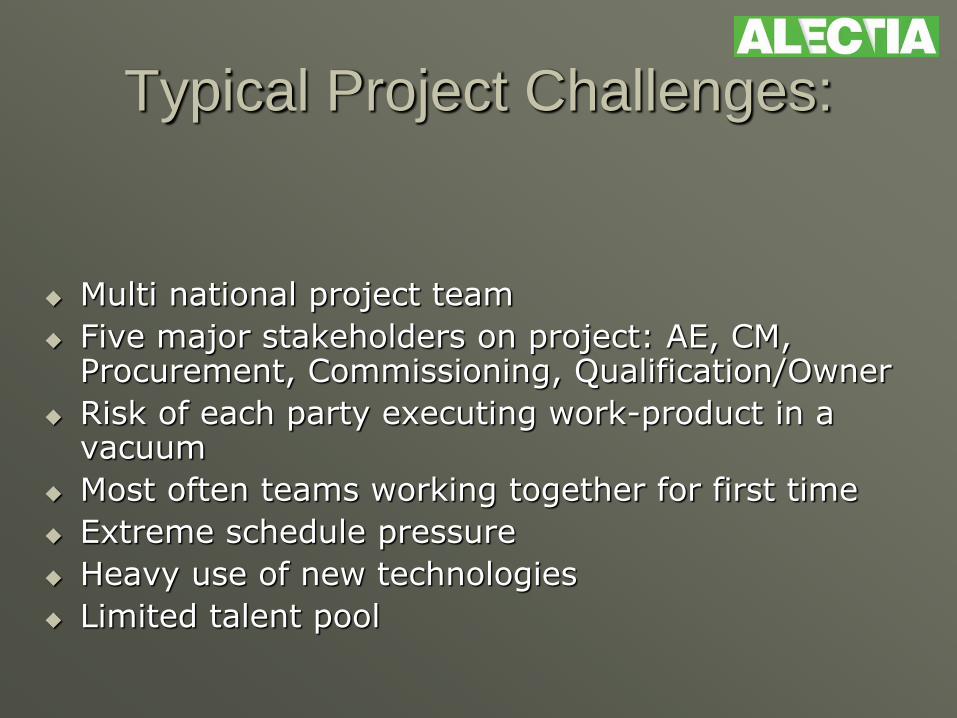
Typical Project Challenges:
Multi national project team
Five major stakeholders on project: AE, CM, Procurement, Commissioning, Qualification/Owner
Risk of each party executing work-product in a vacuum
Most often teams working together for first time
Extreme schedule pressure
Heavy use of new technologies
Limited talent pool
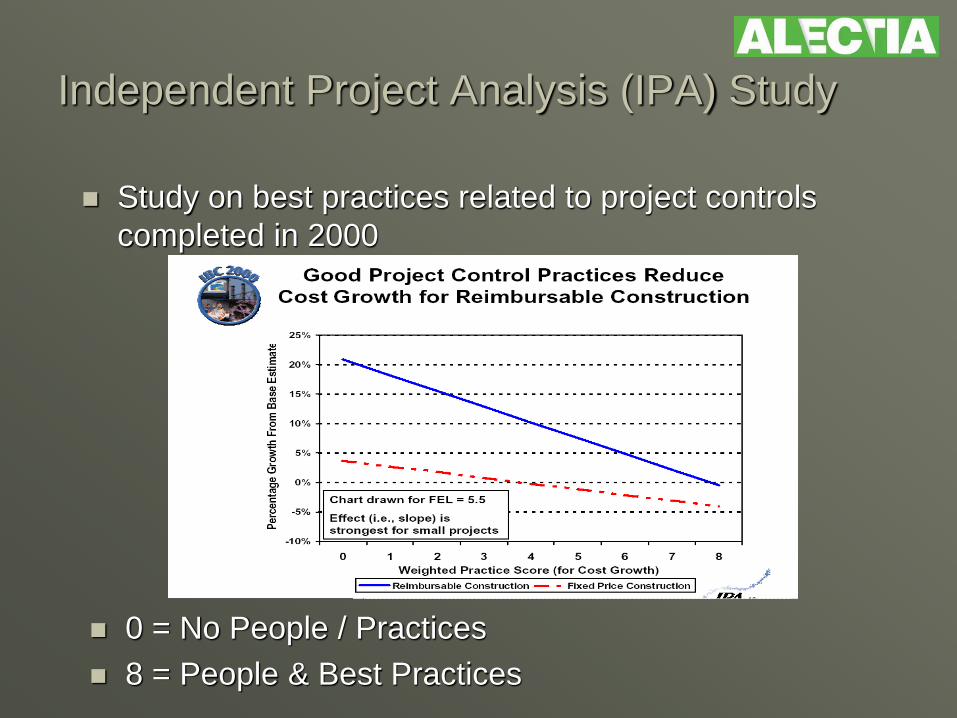
Independent Project Analysis (IPA) Study
Study on best practices related to project controls
completed in 2000
0 = No People / Practices
8 = People & Best Practices
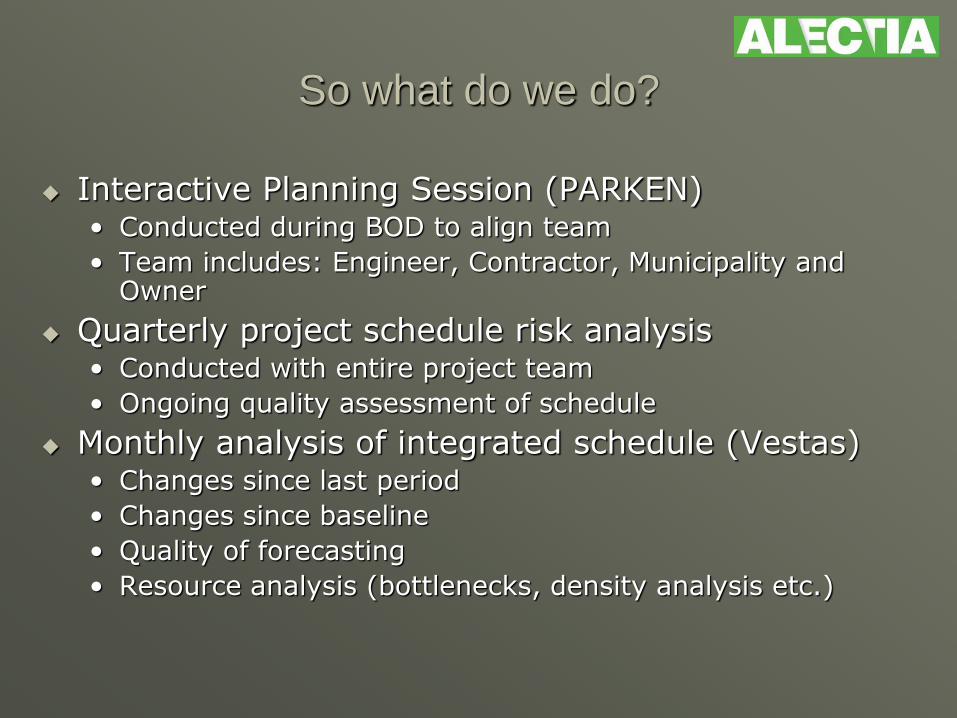
So what do we do?
Interactive Planning Session (PARKEN) • Conducted during BOD to align team
• Team includes: Engineer, Contractor, Municipality and Owner
Quarterly project schedule risk analysis • Conducted with entire project team
• Ongoing quality assessment of schedule
Monthly analysis of integrated schedule (Vestas) • Changes since last period
• Changes since baseline
• Quality of forecasting
• Resource analysis (bottlenecks, density analysis etc.)
Typically performed through a workshop or interview setting
Need representation from all aspects of the project: sponsor, development, engineering, procurement, construction, operations, legal, environmental, etc.
Use various brainstorming techniques to gather risks and assess the qualitative impact to project
Qualitative Risk Management
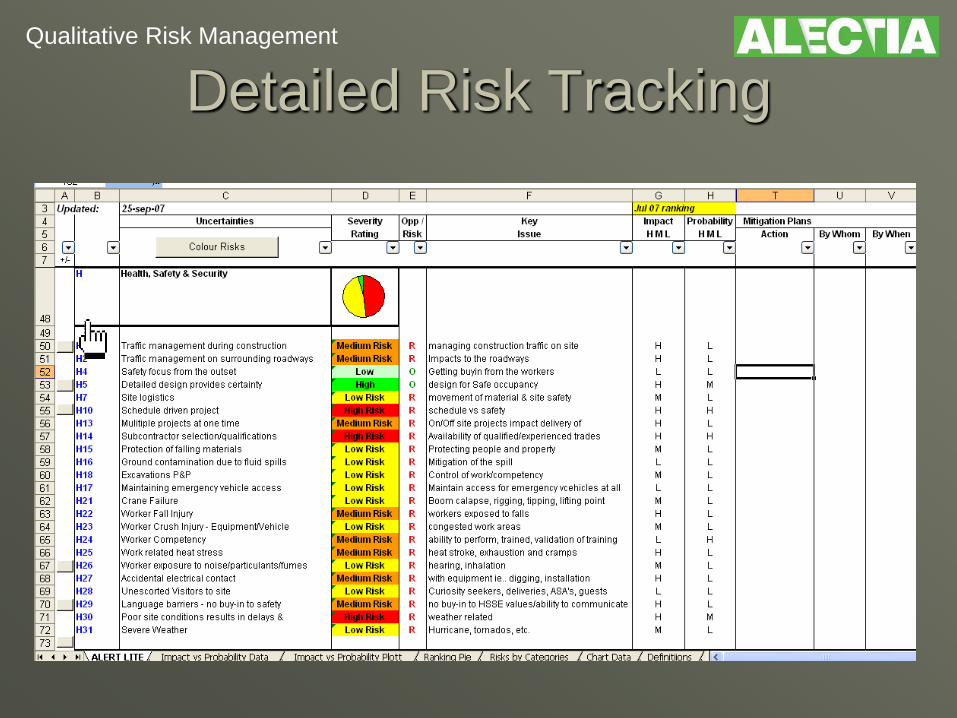
Detailed Risk Tracking Qualitative Risk Management
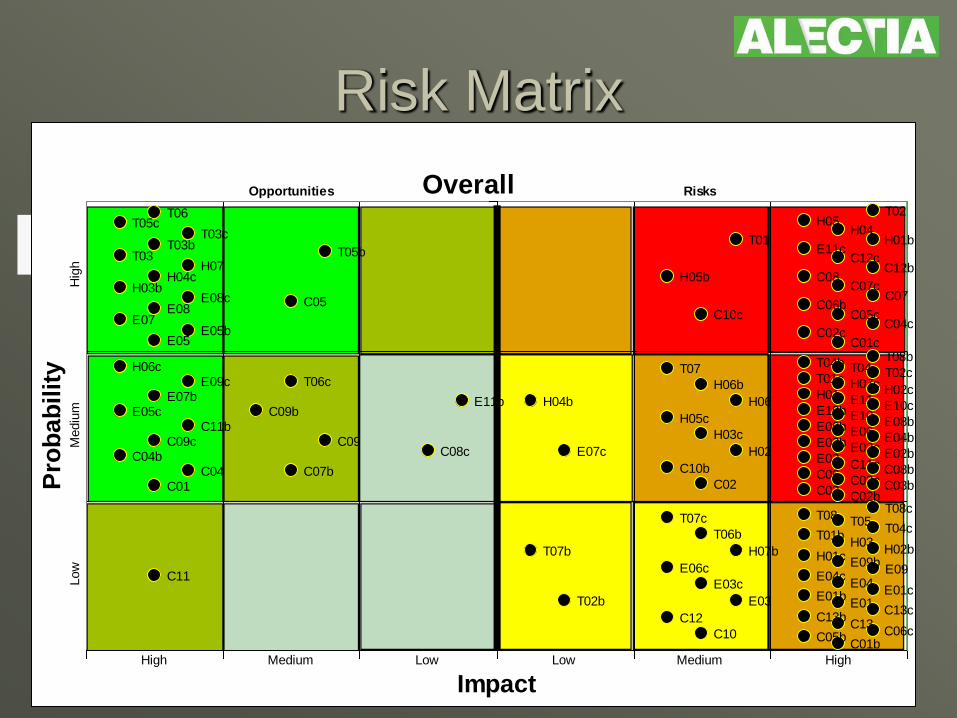
Risk Matrix
T08c
T08b
T08T07c
T07b
T07T06c
T06b
T06T05c
T05b
T05T04c
T04b T04
T03cT03b
T03
T02c
T02b
T02
T01c
T01b
T01
H07c
H07b
H07
H06c
H06b
H06
H05c
H05b
H05
H04c
H04b
H04
H03c
H03b
H03
H02c
H02b
H02
H01c
H01b
H01
E11c
E11b E11 E10cE10b E10
E09c
E09bE09
E08c
E08b
E08
E07c
E07b
E07
E06c
E06b E06
E05c
E05bE05
E04c
E04b
E04E03c
E03b
E03
E02c E02bE02
E01cE01bE01
C01
C01b
C01c
C02C02b
C02c
C03 C03bC03cC04
C04b
C04c
C05
C05b
C05c
C06
C06b
C06c
C07
C07b
C07cC08
C08b
C08cC09
C09b
C09c
C10
C10b
C10c
C11
C11b
C11c
C12
C12bC12c
C13C13b
C13c
Impact
Pro
ba
bil
ity
High Medium Low Low Medium High
Opportunities Risks
Low
Mediu
mH
igh
Overall
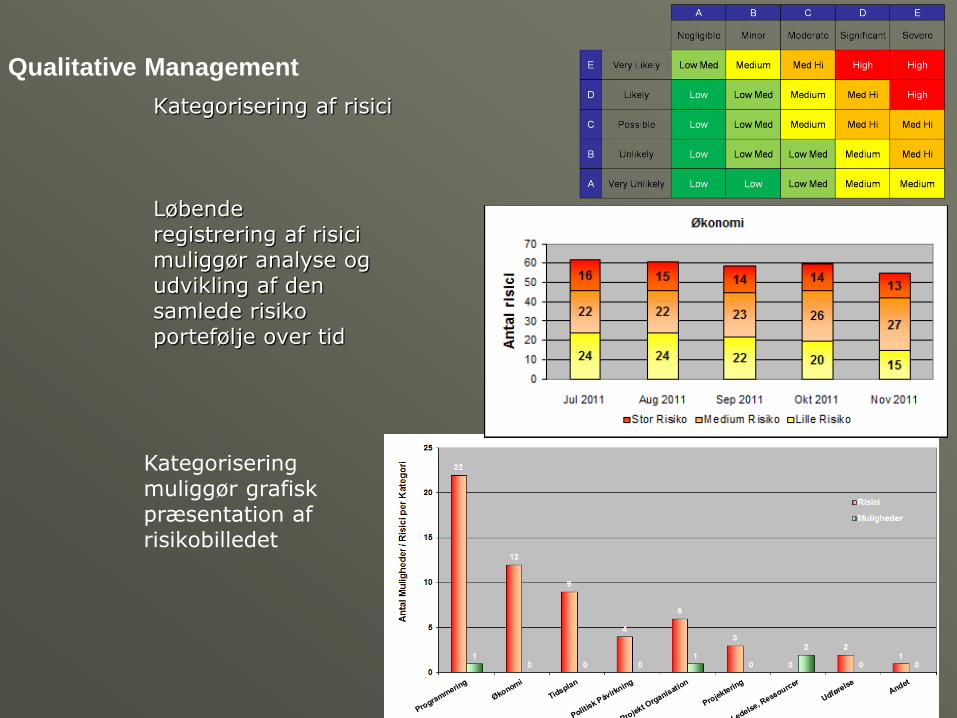
Kategorisering af risici
Løbende registrering af risici muliggør analyse og udvikling af den samlede risiko portefølje over tid
Kategorisering muliggør grafisk præsentation af risikobilledet
Qualitative Management
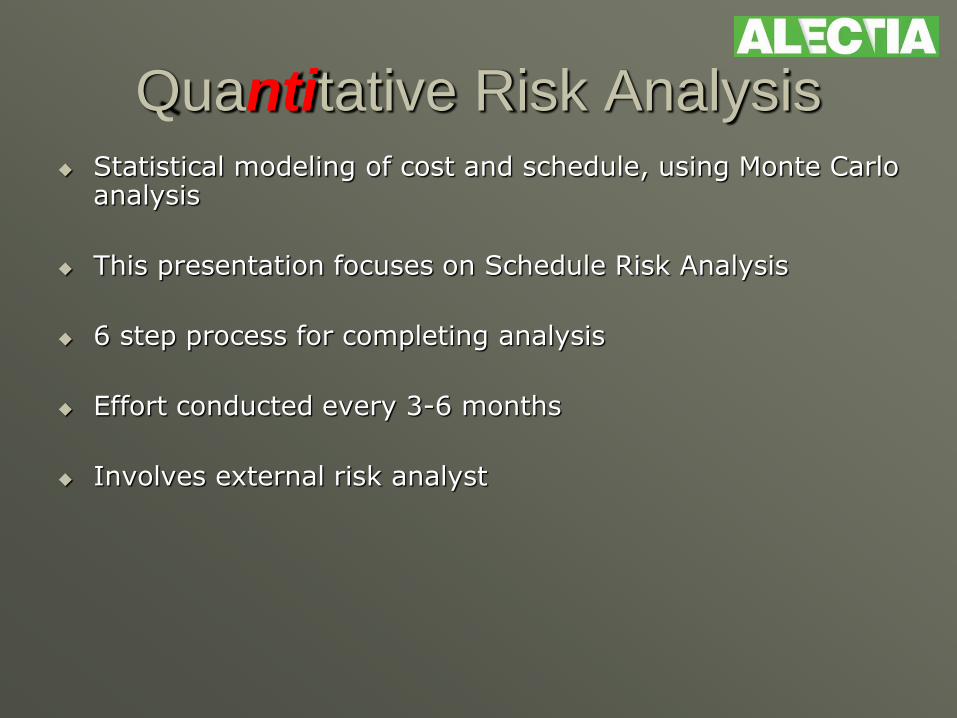
Quantitative Risk Analysis Statistical modeling of cost and schedule, using Monte Carlo
analysis
This presentation focuses on Schedule Risk Analysis
6 step process for completing analysis
Effort conducted every 3-6 months
Involves external risk analyst

t = $
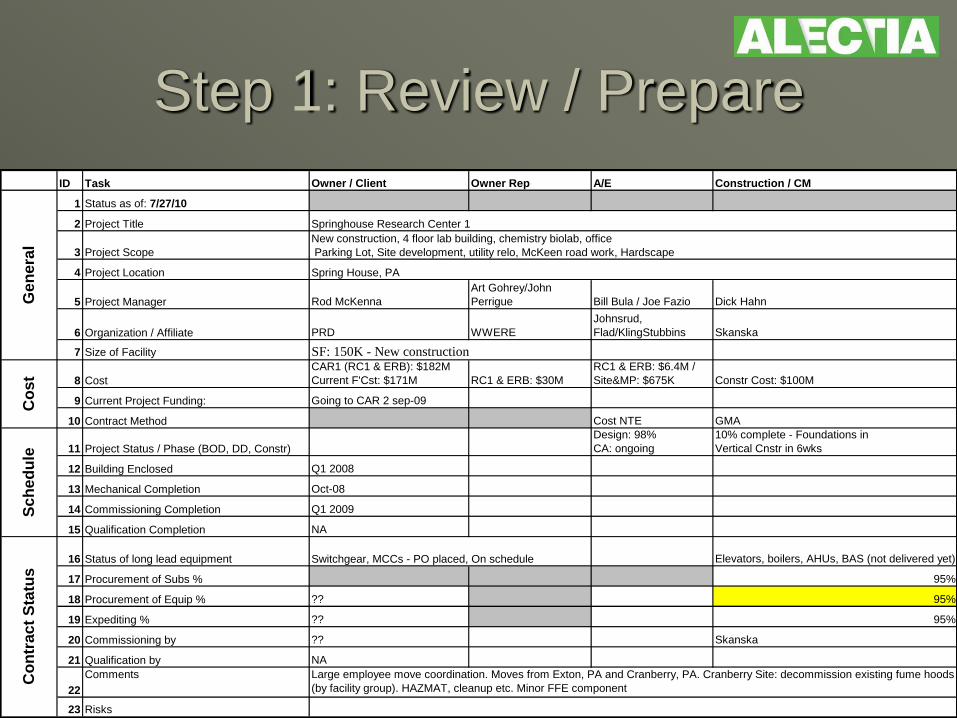
Step 1: Review / Prepare
ID Task Owner / Client Owner Rep A/E Construction / CM
1 Status as of: 7/27/10
2 Project Title
3 Project Scope
4 Project Location
5 Project Manager Rod McKenna
Art Gohrey/John
Perrigue Bill Bula / Joe Fazio Dick Hahn
6 Organization / Affiliate PRD WWERE
Johnsrud,
Flad/KlingStubbins Skanska
7 Size of Facility
8 Cost
CAR1 (RC1 & ERB): $182M
Current F'Cst: $171M RC1 & ERB: $30M
RC1 & ERB: $6.4M /
Site&MP: $675K Constr Cost: $100M
9 Current Project Funding: Going to CAR 2 sep-09
10 Contract Method Cost NTE GMA
11 Project Status / Phase (BOD, DD, Constr)
Design: 98%
CA: ongoing
10% complete - Foundations in
Vertical Cnstr in 6wks
12 Building Enclosed Q1 2008
13 Mechanical Completion Oct-08
14 Commissioning Completion Q1 2009
15 Qualification Completion NA
16 Status of long lead equipment Elevators, boilers, AHUs, BAS (not delivered yet)
17 Procurement of Subs % 95%
18 Procurement of Equip % ?? 95%
19 Expediting % ?? 95%
20 Commissioning by ?? Skanska
21 Qualification by NA
22
Comments
23 Risks
Co
ntr
act
Sta
tus
Gen
era
lC
ost
Sch
ed
ule
New construction, 4 floor lab building, chemistry biolab, office
Parking Lot, Site development, utility relo, McKeen road work, Hardscape
Large employee move coordination. Moves from Exton, PA and Cranberry, PA. Cranberry Site: decommission existing fume hoods
(by facility group). HAZMAT, cleanup etc. Minor FFE component
Springhouse Research Center 1
Spring House, PA
SF: 150K - New construction
Switchgear, MCCs - PO placed, On schedule
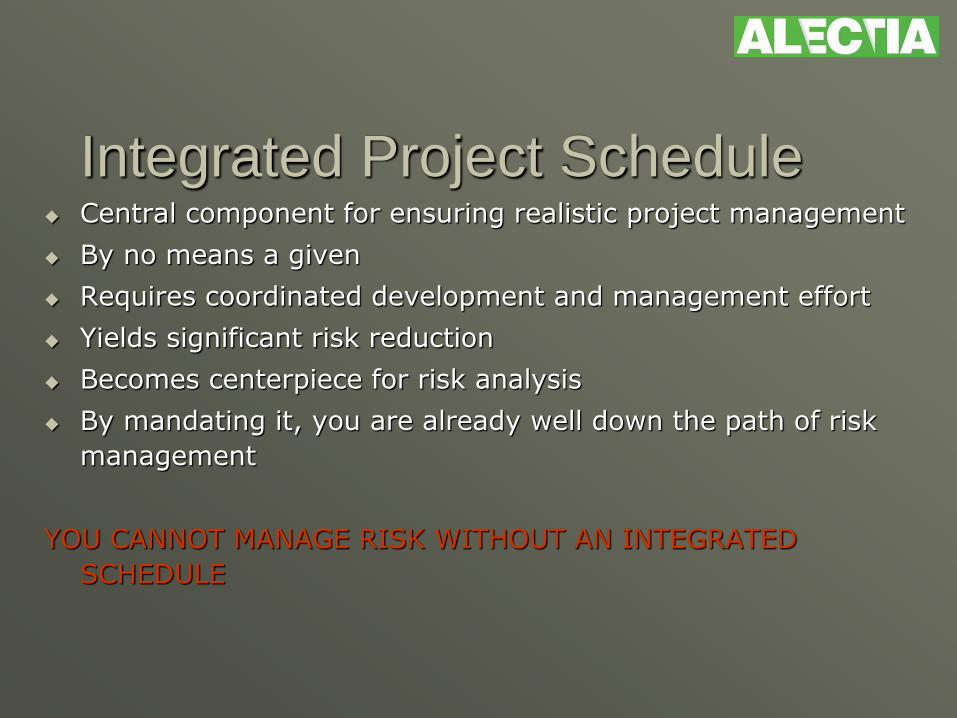
Integrated Project Schedule Central component for ensuring realistic project management
By no means a given
Requires coordinated development and management effort
Yields significant risk reduction
Becomes centerpiece for risk analysis
By mandating it, you are already well down the path of risk
management
YOU CANNOT MANAGE RISK WITHOUT AN INTEGRATED
SCHEDULE
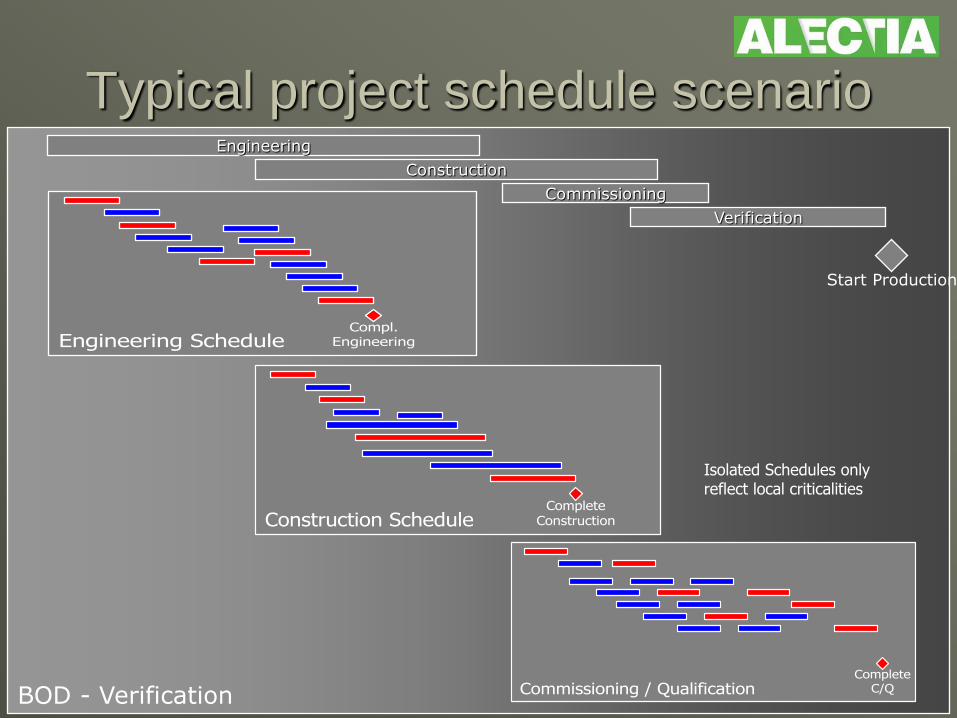
Typical project schedule scenario
BOD - Verification
Engineering
Commissioning
Verification
Construction
Start Production
Engineering ScheduleCompl.
Engineering
Construction ScheduleComplete
Construction
Commissioning / QualificationComplete
C/Q
Isolated Schedules only reflect local criticalities
BOD - Verification
Engineering
Commissioning
Verification
Construction
Start Production
Engineering ScheduleCompl.
Engineering
Construction ScheduleComplete
Construction
Commissioning / QualificationComplete
C/Q
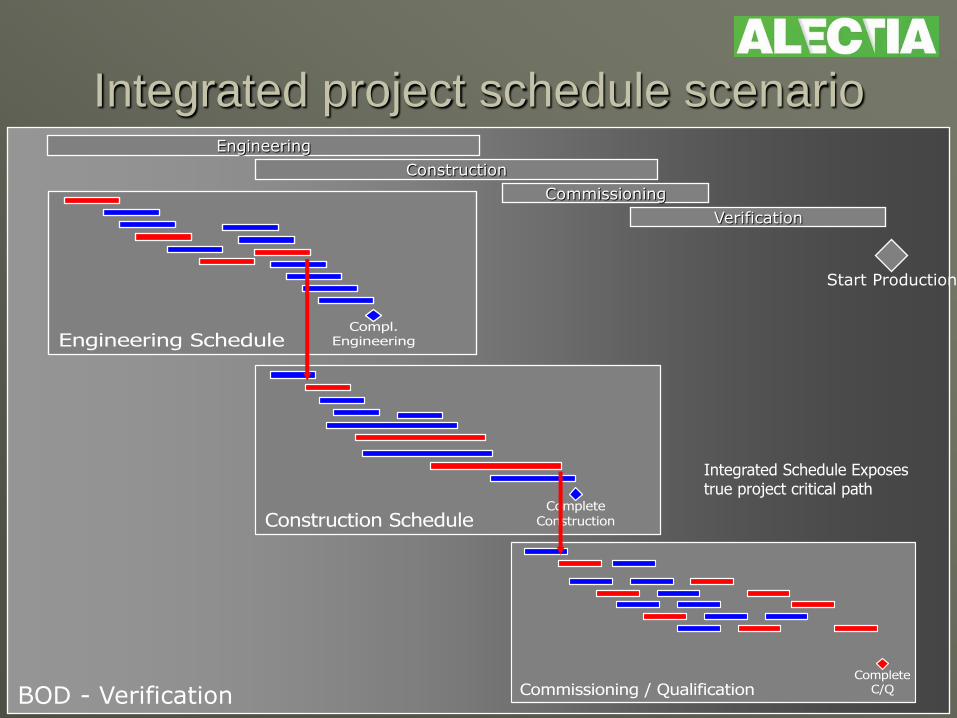
Integrated project schedule scenario
Integrated Schedule Exposes true project critical path
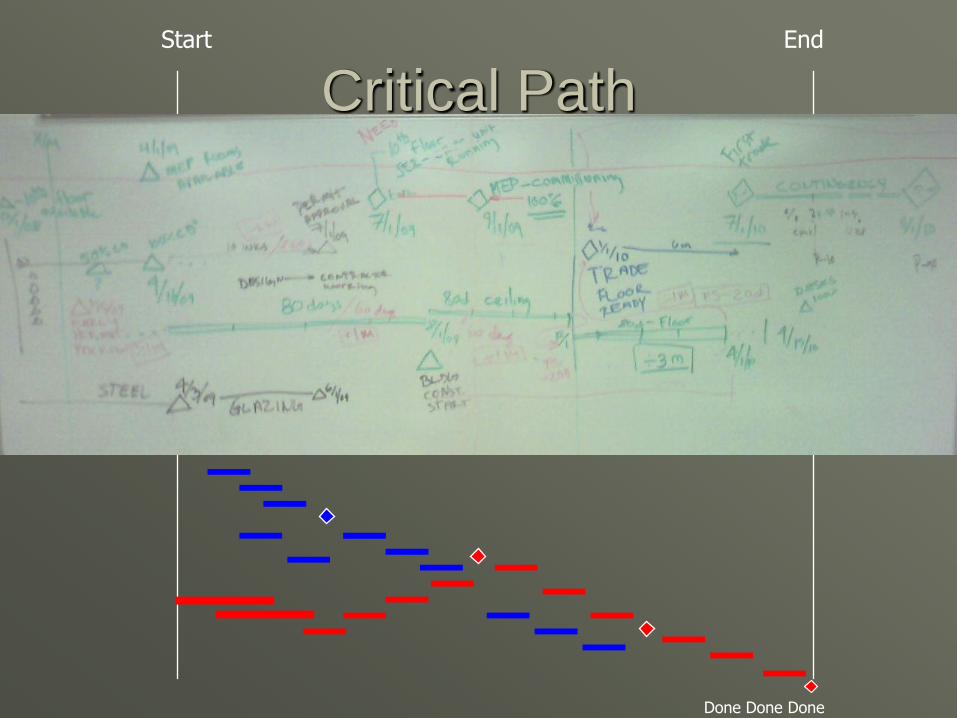
Critical Path
Done Done Done
Start End
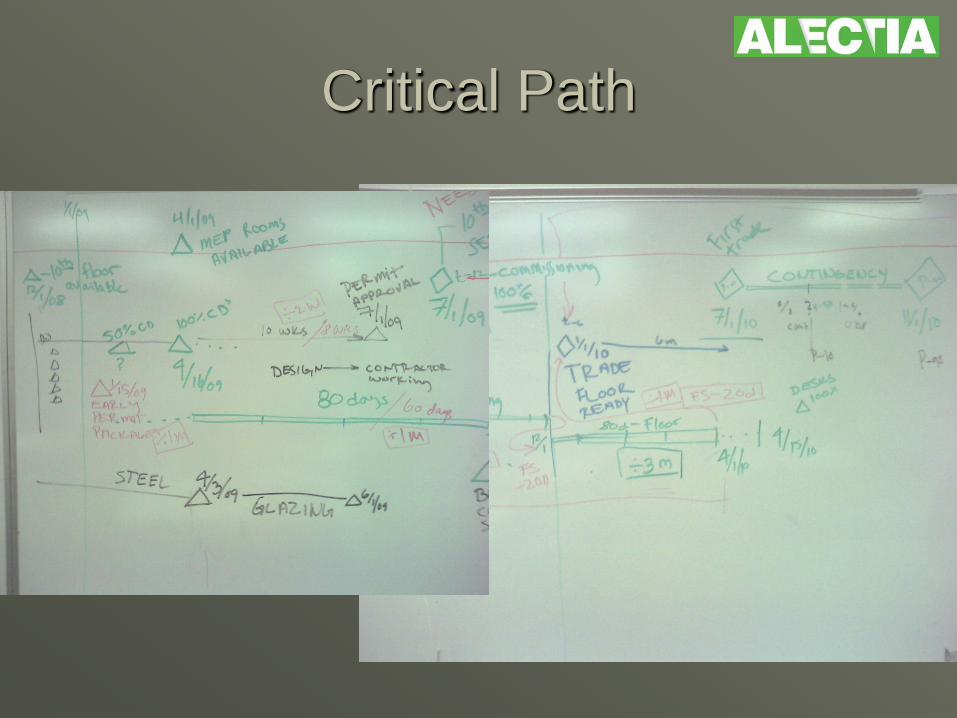
Critical Path
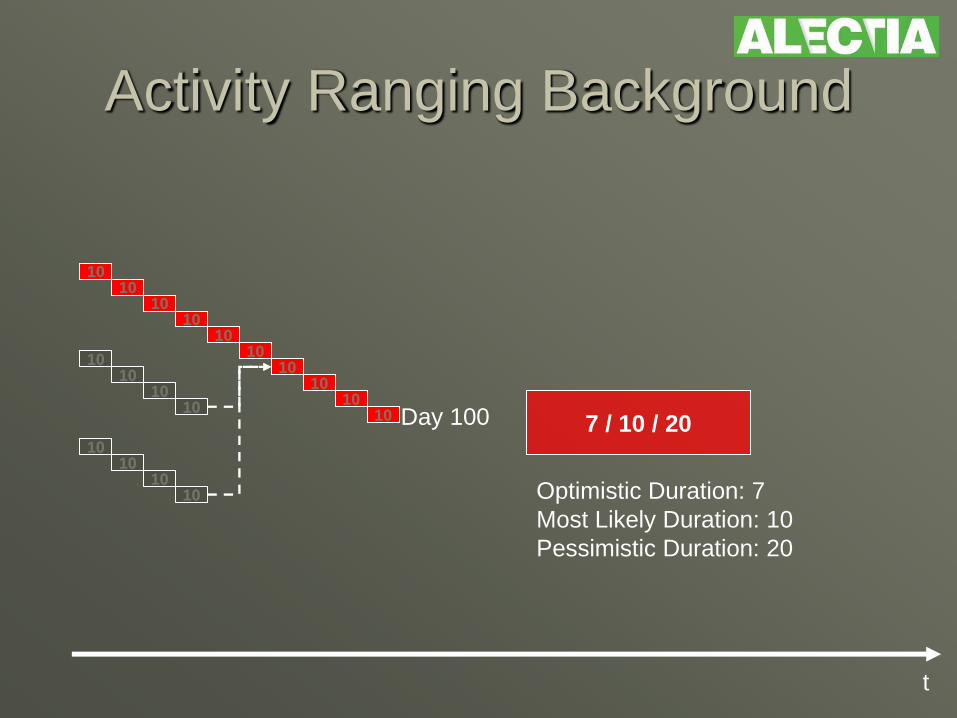
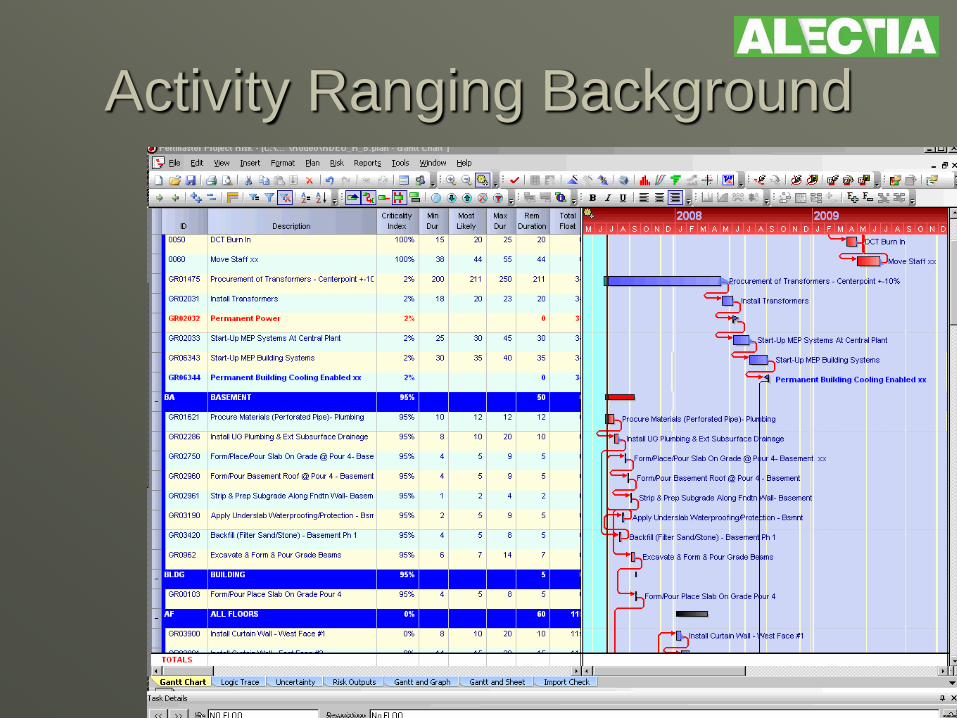
Activity Ranging Background
10 10
10 10
10 10
t
Day 100
10 10
10 10
10 10
10 10
10 10
10 10
7 / 10 / 20
Optimistic Duration: 7
Most Likely Duration: 10
Pessimistic Duration: 20
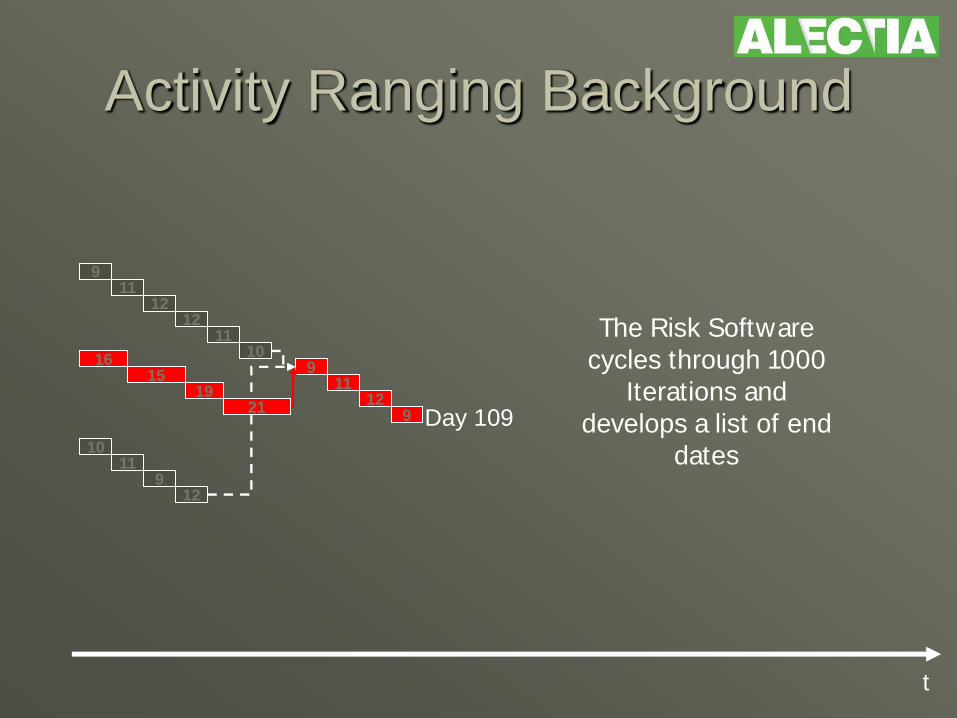
Activity Ranging Background
9 11
12 12
11 10
Day 109
9 11
12 9
16 15
19
10 11
9 12
21
t
The Risk Software
cycles through 1000
Iterations and
develops a list of end
dates
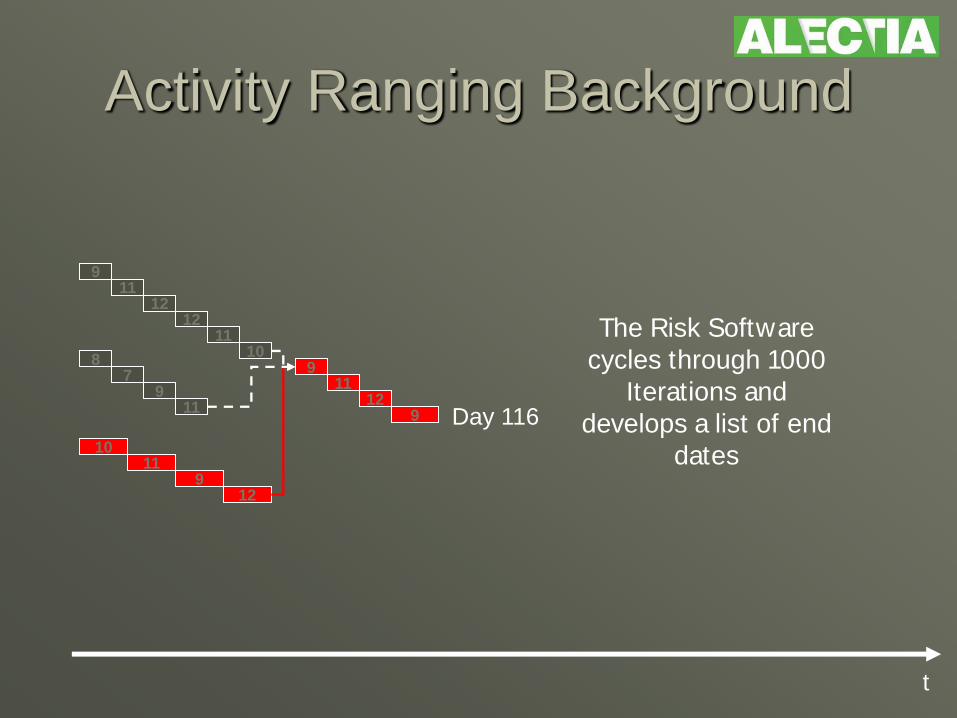
Activity Ranging Background
9 11
12 12
11 10
Day 116
9 11
12 9
10 11
9 12
8 7
9 11
The Risk Software
cycles through 1000
Iterations and
develops a list of end
dates
t
Activity Ranging Background
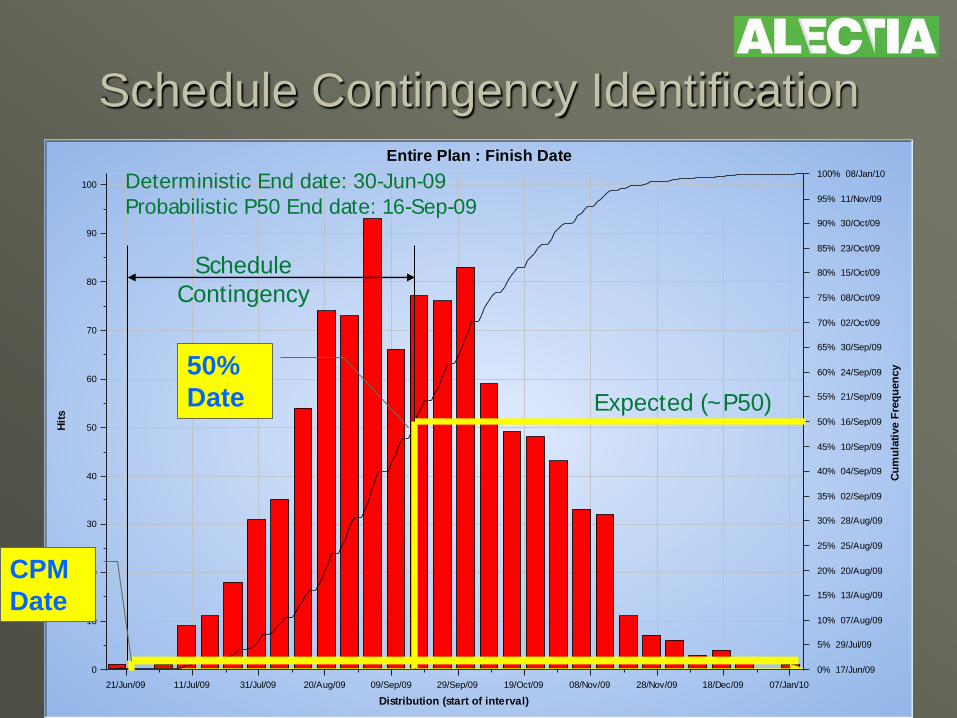
21/Jun/09 11/Jul/09 31/Jul/09 20/Aug/09 09/Sep/09 29/Sep/09 19/Oct/09 08/Nov/09 28/Nov/09 18/Dec/09 07/Jan/10
Distribution (start of interval)
0
10
20
30
40
50
60
70
80
90
100
Hit
s
0% 17/Jun/09
5% 29/Jul/09
10% 07/Aug/09
15% 13/Aug/09
20% 20/Aug/09
25% 25/Aug/09
30% 28/Aug/09
35% 02/Sep/09
40% 04/Sep/09
45% 10/Sep/09
50% 16/Sep/09
55% 21/Sep/09
60% 24/Sep/09
65% 30/Sep/09
70% 02/Oct/09
75% 08/Oct/09
80% 15/Oct/09
85% 23/Oct/09
90% 30/Oct/09
95% 11/Nov/09
100% 08/Jan/10
Cu
mu
lati
ve F
req
uen
cy
Entire Plan : Finish Date
Schedule Contingency Identification
Expected (~P50)
Schedule
Contingency
Deterministic End date: 30-Jun-09
Probabilistic P50 End date: 16-Sep-09
CPM
Date
50%
Date
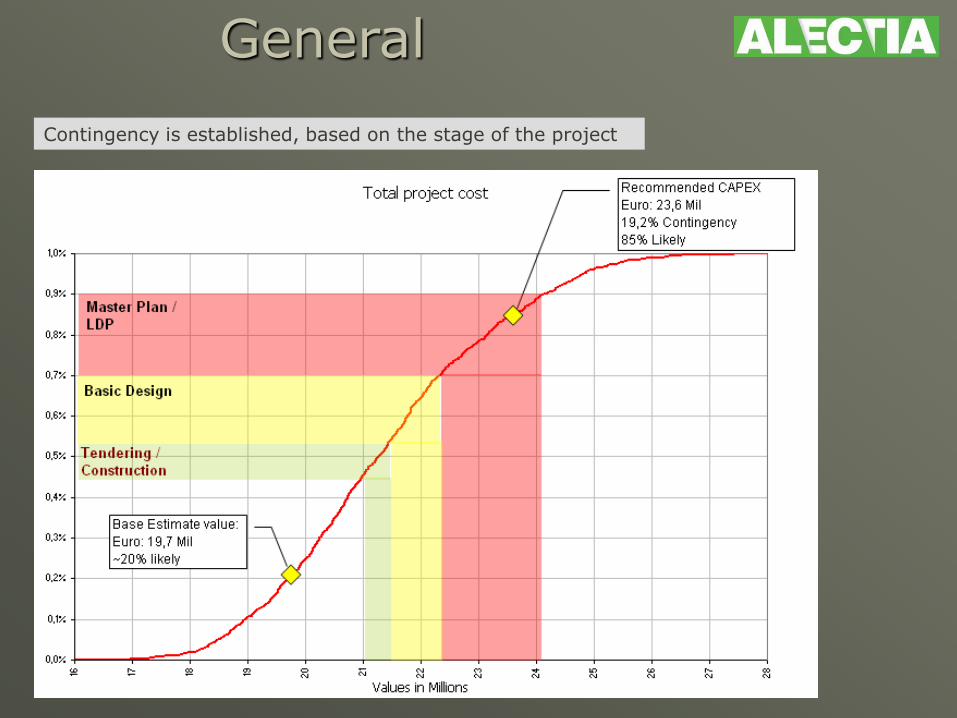
General
Contingency is established, based on the stage of the project
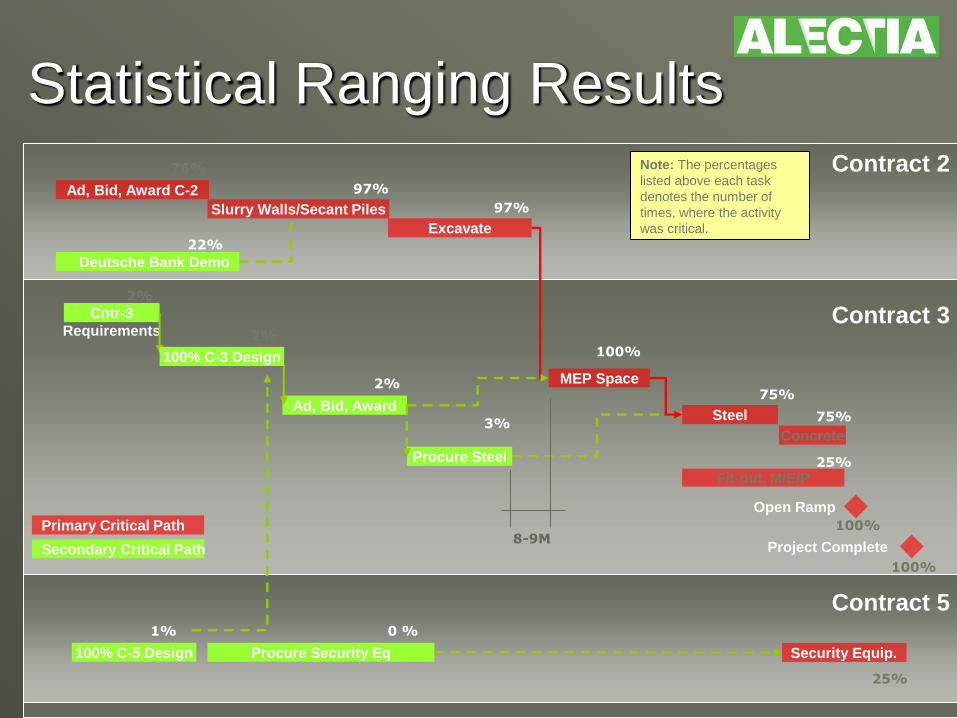
Statistical Ranging Results
Ad, Bid, Award C-2
97%
97%
75% Ad, Bid, Award
2%
Steel
Project Complete
Cntr-3
Requirements
Security Equip.
Procure Steel
Excavate
2%
3%
100%
76%
2%
25%
Concrete
75%
22%
Deutsche Bank Demo
Secondary Critical Path
Primary Critical Path
Note: The percentages
listed above each task
denotes the number of
times, where the activity
was critical.
100%
MEP Space
100% C-5 Design
1%
Procure Security Eq
Open Ramp
100%
0 %
Fit-out, M/E/P
100% C-3 Design
Contract 2
Contract 3
Contract 5
25%
Slurry Walls/Secant Piles
8-9M
Cost Risk Analysis
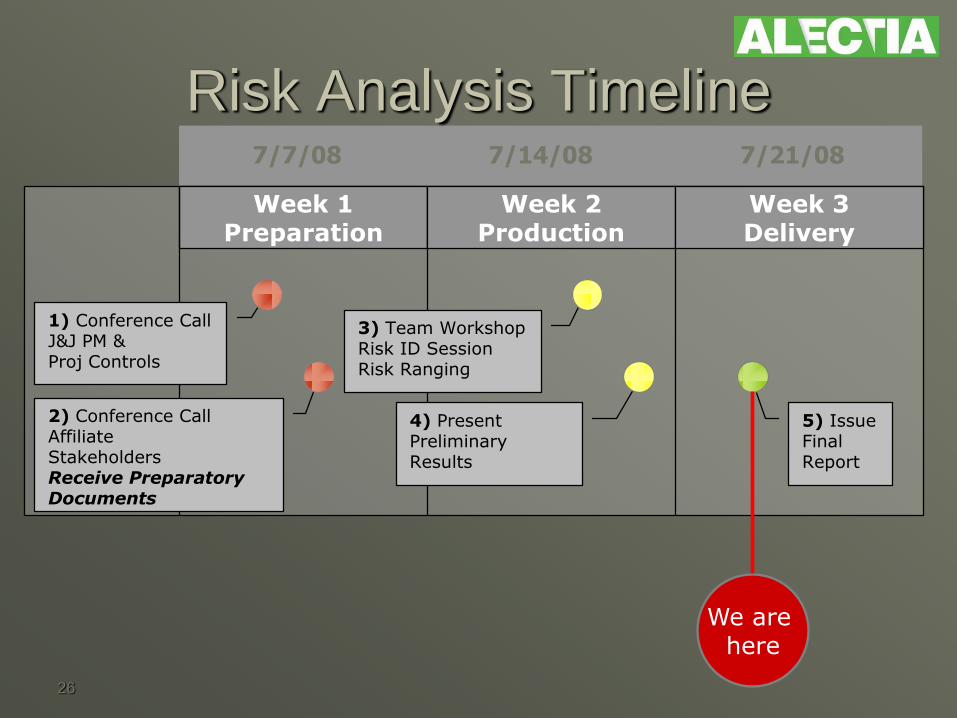
26
Risk Analysis Timeline
Week 1Preparation
3) Team WorkshopRisk ID SessionRisk Ranging
4) Present PreliminaryResults
5) IssueFinalReport
Week 2Production
Week 3Delivery
1) Conference CallJ&J PM & Proj Controls
2) Conference CallAffiliate StakeholdersReceive Preparatory Documents
We are here
7/7/08 7/14/08 7/21/08
27
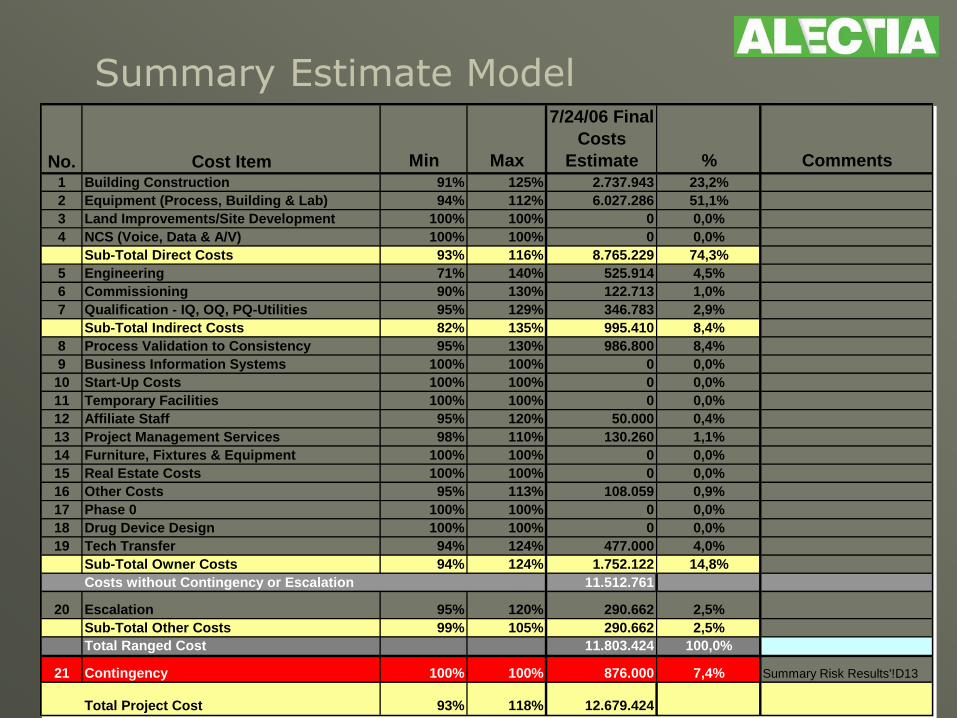
Summary Estimate Model
No. Cost Item Min Max
7/24/06 Final
Costs
Estimate % Comments
1 Building Construction 91% 125% 2.737.943 23,2%
2 Equipment (Process, Building & Lab) 94% 112% 6.027.286 51,1%
3 Land Improvements/Site Development 100% 100% 0 0,0%
4 NCS (Voice, Data & A/V) 100% 100% 0 0,0%
Sub-Total Direct Costs 93% 116% 8.765.229 74,3%
5 Engineering 71% 140% 525.914 4,5%
6 Commissioning 90% 130% 122.713 1,0%
7 Qualification - IQ, OQ, PQ-Utilities 95% 129% 346.783 2,9%
Sub-Total Indirect Costs 82% 135% 995.410 8,4%
8 Process Validation to Consistency 95% 130% 986.800 8,4%
9 Business Information Systems 100% 100% 0 0,0%
10 Start-Up Costs 100% 100% 0 0,0%
11 Temporary Facilities 100% 100% 0 0,0%
12 Affiliate Staff 95% 120% 50.000 0,4%
13 Project Management Services 98% 110% 130.260 1,1%
14 Furniture, Fixtures & Equipment 100% 100% 0 0,0%
15 Real Estate Costs 100% 100% 0 0,0%
16 Other Costs 95% 113% 108.059 0,9%
17 Phase 0 100% 100% 0 0,0%
18 Drug Device Design 100% 100% 0 0,0%
19 Tech Transfer 94% 124% 477.000 4,0%
Sub-Total Owner Costs 94% 124% 1.752.122 14,8%
Costs without Contingency or Escalation 11.512.761
20 Escalation 95% 120% 290.662 2,5%
Sub-Total Other Costs 99% 105% 290.662 2,5%
Total Ranged Cost 11.803.424 100,0%
21 Contingency 100% 100% 876.000 7,4% Summary Risk Results'!D13
Total Project Cost 93% 118% 12.679.424
28
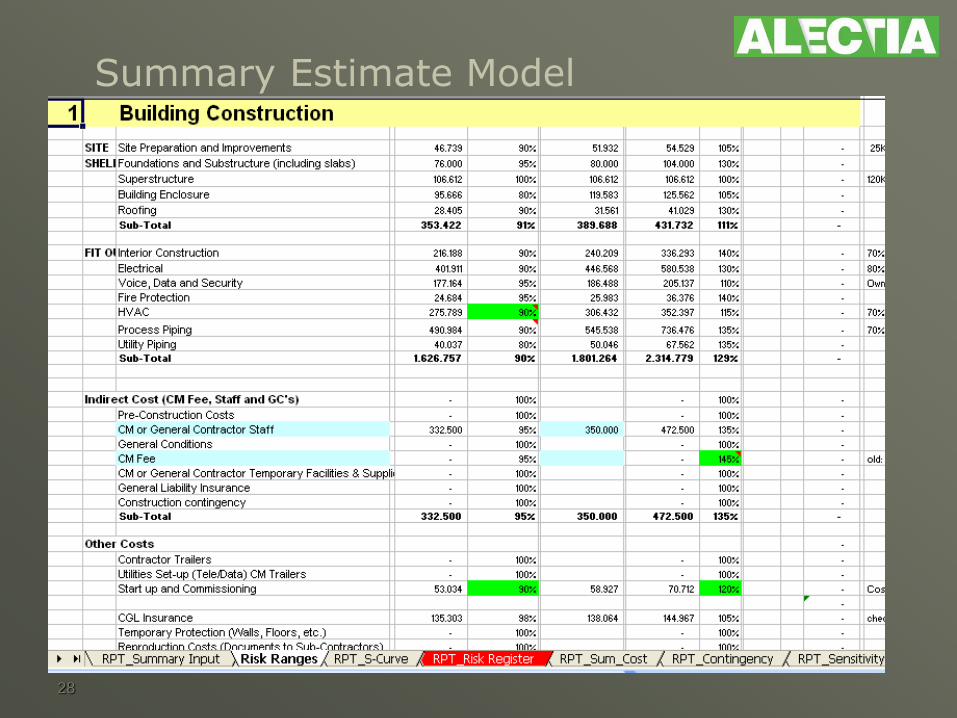
Summary Estimate Model
29
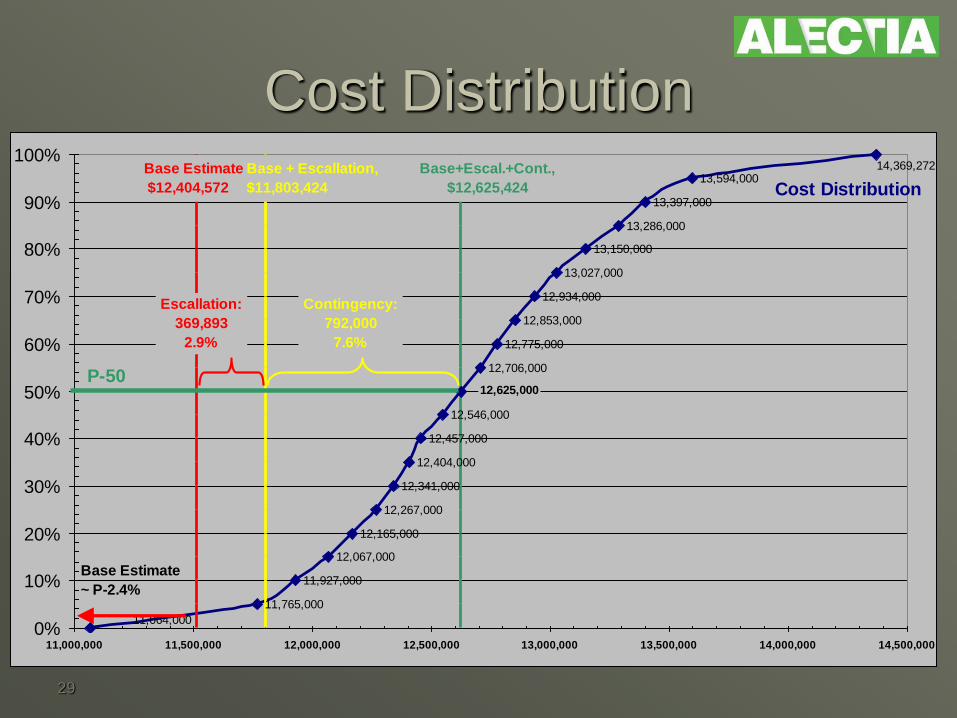
Cost Distribution
11,765,000
11,927,000
12,067,000
12,165,000
12,267,000
12,341,000
12,404,000
12,457,000
12,546,000
12,706,000
12,775,000
12,853,000
12,934,000
13,027,000
13,150,000
13,286,000
13,397,000
13,594,00014,369,272
11,064,000
12,625,000
Base Estimate
$12,404,572
Base + Escallation,
$11,803,424
Base+Escal.+Cont.,
$12,625,424
0%
10%
20%
30%
40%
50%
60%
70%
80%
90%
100%
11,000,000 11,500,000 12,000,000 12,500,000 13,000,000 13,500,000 14,000,000 14,500,000
Escallation:
369,893
2.9%
Contingency:
792,000
7.6%
Base Estimate
~ P-2.4%
P-50
Cost Distribution
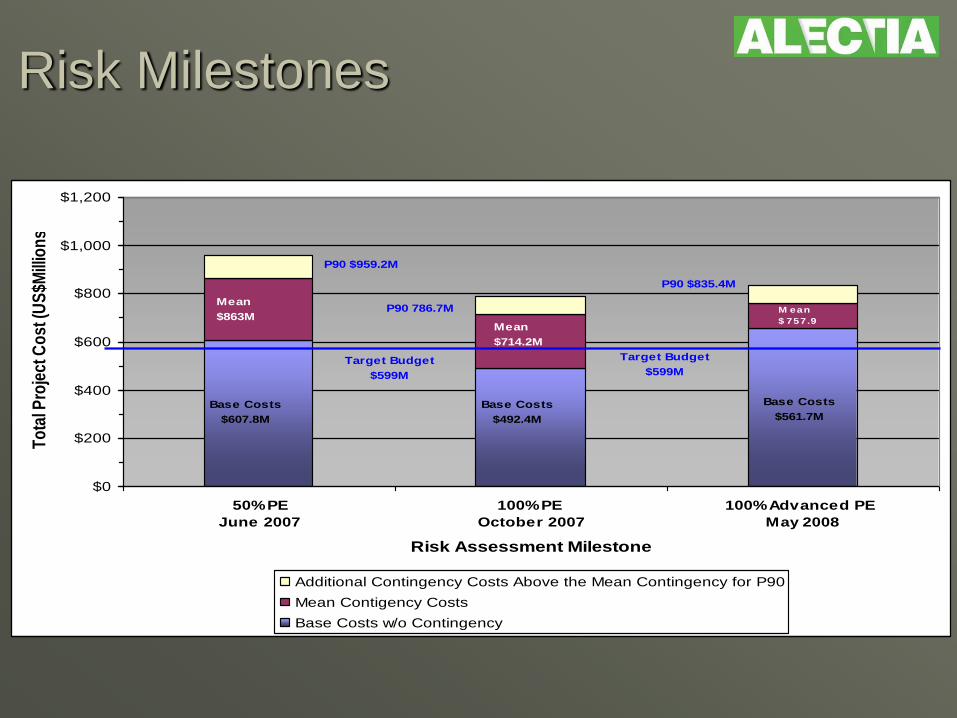
Risk Milestones
$0
$200
$400
$600
$800
$1,000
$1,200
50% PE
June 2007
100% PE
October 2007
100% Advanced PE
May 2008
Risk Assessment Milestone
To
tal P
roje
ct C
ost
(US
$Mill
ion
s)
Additional Contingency Costs Above the Mean Contingency for P90
Mean Contigency Costs
Base Costs w/o Contingency
M ean
$ 757.9
M
Base Costs
$607.8M
Base Costs
$492.4M
Mean
$863MMean
$714.2M
P90 $959.2M
P90 786.7M
P90 $835.4M
Base Costs
$561.7M
Target Budget
$599MTarget Budget
$599M
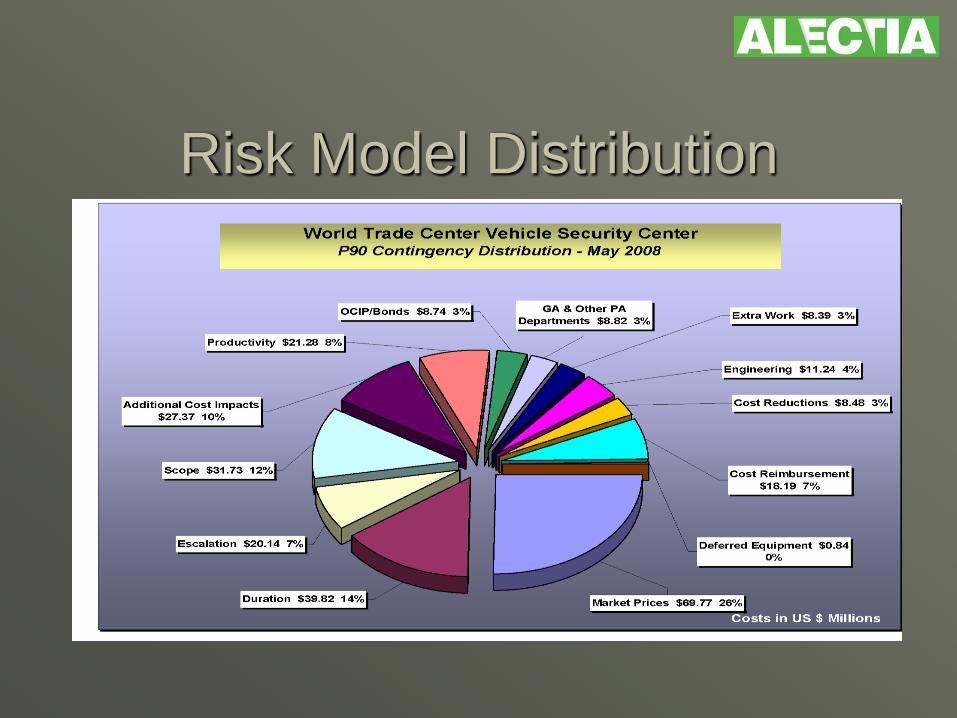
Risk Model Distribution
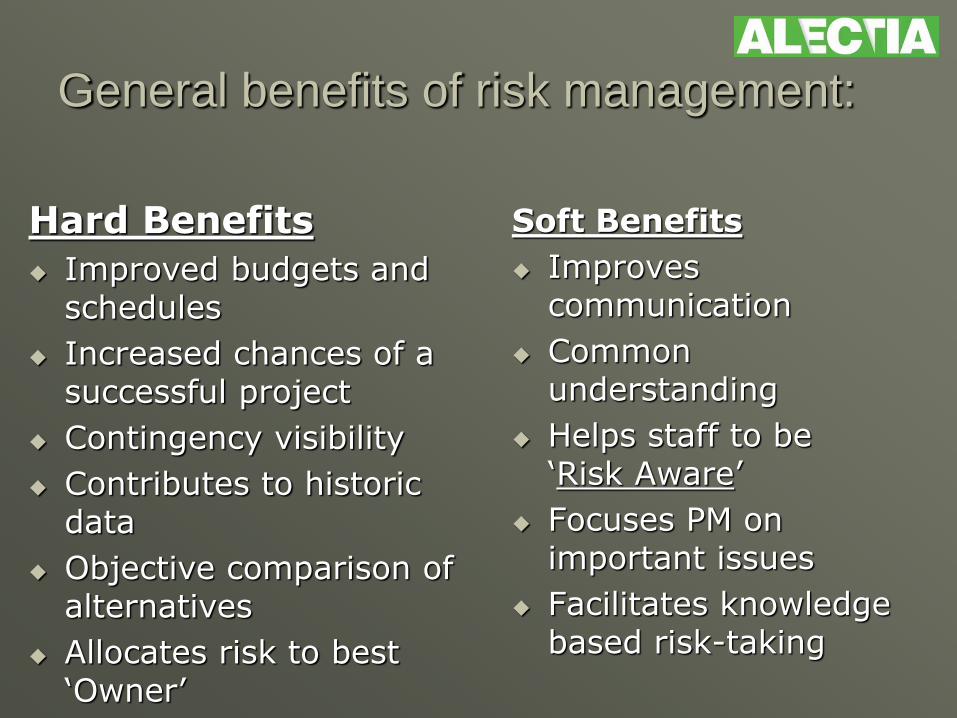
General benefits of risk management:
Hard Benefits
Improved budgets and schedules
Increased chances of a successful project
Contingency visibility
Contributes to historic data
Objective comparison of alternatives
Allocates risk to best ‘Owner’
Soft Benefits
Improves communication
Common understanding
Helps staff to be ‘Risk Aware’
Focuses PM on important issues
Facilitates knowledge based risk-taking
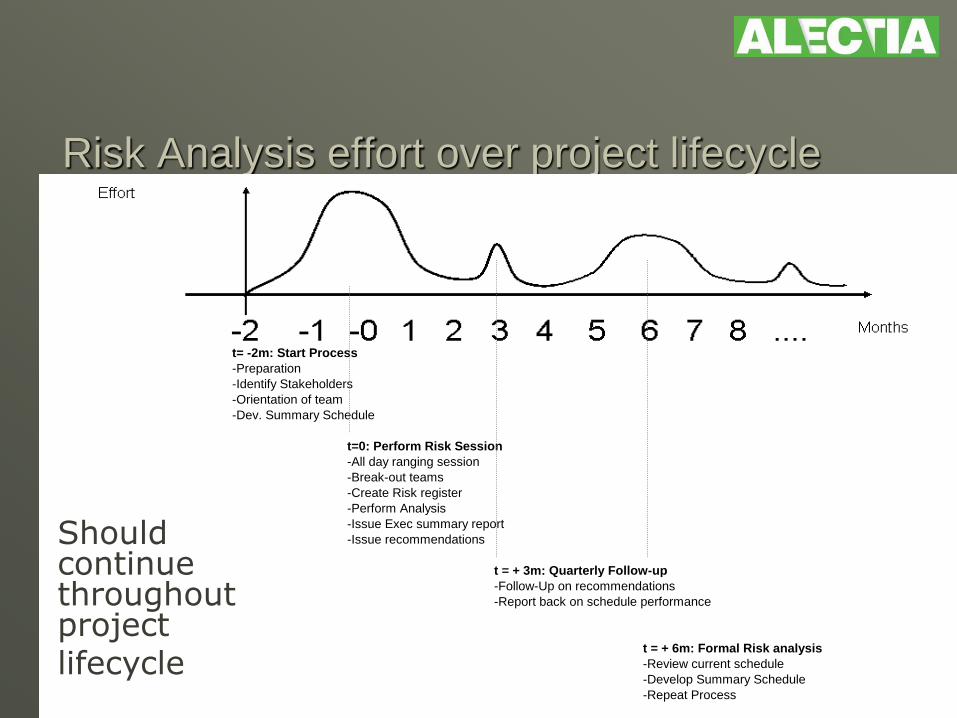
Risk Analysis effort over project lifecycle
t= -2m: Start Process
-Preparation
-Identify Stakeholders
-Orientation of team
-Dev. Summary Schedule
t=0: Perform Risk Session
-All day ranging session
-Break-out teams
-Create Risk register
-Perform Analysis
-Issue Exec summary report
-Issue recommendations
t = + 3m: Quarterly Follow-up
-Follow-Up on recommendations
-Report back on schedule performance
t = + 6m: Formal Risk analysis
-Review current schedule
-Develop Summary Schedule
-Repeat Process
Should continue throughout project lifecycle
Properly orchestrated project controls should drive the business, not report what happened
Tom Kowalyk, Global director, project controls Johnson & Johnson Pharmaceutical
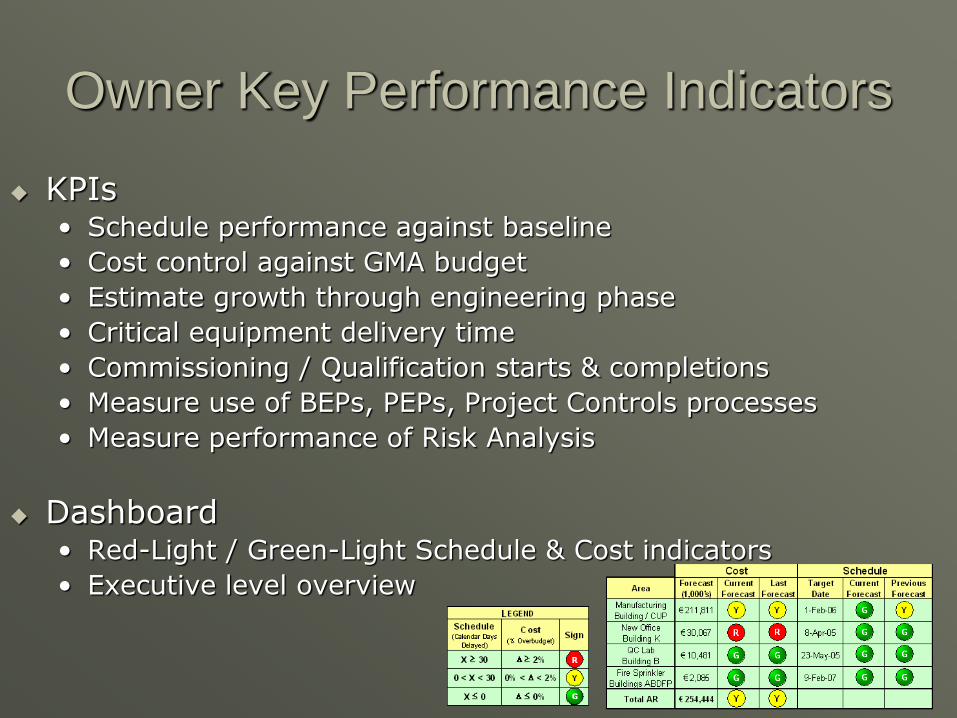
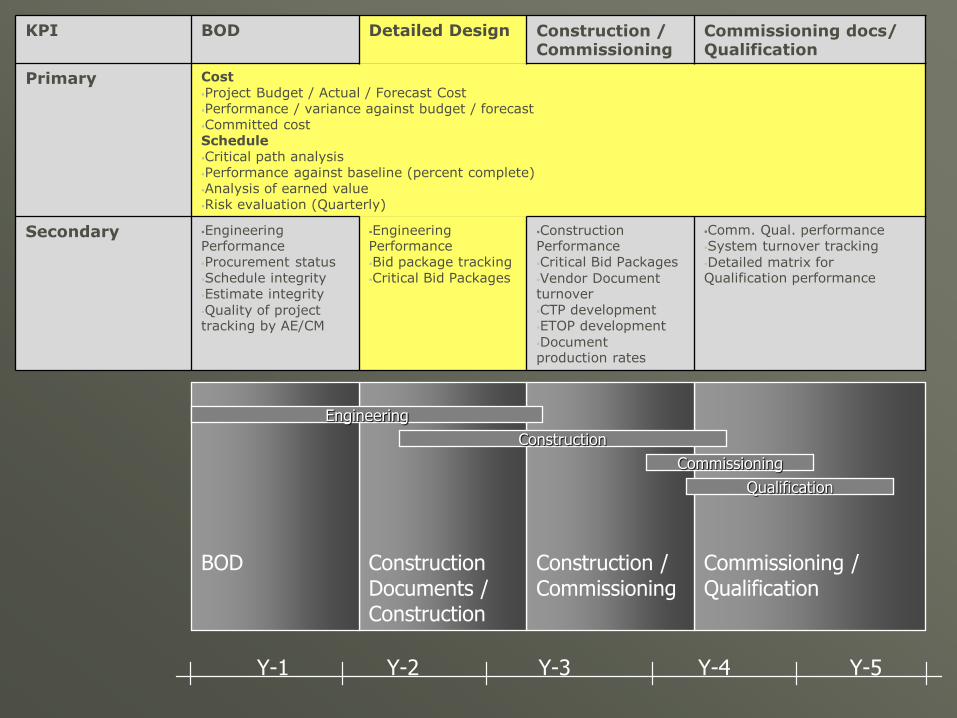
Owner Key Performance Indicators
KPIs • Schedule performance against baseline
• Cost control against GMA budget
• Estimate growth through engineering phase
• Critical equipment delivery time
• Commissioning / Qualification starts & completions
• Measure use of BEPs, PEPs, Project Controls processes
• Measure performance of Risk Analysis
Dashboard • Red-Light / Green-Light Schedule & Cost indicators
• Executive level overview
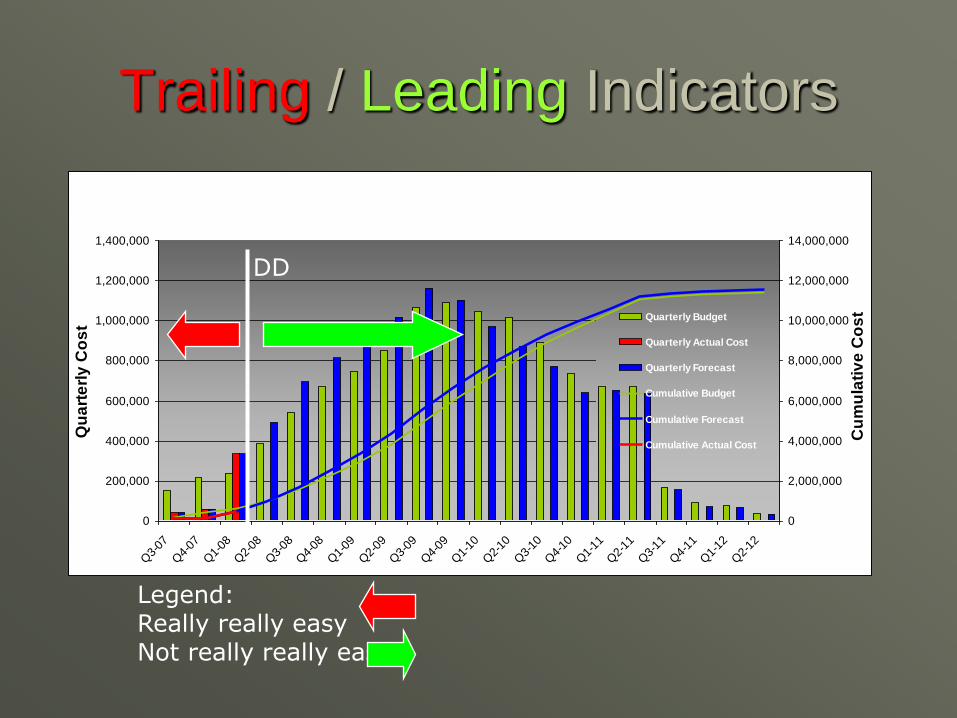
Trailing / Leading Indicators
0
200,000
400,000
600,000
800,000
1,000,000
1,200,000
1,400,000
Q3-
07
Q4-
07
Q1-
08
Q2-
08
Q3-
08
Q4-
08
Q1-
09
Q2-
09
Q3-
09
Q4-
09
Q1-
10
Q2-
10
Q3-
10
Q4-
10
Q1-
11
Q2-
11
Q3-
11
Q4-
11
Q1-
12
Q2-
12
Qu
art
erl
y C
os
t
0
2,000,000
4,000,000
6,000,000
8,000,000
10,000,000
12,000,000
14,000,000
Cu
mu
lati
ve
Co
stQuarterly Budget
Quarterly Actual Cost
Quarterly Forecast
Cumulative Budget
Cumulative Forecast
Cumulative Actual Cost
Ground Water Project
Total
DD
Legend: Really really easy Not really really easy
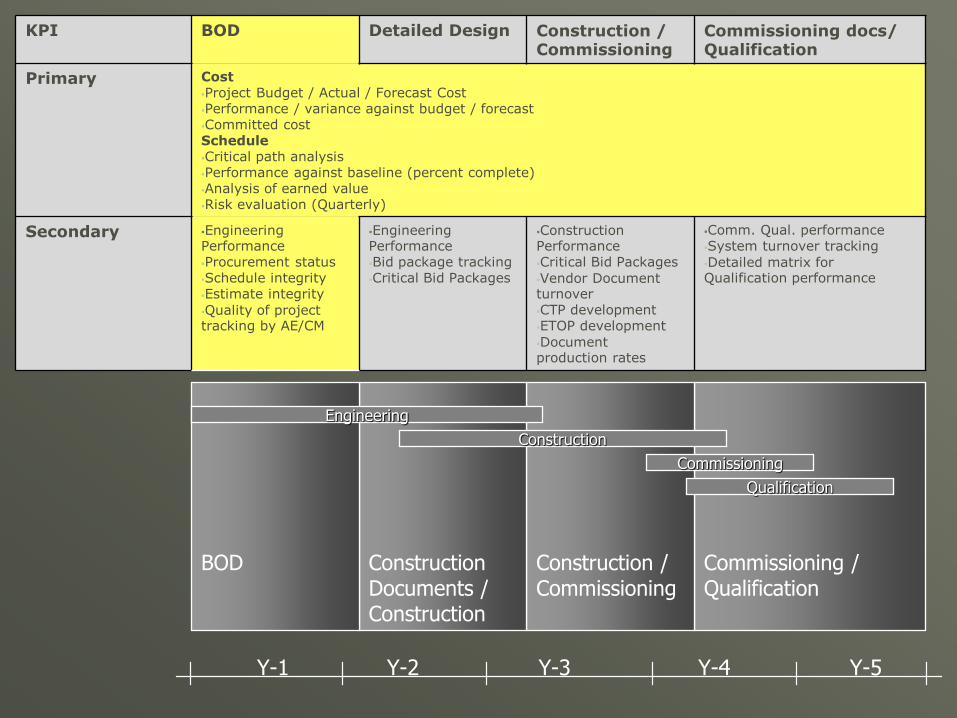
KPI BOD Detailed Design Construction / Commissioning
Commissioning docs/ Qualification
Primary Cost
Project Budget / Actual / Forecast Cost
Performance / variance against budget / forecast
Committed cost
Schedule
Critical path analysis
Performance against baseline (percent complete)
Analysis of earned value
Risk evaluation (Quarterly)
Secondary Engineering Performance
Procurement status
Schedule integrity
Estimate integrity
Quality of project tracking by AE/CM
Engineering Performance
Bid package tracking
Critical Bid Packages
Construction Performance
Critical Bid Packages
Vendor Document turnover
CTP development
ETOP development
Document production rates
Comm. Qual. performance
System turnover tracking
Detailed matrix for Qualification performance
Commissioning / Qualification
Construction / Commissioning
Construction Documents / Construction
BOD
Engineering
Commissioning
Qualification
Y-2 Y-3 Y-4 Y-5Y-1
Construction
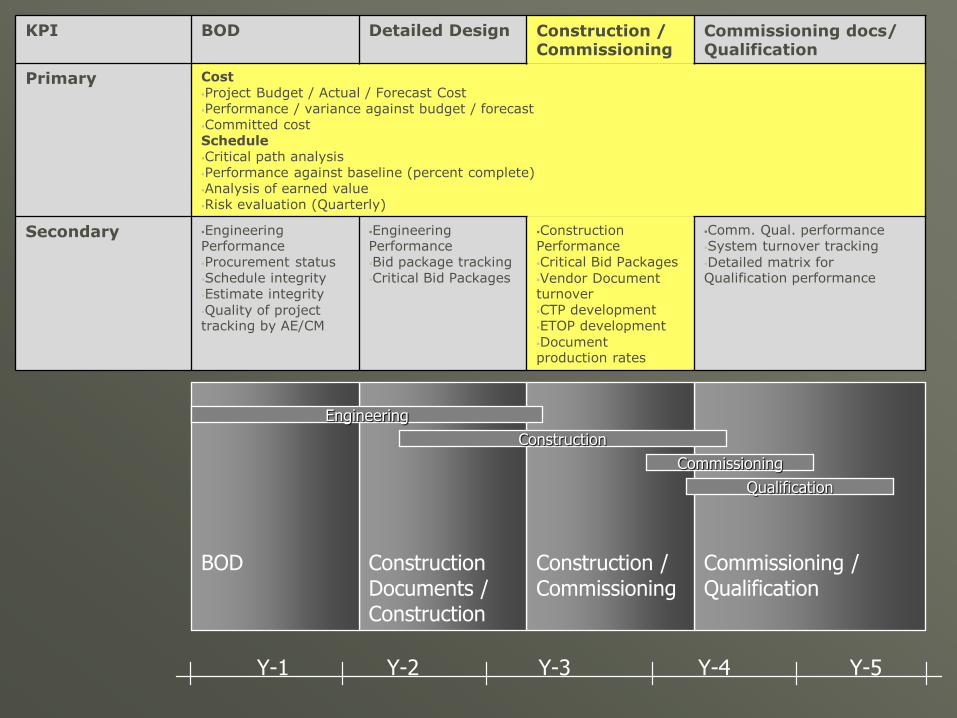
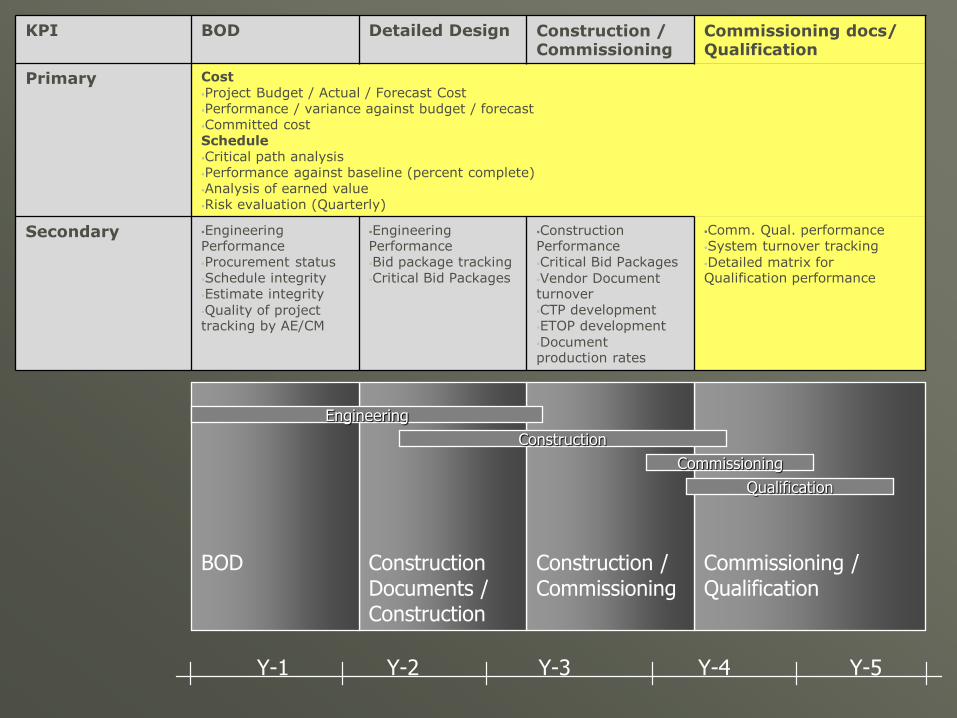
In Closing
Risk Management reduces schedule delays and cost overruns
Exposing true critical issues
Ensuring common understanding of project goals
Establishes framework for proactive management
Risk Management makes sence!
“Its not the strongest species that survive, nor the most intelligent
but those most adaptive to change.”
Charles Darwin:
Thank You!
Peter Luke
B.Sc, PMP
Head of department
Owner Rep Services / Bygherrerådgivning

Thanks!


