24
Best Practices to reduce Methane emissions from Arctic Oil and Gas Production Stephanie Saunier 14 Mars 2013
Best Practices to reduce�Methane emissions from�
Arctic Oil and Gas Production�
Stephanie Saunier�14 Mars 2013
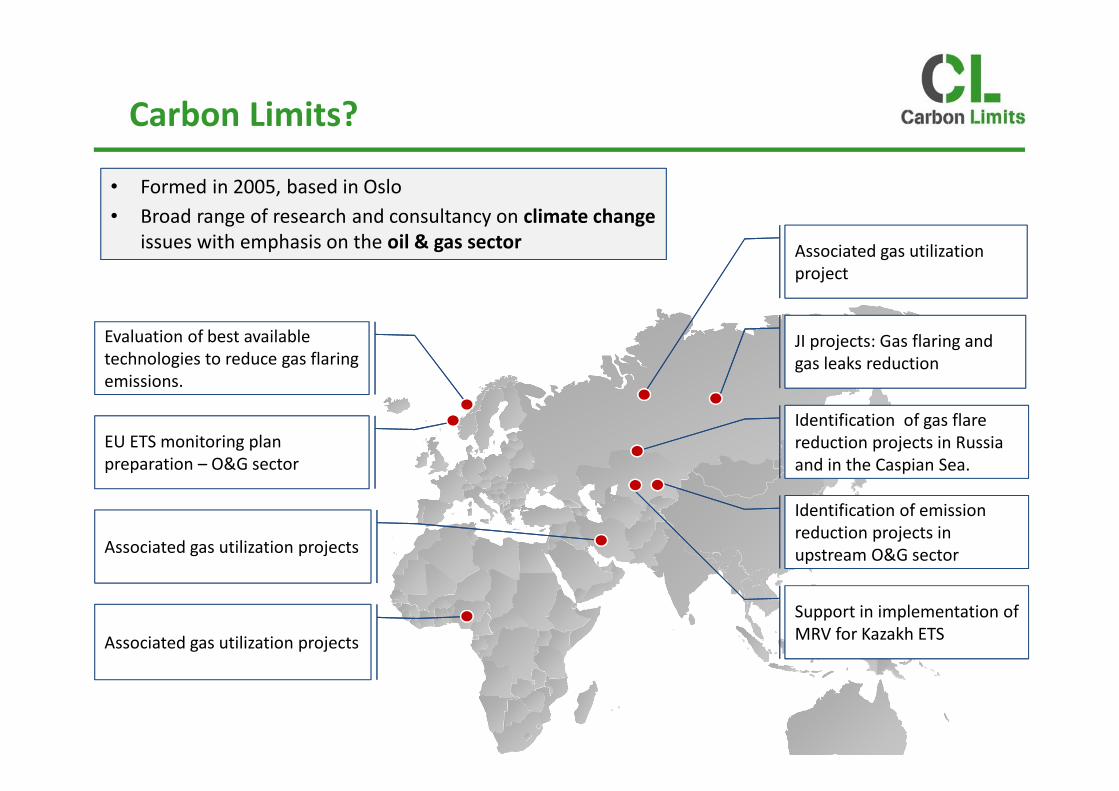
Carbon Limits?�
Associated gas utilization projects
Associated gas utilization projects
Evaluation of best available
technologies to reduce gas flaring
emissions.
Associated gas utilization
project
Identification of gas flare
reduction projects in Russia
and in the Caspian Sea.
Support in implementation of
MRV for Kazakh ETS
JI projects: Gas flaring and
gas leaks reduction
Identification of emission
reduction projects in
upstream O&G sector
• Formed in 2005, based in Oslo
• Broad range of research and consultancy on climate change
issues with emphasis on the oil & gas sector
EU ETS monitoring plan
preparation – O&G sector
Document the best available technologies
Evaluate their abatement costs in “arctic”
conditions
Document the current practices
1
2
3
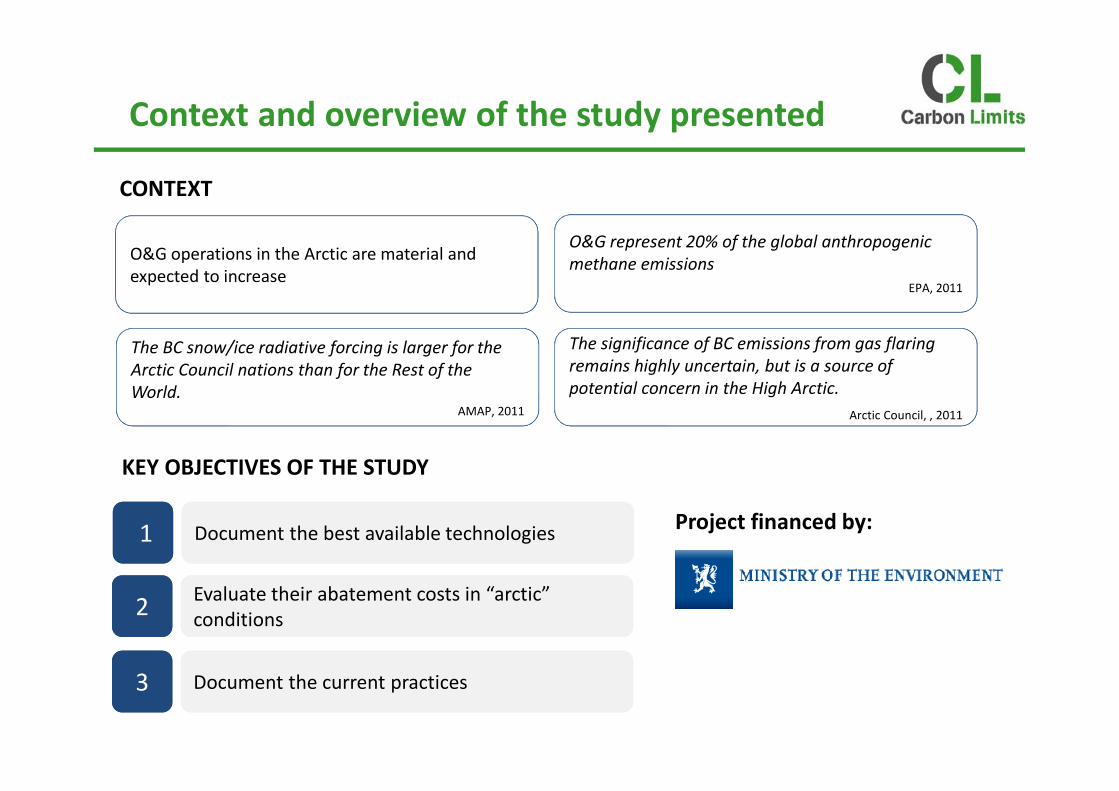
Context and overview of the study presented�
CONTEXT�
O&G operations in the Arctic are material and
expected to increase
The BC snow/ice radiative forcing is larger for the
Arctic Council nations than for the Rest of the
World. AMAP, 2011
O&G represent 20% of the global anthropogenic
methane emissions
EPA, 2011
The significance of BC emissions from gas flaring
remains highly uncertain, but is a source of
potential concern in the High Arctic.
Arctic Council, , 2011
KEY OBJECTIVES OF THE STUDY�
Document the best available technologies
Evaluate their abatement costs in “arctic”
conditions
Document the current practices
1
2
3
Project financed by:

Methodology
Gas Flaring
Methane emissions sources
Abatement Costs
AGENDA�
Methodology
Gas Flaring
Methane emissions sources
Abatement Costs

Gas Flaring
Methane emissions sources
Abatement Costs
AGENDA�
Methodology
Gas Flaring
Methane emissions sources
Abatement Costs

Project’s methodology and approach�
WORKPLAN > 50 INTERVIEWS PERFORMED�
Interview with technology providers
Literature Review
Interview with Oil and Gas companies
Interview with other stakeholders

BC and Methane emission sources�Where, when, what type of emissions?
ME
TH
AN
E
BLA
CK
CA
RB
ON
TRANSPORT�
• Vessels and ships
• Land and air
transport
WELLS
• Drilling operations
• Well tests
• Completion/ testing
• Well plugging and
abandonment
• Gas venting and
flaring
• Well tests
< EXPLORATION >�
• Power/Heat
generation
• Associated Gas
Flaring
OIL PRODUCTION
• Associated Gas
Flaring
• Associated Gas
Venting
• Fluid degasing
• Casinghead gas
venting
< PRODUCTION >
GAS PRODUCTION�
• Gas flaring�
• Compressors
• Dehydrator and
pumps
• Pneumatic devices
• Fugitive leakages
• Well blowdown
• Well completion
STORAGE/LOADING
• Vessels and ships
• Land and air
transport
• Storage tanks/
loading
• Sea transport
KEY
• Applicable both
onshore and offshore
• Applicable offshore
only
• Applicable only onshore

Methodology
Gas Flaring
Abatement Costs
AGENDA�
Methodology
Gas Flaring
Methane emissions sources
Abatement Costs

Key sources of potential methane emissions�
FLOW ASSURANCE PNEUMATIC DEVICES
STORAGE AND LOADING
FUGITIVE EMISSIONS
COMPRESSORS
OTHER SOURCES

Components can develop leaks due to normal wear, process variations and environmental conditions
FUGITIVE EMISSIONS
Emission Source Technology /practice Maturity Offshore?
Onshore?
Applicable
Exploration
development?
Emission reduction
Fugitive emissions
Directed Inspection and
Maintenance H BOTH YES 60%-80%
Subsea leakages detection &
repair M OFF NA Uncertain
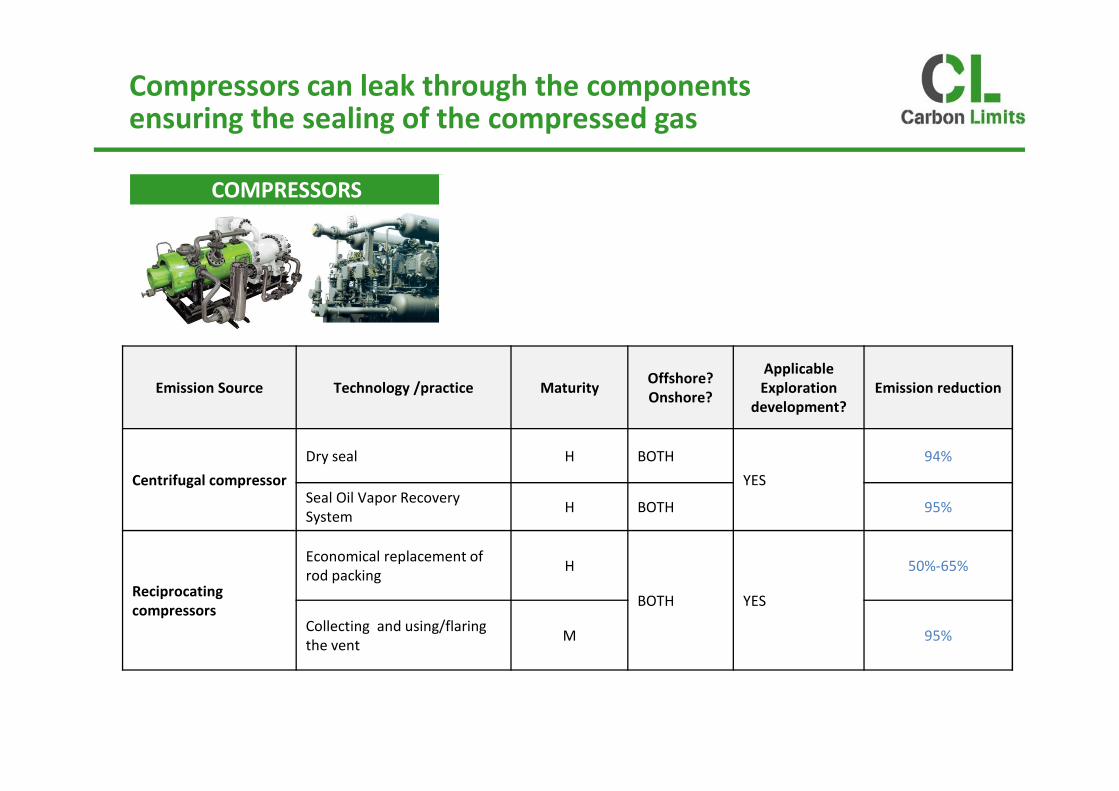
Compressors can leak through the components ensuring the sealing of the compressed gas
COMPRESSORS
Emission Source Technology /practice Maturity Offshore?
Onshore?
Applicable
Exploration
development?
Emission reduction
Centrifugal compressor
Dry seal H BOTH
YES
94%
Seal Oil Vapor Recovery
System H BOTH 95%
Reciprocating
Economical replacement of
rod packing H 50%-65%
compressors Collecting and using/flaring
the vent M
BOTH YES
95%
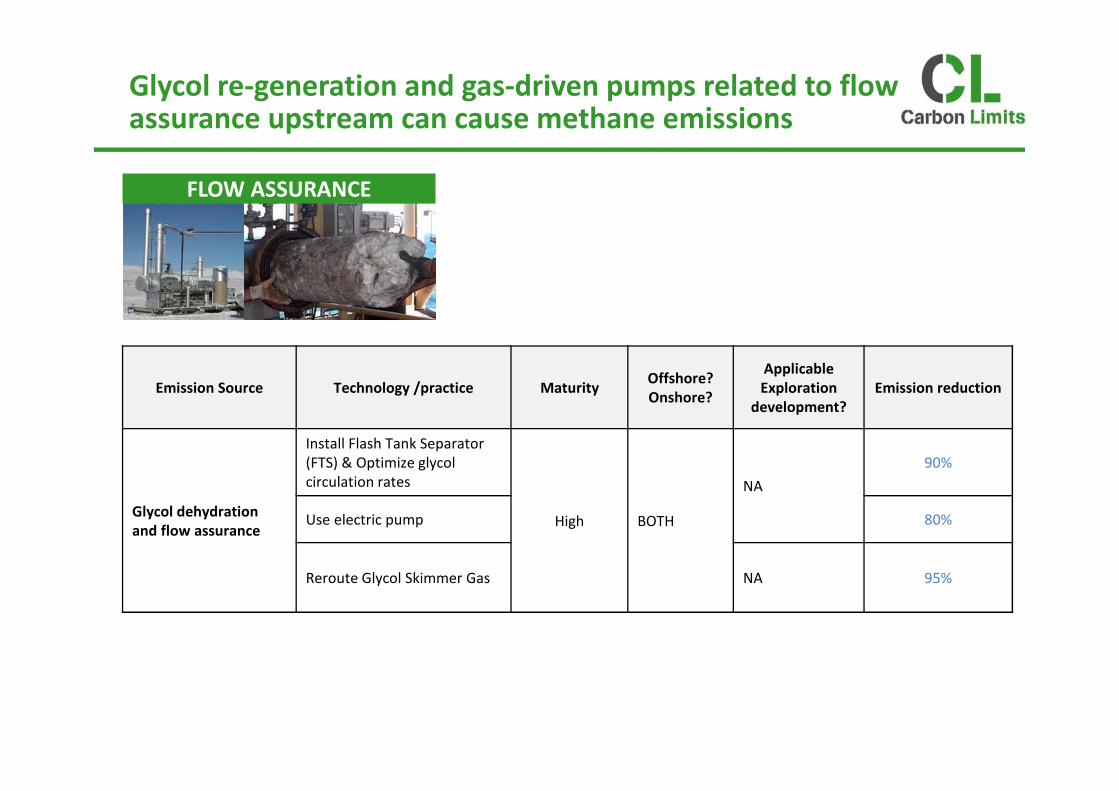
Glycol re-generation and gas-driven pumps related to flow assurance upstream can cause methane emissions
FLOW ASSURANCE
Emission Source Technology /practice Maturity Offshore?
Onshore?
Applicable
Exploration
development?
Emission reduction
Install Flash Tank Separator
(FTS) & Optimize glycol
circulation rates NA
90%
Glycol dehydration
and flow assurance Use electric pump High BOTH 80%
Reroute Glycol Skimmer Gas NA 95%

Remote, non-electrified sites often use gas-driven pneumatic devices emitting CH4 for automatic process control
PNEUMATIC DEVICES
Emission Source Technology /practice Maturity Offshore?
Onshore?
Applicable
Exploration
development?
Emission reduction
Replacement to low bleed
devices 90%
Pneumatic devices Retrofit into low bleed
H BOTH NA 90%
Replacement to air driven
instrument 100%

Methane and nmVOCs are released from hydrocarbon products during storage and loading
STORAGE AND LOADING
Emission Source Technology /practice Maturity Offshore?
Onshore?
Applicable
Exploration
development?
Emission reduction
Reduce operating pressure
upstream H Up to 30%
Increase tank pressure L-M 10-20%
Storage and loading of
hydrocarbon products
Change geometry of loading
pipes M
BOTH NA
Poor data
VRU: Gas compression H 95%
VRU: Ejector H
>95% VRU: VOC condensation & gas
M-H recovery

Methodology
Methane emissions sources
Abatement Costs
AGENDA�
Methodology
Gas Flaring
Methane emissions sources
Abatement Costs
Rich gas (for
processing)
Dry gas, LPG,
condensate
Electricity
(industry/grid)
Heat (industry/
residential)Electricity
Heat
Re injection
Industrial
products
Liquid fuels
(Gas to Liquids)
Flare gas recovery
system
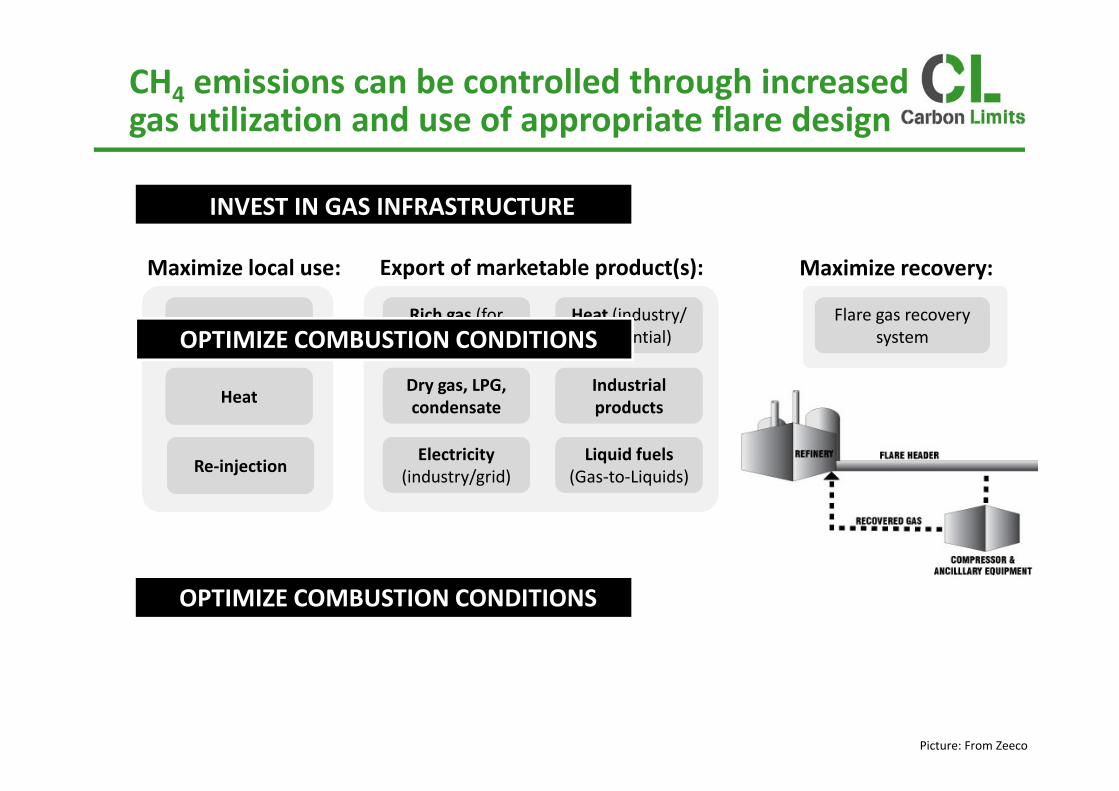
CH4 emissions can be controlled through increased�gas utilization and use of appropriate flare design�
INVEST IN GAS INFRASTRUCTURE
Maximize local use: Export of marketable product(s): Maximize recovery:�
Rich gas (for
processing)
Dry gas, LPG,
condensate
Electricity
(industry/grid)
Heat (industry/
residential) Electricity
Heat
-Re-injection
Industrial
products
- -
Liquid fuels
(Gas-to-Liquids)
Flare gas recovery
systemOPTIMIZE COMBUSTION CONDITIONS
OPTIMIZE COMBUSTION CONDITIONS
Picture: From Zeeco
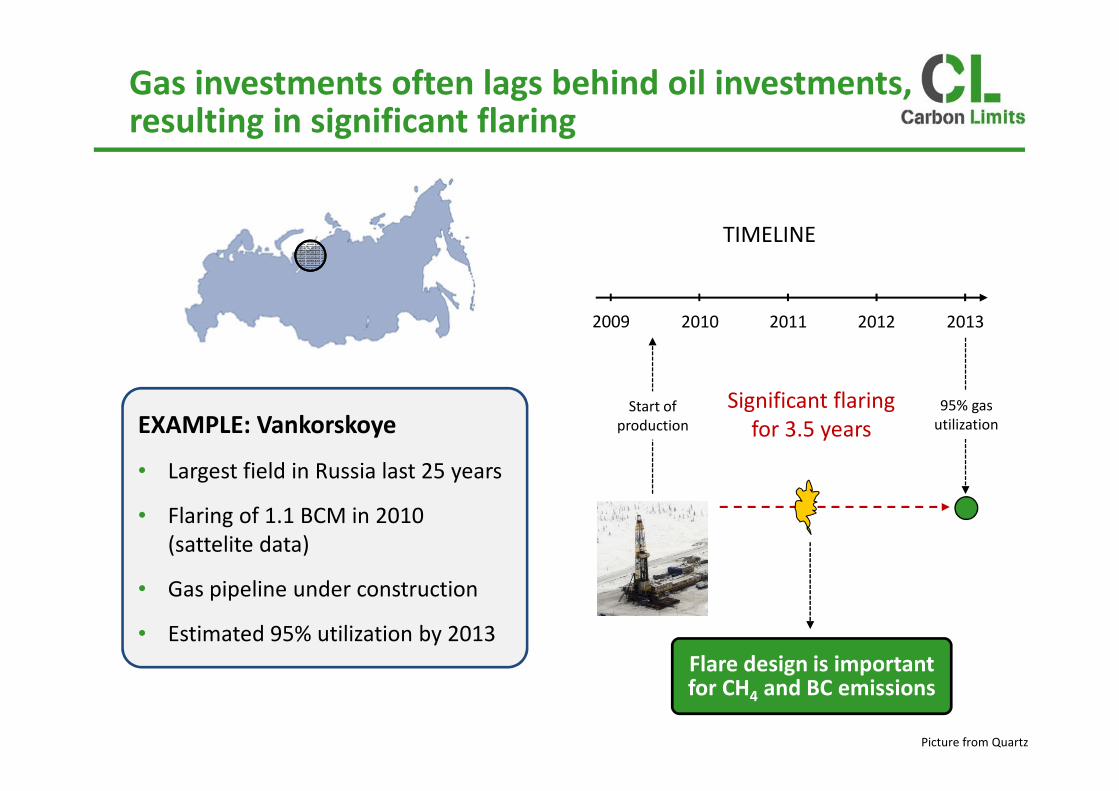
Gas investments often lags behind oil investments, resulting in significant flaring
EXAMPLE: Vankorskoye
• Largest field in Russia last 25 years
• Flaring of 1.1 BCM in 2010
(sattelite data)
• Gas pipeline under construction
• Estimated 95% utilization by 2013
TIMELINE�
2009 2010 2011 2012 2013�
Start of
production
Significant flaring�for 3.5 years�
95% gas
utilization
Flare design is important for CH4 and BC emissions
Picture from Quartz
Methodology
Gas Flaring
Methane emissions sources
AGENDA�
Methodology
Gas Flaring
Methane emissions sources
Abatement Costs

Literature review
Interview results
What are
the costs
for ….?
It
depends….
More than 850 abatement cost
estimates for 16 technologies
Approach and Methodology�
APPROACH�
What are
the costs
for ….? It
depends….
More than 850 abatement cost
estimates for 16 technologies
There is not one abatement cost…. SOURCE OF INFORMATION
Abatement costs depends on:
• Whether the project is new or retrofit
• Whether it is offshore or onshore
• The size of the infrastructure
Literature review
Interview results
• The local value of the gas
• The emissions factors of the emission source
• The share of methane in the recovered gas….

Factors influencing abatement costs in the Arctic�
Factors Influencing Costs
Generally, equipment/material costs are
similar
But differences in
• Installation costs
• Transport and freight costs
• Labour costs
• Design and engineering costs
Factor Influencing Revenue
Local gas (or other products) value
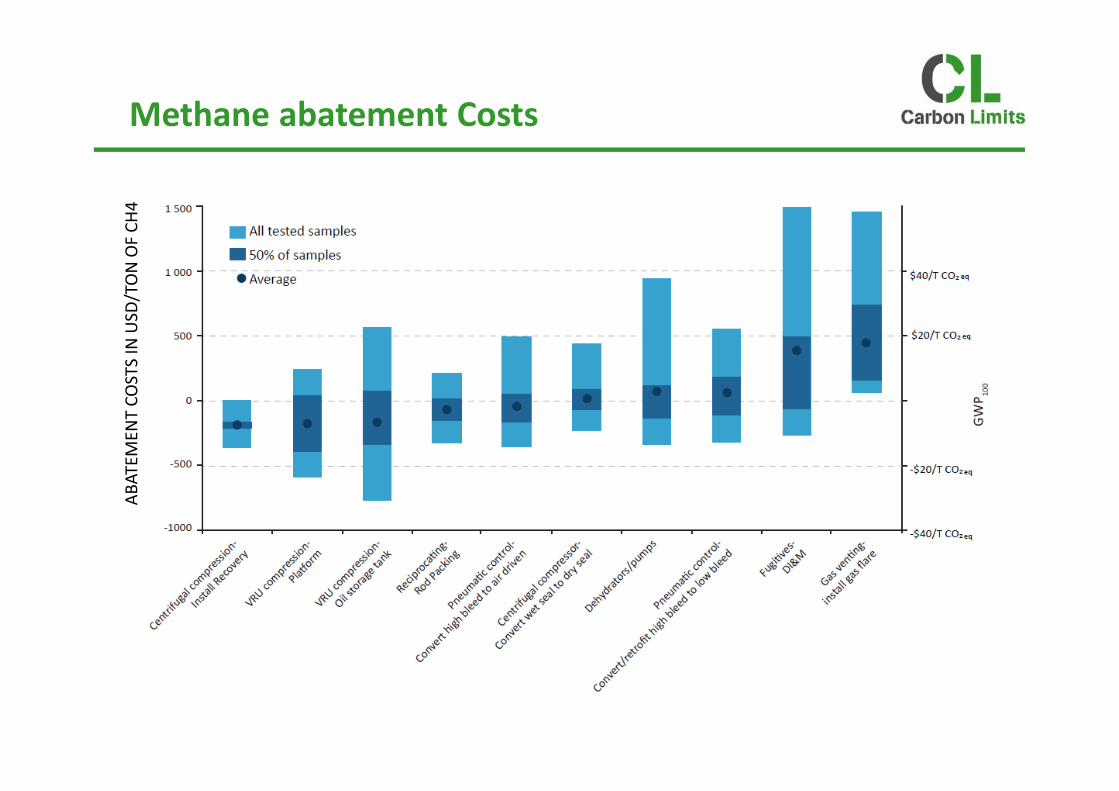
Methane abatement Costs�
AB
AT
EM
EN
T C
OS
TS
IN
US
D/T
ON
OF
CH
4�

DATA/INFORMATION GAPS
ECONOMIC BARRIERS
POLICY UNCERTAINTIES
GAS UTILISATION BARRIERS
PRACTICAL BARRIERS
There are a number of barriers to projects implementation
DATA/INFORMATION GAPS
ECONOMIC BARRIERS
POLICY UNCERTAINTIES
GAS UTILISATION BARRIERS
PRACTICAL BARRIERS
CONCLUSIONS�
• Most technologies can be applied in the Arctic without
technical barriers
• Some of the best practices are commonly applied in Norway,
North America, and in some cases, in Russia
• Key challenges remain for smaller, old or dispersed sites
• Abatement costs vary significantly between cases
• Higher installation and operational costs in the Arctic coupled
with low value of gas (e.g. where gas is re-injected or flared)
represents a barrier
Report available: http://www.carbonlimits.no/�


![GAS TURBINE EMISSIONS IN AIRPORTS VICINITY DURING LTO …€¦ · [GAS TURBINE EMISSIONS IN AIRPORTS VICINITY DURING LTO CYCLES] Abstract “Gas Turbine Emissions In Airports Vicinity](https://static.documents.pub/doc/80x56/5e8f941abb6aa82e5c5cf5a7/gas-turbine-emissions-in-airports-vicinity-during-lto-gas-turbine-emissions-in.jpg)


