36
Surface Area and Porosity Outline • Background ✦ Techniques • Surface area ✦ Total - physical adsorption ✦ External ✦ Porosity ✦ meso ✦ micro 1 2 Tuesday, December 4, 12
| Date post: | 10-Dec-2015 |
| Category: |
Documents |
| Upload: | chuah-chong-yang |
| View: | 3 times |
| Download: | 1 times |

Surface Area and
Porosity
Outline• Background
✦ Techniques
• Surface area
✦ Total - physical adsorption
✦ External
✦ Porosity
✦ meso
✦ micro
1
2Tuesday, December 4, 12

Length1 mm1 µm1 nm1 Å
macromeso
micrometal
crystallite
10-3m10-4m10-5m10-6m10-7m10-8m10-9m10-10m
humanhair
red bloodcell
red ant
C-Cbond
Carbonnanotube
Transistorgate
cell membrane
10 100 10 100
Techniques
Mercury intrusion
• Adsorption
Physical
Chemical
Temperature Programmed Methods
3
4Tuesday, December 4, 12

Physical Adsorption
Characterization via Adsorption
Material Characterization
• Physical properties
• DifferentiateGas Adsorption
• Quantity adsorbed on a surface as a function of pressure, volume, and temperature
• Modeled properties
• Surface area
• Pore structure
• Non-destructuve
5
6Tuesday, December 4, 12
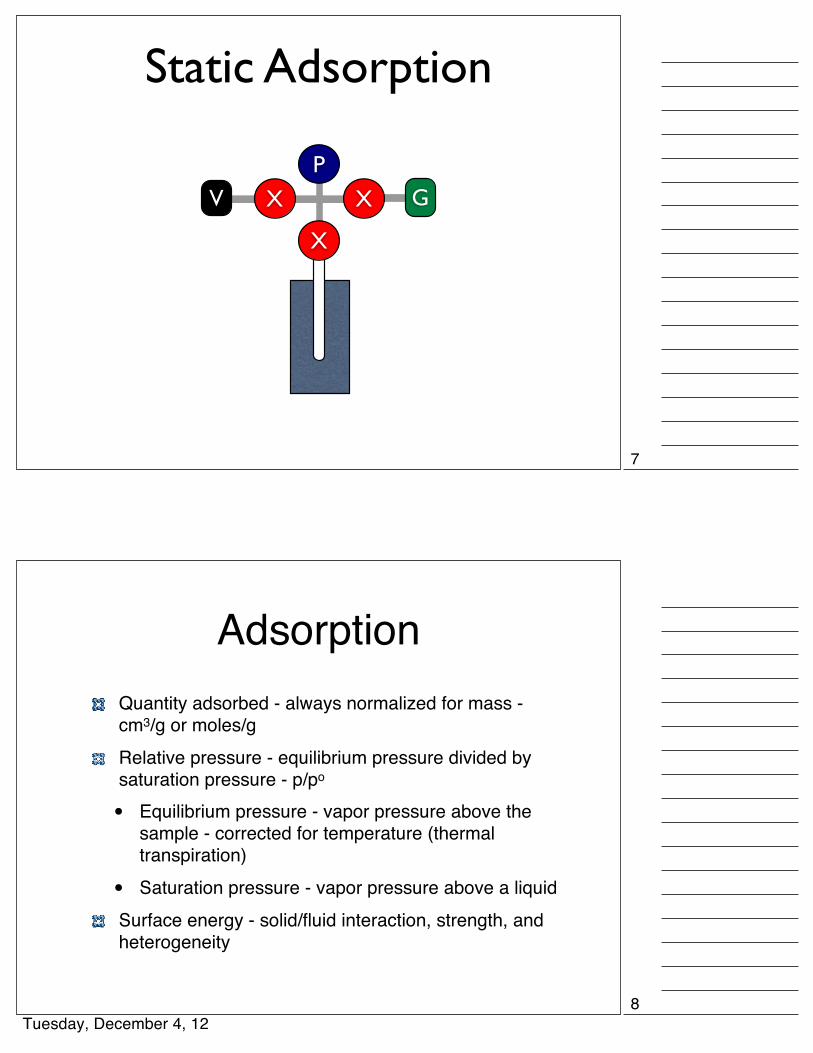
Static Adsorption
XX
PV G
X
AdsorptionQuantity adsorbed - always normalized for mass - cm3/g or moles/gRelative pressure - equilibrium pressure divided by saturation pressure - p/po
• Equilibrium pressure - vapor pressure above the sample - corrected for temperature (thermal transpiration)
• Saturation pressure - vapor pressure above a liquidSurface energy - solid/fluid interaction, strength, and heterogeneity
7
8Tuesday, December 4, 12

Sample PreparationClean the surface Remove volatiles
• Water
• CO2
• SolventsControlled environment!
• Inert purge or vacuum
• Temperature controlAvoid Phase Changes
Physical AdsorptionMolecules from the gas phase strike the surface.
At equilibrium the molecule adsorbs, lose the heat of adsorption, and subsequently desorb from surface.
At equilibrium the rate of condensation = the rate of desorption
Constant surface coverage at equilibrium.
Surface features change the adsorption potential.
Surface area models neglect the effects of localized phenomenon.
Curve surfaces or roughness provide enhanced adsorption potential.
9
10Tuesday, December 4, 12

!100
!80
!60
!40
!20
0
20
40
60
0 1 2 3 4 5 6 7
Pot
entia
l Ene
rgy,
kJ/
mol
Distance from Surface, Å
Physical AdsorptionNot activated (no barrier)
Rapid
Weak (< 38 kJ/mol)
Atomic/Molecular
Reversible
Non-specific
May form multilayers
van der Waals/dipole interactions
Often measured near the condensation temperature
!100
!80
!60
!40
!20
0
20
40
60
0 1 2 3 4 5 6 7
Pot
entia
l Ene
rgy,
kJ/
mol
Distance from Surface, Å
Chemical AdsorptionMay be activated
Covalent, metallic, ionic
Strong (> 35 kJ/mol)
May be dissociative
Often irreversible
Specific - surface symmetry
Limited to a monolayer
Wide temperature range
11
12Tuesday, December 4, 12

Isotherm TypesI
n ads
II
P
IV
III
V VI
• Constant temperature
• Quantity adsorbed as a function of pressure
• Vacuum to atmospheric
• Six classifications
• Quantity is normalized for sample mass
Classical View of Adsorption
As the system pressure is increased the formation of a monolayer may be observed.
qa
ds
p/po
IV
A
A
13
14Tuesday, December 4, 12

Adsorbed Layer Density
• The first layer begins to form below 1x10⁻⁴ p/po
• The density continues to increase with pressure/adsorption
• The monolayer is completed below 0.1 p/po
qa
ds
p/po
IV
AB
Classical View of Adsorption
As the system pressure is increased (gas concentration also increases) multiple layers sorb to the surface. A
B
15
16Tuesday, December 4, 12

Adsorbed Layer Density
• The monolayer is completed below 0.1 p/po
• The second layer continues to form as pressure is increased
• The third layer appears at < 0.5 p/po
qa
ds
p/po
IV
AB
C
Classical View of AdsorptionAs pressure is further increased we may observe capillary condensation in mesopores.
AB-C
17
18Tuesday, December 4, 12
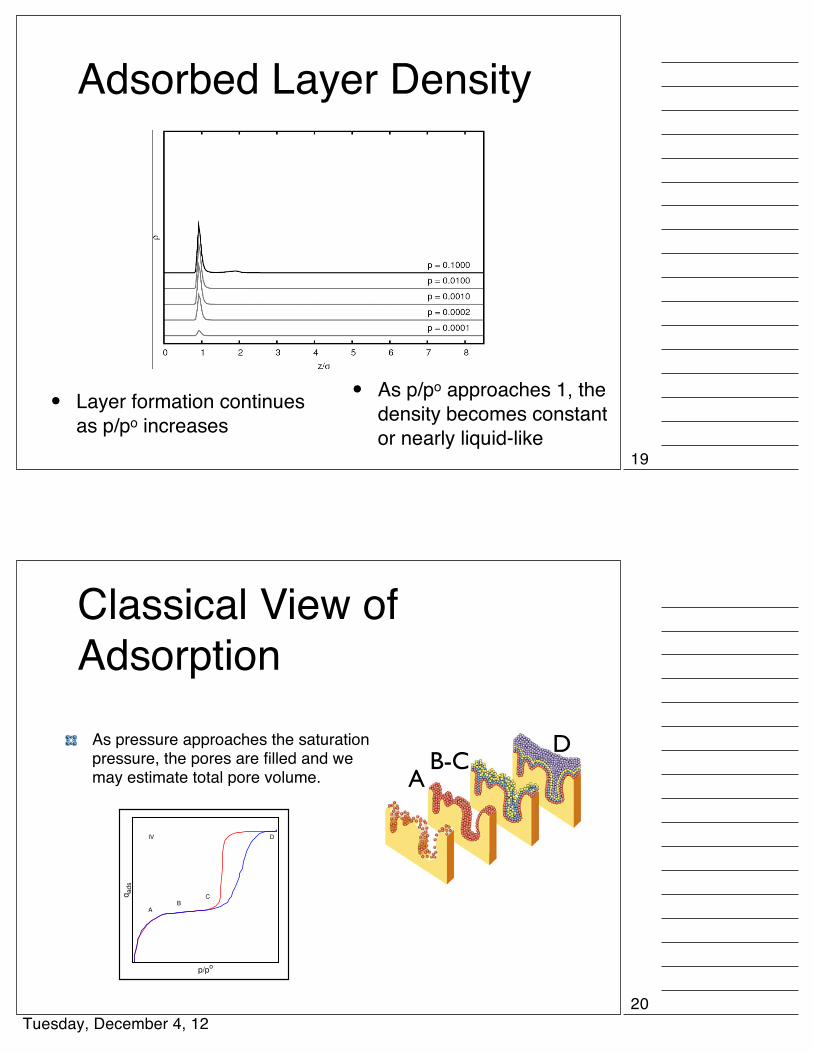
Adsorbed Layer Density
• Layer formation continues as p/po increases
• As p/po approaches 1, the density becomes constant or nearly liquid-like
qa
ds
p/po
IV
AB
C
D
Classical View of Adsorption
As pressure approaches the saturation pressure, the pores are filled and we may estimate total pore volume. A
B-CD
19
20Tuesday, December 4, 12
Adsorptives
Nitrogen
Argon
Krypton
NitrogenBroad usage
• Surface area
• t-plot
• Pore size distributions
• BJH - bulk fluid properties
• NLDFT - excess density
Limitations
• Strong interactions
• Slow diffusion < 0.5 nm pores
• Reduced precision for materials with < 1m2/g (10µmol/g monolayer)
21
22Tuesday, December 4, 12

0
50
100
150
200
250
1e-08 1e-07 1e-06 1e-05 0.0001 0.001 0.01 0.1 1
Va
ds,
cm
3/g
p/po
ZSM-5Faujasite
Confinement
ArgonPore size distributions
• H-K calculations
• NLDFT - excess density
Benefits
• Reduced interaction compared to N2
• Molecular size < N2
and faster diffusion due to size and T (87K)
Limitations
• Ar molecular area not a generally accepted value
• Statistical t-curves based upon N2
• Not used for BJH - bulk fluid methods
23
24Tuesday, December 4, 12

0
50
100
150
200
250
1e-07 1e-06 1e-05 0.0001 0.001 0.01 0.1 1
Vads,
cm
3/g
p/po
Faujasite (H+)
NitrogenArgon
Y zeolite, Ar Adsorption
0
20
40
60
80
100
120
140
160
180
200
1e-08 1e-07 1e-06 1e-05 0.0001 0.001 0.01 0.1 1
Va
ds,
cm
3/g
p/po
ZSM-5 (LN2)
NitrogenArgon
ZSM-5, Ar Adsorption
25
26Tuesday, December 4, 12

0
20
40
60
80
100
120
140
1e-07 1e-06 1e-05 0.0001 0.001 0.01 0.1 1
Vads,
cm
3/g
p/po
AdsorptionDesorption
ZSM-5 Low P Desorption
KryptonSurface area estimates - BET
• Low specific surface area (< 1m2/g)
• Low absolute area - limited sample quantity
Benefits
• High precision, low pressure analysis
Limitations
• Pressure range limited to < 1 torr at 77 K (<0.3 p/po)
• General agreement with N2
• Cost
• Limited to surface area applications
27
28Tuesday, December 4, 12

Error analysisGas Law calculations
Error
Typical values
Relative error
Error Reduction
Probe Temperature, K Reference P ratioRelative Error
Ar 77 N2 200/760 0.26
Kr 77 N2 2.4/760 0.003
Kr 87 Ar 50/760 0.07
29
30Tuesday, December 4, 12

Surface Area
Surface Area• Area from adsorption
• nm - monolayer
• NA - Avogadro’s number
• Total area - physical adsorption
• area of adsorbed molecule - nitrogen or krypton
• Active area - chemical adsorption
• area of a surface site - metal atom
• Stoichiometry
31
32Tuesday, December 4, 12

nads
P
I
Type I Isotherm - Langmuir Isotherm
Mono-layer adsorption
• Chemical Adsorption
Micropore filling
Finely divided surface
Limiting amount adsorbed as p/po approaches 1
Langmuir
Reduces to the familiar form of the Langmuir equation for associative adsorption
At low coverage, the Langmuir equation converges with Henry’s Law
33
34Tuesday, December 4, 12

Nitrogen adsorption on Graphitized Carbon
CarboPack F
• 6 m2/gSterling FT
• 10 m2/gHenry’s law constant
• 19 (mmols/m2) / atm
0.0001
0.001
0.01
0.1
1
1e-05 0.0001 0.001 0.01 0.1 1
nads,
(m
mo
les/
m2)/
g
P
Henry’s LawAdsorptionDesorption
1e-05
0.0001
0.001
0.01
0.1
1e-06 1e-05 0.0001 0.001 0.01
na
ds,
(m
mole
s/m
2)/
g
P
Henry’s Law - Sterling FTCarbopack F - MICCarbopack F - Kruk
Sterling FT - MIC
Langmuir Estimate of nm
13X
620 m2/g
0
50
100
150
200
250
0 0.1 0.2 0.3 0.4 0.5 0.6 0.7 0.8 0.9 1
Qua
ntity
Ads
orbe
d, c
m3 /g
p/po
X Zeolite, 0.8nm pores
Adsorption
0
0.001
0.002
0.003
0.004
0.005
0.006
0.007
0 0.2 0.4 0.6 0.8 1
p/Q
, mm
Hg/
(cm
3 /g S
TP)
Pressure, mmHg
Langmuir Transformation, 13x Zeolite
13X
35
36Tuesday, December 4, 12
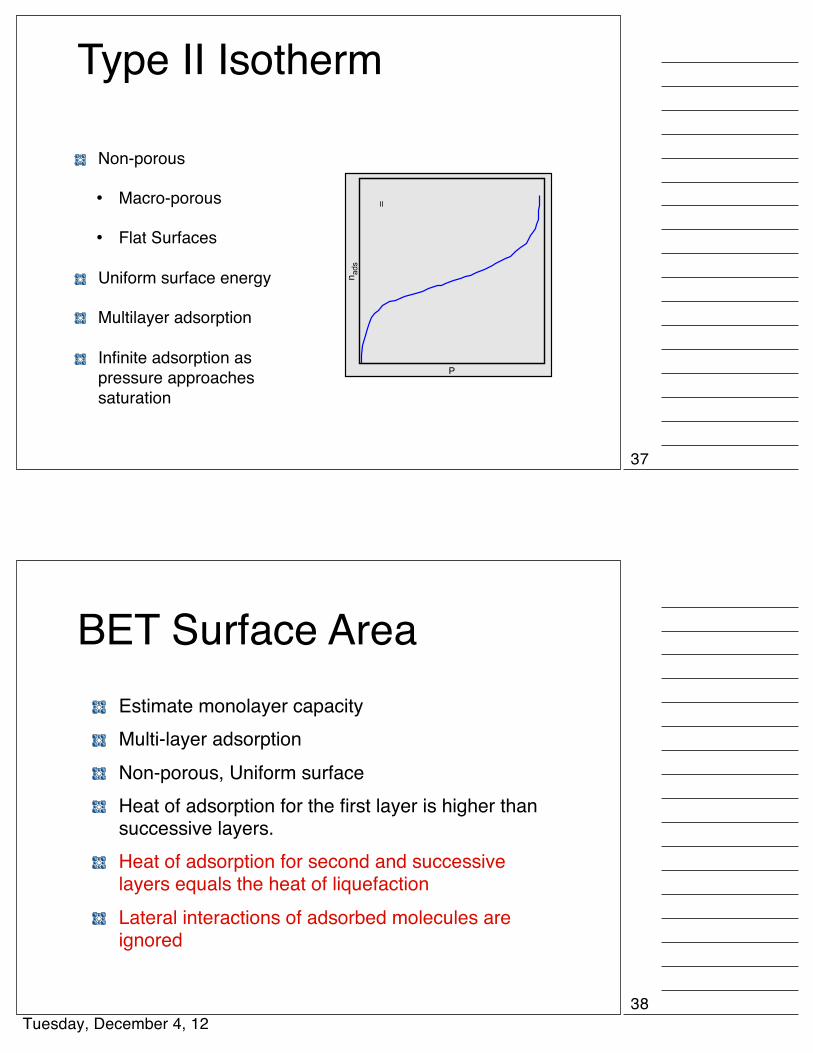
Type II Isotherm
Non-porous
• Macro-porous
• Flat Surfaces
Uniform surface energy
Multilayer adsorption
Infinite adsorption as pressure approaches saturation
nads
P
II
BET Surface AreaEstimate monolayer capacityMulti-layer adsorptionNon-porous, Uniform surfaceHeat of adsorption for the first layer is higher than successive layers.Heat of adsorption for second and successive layers equals the heat of liquefactionLateral interactions of adsorbed molecules are ignored
37
38Tuesday, December 4, 12

NLDFT estimate for the density of the adsorbed layers
• The density varies with distance from the surface.
• This is contrast to BET assumptions
• However, at 0.5 p/po there are only 3 layers
0 1 2 3 4 5 6 7 8
!
"
p = 0.0001
p = 0.0002
p = 0.0010
p = 0.0100
p = 0.1000
p = 0.2000
p = 0.5000
p = 0.7000
p = 0.9000
p = 0.9900
BET EquationSimilar to Langmuir - a mass balance for each layer is used
The first layer is unique and subsequent layers are common
E is the heat of liquefaction
An infinite series is formed
The sum of surface fractions is 1
The total quantity adsorbed is a function of the monolayer and the surface fractions
The multilayer may approach infinite thickness as pressure approaches saturation
39
40Tuesday, December 4, 12

BET Equation
• Linear form of BET
BET surface area
41
42Tuesday, December 4, 12

BET estimate of nm
100 nm SiO2
25.7 m2/g
0
5
10
15
20
25
30
35
40
0 0.1 0.2 0.3 0.4 0.5 0.6 0.7 0.8 0.9 1
Qua
ntity
Ads
orbe
d, c
m3 /g
p/po
Silica, 100nm pores
AdsorptionDesorption
0
0.005
0.01
0.015
0.02
0.025
0.03
0.035
0.04
0.045
0 0.05 0.1 0.15 0.2 0.25 0.3
1/Q
(po /p
-1)
Relative Pressure, p/po
Linear BET, Lichrosphere 1000
Lic 1000
Type IV Isotherm
Meso-porous
Multilayer adsorption
Capillary condensation
na
ds
P
IV
43
44Tuesday, December 4, 12

Amorphous Silica-Alumina
11 nm pores
215.5 m2/g
0
50
100
150
200
250
300
350
400
450
0 0.1 0.2 0.3 0.4 0.5 0.6 0.7 0.8 0.9 1
Qua
ntity
ads
orbe
d, c
m3 /g
p/po
Amorphous Silica Alumina, 11nm pores
AdsorptionDesorption
0
0.001
0.002
0.003
0.004
0.005
0.006
0.007
0 0.05 0.1 0.15 0.2 0.25 0.3 0.35
1/(q
ads(
po /p -
1))
p/po
BET Surface Area = 215.5 m2/g
MCM-41
4 nm pores
926.8 m2/g
0
100
200
300
400
500
600
0 0.1 0.2 0.3 0.4 0.5 0.6 0.7 0.8 0.9 1
Qua
ntity
ads
orbe
d, c
m3 /g
p/po
Silica, 4 nm pores
AdsorptionDesorption
0
0.0002
0.0004
0.0006
0.0008
0.001
0.0012
0.0014
0.0016
0 0.05 0.1 0.15 0.2 0.25 0.3 0.35
1/(q
ads(
po /p -
1))
p/po
BET Surface Area = 926.8
45
46Tuesday, December 4, 12

100 nm pores
25.7 m2/g
4 nm pores
926.8 m2/g
11 nm pores
215.5 m2/g
MCM-41SiO2-Al2O3SiO2
0
5
10
15
20
25
30
35
40
0 0.1 0.2 0.3 0.4 0.5 0.6 0.7 0.8 0.9 1
Qua
ntity
Ads
orbe
d, c
m3 /g
p/po
Silica, 100nm pores
AdsorptionDesorption
0
50
100
150
200
250
300
350
400
450
0 0.1 0.2 0.3 0.4 0.5 0.6 0.7 0.8 0.9 1
Qua
ntity
ads
orbe
d, c
m3 /g
p/po
Amorphous Silica Alumina, 11nm pores
AdsorptionDesorption
0
100
200
300
400
500
600
0 0.1 0.2 0.3 0.4 0.5 0.6 0.7 0.8 0.9 1
Qua
ntity
ads
orbe
d, c
m3 /g
p/po
Silica, 4 nm pores
AdsorptionDesorption
FCC catalyst
Y & binder
173.5 m2/g
BET range reduced to 0.16 p/po maximum
0
10
20
30
40
50
60
70
80
90
100
0 0.1 0.2 0.3 0.4 0.5 0.6 0.7 0.8 0.9 1
Qua
ntity
Ads
orbe
d, c
m3 /g
p/po
Fluid Cracking Catalyst, 0.8nm pores
AdsorptionDesorption
0
0.0005
0.001
0.0015
0.002
0.0025
0.003
0.0035
0.004
0 0.02 0.04 0.06 0.08 0.1 0.12 0.14 0.16
1/(q
ads(
po /p -
1))
p/po
BET Surface Area = 173.5 m2/g
47
48Tuesday, December 4, 12
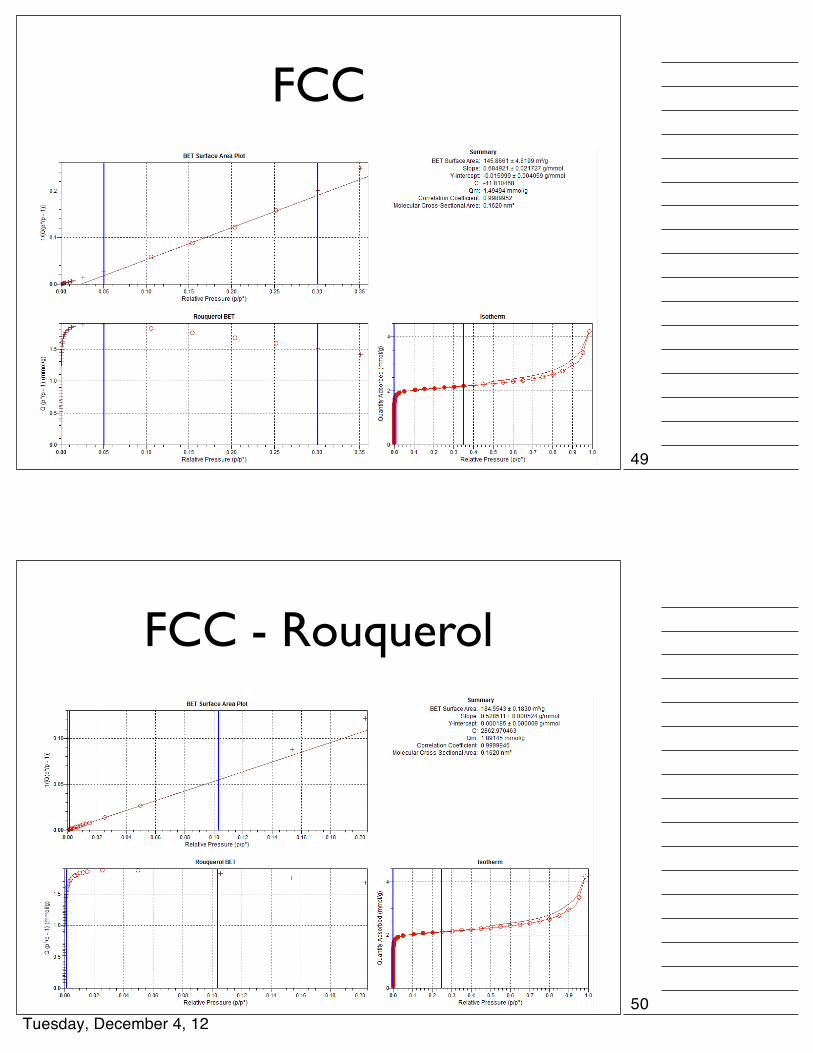
FCC
FCC - Rouquerol
49
50Tuesday, December 4, 12

BET surface area summary
Nitrogen or Krypton
Krypton for low surface area or small sample quantity
Isotherm
LP to 0.3 p/p°
Adjust range used to fit BET parameters for µ-porous materials - Rouquerol transform
“C” must be “+”
Physical constraint
Linearity
External Surface Area
51
52Tuesday, December 4, 12

t-PlotStandard Isotherms
Monolayer region is sensitive to isotherm shape
Multilayer region is not sensitive to isotherm shape
Multilayer region is less dependent on the adsorbent structure
qa
ds
p/po
IV
AB
C
t-PlotStandard Isotherms
Slope of a linear region corresponds to areaIntercept from a linear region is a pore volumeBased on BET surface area
n ads
thickness, Å thickness, Å
53
54Tuesday, December 4, 12

n ads
thickness, Å
Flat Surface
External Area
µ Pore Vol
thickness, Å
t-PlotStandard Isotherms
Slope corresponds to external (matrix) area
Intercept is the micro pore volume
t-curve is critical
• Statistical curves give comparative results
• Reference curves are preferred
n ads
thickness, Å
Flat Surface
External Area
µ Pore Vol
thickness, Å
Flat Surface
External Area
Pore Area
Meso Pore Vol
t-PlotStandard Isotherms
Low ”t” slope is areaIntercept is meso pore volumeHigh ”t” slope is external area
55
56Tuesday, December 4, 12

0
5
10
15
20
0 0.1 0.2 0.3 0.4 0.5 0.6 0.7 0.8 0.9 1Th
ickn
ess,
ang
stro
ms
p/po
HalseyHarkins and Jura
Jaroniec et. al.Broekhoff de Boer
Statistical t-curves
Halsey
• BJHHarkins-Jura
• t-plot
Jaroniec et. al.
• Silica
Broehkhoff de Boer
• difficult to use near saturation
t-Plot
57
58Tuesday, December 4, 12

Surface Modifications
The reference surface may be modified to be similar to the porous materialHydrophilic vs. hydrophobic
0
5
10
15
20
25
30
35
40
0 0.1 0.2 0.3 0.4 0.5 0.6 0.7 0.8 0.9 1
Qua
ntity
Ads
orbe
d, c
m3 /g
p/po
Silica, 100nm pores
AdsorptionDesorption
0
5
10
15
20
25
30
35
0 0.1 0.2 0.3 0.4 0.5 0.6 0.7 0.8 0.9 1
Thic
knes
s, a
ngst
rom
s
p/po
DFTODMS
t-Plot for 13X
Reference curve“0” intercept
0
50
100
150
200
250
0 0.1 0.2 0.3 0.4 0.5 0.6 0.7 0.8 0.9 1
Qua
ntity
Ads
orbe
d, c
m3 /g
p/po
X Zeolite, 0.8nm pores
Adsorption
0
20
40
60
80
100
120
140
160
0 0.5 1 1.5 2 2.5
Qua
ntity
Ads
orbe
d, c
m3 /g
Thickness, angstroms
Micropore filling
External area
59
60Tuesday, December 4, 12

Amorphous Silica-Alumina
Negligible micro-pore volumeCapillary condensation at large “t” values
0
50
100
150
200
250
300
350
400
450
0 0.1 0.2 0.3 0.4 0.5 0.6 0.7 0.8 0.9 1
Qua
ntity
ads
orbe
d, c
m3 /g
p/po
Amorphous Silica Alumina, 11nm pores
AdsorptionDesorption
0
50
100
150
200
250
300
350
400
0 2 4 6 8 10 12 14
Qua
ntity
Ads
orbe
d, c
m3 /g
Thickness, angstroms
MCM-41
Ideal t-plot sampleArea, pore volume, and external area
0
100
200
300
400
500
600
0 0.1 0.2 0.3 0.4 0.5 0.6 0.7 0.8 0.9 1
Qua
ntity
ads
orbe
d, c
m3 /g
p/po
Silica, 4 nm pores
AdsorptionDesorption
0
100
200
300
400
500
600
700
0 2 4 6 8 10 12 14
Qua
ntity
Ads
orbe
d, c
m3 /g
Thickness, angstroms
Pore area
61
62Tuesday, December 4, 12

t-Plot summaryArea
Pore area
External area (matrix)
Pore volume
Isotherm
LP to 0.7 p/p°
Positive or “0” intercept
t-curve
Reference curve is preferred
Statistical curve is convenient
Meso-porosityCapillary condensationFluid has bulk behaviorBJH or DH models
• Adsorbed layer
• Liquid core
63
64Tuesday, December 4, 12
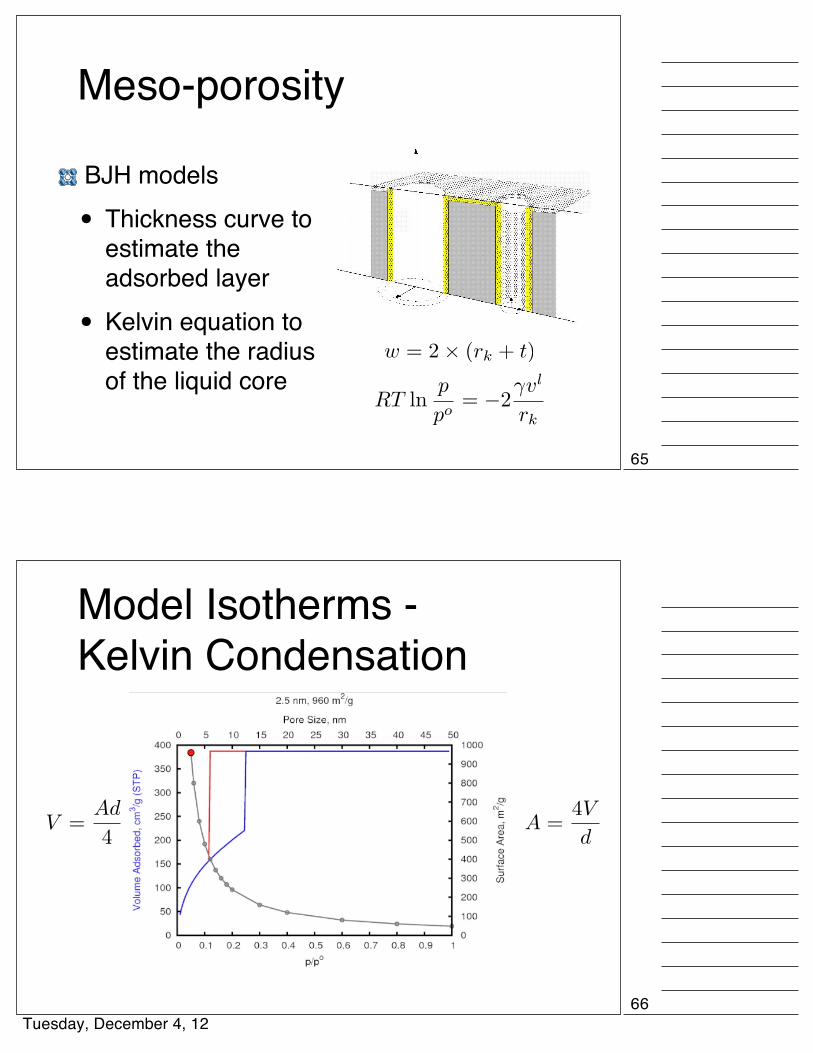
Meso-porosity
BJH models
• Thickness curve to estimate the adsorbed layer
• Kelvin equation to estimate the radius of the liquid core
Model Isotherms - Kelvin Condensation
V =Ad
4
65
66Tuesday, December 4, 12
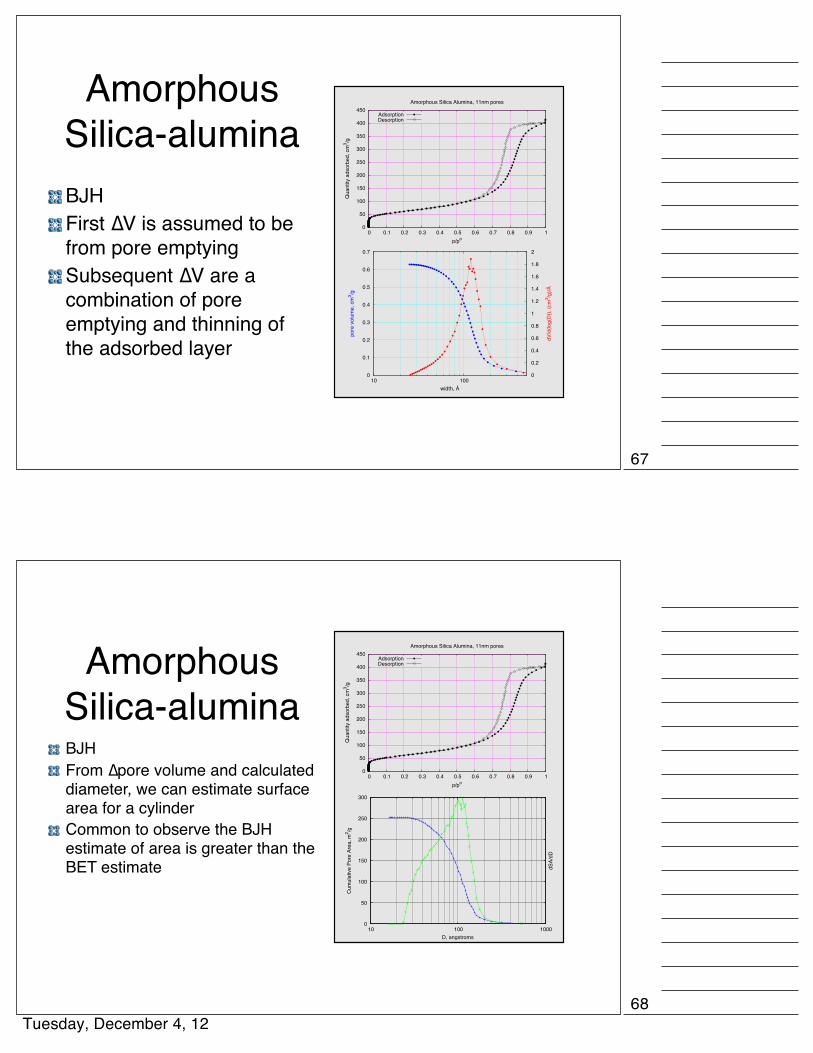
Amorphous Silica-aluminaBJHFirst ∆V is assumed to be from pore emptyingSubsequent ∆V are a combination of pore emptying and thinning of the adsorbed layer
0
50
100
150
200
250
300
350
400
450
0 0.1 0.2 0.3 0.4 0.5 0.6 0.7 0.8 0.9 1
Qua
ntity
ads
orbe
d, c
m3 /g
p/po
Amorphous Silica Alumina, 11nm pores
AdsorptionDesorption
0
0.1
0.2
0.3
0.4
0.5
0.6
0.7
10 100 0
0.2
0.4
0.6
0.8
1
1.2
1.4
1.6
1.8
2
pore
vol
ume,
cm
3 /g
dV/d
(log(
D)),
(cm
3 /g)/Å
width, Å
Amorphous Silica-alumina
0
50
100
150
200
250
300
350
400
450
0 0.1 0.2 0.3 0.4 0.5 0.6 0.7 0.8 0.9 1
Qua
ntity
ads
orbe
d, c
m3 /g
p/po
Amorphous Silica Alumina, 11nm pores
AdsorptionDesorption
0
50
100
150
200
250
300
10 100 1000
Cum
ulat
ive
Pore
Are
a, m
2 /g
dSA/
dD
D, angstroms
BJHFrom ∆pore volume and calculated diameter, we can estimate surface area for a cylinderCommon to observe the BJH estimate of area is greater than the BET estimate
67
68Tuesday, December 4, 12

Amorphous Silica-alumina
0
50
100
150
200
250
300
350
400
450
0 0.1 0.2 0.3 0.4 0.5 0.6 0.7 0.8 0.9 1
Qua
ntity
ads
orbe
d, c
m3 /g
p/po
Amorphous Silica Alumina, 11nm pores
AdsorptionDesorption
0
0.1
0.2
0.3
0.4
0.5
0.6
0.7
10 100 0
0.5
1
1.5
2
2.5
3
3.5
4
4.5
pore
vol
ume,
cm
3 /g
dV/d
(log(
D)),
(cm
3 /g)/Å
width, Å
BJHDesorption data has been used - historicallyBest to use both Adsorption and Desorption - they should share common features
BJH - PVD Pt/Al2O3
69
70Tuesday, December 4, 12
Pore Area vs BET AreaHg Pore Area
Based upon a work function
Gas Adsorption Pore Area
Geometric area of a cylinder
BET Area
Based upon the area occupied by adsorbed nitrogen (krypton)
Thank-you
71
72Tuesday, December 4, 12


