+ All Categories
Home > Documents > Beta Galactosidose Activity of Commercial Lactase Samples ...

Beta Galactosidose Activity of Commercial Lactase Samples ...

Date post: 03-Apr-2022
Category:
Upload: others
View: 11 times
Download: 0 times
Share this document with a friend
123
Brigham Young University Brigham Young University BYU ScholarsArchive BYU ScholarsArchive Theses and Dissertations 2010-08-09 Beta Galactosidose Activity of Commercial Lactase Samples in Beta Galactosidose Activity of Commercial Lactase Samples in Raw and Pasteurized Milk at Refrigerated Temperatures Raw and Pasteurized Milk at Refrigerated Temperatures Trenton W. Horner Brigham Young University - Provo Follow this and additional works at: https://scholarsarchive.byu.edu/etd Part of the Food Science Commons, and the Nutrition Commons BYU ScholarsArchive Citation BYU ScholarsArchive Citation Horner, Trenton W., "Beta Galactosidose Activity of Commercial Lactase Samples in Raw and Pasteurized Milk at Refrigerated Temperatures" (2010). Theses and Dissertations. 2590. https://scholarsarchive.byu.edu/etd/2590 This Thesis is brought to you for free and open access by BYU ScholarsArchive. It has been accepted for inclusion in Theses and Dissertations by an authorized administrator of BYU ScholarsArchive. For more information, please contact [email protected], [email protected].
Transcript

Brigham Young University Brigham Young University

BYU ScholarsArchive BYU ScholarsArchive

Theses and Dissertations

2010-08-09

Beta Galactosidose Activity of Commercial Lactase Samples in Beta Galactosidose Activity of Commercial Lactase Samples in

Raw and Pasteurized Milk at Refrigerated Temperatures Raw and Pasteurized Milk at Refrigerated Temperatures

Trenton W. Horner Brigham Young University - Provo

Follow this and additional works at: https://scholarsarchive.byu.edu/etd

Part of the Food Science Commons, and the Nutrition Commons

BYU ScholarsArchive Citation BYU ScholarsArchive Citation Horner, Trenton W., "Beta Galactosidose Activity of Commercial Lactase Samples in Raw and Pasteurized Milk at Refrigerated Temperatures" (2010). Theses and Dissertations. 2590. https://scholarsarchive.byu.edu/etd/2590

This Thesis is brought to you for free and open access by BYU ScholarsArchive. It has been accepted for inclusion in Theses and Dissertations by an authorized administrator of BYU ScholarsArchive. For more information, please contact [email protected], [email protected].

Beta-Galactosidase Activity of Commercial Lactase

Samples in Raw and Pasteurized Milk

at Refrigerated Temperatures

Trenton W. Horner

A thesis submitted to the faculty of Brigham Young University

in partial fulfillment of the requirements for the degree of

Master of Science

Lynn V. Ogden, Chair Michael L. Dunn Frost M. Steele

Dennis L. Eggett

Department of Nutrition, Dietetics, and Food Science

Brigham Young University

December 2010

Copyright © 2010 Trenton W. Horner

All Rights Reserved

ii

ABSTRACT

Beta-Galactosidase Activity of Commercial Lactase

Samples in Raw and Pasteurized Milk

at Refrigerated Temperatures

Trenton W. Horner

Department of Nutrition, Dietetics, and Food Science

Master of Science

Many consumers are unable to enjoy the benefits of milk, due to lactose-intolerance. Lactose-free milk is available, but at about 2 times the cost of regular milk or greater, it may be difficult for consumers to afford. The high cost of lactose-free milk is in part due to the added cost of the lactose hydrolysis process. Hydrolysis at refrigerated temperatures, possibly in the bulk tank or package, could increase the flexibility of the process, and potentially reduce the cost.

A rapid β-galactosidase assay was used to determine the relative activity of commercially

available lactase samples at different temperatures. Four enzymes exhibited low-temperature activity and were added to refrigerated raw and pasteurized milk at various concentrations and allowed to react for various lengths of time. The degree of lactose hydrolysis by each of the enzymes as a function of time and enzyme concentration was determined by HPLC.

The two most active enzymes, as determined by the β-galactosidase assay, hydrolyzed

over 98% of the lactose in 24 hours at 2⁰C using the supplier recommended dosage. The other two enzymes hydrolyzed over 95% of the lactose in 24 hours at two times the supplier recommended dosage at 2⁰C. Results were consistent in all milk types tested. The results show that it is feasible to hydrolyze lactose during refrigerated storage of milk using currently available enzymes.

Keywords: lactose-free milk, lactase, β-galactosidase, lactose intolerance

iii

ACKNOWLEDGEMENTS

I would like to thank Dr. Lynn Ogden for his expertise and support on this project

including his feedback for this manuscript. Thanks to my graduate committee for their

contributions to this project. Thanks to Dr. Jiping Zou for his help in analyzing the lactose

content of many milk samples. Thanks to Dr. Joel Griffitts for his expertise and advice regarding

the β-galactosidase assay. Thanks to Scott Lewis for his help on the project. I would especially

like to thank my family for their love and support throughout my educational experience.

iv

CONTENTS INTRODUCTION ............................................................................................................................................. 1

MATERIALS .................................................................................................................................................... 4

Enzymes .................................................................................................................................................... 4

Milk Samples ............................................................................................................................................. 4

METHODS ...................................................................................................................................................... 5

β-galactosidase assay ................................................................................................................................ 5

Hydrolysis in chilled milk ........................................................................................................................... 6

High Performance Liquid Chromatography Analysis ................................................................................ 7

Data Analysis ............................................................................................................................................. 8

RESULTS AND DISCUSSION............................................................................................................................ 8

Relative activity of commercial enzymes .................................................................................................. 8

Lactase activity in chilled milk ................................................................................................................... 9

Effect of different milk types .................................................................................................................. 11

Applicability to the industry .................................................................................................................... 11

Cost Analysis ........................................................................................................................................... 12

CONCLUSIONS ............................................................................................................................................. 13

REFERENCES ................................................................................................................................................ 14

APPENDICES ................................................................................................................................................ 22

APPENDIX A ................................................................................................................................................. 23

APPROVED PROSPECTUS ............................................................................................................................ 23

Proposed Title: ........................................................................................................................................ 24

Statement of the problem ...................................................................................................................... 24

Method to be followed ........................................................................................................................... 25

Justification of the problem .................................................................................................................... 25

Delimitations of the problem .................................................................................................................. 26

APPENDIX B ................................................................................................................................................. 27

TESTING RELATIVE ACTIVITY OF THE ENZYMES: THE BETA-GALACTOSIDASE ASSAY ................................ 27

Appendix B-1: Solutions ......................................................................................................................... 30

Appendix B-2: Spectrophotometer ........................................................................................................ 31

Appendix B-3: Explanation of the how the β-Galactosidase assay works ............................................. 32

v

APPENDIX C ................................................................................................................................................. 33

HPLC ANALYSIS OF LACTOSE HYDROLYSIS .................................................................................................. 33

Appendix C-1: Solutions ......................................................................................................................... 36

Appendix C-2: Results of HPLC Analysis ................................................................................................. 37

APPENDIX D ................................................................................................................................................. 44

STATISTICAL ANALYSIS OF HPLC DATA ........................................................................................................ 44

1

INTRODUCTION Milk is a nutrient-dense food and an important part of a healthy diet. Along with high-

quality protein, milk contains many vitamins and minerals, such as riboflavin and calcium (Choi,

2007). Milk is fortified with vitamin D and is one of the few commonly consumed food products

containing this vitamin (Mannion, 2006). Unfortunately, many consumers are unable to enjoy

the benefits of milk due to lactose-intolerance (Choi, 2007; Somkuti, 1997; Husain, 2010).

Lactose intolerance is caused by a deficiency of β-galactosidase (lactase) in the digestive

tract (Panesar, 2007). Lactose is a milk disaccharide composed of glucose and galactose bonded

with a β-1→4 linkage. Normally, lactose in milk is hydrolyzed by β-galactosidase located in the

mucosal cells of the small intestine. β-galactosidase hydrolyzes lactose into its respective

monosaccharides which are easily absorbed and metabolized (Gropper, 2005).

When lactose intolerant individuals consume milk, the undigested lactose passes into the

colon and increases the osmolarity of the digested food. This inhibits the absorption of water by

the colon and can cause diarrhea. Also, bacteria in the colon are able to digest the lactose, which

causes increased acidity and the production of gas and toxins (Choi, 2007). These unpleasant

symptoms may inhibit the consumption of milk by lactose-intolerant consumers (Messia, 2007).

The amount of lactose needed to cause symptoms can vary widely from person to person.

Some lactose-intolerant individuals are unable to consume any lactose without experiencing the

symptoms of lactose-intolerance while others are able to consume some milk without

experiencing symptoms or with only mild symptoms (Choi, 2007). Cultured dairy products such

as yogurt and cheese often have significantly lower levels of lactose and many lactose-intolerant

individuals are able to eat them without symptoms (Sieber, 1997). Lactose-free milk is another

option consumers have available (Somkuti, 1997).

2

Lactose-free milk is commercially prepared by allowing β-galactosidase enzymes (E.C.

3.2.1.23) to hydrolyze the lactose present, prior to packaging. This allows consumers to gain the

valuable nutrients and protein available in milk without unpleasant symptoms.

While enzyme-altered lactose-free milk is available, it is expensive, and many consumers

are unwilling or unable to pay for the extra cost. Lopez and Lopez (2009) report high-income

families are the main consumers of lactose-free milk. As household income rises, the purchase

and usage of lactose-free milk products also rises (Mintel, 2010). The higher cost of lactose-free

milk is due in part to the cost of the hydrolysis process used by manufacturers. It is hypothesized

that if enzymes were sufficiently active at the temperature of chilled milk, the hydrolysis reaction

could be carried out under refrigeration during transport or storage in trucks, tanks, or final

packaging. By doing this, the cost to manufacture lactose-free milk might be reduced.

The market for lactose-free milk has been growing for years. Jelen (2003) predicted

about a 20% per year increase in the market. This expected increase was due in part to the

increased awareness of lactose intolerance. The market for lactose-free milk is estimated at 30-

50 million consumers in the U.S. alone (Adhikari, 2009). Lactose intolerance is more common

in some ethnic groups than others (FDA, 2009). Among African-Americans and Native

Americans it is about 75%; among Asian populations it is about 90% (FDA, 2009). With such a

large potential market for the product, reducing the cost of lactose-free milk could significantly

increase its consumption.

Reduction of lactose in milk has been explored using many different methods.

Traditionally, soluble β-galactosidase enzymes are added to milk. Panesar and others (2007)

explored the use of immobilized enzymes. Novalin and others (2005) describe using an

innovative hollow-fiber ultra-filtration process with immobilized enzymes. Another study

3

described using ultra-filtration and concentration by evaporation, then adding the enzymes to the

concentrated permeate and later adding the hydrolysate back to the retentate (Chen and others,

2002).

Lactose-free milk that has been treated with β-galactosidase is sweeter than regular milk

due to glucose and galactose being sweeter than lactose, combining to be about 70% of the

sweetness of sucrose as compared to lactose, which is only 20% the sweetness of sucrose

(Novalin, 2005). This sweetness may be advantageous for certain products such as ice cream but

alters the flavor of milk used for drinking. Choi and others (2007) have shown that the resulting

sweetness can be removed by utilizing nanofiltration and reconstituting the milk. Harju (1989)

describes a chromatographic process to separate the lactose from the protein and other

components of milk, completely removing lactose without the use of enzymes and without any

residual sweetness. However, none of these or other methods reported in the literature have the

potential to significantly reduce the cost of producing lactose-free milk compared to traditional

methods.

β-galactosidase enzymes are commonly harvested from microorganisms such as fungus,

yeast, and bacteria; for example, Kluyveromyces lactis is a commonly used yeast for producing

β-galactosidase in the industry (Dabhole, 1998). Enzymes sourced from yeast or bacteria are

well suited for the hydrolysis of lactose in milk, often displaying an activity optimum near the

pH of milk (Chen, 2009). A fungal β-galactosidase is typically used in acidic dairy applications,

such as sour cream (Chen, 2009).

A number of bacterial β-galactosidase enzymes, having optimum hydrolytic activity at

temperatures lower than is normal for lactase enzymes, have been isolated (Fernandes, 2002;

Coker, 2006). Many lactases have optimum temperatures above 30⁰C, whereas cold-active

4

lactases can have temperature optimums of 15⁰C or below (Coker, 2006). Bacteria adapted to

colder climates can be found in soil and isolated for β-galactosidase production (Coker, 2003).

Cold-active β-galactosidase has also been isolated from psychrophilic yeasts, which may be

suitable for food use (Husain, 2010). Thus, there is a potential for developing lactase enzymes

with significantly increased activity at refrigerated temperatures.

The objective of this research was to determine if currently available lactase enzymes are

active enough in chilled milk to enable the hydrolysis process to be carried out during

refrigerated storage.

MATERIALS

Enzymes Five commercially available food-grade β-galactosidase enzymes were obtained from

four separate distributors. The enzymes examined in the initial screening included the following:

GODO-YNL2 yeast neutral lactase (DYL) (Danisco A/S, Copenhagen, Denmark), Validase®

yeast lactase (VYL) and Validase® fungal lactase concentrate (VFL) (Valley Research, South

Bend, IN, USA), Enzeco® Lactase NL (EYL) (Enzyme Development Corporation, New York,

NY, USA), and Lactozym® lactase (LYL) (Sigma-Aldrich, St. Louis, MO, USA).

The DYL, VYL, and LYL enzymes were derived from Kluyveromyces lactis and the

EYL enzyme was derived from a Kluyveromyces sp. VFL was derived from Aspergillus oryzae.

The supplier recommended dosages for the enzymes are as follows: 0.1% w/v for the DYL, VFL,

EYL, and LYL enzymes and 0.08% w/v for the VYL enzyme.

Milk Samples The rate of lactose hydrolysis by the enzymes in chilled, raw, whole milk; pasteurized

whole milk; and pasteurized skim milk was determined at refrigerated temperature. The raw

5

milk was obtained from the Brigham Young University creamery and originated at the Elberta

Valley Agricultural Dairy Farm (Elberta, Utah, USA). The raw milk had an average of 3.51%

milkfat, 3.11% protein, and 5.94% other solids. Raw milk data was determined by using a

Lacticheck milk analyzer (Page & Pedersen International, Ltd., Hopkinton, Massachusetts,

USA). The pasteurized/homogenized skim milk and whole milk were obtained from the local

market. The skim milk had less than 0.5% milkfat and whole milk had approximately 3.25%

milkfat. Each type of milk was tested using each time/concentration combination (described

below), which required the preparation of 65 samples for HPLC analysis for each trial run (195

samples in total for the three types of milk).

METHODS

β-galactosidase assay The relative activities of the enzymes were analyzed using a modified version of the β-

galactosidase assay of Miller (1972). This assay involves hydrolysis of O-nitrophenyl-β, D-

galactopyranoside (ONPG) to O-nitrophenol (ONP), which produces a yellow color measurable

via spectrophotometer (Switzer and Garrity, 1999). The assay takes little time to perform and is

helpful for comparing the relative activity of β-galactosidase enzymes.

To obtain a temperature-activity profile and compare relative activity, assays were carried

out at 4⁰C, 10⁰C, 20⁰C, and ambient (~23⁰C) temperature. The non-ambient temperature trials

were performed using a Percival I-36NL controlled atmosphere chamber (Percival Scientific,

Inc., Perry, Iowa, U.S.A.). As the assay was originally intended for analyzing β-galactosidase

production by bacteria, the assay reagents reacted very quickly when exposed to purified

enzyme. To accommodate the higher activity of the commercial enzymes, the samples were

diluted 10-5 (ambient temperature and 20⁰C) and 10-4 (4⁰C, 10⁰C) with basal buffer to allow a

6

reaction time similar to the bacterial assay. Approximately 450 µl of basal buffer was combined

with 50 µl of each enzyme in microfuge tubes (1.5 ml). Approximately 600 µl of assay buffer

was then added to each sample and the start time of the reaction was recorded.

Color development was measured at 420 nm using a Milton Roy Spectronic 1001

spectrophotometer (Milton Roy Instrument Group, Rochester, New York, U.S.A.). Samples

were allowed to react until a faint, but stable yellow color developed (between 0.1 and 1.0 on the

spectrophotometer). The reaction required 20-40 minutes on average, after which a stop buffer

(sodium carbonate) was added to halt the reaction.

The data were used to calculate the change in optical density at 420nm (ΔOD420) per

minute (T) per volume (V) of enzyme sample according to the following equation, adapted from

Miller (1972): ΔOD420 per minute per volume = [1000*OD420] / [T(min)* V(ml)]. The

ΔOD420 per minute per mass (ng) of protein of each enzyme was then calculated by adjusting

for protein content in each stock enzyme solution using the following equation: ΔOD420 per

minute per mass (ng) = [1000*OD420]/[T(min)*mass of protein(ng)] where protein mass is

calculated from the following: Volume(ml)*(mg/ml of protein in the enzyme solution) *

(dilution factor) * 106 ng/mg where volume is the amount of enzyme solution used in the assay

(0.050 ml), dilution factor being the dilution used for each trial (either 10-4 or 10-5). The mg/ml

protein of each enzyme preparation was obtained using the Dumas method (Nielsen, 2003).

Based on the activity comparisons of the enzymes, 4 out of 5 of the enzymes were

sufficiently active at refrigerated temperatures to be evaluated further in chilled milk. The VFL

enzyme demonstrated low activity under refrigeration and was not evaluated in milk.

Hydrolysis in chilled milk Duplicate experiments were conducted for each type of milk using two different lots.

Lactose content was determined after 12, 24, 48, and 72 hours of reaction time. Where x is the

7

supplier’s recommended level of enzyme concentration, 0.25x, 0.5x, 0.75x, and 1x were used for

DYL and VYL and 0.5x, 1x, 1.5x, and 2x were used for EYL and LYL. Greater activity was

observed in DYL and VYL compared to EYL and LYL; hence, the higher concentrations for the

latter two enzymes.

The selected milk was put into 16 flasks (100 ml each). Four flasks were used for each

enzyme to allow all four concentrations to be tested. Once enzymes were added to the flasks and

swirled, the samples were stored in a walk-in refrigerator (2⁰C). Aliquots of 30 ml were taken

out at each time point and transferred to 50 ml plastic test tubes with screw-on caps, heated to

180⁰F, and held for 15 seconds to ensure inactivation of the enzymes to stop the hydrolysis

reaction. Lactose content was determined by HPLC.

High Performance Liquid Chromatography Analysis The HPLC method of Wehr and Frank (2004) was used to determine percent lactose

hydrolysis based on disappearance of lactose. Milk or enzyme-treated samples (10 grams ±

0.0030) were weighed into 100 ml volumetric flasks using an analytical balance. Sulfuric acid (1

ml of 0.9N) was added using a mechanical pipette. The mixture was swirled to precipitate

proteins. Approximately 50 ml of de-ionized distilled water was added to the milk-acid mixture

and swirled again. Samples were then brought to volume (100 ml) with de-ionized distilled

water. Each flask was sealed and shaken vigorously for 20 seconds.

Samples were allowed to stand for at least 5 minutes, followed by filtering through 0.45

µm polytetrafluoroethylene (PTFE) syringe filters (Nalge Nunc International, Rochester, New

York, U.S.A.). Approximately 1 ml of each filtered sample was placed in auto-sampler vials and

sealed in preparation for HPLC analysis. Lactose analyses were conducted using an Agilent

Model 1100 HPLC (Agilent Technologies, Palo Alto, California, U.S.A.) equipped with a

8

Zorbax 70 A carbohydrate column, 5µm, 4.6x250mm (Agilent Technologies, Palo Alto,

California, U.S.A.). For comparison purposes, reference samples made from untreated milk

were analyzed in the same manner for each run.

HPLC separation conditions were as follows: gradient mobile phase of 75% acetonitrile,

25% water; 30⁰C; 1ml/min flow rate; 20 µl injection volume; refractive index detector. Data

was quantified using external calibration based on a standard curve.

Data Analysis Data were analyzed using Statistical Analysis System software version 9.2 (SAS

Institute, Cary, NC). A mixed model analysis of variance procedure was used. The dependent

variable of the model tested for difference from 95% lactose hydrolysis (i.e. difference from

95%) with p<0.05. Analyses were also run at 98% and 99% lactose hydrolysis (difference from

98% or 99%). The independent variables included time, enzyme concentration, and the

time*concentration interaction. The statistical analysis is found in appendix D.

RESULTS AND DISCUSSION

Relative activity of commercial enzymes In initial activity comparison tests in buffer (β-galactosidase assay), DYL and VYL

showed steep increases with rising temperatures, while EYL, LYL, and VFL were less affected

by the temperature range tested (see figure 1). Of the five enzymes evaluated at manufacturers’

recommended levels, DYL and VYL showed greater activity than EYL, LYL, and VFL (see

figure 1). This may be due to the higher protein concentration of DYL and VYL compared to

the other enzyme samples. VFL, specified for use in acidic dairy products, had very little

enzyme activity compared to the other four enzymes due its pH optimum (4.0 to 5.0) not being

within the range of the pH of milk (6.6 to 6.8) (Validase Fungal Lactase Concentrate

9

Specification, Valley Research, South Bend Indiana, USA). VFL was not included in further

experimentation.

Lactase enzymes produced from Kluyveromyces lactis commonly have a temperature

optimum above room temperature. Schneider (1990) found that lactase derived from this

microorganism had an 85% to 95% increase in activity at 38⁰C compared to the activity between

4⁰C to 5⁰C. DYL and VYL showed about a fourfold increase in activity at ambient (~23⁰C)

compared to the activity at 4⁰C. EYL and LYL showed much more modest increases.

When the results of the β-galactosidase assay were adjusted for protein content of the

enzyme samples (activity per mass (ng) of protein), the activities of the enzyme preparations

were similar to the activities of the enzymes when measured per volume, except LYL (see figure

1). At refrigerated temperatures, LYL had the highest activity per unit of protein, yet it

performed more poorly than the other enzymes during the assay. This is likely due to the LYL

having the lowest concentration of protein among the enzyme preparations tested.

Lactase activity in chilled milk To determine lactose hydrolysis in milk for each enzyme, lactose content of pre-treatment

milk samples in each trial was compared to the lactose content after treatment. The galactose

and glucose peaks eluted at the same retention time during analysis and were inseparable without

a specialized column; this was consistent with the results of Sharma and others (2009). Thus,

percent hydrolysis was determined by disappearance of lactose.

The HPLC lactose peak area of each treated milk sample was divided by the area of the

respective un-treated milk sample to obtain a percentage of lactose remaining. That percentage

was then subtracted from 1 in order to determine percent hydrolysis.

10

Percent hydrolysis of lactose in refrigerated milk varied, depending on the enzyme

source, enzyme concentration, and reaction time. Performance of the enzymes correlated well

with the results of the β-galactosidase assay; the enzymes showing greatest activity in the β-

galactosidase assay also hydrolyzed the most lactose in milk.

Percent hydrolysis for each of the four enzymes over time at a series of concentrations is

reported in table 1. Statistics for these values are reported in table 2. In pasteurized whole milk,

DYL hydrolyzed, on average, 99% of the lactose present in 24 hours at the supplier’s

recommended dosage. VYL showed an average of 98% hydrolysis in 24 hours at the supplier’s

recommended dosage. EYL and LYL were able to hydrolyze 95% of the lactose on average in

24 hours, when added at 2 times the recommended dosage.

Lactose hydrolysis can be achieved with less enzyme if the reaction is allowed to proceed

for a longer time. DYL achieved 95% average lactose hydrolysis in 72 hours while using one-

fourth the recommended dosage in pasteurized whole milk and 99% hydrolysis under the same

conditions using one-half the recommended dosage. VYL achieved 99% hydrolysis in 72 hours

using one-half dosage. EYL and LYL both accomplished approximately 99% hydrolysis on

average in 72 hours by using the recommended dosage.

Statistics shown in table 2 indicate the target levels of hydrolysis were achieved under the

stated conditions. Actual hydrolysis levels were not different than specified target levels as

indicated by the p-values. Since the intent of the process was to achieve at least the target level

of hydrolysis, p-values greater than 0.05 are indicative of the target hydrolysis levels being met

under the conditions indicated.

The results show the four commercially available enzymes are capable of hydrolyzing

95% or more of the lactose in milk within 24 hours using the recommended dosage (DYL and

11

VYL) or double the recommended dosage (EYL and LYL). All four enzymes can also

hydrolyze at least 99% of the lactose in 72 hours using half the amount of enzyme used in the 24

hours assays. Hydrolyzing lactose during refrigerated storage will allow greater processing

flexibility and potentially reduce the costs of producing lactose-free milk.

Effect of different milk types The hydrolysis rate was not affected by fat content or processing. Hydrolysis in raw

whole milk, pasteurized skim milk, and pasteurized whole milk all proceeded at approximately

the same rate. For illustrative purposes, figure 2 shows the similarity of hydrolysis in different

milk substrates for LYL. All enzymes tested behaved similarly. The higher fat content of whole

milk did not impede enzyme performance. Enzyme concentration per volume was the same in

every milk type, even though the lactose content of whole milk is somewhat lower than skim

milk, due to the higher fat content. Despite the slight difference in lactose concentration between

skim and whole milk, the observed hydrolysis rates were similar across all three milk types.

Applicability to the industry Lactose hydrolysis during refrigerated storage could be applied several different ways to

produce lactose-free milk. Adding the enzyme after pasteurization and homogenization and

bottling or packaging the milk without further processing is one possibility. By the time the

consumer would purchase the milk, the lactose would be sufficiently hydrolyzed. The enzymes

would have to be sterile filtered before adding to milk post-pasteurization (personal

communication, Cody Huft, Utah Department of Agriculture).

Another possibility would be to add the enzyme to raw milk before the milk is processed

at the plant. The enzyme could be added in the farm bulk tanks or in the tanker trucks used for

transport, allowing sufficient time for the lactose to be hydrolyzed before pasteurization and

homogenization. Such a process would require the farms and/or trucks to have dedicated tanks

12

for the purpose of lactose-free milk production. The enzyme could also be added to the holding

tanks at the plant, and hydrolysis could be accomplished while the milk is waiting to be

processed.

The possibility of Maillard browning may be of concern when hydrolyzing the lactose

before pasteurization; however, this does not appear to be a problem with lactose-free milk

products currently on the market. Maillard browning occurs when reducing sugars are heated in

the presence of protein (Fennema, 2008). The amount of reducing carbohydrate groups is

doubled once lactose is hydrolyzed into glucose and galactose (Messia, 2007). Dattatreya and

others (2010) found that once glucose and galactose have accumulated in sweet whey protein,

the whey may be predisposed brown more readily. This may also be true of milk. Addition of

sterile β-galactosidase post-pasteurization would avoid this problem (Messia, 2007).

The possibility of browning may also be avoided by using additional methods of

processing, such as the nanofiltration method utilized by Choi and others (2007) to remove the

glucose and galactose prior to heating. However, Messia (2007) found lactose-free milk which is

ultra-pasteurized after hydrolysis and stored at refrigerated temperatures to be acceptable. This

is in agreement with our own assessment of lactose-free milks from the local market.

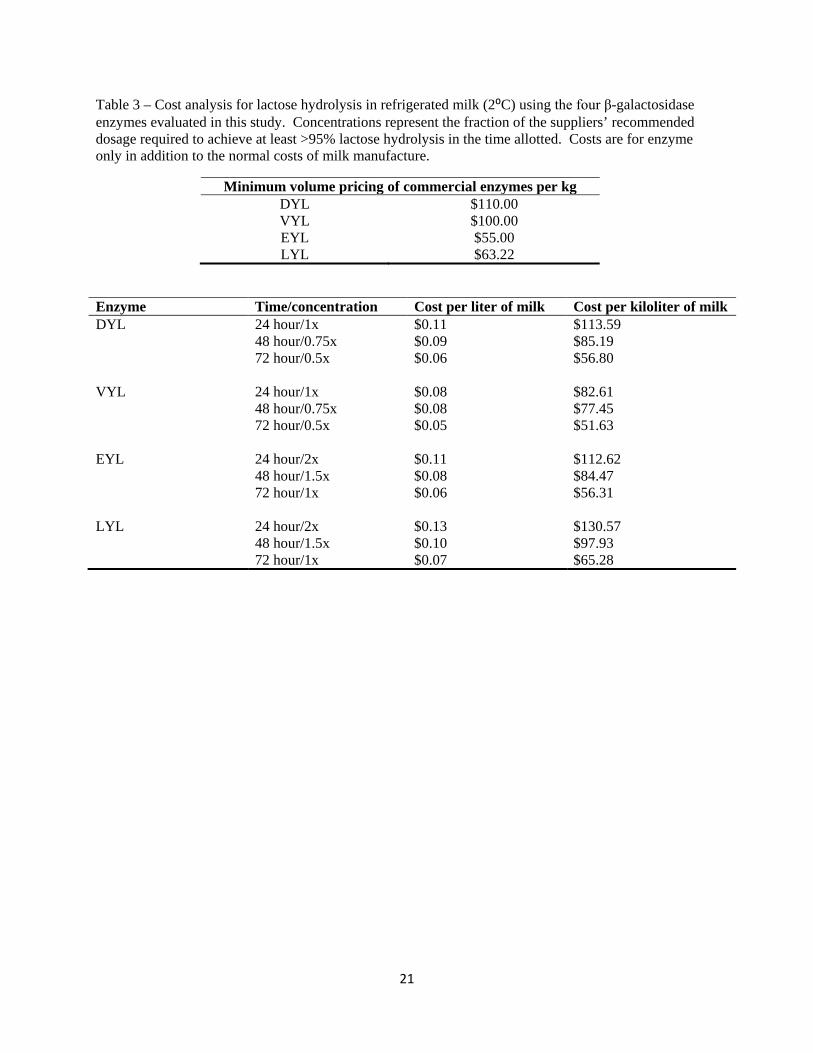
Cost Analysis Enzyme cost for each of the four enzymes, as determined at the time of this study, is

shown in table 3. The cost of the enzymes correlated well with the activity of each enzyme. As

the cost increased, the activity also increased. DYL, which hydrolyzed lactose the most

effectively at refrigerated temperatures, was the most expensive of the four enzymes with a

minimum volume pricing of $110 per kilogram. VYL, being the next most active enzyme, cost

$100 per kg. EYL cost $55 per kg and LYL cost $63 per kg. It is interesting to note that EYL

13

seems to be priced about the same as DYL on an activity basis, as EYL required twice as much

volume of the liquid preparation but only costs half as much as DYL.

By using a smaller dose and a longer time for lactose hydrolysis, enzyme cost for a liter

of lactose-free milk could be minimized. By using VYL at ½ the supplier recommended dosage

and allowing 72 hours for hydrolysis, cost could be as low as $0.05 per liter of milk. The price is

in addition to the normal processing costs of producing milk.

CONCLUSIONS Commercially available lactase enzymes are active enough in chilled milk to enable the

hydrolysis process to be carried out during refrigerated storage. With the proper

time/concentration combinations, >99% lactose hydrolysis can be achieved. Sweetness in

lactose-free milk made by this method is acceptable as compared to current products on the

market. By reacting the milk during cold storage, the hydrolysis process can be simplified with

greater flexibility, potentially reducing the cost of manufacturing lactose-free milk.

14

REFERENCES

Adhikari, K., L. M. Dooley, E. Chambers, and N. Bhumiratana. 2010. Sensory characteristics of commercial lactose-free milks manufactured in the United States. Lwt-Food Science and Technology 43(1):113-118.

Chen, C. S., C. K. Hsu, and B. H. Chiang. 2002. Optimization of the enzymic process for manufacturing low-lactose milk containing oligosaccharides. Process Biochemistry 38(5):801-808.

Chen, W., H. Chen, Y. Xia, J. Yang, J. Zhao, F. Tian, H. P. Zhang, and H. Zhang. 2009. Immobilization of recombinant thermostable beta-galactosidase from Bacillus stearothermophilus for lactose hydrolysis in milk. Journal of Dairy Science 92(2):491-498.

Choi, S. H., S. B. Lee, and H. R. Won. 2007. Development of lactose-hydrolyzed milk with low sweetness using nanofiltration. Asian-Australasian Journal of Animal Sciences 20(6):989-993.

Coker, J. A., P. P. Sheridan, J. Loveland-Curtze, K. R. Gutshall, A. J. Auman, and J. E. Brenchley. 2003. Biochemical characterization of a beta-galactosidase with a low temperature optimum obtained from an Antarctic Arthrobacter isolate. Journal of Bacteriology 185(18):5473-5482.

Coker, J. A. and J. E. Brenchley. 2006. Protein engineering of a cold-active beta-galactosidase from Arthrobacter sp SB to increase lactose hydrolysis reveals new sites affecting low temperature activity. Extremophiles 10(6):515-524.

Dabhole, M. P. and K. N. Joishy. 1998. beta-galactosidase from the yeast Kluyveromyces lactis. Journal of Scientific & Industrial Research 57(4):201-204.

Dattatreya, A., W. Lee, and S. A. Rankin. 2010. Short communication: Presence of galactose and glucose promotes browning of sweet whey powder. Journal of Dairy Science 93(6):2354-2357.

FDA.gov [internet]. Silver Spring, MD: U.S. Food and Drug Administration; 2009 [accessed 2010 Jun 17]. Available from: http://www.fda.gov/ForConsumers/ConsumerUpdates/ucm094550.htm

Fennema, O., S. Damodaran, and K. Parkin. 2008. Fennema’s Food Chemistry. 4th ed. Boca Raton, FL. CRC Press. 1144 p.

Fernandes, S., B. Geueke, O. Delgado, J. Coleman, and R. Hatti-Kaul. 2002. beta-galactosidase from a cold-adapted bacterium: purification, characterization and application for lactose hydrolysis. Applied Microbiology and Biotechnology 58(3):313-321.

15

Gropper, S.S., J.L. Smith, and J.L. Groff. 2005. Advanced nutrition and human metabolism. 4th ed. Belmont, CA. Thomson Wadsworth. 600 p.

Harju, M., inventor; Valio Meijerien Keskusosuusliike, assignee. 1989 Apr 11. Process for the specific separation of lactose from milk. U.S. patent 4,820,348.

Husain, Q. 2010. beta Galactosidases and their potential applications: a review. Critical Reviews in Biotechnology 30(1):41-62.

Jelen, P. and O. Tossavainen. 2003. Low lactose and lactose-free milk and dairy products - prospects, technologies and applications. Australian Journal of Dairy Technology 58(2):161-165.

Lopez, E. and R. A. Lopez. 2009. Demand for Differentiated Milk Products: Implications for Price Competition. Agribusiness 25(4):453-465.

Mannion, C. A., K. Gray-Donald, and K. G. Koski. 2006. Association of low intake of milk and vitamin D during pregnancy with decreased birth weight. Canadian Medical Association Journal 174(9):1273-1277.

Messia, M. C., T. Candigliota, and E. Marconi. 2007. Assessment of quality and technological characterization of lactose-hydrolyzed milk. Food Chemistry 104(3):910-917.

Mintel Oxygen. 2010. Milk – US – April 2010. London, UK: Mintel International Group Limited.

Miller, J. H. 1972. Experiments in molecular genetics. Cold Spring Harbor, N.Y.: Cold Spring Harbor Laboratory, Cold Spring Harbor, N.Y.].

Nielsen, S.S. 2003. Food Analysis. 3rd ed. New York, NY. Springer Science+Business Media, Inc. 557 p.

Novalin, S., W. Neuhaus, and K. D. Kulbe. 2005. A new innovative process to produce lactose-reduced skim milk. Journal of Biotechnology 119(2):212-218.

Panesar, R., P. S. Panesar, R. S. Singh, and M. B. Bera. 2007. Applicability of alginate entrapped yeast cells for the production of lactose-hydrolyzed milk. Journal of Food Process Engineering 30(4):472-484.

Schneider, R. E., E. Corona, F. Rosales, F. E. Schneider, O. Rodriguez, and O. Pineda. 1990. Effect of temperature on the lactose hydrolytic capacity of a lactse derived from Kluyveromyces-lactis. American Journal of Clinical Nutrition 51(2):197-201.

Sharma, R., Y. S. Rajput, Poonam, G. Dogra, and S. K. Tomar. 2009. Estimation of sugars in milk by HPLC and its application in detection of adulteration of milk with soymilk. International Journal of Dairy Technology 62(4):514-519.

16

Sieber, R., M. Stransky, and M. de Vrese. 1997. Lactose intolerance and consumption of milk and dairy products. Zeitschrift Fur Ernahrungswissenschaft 36(4):375-393.

Somkuti, G. A. and V. H. Holsinger. 1997. Microbial technologies in the production of low-lactose dairy foods. Food Science and Technology International 3(3):163-169.

Switzer, R.L., and L.F. Garrity. 1999. Experimental biochemistry, theory and exercises in fundamental methods. 3rd ed. New York NY: W H Freeman and Company. 453 p.

Wehr, H.M., and J.F. Frank. 2004. Standard methods for the examination of dairy products. 17th ed. Washington DC: American Public Health Association. 570 p.

17

Figure 1 – Comparison of β-galactosidase activity of five commercial lactases at different temperatures. Graph A shows the results expressed as change in optical density at 420 nm (ΔOD420) per minute per volume of enzyme based on the adjusted Miller assay. Graph B shows the ΔOD420 per minute per mass (ng) of protein for each enzyme. The mass of protein calculation adjusts for protein content of each enzyme solution and allows for comparison of the efficiency of each enzyme preparation.

0.0E+00

5.0E+05

1.0E+06

1.5E+06

2.0E+06

2.5E+06

3.0E+06

4⁰ 10⁰ 20⁰ ambient

ΔOD

420

per v

olum

e

Temperature (⁰C)

β-Galactosidase Assay Results

DYL

VYL

EYL

LYL

VFL

0

0.2

0.4

0.6

0.8

1

1.2

1.4

1.6

4⁰ 10⁰ 20⁰ ambient

ΔOD

420

per m

ass (

ng) p

rote

in

Temperature (⁰C)

Activity Adjusted for Protein Content

DYL

VYL

EYL

LYL

VFL

A

B

18

Figure 2 – Effects of milk type on enzyme performance of the LYL β-galactosidase at 2⁰C. Average percent lactose hydrolysis is shown. Hydrolysis rate is very similar for all enzymes in all milk types.

0.00%20.00%40.00%60.00%80.00%

100.00%120.00%

12 24 48 72

Perc

ent H

ydro

lysi

s

Hours

Pasteurized Skim Milk

0.5x

1.0x

1.5x

2.0x

0.00%20.00%40.00%60.00%80.00%

100.00%120.00%

12 24 48 72

Perc

ent H

ydro

lysi

s

Hours

Pasteurized Whole Milk

0.5x

1.0x

1.5x

2.0x

0.00%20.00%40.00%60.00%80.00%

100.00%120.00%

12 24 48 72

Perc

ent H

ydro

lysi

s

Hours

Raw Whole Milk

0.5x

1.0x

1.5x

2.0x

19

Table 1 – Time-dependent lactose hydrolysis (2⁰C) in pasteurized whole milk for four selected commercial enzymes at different concentrations. Concentrations represent the fraction of the suppliers’ recommended dosage used. The percentages listed in the table represent the average percent lactose hydrolysis for the time/concentration pairs.

Concentration Hours Enzyme Concentration 12 24 48 72

DYL 1/4x 49.95% 71.77% 89.19% 95.61% 1/2x 75.36% 89.38% 98.55% 99.70% 3/4x 86.43% 95.72% 99.99% 99.86% 1x 92.78% 99.08% 99.99% 99.99%

VYL 1/4x 49.62% 67.44% 84.92% 91.57% 1/2x 67.34% 88.90% 98.27% 99.43% 3/4x 80.00% 95.29% 99.54% 99.81% 1x 90.13% 98.59% 99.99% 99.99%

EYL 1/2x 41.55% 63.41% 83.08% 91.40% 1x 62.29% 85.23% 96.67% 99.05% 1.5x 75.16% 90.74% 98.71% 99.64% 2x 85.86% 97.32% 99.99% 99.99%

LYL 1/2x 39.62% 58.26% 79.62% 88.46% 1x 61.36% 82.96% 96.39% 98.94% 1.5x 74.11% 91.27% 99.44% 99.99% 2x 82.37% 95.89% 99.99% 99.99%

20

Table 2 – Mixed model statistics for lactose hydrolysis by four commercial enzymes after 24 and 72 hours, in whole milk at 2⁰C. The concentrations are based on the suppliers’ recommended dosage. The statistics show the target levels of % lactose hydrolysis were achieved under the conditions indicated. A p-value greater than 0.05 indicates the mean % hydrolysis and the target % hydrolysis are not significantly different.

24 Hours Enzyme Concentration Target %

Hydrolysis Mean % Hydrolysis

Standard Error

p-value

DYL 1x 99% 99.08% 2.75% 0.9715 VYL 1x 98% 99.59% 3.52% 0.8557 EYL 2x 95% 97.32% 1.81% 0.1876 LYL 2x 95% 95.89% 1.18% 0.2240

72 Hours Enzyme Concentration Target %

Hydrolysis Mean % Hydrolysis

Standard Error

p-value

DYL 0.25x 95% 95.61% 2.75% 0.4780 0.5x 99% 99.70% 2.75% 0.9473 VYL 0.5x 99% 99.43% 3.52% 0.9900 EYL 1x 99% 99.05% 1.81% 0.5367 LYL 1x 99% 98.94% 1.18% 0.8319

21

Table 3 – Cost analysis for lactose hydrolysis in refrigerated milk (2⁰C) using the four β-galactosidase enzymes evaluated in this study. Concentrations represent the fraction of the suppliers’ recommended dosage required to achieve at least >95% lactose hydrolysis in the time allotted. Costs are for enzyme only in addition to the normal costs of milk manufacture.

Minimum volume pricing of commercial enzymes per kg DYL $110.00 VYL $100.00 EYL $55.00 LYL $63.22

Enzyme Time/concentration Cost per liter of milk Cost per kiloliter of milk DYL 24 hour/1x $0.11 $113.59 48 hour/0.75x $0.09 $85.19 72 hour/0.5x $0.06 $56.80 VYL 24 hour/1x $0.08 $82.61 48 hour/0.75x $0.08 $77.45 72 hour/0.5x $0.05 $51.63 EYL 24 hour/2x $0.11 $112.62 48 hour/1.5x $0.08 $84.47 72 hour/1x $0.06 $56.31 LYL 24 hour/2x $0.13 $130.57 48 hour/1.5x $0.10 $97.93 72 hour/1x $0.07 $65.28

22

APPENDICES

23

APPENDIX A

APPROVED PROSPECTUS

24

DEPARTMENT OF NUTRITION, DIETETICS AND FOOD SCIENCE THESIS OR DISSERTATION PROSPECTUS

MASTER CANDIDATES

Proposed Title: Beta-Galactosidase Activity of Commercial Lactase Samples in Raw and Pasteurized Milk at Refrigerated Temperatures.

Statement of the problem Milk is a nutrient-dense food and an important part of a healthy diet. Along with good amounts of high-quality protein, milk contains many vitamins and minerals, such as calcium, riboflavin, and phosphorus. Milk is fortified with vitamin D and is one of the few food products containing this vitamin. Unfortunately, many individuals are unable to consume milk due to lactose-intolerance and thus the benefits of milk are not readily available to them.

Lactose intolerance is caused by a deficiency of “lactase” (beta-galactosidase) in the digestive tract. Normally, lactose in milk is hydrolyzed while in the intestinal tract. The lactose in milk is broken down into glucose and galactose by the enzyme, and these monosaccharides are easily utilized by the digestive system. When lactose intolerant individuals consume milk, the undigested lactose passes into the colon and increases the osmolarity of digested food. This inhibits the absorption of water by the colon and can cause diarrhea. Also, the bacteria in the colon are able to digest the lactose which causes the acidity of the stools to increase and produces gas and toxins. These unpleasant symptoms further inhibit the consumption of milk by these individuals.

For those who are lactose-intolerant, lactose-reduced and lactose-free milk are available. These milk products have 75-100% of the lactose removed. Normally, a β-galactosidase is used during processing to break-down lactose into galactose and glucose which are easily digested. However, the process for making this milk is expensive, and can cause the cost to be two-to-four times the amount of normal milk. This higher price can be a problem for those who need the milk, making it difficult for them to obtain the benefits that milk can give.

If β-galactosidase enzymes are determined to have sufficient activity in the cold to accomplish hydrolysis in 24-72 hours, the reaction might be carried out during refrigeration storage and thereby eliminating the expensive in-plant process. This would result in a lower overall cost of producing lactose-reduced milk. The objective of this research was to determine if currently available lactase enzymes were active enough in chilled milk to enable the hydrolysis process to be carried out during refrigerated storage.

25

Method to be followed There are two proposed methods for using potentially cold-active enzymes, outlined by the following:

-Process milk as normal, adding sterile cold-active enzymes as the milk is packaged. (Lactose hydrolysis would occur before being sold on store shelves)

-Add cold-active enzymes before milk arrives at the plant (Adding the enzymes at the farm, before shipping to the plant)

Commercially available β-galactosidase enzymes were obtained. The temperature-activity profiles of the enzymes were determined in milk at pH 6.8 using a rapid colorimetric assay. This consisted of adding the candidate enzymes to a prepared assay buffer and reacting for several minutes, recording the start time. The mixture produced a moderately yellow color, caused by the hydrolysis of O-nitrophenyl-β, D-galactopyranoside (present in the assay buffer). Once the yellow color was present, a stop buffer was added to halt the reaction and the stop time was recorded. The mixture was then centrifuged and moved to a cuvette for use in a spectrophotometer. The instrument was used to take a reading on the color of the mixture at OD 420nm, and the data gathered was used to calculate activity. This assay was performed at various temperatures to produce the temperature vs. activity profile for each enzyme.

Candidate enzymes with cold-activity were reacted with milk using various concentrations at 2°C for 12, 24, 48, and 72 hour periods. Lactose content was determined at the end of the reaction times by High Performance Liquid Chromatography (HPLC) to determine the extent of hydrolysis. The times represented possible reaction times during cold-storage.

For HPLC analysis, the enzymes were denatured and milk samples were prepared using the Lactose HPLC Method (Class B) 11(984.22), 50 (as referenced in Standard Methods for the Examination of Dairy Products (2004)). Milk proteins were precipitated by adding 0.9N sulfuric acid to each sample followed by centrifugation. Read-outs from the HPLC were checked against galactose, glucose, and lactose standards.

Justification of the problem The researched methods of reducing lactose in milk have the potential to save time and money. Over-all, the enzymes would take more time at the lower temperatures, but this would be time during shipping rather than time in the plant. The new methods require less employee time, less plant space, and less energy. Potentially, such processes would be safer as well, since the milk would stay at refrigeration temperatures during the entire process. It may also be possible to eliminate the second pasteurization step, further saving time and money.

Feasibility of research for cheaper product includes the following: -The market for lactose-reduced products is growing

-Jelen (2003) predicted about a 20% per year increase, due in part to increased awareness of lactose intolerance

26

-Estimated market is about 50 million consumers (in U.S. alone)

Delimitations of the problem Issues with lactose-reduced milk include factors such as a sweeter taste (from glucose and galactose being sweeter than lactose) and potential off-flavors (potential for increased Maillard browning with glucose/galactose during pasteurization). This study looked at these issues and concluded that the milk produced by the researched methods was acceptable compared to products currently on the market.

27

APPENDIX B

TESTING RELATIVE ACTIVITY OF THE ENZYMES: THE BETA-

GALACTOSIDASE ASSAY

28

Notes about the entire analysis – Please read first:

This analysis is adapted from the Miller Assay (Miller 1972), which is a bacterial assay. In the bacterial assay, everything used must be sterile; however, sterility was not important for testing these β-galactosidase enzymes. Also, the purified enzymes were much more active than a broth of lactase producing bacteria. Thus, the enzymes were diluted (10-1 to 10-6) in order to achieve similar results to the bacterial assay.

Preparation for the analysis – β-galactosidase reaction Materials needed:

• 1.5 mL Microfuge tubes and rack for holding the tubes • Basal Buffer • Chloroform • Assay Buffer • Stop Buffer • 2 Mechanical pipettes, one with 1mL tips and one with 100µL tips • Stop watch or timer

1. Place 7 empty microfuge tubes in rack. The first 6 tubes are for each dilution (10-1 to 10-

6); the seventh tube is for making a blank. 2. Add 450µL of basal buffer to each tube. 3. Add 50µL of enzyme to the 450µL of basal buffer in the first microfuge tube (dilution 10-

1). Close the top of the tube and shake vigorously to mix well (at least 5 seconds of shaking).

4. To each tube in succession, create dilutions of 10-2 through 10-6 by adding 50µL of the previous dilution to the 450µL of basal buffer in the next tube and mix well (e.g. starting with the first tube, take 50µL from the first tube and put it into the 450µL of basal buffer in the second tube and mix).

5. For the blank, do not add any the enzyme to the tube. 6. Add 30µL of chloroform to each tube, including the blank. 7. Add 600µL of assay buffer to each dilution in order (including the blank). Close the top

of each tube and shake vigorously to mix well. Start the timer or record the start time once the assay buffer is added to the first tube.

8. When samples are sufficiently yellow (produces a spectrophotometer reading between 0.1 and 1.0 at 420nm; I suggest using dilution 10-4 or 10-5), add 600 micro-liters of stop buffer and mix well, stopping the timer or recording the stop time. The blank will not turn yellow.

Running the analysis – Spectrophotometer Materials needed:

• Samples and blank from the β-galactosidase reaction (I found the 10-5 dilution worked well)

• A Centrifuge and test-tubes that fit the centrifuge • Cuvettes for each sample and the blank

29

• Mechanical pipette with 1mL tips

1. Transfer the assay solutions to test tubes for use in a table-top centrifuge in Dr. Dunn’s lab. Centrifuge the samples for at least a minute.

2. Transfer 1mL of each sample to cuvettes. Prepare the blank in the same manner. 3. Use the spectrophotometer in Dr. Dunn’s lab, set at 420nm and zeroed with the prepared

blank, to read the samples. Instructions for using the instrument are in appendix B-2. Record the readings for each sample.

4. Plug the data into the equation (adapted for a non-bacterial assay), where OD420 is the reading from the spectrophotometer:

Units per volume = [1000*OD420]/[volume(mL)*Time(min.)]

5. The units are useful for comparing enzyme activities. See figure 1 for the results of the assay.

6. The data were adjusted to show ΔOD420 per mass of protein of enzyme, or efficiency of the enzymes, as follows:

Units per mass = [OD420/(T)] * [Mass of protein(ng)] *1000

Where T = time in minutes and protein mass is calculated from the following:

Volume(ml)*(mg/ml of protein in the enzyme solution) * (dilution factor) * 10^6

Where volume is the amount of enzyme solution used in the assay (0.050 ml), dilution factor being the dilution used for each trial (either 10^-4 or 10^-5), and 10^6 to convert into nanograms.

30

Appendix B-1: Solutions Basal Buffer Materials needed:

• 500mL water • 4.3 g NA2HPO4 • 2.4 g NaH2PO4 • 0.75 g KCL • ~1.5mL 2N KOH • 1mL of 1M MgSO4_7H2O • 1 L autoclave bottle

Add the 500mL of water to the autoclave bottle. Add the NA2HPO4, NaH2PO4, and 0.75 g KCL and mix well. The KOH is then added as needed to bring the pH up to 7.0 (it is possible the solution will already be at pH 7.0 without adding KOH; in this case, don’t add the KOH). Autoclave the solution. When cool, add the MgSO4_7H2O. Autoclave again. Store in refrigerator to help prevent microbial growth after using. Stop Buffer Materials needed:

• 500mL water • 1 M Na2CO3 (Sodium carbonate) • 1 L autoclave bottle

Mix 53 g Na2CO3 with 500mL of water in the autoclave bottle. Autoclave (A precipitate may form). Refrigerate to help prevent microbial growth after using. Assay Buffer Materials needed:

• 15 ml basal buffer • 13.25 mg ONPG • 11 µl 10% SDS (make 10% SDS solution by adding 10 g SDS to 90 g water) • 45 µl β-mercaptoethanol (USE A VENT HOOD! It emits a strong, toxic sulfur smell) • 100 ml flask

Add the basal buffer to the flask. Add the SDS solution and the β-mercaptoethanol (when adding the β-mercaptoethanol, a vent hood must be used!). Add the ONPG, seal the flask, and mix everything well (ONPG does not dissolve easily; it may be necessary to warm the solution in order to get it to dissolve). Store in the refrigerator and keep it sealed while storing.

31

Appendix B-2: Spectrophotometer Dr. Dunn lab Spectrophotometer (S-161 ESC)

Spectrophotometer model: Milton Roy Spectronic 1001 (Milton Roy Instrument Group)

1. Switch on the machine; wait for it to initialize the wavelength (WV) 2. Using the number pad, type in the desired wavelength (420) followed by pressing the “go

to λ” button. The machine will go to wavelength 420nm. 3. Open the samples’ compartment to the left of the display panel. Set the cuvettes in the

holders (be sure the clear side of the cuvettes correctly face the light source, which is right of the sample holders). Place the prepared blank in first. Be sure to close the compartment before taking any readings.

4. Zero the machine using the blank by pressing the “second function” button followed by the “zero ABS” button. The display will revert to zero.

5. Use the knob and arm attached to the sample holders to move the next sample into place. Record the data on the display panel, which should be between 0.1 and 1.0 for this assay.

6. Repeat the process for the remaining samples.

32

Appendix B-3: Explanation of the how the β-Galactosidase assay works

Source: Switzer RL, Garrity LF. 1999. Experimental biochemistry, theory and exercises in fundamental methods. 3rd ed. New York: W H Freeman and Company. 453 p. When O-nitrophenyl-β, D-Galactopyranoside (ONPG) reacts with a β-galactosidase enzyme, galactose and O-Nitrophenol (ONP) are the products, and the solution turns a yellow color. ONP absorbs light at 420nm in alkaline conditions, allowing for measurement by a spectrophotometer. The gathered data can be put into the following equation (adapted from the original equation for bacterial assays):

Activity Units = [1000*OD420]/[volume(mL)*Time(min.)] OD420 is the reading from the spectrophotometer and time refers to the length of time in minutes that the ONPG was reacted with the β-galactosidase during the assay. Using the data from the Miller unit equation, the relative activity of the β-galactosidase enzymes can be compared to one another, allowing for selection of the most effective enzymes.

33

APPENDIX C

HPLC ANALYSIS OF LACTOSE HYDROLYSIS

34

Preparation for the analysis – Lactose hydrolysis

Notes about this section: The instructions below were made using enzyme #1. The method won’t change for the other enzymes other than the amount of enzyme used per 100 ml of milk based on supplier instructions. Materials needed:

• 100 ml milk • 100 µl β-galactosidase • 250 ml flask

1. Pour the milk into the flask and add the enzyme. Seal the flask and mix vigorously to

ensure thorough dispersion of the enzyme. 2. Place the flask in a refrigerator for the proper amount of hours according to the

experimental design. 3. Remove from refrigerator and HTST pasteurize the sample (161⁰C for 15 seconds) in

order to denature the enzyme. Cool the pasteurized sample in refrigerator to prepare for the next step.

Preparation for the analysis – Separation of milk proteins Materials needed:

• 100 ml volumetric flask • 10 g pasteurized milk sample from previous step • Analytical scale • Pasteur pipettes • 1 ml 0.9N sulfuric acid • Distilled-deionized water • 3 ml syringes with attached syringe filters, 0.45 µm • HPLC vials with caps • A capper to seal HPLC vials

1. Place the flask on the analytical balance and tare the weight. 2. Measure 10.0000 ± 0.0030 g milk into the flask. 3. Remove flask from balance, add 1 ml sulfuric acid to the milk and swirl. 4. Add ~50 ml of the water to the flask and swirl again. 5. Bring the mixture to volume (100 ml) with water and seal the flask. Shake vigorously for

20 seconds. 6. Let the mixture to stand for at least 5 minutes to allow good separation of the proteins

from the liquid fraction. A layer of white milk proteins will settle out on the bottom of the flask.

7. Use a Pasteur pipette to remove the liquid fraction of the milk and put the liquid into a syringe w/filter attached. Two pipettes of liquid should be plenty.

8. Use the syringe to filter the liquid into an HPLC vial. Fill the vial at least half-full and no more than ¾ full.

35

9. Cap and seal the vial. Source: Wehr MH, Frank JF. 2004. Standard Methods for the examination of dairy products. 17th ed. Washington DC: American Public Health Association.

36

Appendix C-1: Solutions 0.9N Sulfuric Acid Materials needed:

• 100mL volumetric flask • A separate flask/beaker/bottle for storage • Concentrated sulfuric acid (10M)

Add 9mL of 10M sulfuric acid to the flask. Bring up to volume with distilled-deionized water. Store the acid in a separate flask to enable easy access to the acid using Pasteur pipettes.

37

Appendix C-2: Results of HPLC Analysis This appendix contains the raw data from the HPLC analysis of all the milk samples.

Each page contains one of the six trials from the three types of milk experimented upon, denoted by the label at the top of the page.

The tables on the top of each page contain the percent lactose hydrolysis of every sample (384 samples total). Underneath the tables are graphical summaries of the data in the tables. The legend on each graph shows the concentration of each enzyme.

Each table is organized with time (hours) at the top of each column and the concentration of each enzyme in the left column under the enzyme designation.

Figure 1 Skim Milk Trial #1 ......................................................................................................... 38 Figure 2 Skim Milk Trial #2 ......................................................................................................... 39 Figure 3 Whole Milk Trial #1 ....................................................................................................... 40 Figure 4 Whole Milk Trial #2 ....................................................................................................... 41 Figure 5 Raw Milk Trial #1 .......................................................................................................... 42 Figure 6 Raw Milk Trial #2 .......................................................................................................... 43

38

Percent Hydrolysis DYL 12 24 48 72 0.25x 35.39% 61.60% 81.16% 91.36% 0.5x 76.75% 87.95% 97.93% 99.99% 0.75x 84.85% 92.37% 99.99% 99.99% 1.0x 94.71% 99% 99.99% 99.99%

VYL 12 24 48 72 0.25x 42.86% 75.97% 89.58% 96.60% 0.5x 59.82% 89.51% 98.84% 99.99% 0.75x 77.84% 96.70% 99.99% 99.99% 1.0x 87.48% 98.07% 99.99% 99.99%

EYL 12 24 48 72 0.5x 31.75% 60.24% 82.87% 93.24% 1.0x 58.52% 92.64% 98.13% 99.99% 1.5x 72.79% 96.60% 98.76% 99.99% 2.0x 85.60% 97.03% 99.99% 99.99%

LYL 12 24 48 72 0.5x 39.03% 58.21% 79.67% 88.48% 1.0x 61.11% 81.82% 96.50% 98.52% 1.5x 74.04% 91.81% 99.99% 99.99% 2.0x 79.72% 96.78% 99.99% 99.99%

Figure 1 Skim Milk Trial #1

0.00%20.00%40.00%60.00%80.00%

100.00%120.00%

12 24 48 72

Perc

ent H

ydro

lysi

s

Hours

DYL

1.0x

0.75x

0.5x

0.25x 0.00%20.00%40.00%60.00%80.00%

100.00%120.00%

12 24 48 72

Perc

ent H

ydro

lysi

s

Hours

EYL

2.0x

1.5x

1.0x

0.5x

0.00%20.00%40.00%60.00%80.00%

100.00%120.00%

12 24 48 72

Perc

ent H

ydro

lysi

s

Hours

VYL

1.0x

0.75x

0.5x

0.25x 0.00%20.00%40.00%60.00%80.00%

100.00%120.00%

12 24 48 72

Perc

ent H

ydro

lysi

s

Hours

LYL

2.0x

1.5x

1.0x

0.5x

39

Percent Hydrolysis DYL 12 24 48 72 1/4x 40.10% 63.75% 84.67% 93.26% 1/2x 69.61% 86.68% 99.81% 99.86% 3/4x 84.49% 96.17% 99.99% 99.99% 1x 90.17% 98.08% 99.99% 99.99%

VYL 12 24 48 72 1/4x 32.81% 60.47% 79.31% 88.43% 1/2x 67.25% 86.06% 96.50% 99.99% 3/4x 71.51% 92.46% 98.89% 99.99% 1x 86.12% 98.39% 99.99% 99.99%

EYL 12 24 48 72 1/2x 36.61% 58.29% 79.99% 89.57% 1x 60.15% 81.21% 95.60% 99.70% 1.5x 73.87% 88.45% 99.15% 99.99% 2x 85.78% 97.52% 99.99% 99.99%

LYL 12 24 48 72 1/2x 35.34% 57.46% 77.80% 89.48% 1x 60.22% 83.96% 96.01% 99.63% 1.5x 73.78% 89.26% 98.74% 99.99% 2x 81.83% 94.20% 99.99% 99.99%

Figure 2 Skim Milk Trial #2

0.00%20.00%40.00%60.00%80.00%

100.00%120.00%

12 24 48 72

Perc

ent H

ydro

lysi

s

Hours

DYL

1.0x

0.75x

0.5x

0.25x 0.00%20.00%40.00%60.00%80.00%

100.00%120.00%

12 24 48 72

Perc

ent H

ydro

lysi

s

Hours

EYL

2.0x

1.5x

1.0x

0.5x

0.00%20.00%40.00%60.00%80.00%

100.00%120.00%

12 24 48 72

Perc

ent H

ydro

lysi

s

Hours

VYL

1.0x

0.75x

0.5x

0.25x 0.00%20.00%40.00%60.00%80.00%

100.00%120.00%

12 24 48 72

Perc

ent H

ydro

lysi

s

Hours

LYL

2.0x

1.5x

1.0x

0.5x

40

Percent Hydrolysis DYL 12 24 48 72 1/4x 51.64% 78.53% 94.24% 97.03% 1/2x 71.34% 89.38% 98.57% 99.09% 3/4x 86.56% 97.26% 99.99% 99.99% 1x 94.29% 99.99% 99.99% 99.99%

VYL 12 24 48 72 1/4x 54.79% 55.86% 77.80% 86.27% 1/2x 66.47% 88.46% 98.49% 99.99% 3/4x 83.34% 93.52% 99.99% 99.99% 1x 93.40% 99.14% 99.99% 99.99%

EYL 12 24 48 72 1/2x 42.86% 65.08% 86.87% 92.94% 1x 60.49% 85.87% 97.29% 99.01% 1.5x 81.69% 93.26% 99.46% 99.99% 2x 88.25% 98.57% 99.99% 99.99%

LYL 12 24 48 72 1/2x 41.87% 58.75% 80.83% 88.10% 1x 64.87% 87.29% 98.56% 99.46% 1.5x 75.37% 94.24% 99.99% 99.99% 2x 84.68% 96.41% 99.99% 99.99%

Figure 3 Whole Milk Trial #1

0.00%20.00%40.00%60.00%80.00%

100.00%120.00%

12 24 48 72

Perc

ent H

ydro

lysi

s

Hours

DYL

1.0x

0.75x

0.5x

0.25x 0.00%20.00%40.00%60.00%80.00%

100.00%120.00%

12 24 48 72

Perc

ent H

ydro

lysi

s

Hours

EYL

2.0x

1.5x

1.0x

0.5x

0.00%20.00%40.00%60.00%80.00%

100.00%120.00%

12 24 48 72

Perc

ent H

ydro

lysi

s

Hours

VYL

1.0x

0.75x

0.5x

0.25x 0.00%20.00%40.00%60.00%80.00%

100.00%120.00%

12 24 48 72

Perc

ent H

ydro

lysi

s

Hours

LYL

2.0x

1.5x

1.0x

0.5x

41

Percent Hydrolysis DYL 12 24 48 72 1/4x 66.44% 75.87% 92.08% 96.97% 1/2x 86.83% 90.35% 98.13% 99.28% 3/4x 88.53% 96.39% 99.99% 99.18% 1x 92.14% 98.21% 99.99% 99.99%

VYL 12 24 48 72 1/4x 69.91% 72.77% 87.65% 92.23% 1/2x 77.23% 85.21% 98.00% 97.92% 3/4x 84.59% 96.70% 99.99% 98.89% 1x 93.69% 98.16% 99.99% 99.99%

EYL 12 24 48 72 1/2x 53.16% 64.78% 84.37% 89.83% 1x 66.98% 83.81% 95.97% 96.71% 1.5x 78.94% 93.23% 98.96% 97.87% 2x 84.24% 96.40% 99.99% 99.99%

LYL 12 24 48 72 1/2x 42.49% 63.19% 83.79% 88.91% 1x 60.45% 83.01% 96.20% 98.03% 1.5x 76.74% 92.26% 99.41% 99.99% 2x 81.81% 96.58% 99.99% 99.99%

Figure 4 Whole Milk Trial #2

0.00%20.00%40.00%60.00%80.00%

100.00%120.00%

12 24 48 72

Perc

ent H

ydro

lysi

s

Hours

DYL

1.0x

0.75x

0.5x

0.25x 0.00%20.00%40.00%60.00%80.00%

100.00%120.00%

12 24 48 72

Perc

ent H

ydro

lysi

s

Hours

EYL

2.0x

1.5x

1.0x

0.5x

0.00%20.00%40.00%60.00%80.00%

100.00%120.00%

12 24 48 72

Perc

ent H

ydro

lysi

s

Hours

VYL

1.0x

0.75x

0.5x

0.25x 0.00%20.00%40.00%60.00%80.00%

100.00%120.00%

12 24 48 72

Perc

ent H

ydro

lysi

s

Hours

LYL

2.0x

1.5x

1.0x

0.5x

42

Percent Hydrolysis DYL 12 24 48 72 1/4x 54.07% 73.23% 90.57% 97.87% 1/2x 72.47% 91.44% 98.83% 99.99% 3/4x 88.08% 97.13% 99.99% 99.99% 1x 93.09% 99.99% 99.99% 99.99%

VYL 12 24 48 72 1/4x 43.39% 73.62% 89.58% 93.86% 1/2x 61.45% 95.47% 99.99% 99.99% 3/4x 83.76% 97.56% 99.99% 99.99% 1x 91.07% 98.71% 99.99% 99.99%

EYL 12 24 48 72 1/2x 39.30% 64.57% 77.31% 87.74% 1x 64.79% 84.89% 96.42% 99.14% 1.5x 64.32% 81.33% 97.09% 99.99% 2x 86.30% 97.66% 99.99% 99.99%

LYL 12 24 48 72 1/2x 37.71% 55.78% 76.93% 87.53% 1x 56.55% 78.71% 93.83% 98.00% 1.5x 72.94% 89.66% 98.67% 99.99% 2x 84.11% 96.25% 99.99% 99.99%

Figure 5 Raw Milk Trial #1

0.00%20.00%40.00%60.00%80.00%

100.00%120.00%

12 24 48 72

Perc

ent H

ydro

lysi

s

Hours

DYL

1.0x

0.75x

0.5x

0.25x 0.00%20.00%40.00%60.00%80.00%

100.00%120.00%

12 24 48 72

Perc

ent H

ydro

lysi

s

Hours

EYL

2.0x

1.5x

1.0x

0.5x

0.00%20.00%40.00%60.00%80.00%

100.00%120.00%

12 24 48 72

Perc

ent H

ydro

lysi

s

Hours

VYL

1.0x

0.75x

0.5x

0.25x 0.00%20.00%40.00%60.00%80.00%

100.00%120.00%

12 24 48 72

Perc

ent H

ydro

lysi

s

Hours

LYL

2.0x

1.5x

1.0x

0.5x

43

Percent Hydrolysis DYL 12 24 48 72 1/4x 52.03% 77.64% 92.43% 97.19% 1/2x 75.16% 90.46% 98.05% 99.99% 3/4x 86.04% 94.98% 99.99% 99.99% 1x 92.28% 98.19% 99.99% 99.99%

VYL 12 24 48 72 1/4x 53.93% 65.95% 85.60% 92.05% 1/2x 71.80% 88.70% 97.82% 98.68% 3/4x 78.93% 94.77% 98.38% 99.99% 1x 89.00% 99.07% 99.99% 99.99%

EYL 12 24 48 72 1/2x 45.60% 67.48% 87.06% 95.10% 1x 62.83% 82.98% 96.60% 99.73% 1.5x 79.37% 91.59% 98.84% 99.99% 2x 84.96% 96.72% 99.99% 99.99%

LYL 12 24 48 72 1/2x 41.25% 56.14% 78.72% 88.27% 1x 64.95% 82.94% 97.21% 99.99% 1.5x 71.80% 90.41% 99.86% 99.99% 2x 82.06% 95.11% 99.99% 99.99%

Figure 6 Raw Milk Trial #2

0.00%20.00%40.00%60.00%80.00%

100.00%120.00%

12 24 48 72

Perc

ent H

ydro

lysi

s

Hours

DYL

1.0x

0.75x

0.5x

0.25x 0.00%20.00%40.00%60.00%80.00%

100.00%120.00%

12 24 48 72

Perc

ent H

ydro

lysi

s

Hours

EYL

2.0x

1.5x

1.0x

0.5x

0.00%20.00%40.00%60.00%80.00%

100.00%120.00%

12 24 48 72

Perc

ent H

ydro

lysi

s

Hours

VYL

1.0x

0.75x

0.5x

0.25x 0.00%20.00%40.00%60.00%80.00%

100.00%120.00%

12 24 48 72

Perc

ent H

ydro

lysi

s

Hours

LYL

2.0x

1.5x

1.0x

0.5x

44

APPENDIX D

STATISTICAL ANALYSIS OF HPLC DATA

45

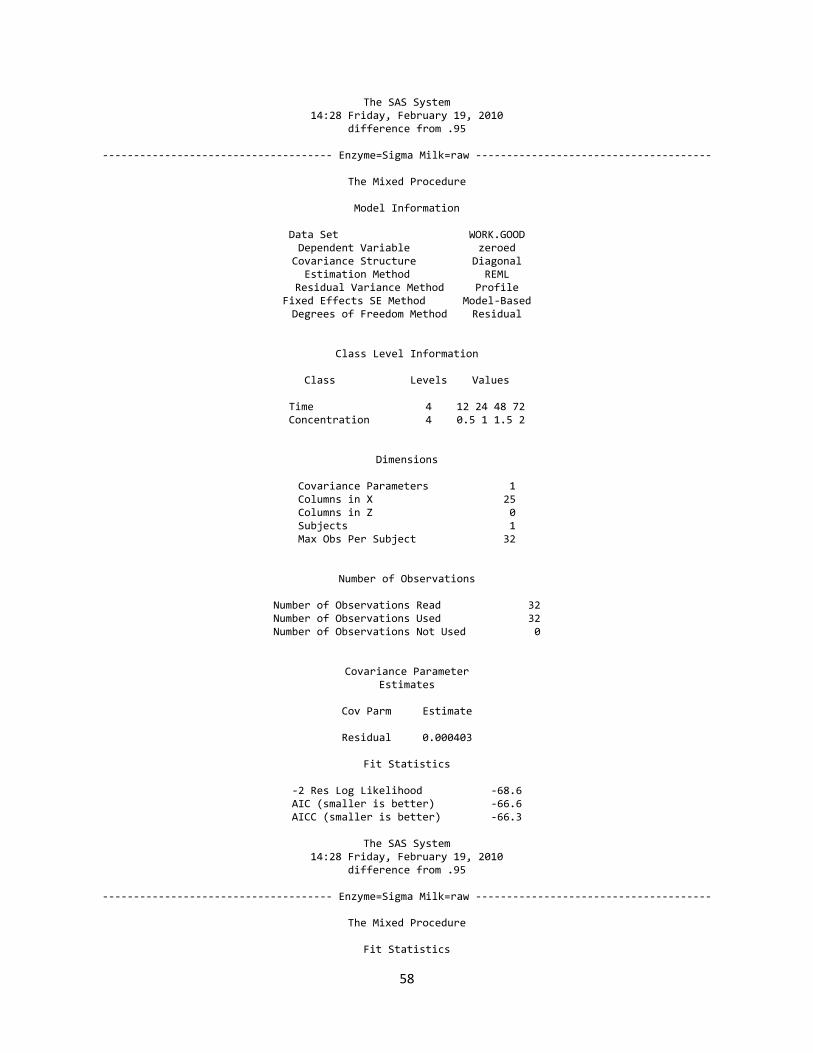
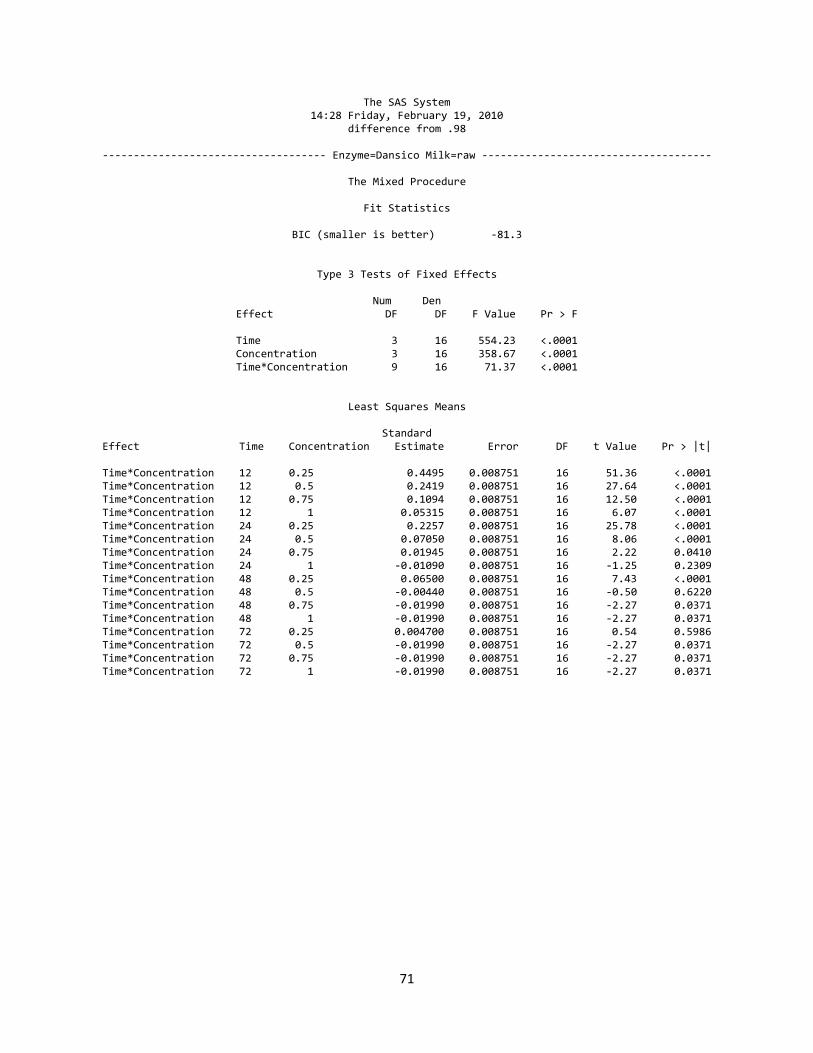
Statistics, calculated using SAS version 9.2, for the analysis of the HPLC data on hydrolysis of lactose are included in this appendix. The SAS code used is listed below. The data was originally pulled from an excel file; this data is found in appendix C-2. The statistical analysis was run based on a lactose hydrolysis of 95%, 98%, and 99%.

PROC IMPORT OUT= WORK.in DATAFILE= "C:\SAS\bioag\fsn\ogden\horner\lactase.xls" DBMS=EXCEL REPLACE; RANGE="Sheet1$"; GETNAMES=YES; MIXED=NO; SCANTEXT=YES; USEDATE=YES; SCANTIME=YES; run; *Enzyme Time Concentration Hydrolysis Milk Trial; title2 'difference from .95'; data good;set in; zeroed=.95-hydrolysis; run; proc sort data=good; by enzyme milk; proc mixed data=good; class time concentration; model zeroed=time concentration time*concentration; lsmeans time*concentration; by enzyme milk; run;

46

The SAS System 14:28 Friday, February 19, 2010

difference from .95

------------------------------------ Enzyme=Danisco Milk=raw -------------------------------------

The Mixed Procedure

Model Information

Data Set WORK.GOOD Dependent Variable zeroed

Covariance Structure Diagonal Estimation Method REML

Residual Variance Method Profile Fixed Effects SE Method Model-Based Degrees of Freedom Method Residual

Class Level Information

Class Levels Values

Time 4 12 24 48 72 Concentration 4 0.25 0.5 0.75 1

Dimensions

Covariance Parameters 1 Columns in X 25 Columns in Z 0 Subjects 1 Max Obs Per Subject 32

Number of Observations

Number of Observations Read 32 Number of Observations Used 32 Number of Observations Not Used 0

Covariance Parameter Estimates

Cov Parm Estimate

Residual 0.000153

Fit Statistics

-2 Res Log Likelihood -84.0 AIC (smaller is better) -82.0 AICC (smaller is better) -81.8

47

The SAS System 14:28 Friday, February 19, 2010

difference from .95

------------------------------------ Enzyme=Danisco Milk=raw -------------------------------------

The Mixed Procedure

Fit Statistics

BIC (smaller is better) -81.3

Type 3 Tests of Fixed Effects

Num Den Effect DF DF F Value Pr > F

Time 3 16 554.23 <.0001 Concentration 3 16 358.67 <.0001 Time*Concentration 9 16 71.37 <.0001

Least Squares Means

Standard Effect Time Concentration Estimate Error DF t Value Pr > |t|

Time*Concentration 12 0.25 0.4195 0.008751 16 47.93 <.0001 Time*Concentration 12 0.5 0.2119 0.008751 16 24.21 <.0001 Time*Concentration 12 0.75 0.07940 0.008751 16 9.07 <.0001 Time*Concentration 12 1 0.02315 0.008751 16 2.65 0.0176 Time*Concentration 24 0.25 0.1957 0.008751 16 22.36 <.0001 Time*Concentration 24 0.5 0.04050 0.008751 16 4.63 0.0003 Time*Concentration 24 0.75 -0.01055 0.008751 16 -1.21 0.2455 Time*Concentration 24 1 -0.04090 0.008751 16 -4.67 0.0003 Time*Concentration 48 0.25 0.03500 0.008751 16 4.00 0.0010 Time*Concentration 48 0.5 -0.03440 0.008751 16 -3.93 0.0012 Time*Concentration 48 0.75 -0.04990 0.008751 16 -5.70 <.0001 Time*Concentration 48 1 -0.04990 0.008751 16 -5.70 <.0001 Time*Concentration 72 0.25 -0.02530 0.008751 16 -2.89 0.0106 Time*Concentration 72 0.5 -0.04990 0.008751 16 -5.70 <.0001 Time*Concentration 72 0.75 -0.04990 0.008751 16 -5.70 <.0001 Time*Concentration 72 1 -0.04990 0.008751 16 -5.70 <.0001

48

The SAS System 14:28 Friday, February 19, 2010

difference from .95

------------------------------------ Enzyme=Danisco Milk=skim ------------------------------------

The Mixed Procedure

Model Information

Data Set WORK.GOOD Dependent Variable zeroed

Covariance Structure Diagonal Estimation Method REML

Residual Variance Method Profile Fixed Effects SE Method Model-Based Degrees of Freedom Method Residual

Class Level Information

Class Levels Values

Time 4 12 24 48 72 Concentration 4 0.25 0.5 0.75 1

Dimensions

Covariance Parameters 1 Columns in X 25 Columns in Z 0 Subjects 1 Max Obs Per Subject 32

Number of Observations

Number of Observations Read 32 Number of Observations Used 32 Number of Observations Not Used 0

Covariance Parameter Estimates

Cov Parm Estimate

Residual 0.000422

Fit Statistics

-2 Res Log Likelihood -67.8 AIC (smaller is better) -65.8 AICC (smaller is better) -65.6

The SAS System

14:28 Friday, February 19, 2010 difference from .95

------------------------------------ Enzyme=Danisco Milk=skim ------------------------------------

The Mixed Procedure

Fit Statistics

49

BIC (smaller is better) -65.1

Type 3 Tests of Fixed Effects

Num Den Effect DF DF F Value Pr > F

Time 3 16 263.96 <.0001 Concentration 3 16 321.14 <.0001 Time*Concentration 9 16 39.40 <.0001

Least Squares Means

Standard Effect Time Concentration Estimate Error DF t Value Pr > |t|

Time*Concentration 12 0.25 0.5725 0.01452 16 39.44 <.0001 Time*Concentration 12 0.5 0.2182 0.01452 16 15.03 <.0001 Time*Concentration 12 0.75 0.1033 0.01452 16 7.11 <.0001 Time*Concentration 12 1 0.02560 0.01452 16 1.76 0.0969 Time*Concentration 24 0.25 0.3233 0.01452 16 22.26 <.0001 Time*Concentration 24 0.5 0.07685 0.01452 16 5.29 <.0001 Time*Concentration 24 0.75 0.007300 0.01452 16 0.50 0.6220 Time*Concentration 24 1 -0.03540 0.01452 16 -2.44 0.0268 Time*Concentration 48 0.25 0.1208 0.01452 16 8.32 <.0001 Time*Concentration 48 0.5 -0.03870 0.01452 16 -2.67 0.0169 Time*Concentration 48 0.75 -0.04990 0.01452 16 -3.44 0.0034 Time*Concentration 48 1 -0.04990 0.01452 16 -3.44 0.0034 Time*Concentration 72 0.25 0.02690 0.01452 16 1.85 0.0825 Time*Concentration 72 0.5 -0.04925 0.01452 16 -3.39 0.0037 Time*Concentration 72 0.75 -0.04990 0.01452 16 -3.44 0.0034 Time*Concentration 72 1 -0.04990 0.01452 16 -3.44 0.0034

50

The SAS System 14:28 Friday, February 19, 2010

difference from .95

----------------------------------- Enzyme=Danisco Milk=whole ------------------------------------

The Mixed Procedure

Model Information

Data Set WORK.GOOD Dependent Variable zeroed

Covariance Structure Diagonal Estimation Method REML

Residual Variance Method Profile Fixed Effects SE Method Model-Based Degrees of Freedom Method Residual

Class Level Information

Class Levels Values

Time 4 12 24 48 72 Concentration 4 0.25 0.5 0.75 1

Dimensions

Covariance Parameters 1 Columns in X 25 Columns in Z 0 Subjects 1 Max Obs Per Subject 32

Number of Observations

Number of Observations Read 32 Number of Observations Used 32 Number of Observations Not Used 0

Covariance Parameter Estimates

Cov Parm Estimate

Residual 0.001516

Fit Statistics

-2 Res Log Likelihood -47.4 AIC (smaller is better) -45.4 AICC (smaller is better) -45.1

The SAS System

14:28 Friday, February 19, 2010 difference from .95

----------------------------------- Enzyme=Danisco Milk=whole ------------------------------------

The Mixed Procedure

Fit Statistics

51

BIC (smaller is better) -44.6

Type 3 Tests of Fixed Effects

Num Den Effect DF DF F Value Pr > F

Time 3 16 41.32 <.0001 Concentration 3 16 28.32 <.0001 Time*Concentration 9 16 5.21 0.0021

Least Squares Means

Standard Effect Time Concentration Estimate Error DF t Value Pr > |t|

Time*Concentration 12 0.25 0.3596 0.02753 16 13.06 <.0001 Time*Concentration 12 0.5 0.1591 0.02753 16 5.78 <.0001 Time*Concentration 12 0.75 0.07455 0.02753 16 2.71 0.0155 Time*Concentration 12 1 0.01785 0.02753 16 0.65 0.5259 Time*Concentration 24 0.25 0.1780 0.02753 16 6.47 <.0001 Time*Concentration 24 0.5 0.05135 0.02753 16 1.87 0.0806 Time*Concentration 24 0.75 -0.01825 0.02753 16 -0.66 0.5168 Time*Concentration 24 1 -0.04100 0.02753 16 -1.49 0.1558 Time*Concentration 48 0.25 0.01840 0.02753 16 0.67 0.5134 Time*Concentration 48 0.5 -0.03350 0.02753 16 -1.22 0.2413 Time*Concentration 48 0.75 -0.04990 0.02753 16 -1.81 0.0887 Time*Concentration 48 1 -0.04990 0.02753 16 -1.81 0.0887 Time*Concentration 72 0.25 -0.02000 0.02753 16 -0.73 0.4780 Time*Concentration 72 0.5 -0.04185 0.02753 16 -1.52 0.1480 Time*Concentration 72 0.75 -0.04585 0.02753 16 -1.67 0.1153 Time*Concentration 72 1 -0.04990 0.02753 16 -1.81 0.0887

52

The SAS System 14:28 Friday, February 19, 2010

difference from .95

------------------------------------- Enzyme=Enzeco Milk=raw -------------------------------------

The Mixed Procedure

Model Information

Data Set WORK.GOOD Dependent Variable zeroed

Covariance Structure Diagonal Estimation Method REML

Residual Variance Method Profile Fixed Effects SE Method Model-Based Degrees of Freedom Method Residual

Class Level Information

Class Levels Values

Time 4 12 24 48 72 Concentration 4 0.5 1 1.5 2

Dimensions

Covariance Parameters 1 Columns in X 25 Columns in Z 0 Subjects 1 Max Obs Per Subject 32

Number of Observations

Number of Observations Read 32 Number of Observations Used 32 Number of Observations Not Used 0

Covariance Parameter Estimates

Cov Parm Estimate

Residual 0.001696

Fit Statistics

-2 Res Log Likelihood -45.6 AIC (smaller is better) -43.6 AICC (smaller is better) -43.3

53

The SAS System 14:28 Friday, February 19, 2010

difference from .95

------------------------------------- Enzyme=Enzeco Milk=raw -------------------------------------

The Mixed Procedure

Fit Statistics

BIC (smaller is better) -42.8

Type 3 Tests of Fixed Effects

Num Den Effect DF DF F Value Pr > F

Time 3 16 96.09 <.0001 Concentration 3 16 53.64 <.0001 Time*Concentration 9 16 4.80 0.0032

Least Squares Means

Standard Effect Time Concentration Estimate Error DF t Value Pr > |t|

Time*Concentration 12 0.5 0.5255 0.02912 16 18.04 <.0001 Time*Concentration 12 1 0.3119 0.02912 16 10.71 <.0001 Time*Concentration 12 1.5 0.2316 0.02912 16 7.95 <.0001 Time*Concentration 12 2 0.09370 0.02912 16 3.22 0.0054 Time*Concentration 24 0.5 0.2897 0.02912 16 9.95 <.0001 Time*Concentration 24 1 0.1106 0.02912 16 3.80 0.0016 Time*Concentration 24 1.5 0.08540 0.02912 16 2.93 0.0098 Time*Concentration 24 2 -0.02190 0.02912 16 -0.75 0.4630 Time*Concentration 48 0.5 0.1281 0.02912 16 4.40 0.0004 Time*Concentration 48 1 -0.01510 0.02912 16 -0.52 0.6112 Time*Concentration 48 1.5 -0.02965 0.02912 16 -1.02 0.3238 Time*Concentration 48 2 -0.04990 0.02912 16 -1.71 0.1059 Time*Concentration 72 0.5 0.03580 0.02912 16 1.23 0.2367 Time*Concentration 72 1 -0.04435 0.02912 16 -1.52 0.1473 Time*Concentration 72 1.5 -0.04990 0.02912 16 -1.71 0.1059 Time*Concentration 72 2 -0.04990 0.02912 16 -1.71 0.1059

54

The SAS System 14:28 Friday, February 19, 2010

difference from .95

------------------------------------ Enzyme=Enzeco Milk=skim -------------------------------------

The Mixed Procedure

Model Information

Data Set WORK.GOOD Dependent Variable zeroed

Covariance Structure Diagonal Estimation Method REML

Residual Variance Method Profile Fixed Effects SE Method Model-Based Degrees of Freedom Method Residual

Class Level Information

Class Levels Values

Time 4 12 24 48 72 Concentration 4 0.5 1 1.5 2

Dimensions

Covariance Parameters 1 Columns in X 25 Columns in Z 0 Subjects 1 Max Obs Per Subject 32

Number of Observations

Number of Observations Read 32 Number of Observations Used 32 Number of Observations Not Used 0

Covariance Parameter Estimates

Cov Parm Estimate

Residual 0.000803

Fit Statistics

-2 Res Log Likelihood -57.5 AIC (smaller is better) -55.5 AICC (smaller is better) -55.3

55

The SAS System 14:28 Friday, February 19, 2010

difference from .95

------------------------------------ Enzyme=Enzeco Milk=skim -------------------------------------

The Mixed Procedure

Fit Statistics

BIC (smaller is better) -54.8

Type 3 Tests of Fixed Effects

Num Den Effect DF DF F Value Pr > F

Time 3 16 242.30 <.0001 Concentration 3 16 163.96 <.0001 Time*Concentration 9 16 17.73 <.0001

Least Squares Means

Standard Effect Time Concentration Estimate Error DF t Value Pr > |t|

Time*Concentration 12 0.5 0.6082 0.02004 16 30.35 <.0001 Time*Concentration 12 1 0.3567 0.02004 16 17.80 <.0001 Time*Concentration 12 1.5 0.2167 0.02004 16 10.81 <.0001 Time*Concentration 12 2 0.09310 0.02004 16 4.65 0.0003 Time*Concentration 24 0.5 0.3574 0.02004 16 17.83 <.0001 Time*Concentration 24 1 0.08075 0.02004 16 4.03 0.0010 Time*Concentration 24 1.5 0.02475 0.02004 16 1.24 0.2346 Time*Concentration 24 2 -0.02275 0.02004 16 -1.14 0.2730 Time*Concentration 48 0.5 0.1357 0.02004 16 6.77 <.0001 Time*Concentration 48 1 -0.01865 0.02004 16 -0.93 0.3658 Time*Concentration 48 1.5 -0.03955 0.02004 16 -1.97 0.0659 Time*Concentration 48 2 -0.04990 0.02004 16 -2.49 0.0241 Time*Concentration 72 0.5 0.03595 0.02004 16 1.79 0.0917 Time*Concentration 72 1 -0.04845 0.02004 16 -2.42 0.0279 Time*Concentration 72 1.5 -0.04990 0.02004 16 -2.49 0.0241 Time*Concentration 72 2 -0.04990 0.02004 16 -2.49 0.0241

56

The SAS System 14:28 Friday, February 19, 2010

difference from .95

------------------------------------ Enzyme=Enzeco Milk=whole ------------------------------------

The Mixed Procedure

Model Information

Data Set WORK.GOOD Dependent Variable zeroed

Covariance Structure Diagonal Estimation Method REML

Residual Variance Method Profile Fixed Effects SE Method Model-Based Degrees of Freedom Method Residual

Class Level Information

Class Levels Values

Time 4 12 24 48 72 Concentration 4 0.5 1 1.5 2

Dimensions

Covariance Parameters 1 Columns in X 25 Columns in Z 0 Subjects 1 Max Obs Per Subject 32

Number of Observations

Number of Observations Read 32 Number of Observations Used 32 Number of Observations Not Used 0

Covariance Parameter Estimates

Cov Parm Estimate

Residual 0.000652

Fit Statistics

-2 Res Log Likelihood -60.9 AIC (smaller is better) -58.9 AICC (smaller is better) -58.6

The SAS System

14:28 Friday, February 19, 2010 difference from .95

------------------------------------ Enzyme=Enzeco Milk=whole ------------------------------------

The Mixed Procedure

Fit Statistics

57

BIC (smaller is better) -58.1

Type 3 Tests of Fixed Effects

Num Den Effect DF DF F Value Pr > F

Time 3 16 195.40 <.0001 Concentration 3 16 133.68 <.0001 Time*Concentration 9 16 13.28 <.0001

Least Squares Means

Standard Effect Time Concentration Estimate Error DF t Value Pr > |t|

Time*Concentration 12 0.5 0.4699 0.01805 16 26.03 <.0001 Time*Concentration 12 1 0.3127 0.01805 16 17.32 <.0001 Time*Concentration 12 1.5 0.1469 0.01805 16 8.13 <.0001 Time*Concentration 12 2 0.08755 0.01805 16 4.85 0.0002 Time*Concentration 24 0.5 0.3007 0.01805 16 16.66 <.0001 Time*Concentration 24 1 0.1016 0.01805 16 5.63 <.0001 Time*Concentration 24 1.5 0.01755 0.01805 16 0.97 0.3455 Time*Concentration 24 2 -0.02485 0.01805 16 -1.38 0.1876 Time*Concentration 48 0.5 0.09380 0.01805 16 5.20 <.0001 Time*Concentration 48 1 -0.01630 0.01805 16 -0.90 0.3800 Time*Concentration 48 1.5 -0.04210 0.01805 16 -2.33 0.0331 Time*Concentration 48 2 -0.04990 0.01805 16 -2.76 0.0138 Time*Concentration 72 0.5 0.03615 0.01805 16 2.00 0.0625 Time*Concentration 72 1 -0.02860 0.01805 16 -1.58 0.1327 Time*Concentration 72 1.5 -0.03930 0.01805 16 -2.18 0.0448 Time*Concentration 72 2 -0.04990 0.01805 16 -2.76 0.0138

58

The SAS System 14:28 Friday, February 19, 2010

difference from .95

------------------------------------- Enzyme=Sigma Milk=raw --------------------------------------

The Mixed Procedure

Model Information

Data Set WORK.GOOD Dependent Variable zeroed

Covariance Structure Diagonal Estimation Method REML

Residual Variance Method Profile Fixed Effects SE Method Model-Based Degrees of Freedom Method Residual

Class Level Information

Class Levels Values

Time 4 12 24 48 72 Concentration 4 0.5 1 1.5 2

Dimensions

Covariance Parameters 1 Columns in X 25 Columns in Z 0 Subjects 1 Max Obs Per Subject 32

Number of Observations

Number of Observations Read 32 Number of Observations Used 32 Number of Observations Not Used 0

Covariance Parameter Estimates

Cov Parm Estimate

Residual 0.000403

Fit Statistics

-2 Res Log Likelihood -68.6 AIC (smaller is better) -66.6 AICC (smaller is better) -66.3

The SAS System

14:28 Friday, February 19, 2010 difference from .95

------------------------------------- Enzyme=Sigma Milk=raw --------------------------------------

The Mixed Procedure

Fit Statistics

59

BIC (smaller is better) -65.8

Type 3 Tests of Fixed Effects

Num Den Effect DF DF F Value Pr > F

Time 3 16 436.09 <.0001 Concentration 3 16 333.80 <.0001 Time*Concentration 9 16 20.93 <.0001

Least Squares Means

Standard Effect Time Concentration Estimate Error DF t Value Pr > |t|

Time*Concentration 12 0.5 0.5552 0.01420 16 39.10 <.0001 Time*Concentration 12 1 0.3425 0.01420 16 24.12 <.0001 Time*Concentration 12 1.5 0.2263 0.01420 16 15.94 <.0001 Time*Concentration 12 2 0.1191 0.01420 16 8.39 <.0001 Time*Concentration 24 0.5 0.3904 0.01420 16 27.49 <.0001 Time*Concentration 24 1 0.1417 0.01420 16 9.98 <.0001 Time*Concentration 24 1.5 0.04965 0.01420 16 3.50 0.0030 Time*Concentration 24 2 -0.00680 0.01420 16 -0.48 0.6385 Time*Concentration 48 0.5 0.1718 0.01420 16 12.10 <.0001 Time*Concentration 48 1 -0.00520 0.01420 16 -0.37 0.7190 Time*Concentration 48 1.5 -0.04265 0.01420 16 -3.00 0.0084 Time*Concentration 48 2 -0.04990 0.01420 16 -3.51 0.0029 Time*Concentration 72 0.5 0.07100 0.01420 16 5.00 0.0001 Time*Concentration 72 1 -0.03995 0.01420 16 -2.81 0.0125 Time*Concentration 72 1.5 -0.04990 0.01420 16 -3.51 0.0029 Time*Concentration 72 2 -0.04990 0.01420 16 -3.51 0.0029

60

The SAS System 14:28 Friday, February 19, 2010

difference from .95

------------------------------------- Enzyme=Sigma Milk=skim -------------------------------------

The Mixed Procedure

Model Information

Data Set WORK.GOOD Dependent Variable zeroed

Covariance Structure Diagonal Estimation Method REML

Residual Variance Method Profile Fixed Effects SE Method Model-Based Degrees of Freedom Method Residual

Class Level Information

Class Levels Values

Time 4 12 24 48 72 Concentration 4 0.5 1 1.5 2

Dimensions

Covariance Parameters 1 Columns in X 25 Columns in Z 0 Subjects 1 Max Obs Per Subject 32

Number of Observations

Number of Observations Read 32 Number of Observations Used 32 Number of Observations Not Used 0

Covariance Parameter Estimates

Cov Parm Estimate

Residual 0.000140

Fit Statistics

-2 Res Log Likelihood -85.5 AIC (smaller is better) -83.5 AICC (smaller is better) -83.2

61

The SAS System 14:28 Friday, February 19, 2010

difference from .95

------------------------------------- Enzyme=Sigma Milk=skim -------------------------------------

The Mixed Procedure

Fit Statistics

BIC (smaller is better) -82.7

Type 3 Tests of Fixed Effects

Num Den Effect DF DF F Value Pr > F

Time 3 16 1337.92 <.0001 Concentration 3 16 925.49 <.0001 Time*Concentration 9 16 62.39 <.0001

Least Squares Means

Standard Effect Time Concentration Estimate Error DF t Value Pr > |t|

Time*Concentration 12 0.5 0.5782 0.008363 16 69.13 <.0001 Time*Concentration 12 1 0.3434 0.008363 16 41.06 <.0001 Time*Concentration 12 1.5 0.2109 0.008363 16 25.22 <.0001 Time*Concentration 12 2 0.1423 0.008363 16 17.01 <.0001 Time*Concentration 24 0.5 0.3717 0.008363 16 44.44 <.0001 Time*Concentration 24 1 0.1211 0.008363 16 14.48 <.0001 Time*Concentration 24 1.5 0.04465 0.008363 16 5.34 <.0001 Time*Concentration 24 2 -0.00490 0.008363 16 -0.59 0.5661 Time*Concentration 48 0.5 0.1626 0.008363 16 19.45 <.0001 Time*Concentration 48 1 -0.01255 0.008363 16 -1.50 0.1529 Time*Concentration 48 1.5 -0.04365 0.008363 16 -5.22 <.0001 Time*Concentration 48 2 -0.04990 0.008363 16 -5.97 <.0001 Time*Concentration 72 0.5 0.06020 0.008363 16 7.20 <.0001 Time*Concentration 72 1 -0.04075 0.008363 16 -4.87 0.0002 Time*Concentration 72 1.5 -0.04990 0.008363 16 -5.97 <.0001 Time*Concentration 72 2 -0.04990 0.008363 16 -5.97 <.0001

62

The SAS System 14:28 Friday, February 19, 2010

difference from .95

------------------------------------ Enzyme=Sigma Milk=whole -------------------------------------

The Mixed Procedure

Model Information

Data Set WORK.GOOD Dependent Variable zeroed

Covariance Structure Diagonal Estimation Method REML

Residual Variance Method Profile Fixed Effects SE Method Model-Based Degrees of Freedom Method Residual

Class Level Information

Class Levels Values

Time 4 12 24 48 72 Concentration 4 0.5 1 1.5 2

Dimensions

Covariance Parameters 1 Columns in X 25 Columns in Z 0 Subjects 1 Max Obs Per Subject 32

Number of Observations

Number of Observations Read 32 Number of Observations Used 32 Number of Observations Not Used 0

Covariance Parameter Estimates

Cov Parm Estimate

Residual 0.000279

Fit Statistics

-2 Res Log Likelihood -74.4 AIC (smaller is better) -72.4 AICC (smaller is better) -72.1

The SAS System

14:28 Friday, February 19, 2010 difference from .95

------------------------------------ Enzyme=Sigma Milk=whole -------------------------------------

The Mixed Procedure

Fit Statistics

63

BIC (smaller is better) -71.7

Type 3 Tests of Fixed Effects

Num Den Effect DF DF F Value Pr > F

Time 3 16 569.37 <.0001 Concentration 3 16 404.76 <.0001 Time*Concentration 9 16 28.73 <.0001

Least Squares Means

Standard Effect Time Concentration Estimate Error DF t Value Pr > |t|

Time*Concentration 12 0.5 0.5282 0.01182 16 44.69 <.0001 Time*Concentration 12 1 0.3234 0.01182 16 27.37 <.0001 Time*Concentration 12 1.5 0.1894 0.01182 16 16.03 <.0001 Time*Concentration 12 2 0.1175 0.01182 16 9.95 <.0001 Time*Concentration 24 0.5 0.3403 0.01182 16 28.80 <.0001 Time*Concentration 24 1 0.09850 0.01182 16 8.33 <.0001 Time*Concentration 24 1.5 0.01750 0.01182 16 1.48 0.1581 Time*Concentration 24 2 -0.01495 0.01182 16 -1.27 0.2240 Time*Concentration 48 0.5 0.1269 0.01182 16 10.74 <.0001 Time*Concentration 48 1 -0.02380 0.01182 16 -2.01 0.0612 Time*Concentration 48 1.5 -0.04700 0.01182 16 -3.98 0.0011 Time*Concentration 48 2 -0.04990 0.01182 16 -4.22 0.0006 Time*Concentration 72 0.5 0.06495 0.01182 16 5.50 <.0001 Time*Concentration 72 1 -0.03745 0.01182 16 -3.17 0.0060 Time*Concentration 72 1.5 -0.04990 0.01182 16 -4.22 0.0006 Time*Concentration 72 2 -0.04990 0.01182 16 -4.22 0.0006

64

The SAS System 14:28 Friday, February 19, 2010

difference from .95

------------------------------------ Enzyme=Validase Milk=raw ------------------------------------

The Mixed Procedure

Model Information

Data Set WORK.GOOD Dependent Variable zeroed

Covariance Structure Diagonal Estimation Method REML

Residual Variance Method Profile Fixed Effects SE Method Model-Based Degrees of Freedom Method Residual

Class Level Information

Class Levels Values

Time 4 12 24 48 72 Concentration 4 0.25 0.5 0.75 1

Dimensions

Covariance Parameters 1 Columns in X 25 Columns in Z 0 Subjects 1 Max Obs Per Subject 32

Number of Observations

Number of Observations Read 32 Number of Observations Used 32 Number of Observations Not Used 0

Covariance Parameter Estimates

Cov Parm Estimate

Residual 0.001208

Fit Statistics

-2 Res Log Likelihood -51.0 AIC (smaller is better) -49.0 AICC (smaller is better) -48.7

65

The SAS System 14:28 Friday, February 19, 2010

difference from .95

------------------------------------ Enzyme=Validase Milk=raw ------------------------------------

The Mixed Procedure

Fit Statistics

BIC (smaller is better) -48.2

Type 3 Tests of Fixed Effects

Num Den Effect DF DF F Value Pr > F

Time 3 16 96.62 <.0001 Concentration 3 16 65.68 <.0001 Time*Concentration 9 16 8.52 0.0001

Least Squares Means

Standard Effect Time Concentration Estimate Error DF t Value Pr > |t|

Time*Concentration 12 0.25 0.4634 0.02458 16 18.86 <.0001 Time*Concentration 12 0.5 0.2838 0.02458 16 11.55 <.0001 Time*Concentration 12 0.75 0.1366 0.02458 16 5.56 <.0001 Time*Concentration 12 1 0.04965 0.02458 16 2.02 0.0604 Time*Concentration 24 0.25 0.2522 0.02458 16 10.26 <.0001 Time*Concentration 24 0.5 0.02915 0.02458 16 1.19 0.2529 Time*Concentration 24 0.75 -0.01165 0.02458 16 -0.47 0.6419 Time*Concentration 24 1 -0.03890 0.02458 16 -1.58 0.1330 Time*Concentration 48 0.25 0.07410 0.02458 16 3.02 0.0082 Time*Concentration 48 0.5 -0.03905 0.02458 16 -1.59 0.1316 Time*Concentration 48 0.75 -0.04185 0.02458 16 -1.70 0.1079 Time*Concentration 48 1 -0.04990 0.02458 16 -2.03 0.0593 Time*Concentration 72 0.25 0.02045 0.02458 16 0.83 0.4176 Time*Concentration 72 0.5 -0.04335 0.02458 16 -1.76 0.0968 Time*Concentration 72 0.75 -0.04990 0.02458 16 -2.03 0.0593 Time*Concentration 72 1 -0.04990 0.02458 16 -2.03 0.0593

66

The SAS System 14:28 Friday, February 19, 2010

difference from .95

----------------------------------- Enzyme=Validase Milk=skim ------------------------------------

The Mixed Procedure

Model Information

Data Set WORK.GOOD Dependent Variable zeroed

Covariance Structure Diagonal Estimation Method REML

Residual Variance Method Profile Fixed Effects SE Method Model-Based Degrees of Freedom Method Residual

Class Level Information

Class Levels Values

Time 4 12 24 48 72 Concentration 4 0.25 0.5 0.75 1

Dimensions

Covariance Parameters 1 Columns in X 25 Columns in Z 0 Subjects 1 Max Obs Per Subject 32

Number of Observations

Number of Observations Read 32 Number of Observations Used 32 Number of Observations Not Used 0

Covariance Parameter Estimates

Cov Parm Estimate

Residual 0.002023

Fit Statistics

-2 Res Log Likelihood -42.8 AIC (smaller is better) -40.8 AICC (smaller is better) -40.5

67

The SAS System 14:28 Friday, February 19, 2010

difference from .95

----------------------------------- Enzyme=Validase Milk=skim ------------------------------------

The Mixed Procedure

Fit Statistics

BIC (smaller is better) -40.0

Type 3 Tests of Fixed Effects

Num Den Effect DF DF F Value Pr > F

Time 3 16 85.25 <.0001 Concentration 3 16 49.53 <.0001 Time*Concentration 9 16 5.99 0.0010

Least Squares Means

Standard Effect Time Concentration Estimate Error DF t Value Pr > |t|

Time*Concentration 12 0.25 0.5717 0.03180 16 17.98 <.0001 Time*Concentration 12 0.5 0.3146 0.03180 16 9.89 <.0001 Time*Concentration 12 0.75 0.2032 0.03180 16 6.39 <.0001 Time*Concentration 12 1 0.08200 0.03180 16 2.58 0.0202 Time*Concentration 24 0.25 0.2678 0.03180 16 8.42 <.0001 Time*Concentration 24 0.5 0.07215 0.03180 16 2.27 0.0375 Time*Concentration 24 0.75 0.004200 0.03180 16 0.13 0.8966 Time*Concentration 24 1 -0.03230 0.03180 16 -1.02 0.3249 Time*Concentration 48 0.25 0.1055 0.03180 16 3.32 0.0043 Time*Concentration 48 0.5 -0.02670 0.03180 16 -0.84 0.4135 Time*Concentration 48 0.75 -0.04440 0.03180 16 -1.40 0.1817 Time*Concentration 48 1 -0.04990 0.03180 16 -1.57 0.1362 Time*Concentration 72 0.25 0.02485 0.03180 16 0.78 0.4460 Time*Concentration 72 0.5 -0.04990 0.03180 16 -1.57 0.1362 Time*Concentration 72 0.75 -0.04990 0.03180 16 -1.57 0.1362 Time*Concentration 72 1 -0.04990 0.03180 16 -1.57 0.1362

68

The SAS System 14:28 Friday, February 19, 2010

difference from .95

----------------------------------- Enzyme=Validase Milk=whole -----------------------------------

The Mixed Procedure

Model Information

Data Set WORK.GOOD Dependent Variable zeroed

Covariance Structure Diagonal Estimation Method REML

Residual Variance Method Profile Fixed Effects SE Method Model-Based Degrees of Freedom Method Residual

Class Level Information

Class Levels Values

Time 4 12 24 48 72 Concentration 4 0.25 0.5 0.75 1

Dimensions

Covariance Parameters 1 Columns in X 25 Columns in Z 0 Subjects 1 Max Obs Per Subject 32

Number of Observations

Number of Observations Read 32 Number of Observations Used 32 Number of Observations Not Used 0

Covariance Parameter Estimates

Cov Parm Estimate

Residual 0.002475

Fit Statistics

-2 Res Log Likelihood -39.5 AIC (smaller is better) -37.5 AICC (smaller is better) -37.2

The SAS System

14:28 Friday, February 19, 2010 difference from .95

----------------------------------- Enzyme=Validase Milk=whole -----------------------------------

The Mixed Procedure

Fit Statistics

69

BIC (smaller is better) -36.8

Type 3 Tests of Fixed Effects

Num Den Effect DF DF F Value Pr > F

Time 3 16 24.97 <.0001 Concentration 3 16 34.38 <.0001 Time*Concentration 9 16 2.58 0.0473

Least Squares Means

Standard Effect Time Concentration Estimate Error DF t Value Pr > |t|

Time*Concentration 12 0.25 0.3265 0.03518 16 9.28 <.0001 Time*Concentration 12 0.5 0.2315 0.03518 16 6.58 <.0001 Time*Concentration 12 0.75 0.1103 0.03518 16 3.14 0.0064 Time*Concentration 12 1 0.01455 0.03518 16 0.41 0.6846 Time*Concentration 24 0.25 0.3068 0.03518 16 8.72 <.0001 Time*Concentration 24 0.5 0.08165 0.03518 16 2.32 0.0338 Time*Concentration 24 0.75 -0.00110 0.03518 16 -0.03 0.9754 Time*Concentration 24 1 -0.03650 0.03518 16 -1.04 0.3149 Time*Concentration 48 0.25 0.1227 0.03518 16 3.49 0.0030 Time*Concentration 48 0.5 -0.03245 0.03518 16 -0.92 0.3700 Time*Concentration 48 0.75 -0.04990 0.03518 16 -1.42 0.1752 Time*Concentration 48 1 -0.04990 0.03518 16 -1.42 0.1752 Time*Concentration 72 0.25 0.05750 0.03518 16 1.63 0.1216 Time*Concentration 72 0.5 -0.03955 0.03518 16 -1.12 0.2775 Time*Concentration 72 0.75 -0.04440 0.03518 16 -1.26 0.2250 Time*Concentration 72 1 -0.04990 0.03518 16 -1.42 0.1752

70

The SAS System 14:28 Friday, February 19, 2010

difference from .98

------------------------------------ Enzyme=Dansico Milk=raw -------------------------------------

The Mixed Procedure

Model Information

Data Set WORK.GOOD Dependent Variable zeroed

Covariance Structure Diagonal Estimation Method REML

Residual Variance Method Profile Fixed Effects SE Method Model-Based Degrees of Freedom Method Residual

Class Level Information

Class Levels Values

Time 4 12 24 48 72 Concentration 4 0.25 0.5 0.75 1

Dimensions

Covariance Parameters 1 Columns in X 25 Columns in Z 0 Subjects 1 Max Obs Per Subject 32

Number of Observations

Number of Observations Read 32 Number of Observations Used 32 Number of Observations Not Used 0

Covariance Parameter

Estimates

Cov Parm Estimate

Residual 0.000153

Fit Statistics

-2 Res Log Likelihood -84.0 AIC (smaller is better) -82.0 AICC (smaller is better) -81.8

71

The SAS System 14:28 Friday, February 19, 2010

difference from .98

------------------------------------ Enzyme=Dansico Milk=raw -------------------------------------

The Mixed Procedure

Fit Statistics

BIC (smaller is better) -81.3

Type 3 Tests of Fixed Effects

Num Den Effect DF DF F Value Pr > F

Time 3 16 554.23 <.0001 Concentration 3 16 358.67 <.0001 Time*Concentration 9 16 71.37 <.0001

Least Squares Means

Standard Effect Time Concentration Estimate Error DF t Value Pr > |t|

Time*Concentration 12 0.25 0.4495 0.008751 16 51.36 <.0001 Time*Concentration 12 0.5 0.2419 0.008751 16 27.64 <.0001 Time*Concentration 12 0.75 0.1094 0.008751 16 12.50 <.0001 Time*Concentration 12 1 0.05315 0.008751 16 6.07 <.0001 Time*Concentration 24 0.25 0.2257 0.008751 16 25.78 <.0001 Time*Concentration 24 0.5 0.07050 0.008751 16 8.06 <.0001 Time*Concentration 24 0.75 0.01945 0.008751 16 2.22 0.0410 Time*Concentration 24 1 -0.01090 0.008751 16 -1.25 0.2309 Time*Concentration 48 0.25 0.06500 0.008751 16 7.43 <.0001 Time*Concentration 48 0.5 -0.00440 0.008751 16 -0.50 0.6220 Time*Concentration 48 0.75 -0.01990 0.008751 16 -2.27 0.0371 Time*Concentration 48 1 -0.01990 0.008751 16 -2.27 0.0371 Time*Concentration 72 0.25 0.004700 0.008751 16 0.54 0.5986 Time*Concentration 72 0.5 -0.01990 0.008751 16 -2.27 0.0371 Time*Concentration 72 0.75 -0.01990 0.008751 16 -2.27 0.0371 Time*Concentration 72 1 -0.01990 0.008751 16 -2.27 0.0371

72

The SAS System 14:28 Friday, February 19, 2010

difference from .98

------------------------------------ Enzyme=Dansico Milk=skim ------------------------------------

The Mixed Procedure

Model Information

Data Set WORK.GOOD Dependent Variable zeroed

Covariance Structure Diagonal Estimation Method REML

Residual Variance Method Profile Fixed Effects SE Method Model-Based Degrees of Freedom Method Residual

Class Level Information

Class Levels Values

Time 4 12 24 48 72 Concentration 4 0.25 0.5 0.75 1

Dimensions

Covariance Parameters 1 Columns in X 25 Columns in Z 0 Subjects 1 Max Obs Per Subject 32

Number of Observations

Number of Observations Read 32 Number of Observations Used 32 Number of Observations Not Used 0

Covariance Parameter Estimates

Cov Parm Estimate

Residual 0.000422

Fit Statistics

-2 Res Log Likelihood -67.8 AIC (smaller is better) -65.8 AICC (smaller is better) -65.6

The SAS System

14:28 Friday, February 19, 2010 difference from .98

------------------------------------ Enzyme=Dansico Milk=skim ------------------------------------

The Mixed Procedure

Fit Statistics

73

BIC (smaller is better) -65.1

Type 3 Tests of Fixed Effects

Num Den Effect DF DF F Value Pr > F

Time 3 16 263.96 <.0001 Concentration 3 16 321.14 <.0001 Time*Concentration 9 16 39.40 <.0001

Least Squares Means

Standard Effect Time Concentration Estimate Error DF t Value Pr > |t|

Time*Concentration 12 0.25 0.6026 0.01452 16 41.50 <.0001 Time*Concentration 12 0.5 0.2482 0.01452 16 17.10 <.0001 Time*Concentration 12 0.75 0.1333 0.01452 16 9.18 <.0001 Time*Concentration 12 1 0.05560 0.01452 16 3.83 0.0015 Time*Concentration 24 0.25 0.3533 0.01452 16 24.33 <.0001 Time*Concentration 24 0.5 0.1069 0.01452 16 7.36 <.0001 Time*Concentration 24 0.75 0.03730 0.01452 16 2.57 0.0206 Time*Concentration 24 1 -0.00540 0.01452 16 -0.37 0.7148 Time*Concentration 48 0.25 0.1509 0.01452 16 10.39 <.0001 Time*Concentration 48 0.5 -0.00870 0.01452 16 -0.60 0.5574 Time*Concentration 48 0.75 -0.01990 0.01452 16 -1.37 0.1894 Time*Concentration 48 1 -0.01990 0.01452 16 -1.37 0.1894 Time*Concentration 72 0.25 0.05690 0.01452 16 3.92 0.0012 Time*Concentration 72 0.5 -0.01925 0.01452 16 -1.33 0.2035 Time*Concentration 72 0.75 -0.01990 0.01452 16 -1.37 0.1894 Time*Concentration 72 1 -0.01990 0.01452 16 -1.37 0.1894

74

The SAS System 14:28 Friday, February 19, 2010 difference from .98

----------------------------------- Enzyme=Dansico Milk=whole ------------------------------------

The Mixed Procedure

Model Information

Data Set WORK.GOOD Dependent Variable zeroed

Covariance Structure Diagonal Estimation Method REML

Residual Variance Method Profile Fixed Effects SE Method Model-Based Degrees of Freedom Method Residual

Class Level Information

Class Levels Values

Time 4 12 24 48 72 Concentration 4 0.25 0.5 0.75 1

Dimensions

Covariance Parameters 1 Columns in X 25 Columns in Z 0 Subjects 1 Max Obs Per Subject 32

Number of Observations

Number of Observations Read 32 Number of Observations Used 32 Number of Observations Not Used 0

Covariance Parameter Estimates

Cov Parm Estimate

Residual 0.001516

Fit Statistics

-2 Res Log Likelihood -47.4 AIC (smaller is better) -45.4 AICC (smaller is better) -45.1

75

The SAS System 14:28 Friday, February 19, 2010

difference from .98

----------------------------------- Enzyme=Dansico Milk=whole ------------------------------------

The Mixed Procedure

Fit Statistics

BIC (smaller is better) -44.6

Type 3 Tests of Fixed Effects

Num Den Effect DF DF F Value Pr > F

Time 3 16 41.32 <.0001 Concentration 3 16 28.32 <.0001 Time*Concentration 9 16 5.21 0.0021

Least Squares Means

Standard Effect Time Concentration Estimate Error DF t Value Pr > |t|

Time*Concentration 12 0.25 0.3896 0.02753 16 14.15 <.0001 Time*Concentration 12 0.5 0.1892 0.02753 16 6.87 <.0001 Time*Concentration 12 0.75 0.1045 0.02753 16 3.80 0.0016 Time*Concentration 12 1 0.04785 0.02753 16 1.74 0.1014 Time*Concentration 24 0.25 0.2080 0.02753 16 7.56 <.0001 Time*Concentration 24 0.5 0.08135 0.02753 16 2.96 0.0093 Time*Concentration 24 0.75 0.01175 0.02753 16 0.43 0.6752 Time*Concentration 24 1 -0.01100 0.02753 16 -0.40 0.6947 Time*Concentration 48 0.25 0.04840 0.02753 16 1.76 0.0978 Time*Concentration 48 0.5 -0.00350 0.02753 16 -0.13 0.9004 Time*Concentration 48 0.75 -0.01990 0.02753 16 -0.72 0.4802 Time*Concentration 48 1 -0.01990 0.02753 16 -0.72 0.4802 Time*Concentration 72 0.25 0.01000 0.02753 16 0.36 0.7212 Time*Concentration 72 0.5 -0.01185 0.02753 16 -0.43 0.6726 Time*Concentration 72 0.75 -0.01585 0.02753 16 -0.58 0.5728 Time*Concentration 72 1 -0.01990 0.02753 16 -0.72 0.4802

76

The SAS System 14:28 Friday, February 19, 2010

difference from .98

------------------------------------- Enzyme=Enzeco Milk=raw -------------------------------------

The Mixed Procedure

Model Information

Data Set WORK.GOOD Dependent Variable zeroed Covariance Structure Diagonal Estimation Method REML

Residual Variance Method Profile Fixed Effects SE Method Model-Based Degrees of Freedom Method Residual

Class Level Information

Class Levels Values

Time 4 12 24 48 72 Concentration 4 0.5 1 1.5 2

Dimensions

Covariance Parameters 1 Columns in X 25 Columns in Z 0 Subjects 1 Max Obs Per Subject 32

Number of Observations

Number of Observations Read 32 Number of Observations Used 32 Number of Observations Not Used 0

Covariance Parameter Estimates

Cov Parm Estimate

Residual 0.001696

Fit Statistics

-2 Res Log Likelihood -45.6 AIC (smaller is better) -43.6 AICC (smaller is better) -43.3

The SAS System

14:28 Friday, February 19, 2010 difference from .98

------------------------------------- Enzyme=Enzeco Milk=raw -------------------------------------

The Mixed Procedure

Fit Statistics

77

BIC (smaller is better) -42.8

Type 3 Tests of Fixed Effects

Num Den Effect DF DF F Value Pr > F

Time 3 16 96.09 <.0001 Concentration 3 16 53.64 <.0001 Time*Concentration 9 16 4.80 0.0032

Least Squares Means

Standard Effect Time Concentration Estimate Error DF t Value Pr > |t|

Time*Concentration 12 0.5 0.5555 0.02912 16 19.08 <.0001 Time*Concentration 12 1 0.3419 0.02912 16 11.74 <.0001 Time*Concentration 12 1.5 0.2616 0.02912 16 8.98 <.0001 Time*Concentration 12 2 0.1237 0.02912 16 4.25 0.0006 Time*Concentration 24 0.5 0.3198 0.02912 16 10.98 <.0001 Time*Concentration 24 1 0.1407 0.02912 16 4.83 0.0002 Time*Concentration 24 1.5 0.1154 0.02912 16 3.96 0.0011 Time*Concentration 24 2 0.008100 0.02912 16 0.28 0.7845 Time*Concentration 48 0.5 0.1581 0.02912 16 5.43 <.0001 Time*Concentration 48 1 0.01490 0.02912 16 0.51 0.6159 Time*Concentration 48 1.5 0.000350 0.02912 16 0.01 0.9906 Time*Concentration 48 2 -0.01990 0.02912 16 -0.68 0.5042 Time*Concentration 72 0.5 0.06580 0.02912 16 2.26 0.0382 Time*Concentration 72 1 -0.01435 0.02912 16 -0.49 0.6289 Time*Concentration 72 1.5 -0.01990 0.02912 16 -0.68 0.5042 Time*Concentration 72 2 -0.01990 0.02912 16 -0.68 0.5042

78

The SAS System 14:28 Friday, February 19, 2010

difference from .98

------------------------------------ Enzyme=Enzeco Milk=skim -------------------------------------

The Mixed Procedure

Model Information

Data Set WORK.GOOD Dependent Variable zeroed

Covariance Structure Diagonal Estimation Method REML

Residual Variance Method Profile Fixed Effects SE Method Model-Based Degrees of Freedom Method Residual

Class Level Information

Class Levels Values

Time 4 12 24 48 72 Concentration 4 0.5 1 1.5 2

Dimensions

Covariance Parameters 1 Columns in X 25 Columns in Z 0 Subjects 1 Max Obs Per Subject 32

Number of Observations

Number of Observations Read 32 Number of Observations Used 32 Number of Observations Not Used 0

Covariance Parameter Estimates

Cov Parm Estimate

Residual 0.000803

Fit Statistics

-2 Res Log Likelihood -57.5 AIC (smaller is better) -55.5 AICC (smaller is better) -55.3

The SAS System

14:28 Friday, February 19, 2010 difference from .98

------------------------------------ Enzyme=Enzeco Milk=skim -------------------------------------

The Mixed Procedure

Fit Statistics

79

BIC (smaller is better) -54.8

Type 3 Tests of Fixed Effects

Num Den Effect DF DF F Value Pr > F

Time 3 16 242.30 <.0001 Concentration 3 16 163.96 <.0001 Time*Concentration 9 16 17.73 <.0001

Least Squares Means

Standard Effect Time Concentration Estimate Error DF t Value Pr > |t|

Time*Concentration 12 0.5 0.6382 0.02004 16 31.85 <.0001 Time*Concentration 12 1 0.3867 0.02004 16 19.30 <.0001 Time*Concentration 12 1.5 0.2467 0.02004 16 12.31 <.0001 Time*Concentration 12 2 0.1231 0.02004 16 6.14 <.0001 Time*Concentration 24 0.5 0.3874 0.02004 16 19.33 <.0001 Time*Concentration 24 1 0.1107 0.02004 16 5.53 <.0001 Time*Concentration 24 1.5 0.05475 0.02004 16 2.73 0.0148 Time*Concentration 24 2 0.007250 0.02004 16 0.36 0.7222 Time*Concentration 48 0.5 0.1657 0.02004 16 8.27 <.0001 Time*Concentration 48 1 0.01135 0.02004 16 0.57 0.5790 Time*Concentration 48 1.5 -0.00955 0.02004 16 -0.48 0.6401 Time*Concentration 48 2 -0.01990 0.02004 16 -0.99 0.3354 Time*Concentration 72 0.5 0.06595 0.02004 16 3.29 0.0046 Time*Concentration 72 1 -0.01845 0.02004 16 -0.92 0.3709 Time*Concentration 72 1.5 -0.01990 0.02004 16 -0.99 0.3354 Time*Concentration 72 2 -0.01990 0.02004 16 -0.99 0.3354

80

The SAS System 14:28 Friday, February 19, 2010

difference from .98

------------------------------------ Enzyme=Enzeco Milk=whole ------------------------------------

The Mixed Procedure

Model Information

Data Set WORK.GOOD Dependent Variable zeroed

Covariance Structure Diagonal Estimation Method REML

Residual Variance Method Profile Fixed Effects SE Method Model-Based Degrees of Freedom Method Residual

Class Level Information

Class Levels Values

Time 4 12 24 48 72 Concentration 4 0.5 1 1.5 2

Dimensions

Covariance Parameters 1 Columns in X 25 Columns in Z 0 Subjects 1 Max Obs Per Subject 32

Number of Observations

Number of Observations Read 32 Number of Observations Used 32 Number of Observations Not Used 0

Covariance Parameter Estimates

Cov Parm Estimate

Residual 0.000652

Fit Statistics

-2 Res Log Likelihood -60.9 AIC (smaller is better) -58.9 AICC (smaller is better) -58.6

The SAS System

14:28 Friday, February 19, 2010 difference from .98

------------------------------------ Enzyme=Enzeco Milk=whole ------------------------------------

The Mixed Procedure

Fit Statistics

81

BIC (smaller is better) -58.1

Type 3 Tests of Fixed Effects

Num Den Effect DF DF F Value Pr > F

Time 3 16 195.40 <.0001 Concentration 3 16 133.68 <.0001 Time*Concentration 9 16 13.28 <.0001

Least Squares Means

Standard Effect Time Concentration Estimate Error DF t Value Pr > |t|

Time*Concentration 12 0.5 0.4999 0.01805 16 27.69 <.0001 Time*Concentration 12 1 0.3427 0.01805 16 18.98 <.0001 Time*Concentration 12 1.5 0.1769 0.01805 16 9.80 <.0001 Time*Concentration 12 2 0.1175 0.01805 16 6.51 <.0001 Time*Concentration 24 0.5 0.3307 0.01805 16 18.32 <.0001 Time*Concentration 24 1 0.1316 0.01805 16 7.29 <.0001 Time*Concentration 24 1.5 0.04755 0.01805 16 2.63 0.0181 Time*Concentration 24 2 0.005150 0.01805 16 0.29 0.7791 Time*Concentration 48 0.5 0.1238 0.01805 16 6.86 <.0001 Time*Concentration 48 1 0.01370 0.01805 16 0.76 0.4590 Time*Concentration 48 1.5 -0.01210 0.01805 16 -0.67 0.5123 Time*Concentration 48 2 -0.01990 0.01805 16 -1.10 0.2866 Time*Concentration 72 0.5 0.06615 0.01805 16 3.66 0.0021 Time*Concentration 72 1 0.001400 0.01805 16 0.08 0.9391 Time*Concentration 72 1.5 -0.00930 0.01805 16 -0.52 0.6135 Time*Concentration 72 2 -0.01990 0.01805 16 -1.10 0.2866

82

The SAS System 14:28 Friday, February 19, 2010

difference from .98

------------------------------------- Enzyme=Sigma Milk=raw --------------------------------------

The Mixed Procedure

Model Information

Data Set WORK.GOOD Dependent Variable zeroed

Covariance Structure Diagonal Estimation Method REML

Residual Variance Method Profile Fixed Effects SE Method Model-Based Degrees of Freedom Method Residual

Class Level Information

Class Levels Values

Time 4 12 24 48 72 Concentration 4 0.5 1 1.5 2

Dimensions

Covariance Parameters 1 Columns in X 25 Columns in Z 0 Subjects 1 Max Obs Per Subject 32

Number of Observations

Number of Observations Read 32 Number of Observations Used 32 Number of Observations Not Used 0

Covariance Parameter Estimates

Cov Parm Estimate

Residual 0.000403

Fit Statistics

-2 Res Log Likelihood -68.6 AIC (smaller is better) -66.6 AICC (smaller is better) -66.3

83

The SAS System 14:28 Friday, February 19, 2010

difference from .98

------------------------------------- Enzyme=Sigma Milk=raw --------------------------------------

The Mixed Procedure

Fit Statistics

BIC (smaller is better) -65.8

Type 3 Tests of Fixed Effects

Num Den Effect DF DF F Value Pr > F

Time 3 16 436.09 <.0001 Concentration 3 16 333.80 <.0001 Time*Concentration 9 16 20.93 <.0001

Least Squares Means

Standard Effect Time Concentration Estimate Error DF t Value Pr > |t|

Time*Concentration 12 0.5 0.5852 0.01420 16 41.21 <.0001 Time*Concentration 12 1 0.3725 0.01420 16 26.23 <.0001 Time*Concentration 12 1.5 0.2563 0.01420 16 18.05 <.0001 Time*Concentration 12 2 0.1492 0.01420 16 10.50 <.0001 Time*Concentration 24 0.5 0.4204 0.01420 16 29.61 <.0001 Time*Concentration 24 1 0.1718 0.01420 16 12.10 <.0001 Time*Concentration 24 1.5 0.07965 0.01420 16 5.61 <.0001 Time*Concentration 24 2 0.02320 0.01420 16 1.63 0.1218 Time*Concentration 48 0.5 0.2018 0.01420 16 14.21 <.0001 Time*Concentration 48 1 0.02480 0.01420 16 1.75 0.0999 Time*Concentration 48 1.5 -0.01265 0.01420 16 -0.89 0.3862 Time*Concentration 48 2 -0.01990 0.01420 16 -1.40 0.1802 Time*Concentration 72 0.5 0.1010 0.01420 16 7.11 <.0001 Time*Concentration 72 1 -0.00995 0.01420 16 -0.70 0.4935 Time*Concentration 72 1.5 -0.01990 0.01420 16 -1.40 0.1802 Time*Concentration 72 2 -0.01990 0.01420 16 -1.40 0.1802

84

The SAS System 14:28 Friday, February 19, 2010

difference from .98

------------------------------------- Enzyme=Sigma Milk=skim -------------------------------------

The Mixed Procedure

Model Information

Data Set WORK.GOOD Dependent Variable zeroed

Covariance Structure Diagonal Estimation Method REML

Residual Variance Method Profile Fixed Effects SE Method Model-Based Degrees of Freedom Method Residual

Class Level Information

Class Levels Values

Time 4 12 24 48 72 Concentration 4 0.5 1 1.5 2

Dimensions

Covariance Parameters 1 Columns in X 25 Columns in Z 0 Subjects 1 Max Obs Per Subject 32

Number of Observations

Number of Observations Read 32 Number of Observations Used 32 Number of Observations Not Used 0

Covariance Parameter Estimates

Cov Parm Estimate

Residual 0.000140

Fit Statistics

-2 Res Log Likelihood -85.5 AIC (smaller is better) -83.5 AICC (smaller is better) -83.2

85

The SAS System 14:28 Friday, February 19, 2010

difference from .98

------------------------------------- Enzyme=Sigma Milk=skim -------------------------------------

The Mixed Procedure

Fit Statistics

BIC (smaller is better) -82.7

Type 3 Tests of Fixed Effects

Num Den Effect DF DF F Value Pr > F

Time 3 16 1337.92 <.0001 Concentration 3 16 925.49 <.0001 Time*Concentration 9 16 62.39 <.0001

Least Squares Means

Standard Effect Time Concentration Estimate Error DF t Value Pr > |t|

Time*Concentration 12 0.5 0.6082 0.008363 16 72.72 <.0001 Time*Concentration 12 1 0.3734 0.008363 16 44.64 <.0001 Time*Concentration 12 1.5 0.2409 0.008363 16 28.81 <.0001 Time*Concentration 12 2 0.1723 0.008363 16 20.60 <.0001 Time*Concentration 24 0.5 0.4017 0.008363 16 48.03 <.0001 Time*Concentration 24 1 0.1511 0.008363 16 18.07 <.0001 Time*Concentration 24 1.5 0.07465 0.008363 16 8.93 <.0001 Time*Concentration 24 2 0.02510 0.008363 16 3.00 0.0085 Time*Concentration 48 0.5 0.1927 0.008363 16 23.04 <.0001 Time*Concentration 48 1 0.01745 0.008363 16 2.09 0.0533 Time*Concentration 48 1.5 -0.01365 0.008363 16 -1.63 0.1222 Time*Concentration 48 2 -0.01990 0.008363 16 -2.38 0.0301 Time*Concentration 72 0.5 0.09020 0.008363 16 10.79 <.0001 Time*Concentration 72 1 -0.01075 0.008363 16 -1.29 0.2169 Time*Concentration 72 1.5 -0.01990 0.008363 16 -2.38 0.0301 Time*Concentration 72 2 -0.01990 0.008363 16 -2.38 0.0301

86

The SAS System 14:28 Friday, February 19, 2010

difference from .98

------------------------------------ Enzyme=Sigma Milk=whole -------------------------------------

The Mixed Procedure

Model Information

Data Set WORK.GOOD Dependent Variable zeroed

Covariance Structure Diagonal Estimation Method REML

Residual Variance Method Profile Fixed Effects SE Method Model-Based Degrees of Freedom Method Residual

Class Level Information

Class Levels Values

Time 4 12 24 48 72 Concentration 4 0.5 1 1.5 2

Dimensions

Covariance Parameters 1 Columns in X 25 Columns in Z 0 Subjects 1 Max Obs Per Subject 32

Number of Observations

Number of Observations Read 32 Number of Observations Used 32 Number of Observations Not Used 0

Covariance Parameter Estimates

Cov Parm Estimate

Residual 0.000279

Fit Statistics

-2 Res Log Likelihood -74.4 AIC (smaller is better) -72.4 AICC (smaller is better) -72.1

87

The SAS System 14:28 Friday, February 19, 2010

difference from .98

------------------------------------ Enzyme=Sigma Milk=whole -------------------------------------

The Mixed Procedure

Fit Statistics

BIC (smaller is better) -71.7

Type 3 Tests of Fixed Effects

Num Den Effect DF DF F Value Pr > F

Time 3 16 569.37 <.0001 Concentration 3 16 404.76 <.0001 Time*Concentration 9 16 28.73 <.0001

Least Squares Means

Standard Effect Time Concentration Estimate Error DF t Value Pr > |t|

Time*Concentration 12 0.5 0.5582 0.01182 16 47.23 <.0001 Time*Concentration 12 1 0.3534 0.01182 16 29.90 <.0001 Time*Concentration 12 1.5 0.2194 0.01182 16 18.57 <.0001 Time*Concentration 12 2 0.1476 0.01182 16 12.49 <.0001 Time*Concentration 24 0.5 0.3703 0.01182 16 31.33 <.0001 Time*Concentration 24 1 0.1285 0.01182 16 10.87 <.0001 Time*Concentration 24 1.5 0.04750 0.01182 16 4.02 0.0010 Time*Concentration 24 2 0.01505 0.01182 16 1.27 0.2210 Time*Concentration 48 0.5 0.1569 0.01182 16 13.28 <.0001 Time*Concentration 48 1 0.006200 0.01182 16 0.52 0.6070 Time*Concentration 48 1.5 -0.01700 0.01182 16 -1.44 0.1696 Time*Concentration 48 2 -0.01990 0.01182 16 -1.68 0.1116 Time*Concentration 72 0.5 0.09495 0.01182 16 8.03 <.0001 Time*Concentration 72 1 -0.00745 0.01182 16 -0.63 0.5373 Time*Concentration 72 1.5 -0.01990 0.01182 16 -1.68 0.1116 Time*Concentration 72 2 -0.01990 0.01182 16 -1.68 0.1116

88

The SAS System 14:28 Friday, February 19, 2010

difference from .98

------------------------------------ Enzyme=Validase Milk=raw ------------------------------------

The Mixed Procedure

Model Information

Data Set WORK.GOOD Dependent Variable zeroed

Covariance Structure Diagonal Estimation Method REML

Residual Variance Method Profile Fixed Effects SE Method Model-Based Degrees of Freedom Method Residual

Class Level Information

Class Levels Values

Time 4 12 24 48 72 Concentration 4 0.25 0.5 0.75 1

Dimensions

Covariance Parameters 1 Columns in X 25 Columns in Z 0 Subjects 1 Max Obs Per Subject 32

Number of Observations

Number of Observations Read 32 Number of Observations Used 32 Number of Observations Not Used 0

Covariance Parameter Estimates

Cov Parm Estimate

Residual 0.001208

Fit Statistics

-2 Res Log Likelihood -51.0 AIC (smaller is better) -49.0 AICC (smaller is better) -48.7

The SAS System

14:28 Friday, February 19, 2010 difference from .98

------------------------------------ Enzyme=Validase Milk=raw ------------------------------------

The Mixed Procedure

Fit Statistics

89

BIC (smaller is better) -48.2

Type 3 Tests of Fixed Effects

Num Den Effect DF DF F Value Pr > F

Time 3 16 96.62 <.0001 Concentration 3 16 65.68 <.0001 Time*Concentration 9 16 8.52 0.0001

Least Squares Means

Standard Effect Time Concentration Estimate Error DF t Value Pr > |t|

Time*Concentration 12 0.25 0.4934 0.02458 16 20.08 <.0001 Time*Concentration 12 0.5 0.3138 0.02458 16 12.77 <.0001 Time*Concentration 12 0.75 0.1666 0.02458 16 6.78 <.0001 Time*Concentration 12 1 0.07965 0.02458 16 3.24 0.0051 Time*Concentration 24 0.25 0.2822 0.02458 16 11.48 <.0001 Time*Concentration 24 0.5 0.05915 0.02458 16 2.41 0.0285 Time*Concentration 24 0.75 0.01835 0.02458 16 0.75 0.4661 Time*Concentration 24 1 -0.00890 0.02458 16 -0.36 0.7220 Time*Concentration 48 0.25 0.1041 0.02458 16 4.24 0.0006 Time*Concentration 48 0.5 -0.00905 0.02458 16 -0.37 0.7175 Time*Concentration 48 0.75 -0.01185 0.02458 16 -0.48 0.6362 Time*Concentration 48 1 -0.01990 0.02458 16 -0.81 0.4300 Time*Concentration 72 0.25 0.05045 0.02458 16 2.05 0.0568 Time*Concentration 72 0.5 -0.01335 0.02458 16 -0.54 0.5945 Time*Concentration 72 0.75 -0.01990 0.02458 16 -0.81 0.4300 Time*Concentration 72 1 -0.01990 0.02458 16 -0.81 0.4300

90

The SAS System 14:28 Friday, February 19, 2010

difference from .98

----------------------------------- Enzyme=Validase Milk=skim ------------------------------------

The Mixed Procedure

Model Information

Data Set WORK.GOOD Dependent Variable zeroed

Covariance Structure Diagonal Estimation Method REML

Residual Variance Method Profile Fixed Effects SE Method Model-Based Degrees of Freedom Method Residual

Class Level Information

Class Levels Values

Time 4 12 24 48 72 Concentration 4 0.25 0.5 0.75 1

Dimensions

Covariance Parameters 1 Columns in X 25 Columns in Z 0 Subjects 1 Max Obs Per Subject 32

Number of Observations

Number of Observations Read 32 Number of Observations Used 32 Number of Observations Not Used 0

Covariance Parameter Estimates

Cov Parm Estimate

Residual 0.002023

Fit Statistics

-2 Res Log Likelihood -42.8 AIC (smaller is better) -40.8 AICC (smaller is better) -40.5

91

The SAS System 14:28 Friday, February 19, 2010

difference from .98

----------------------------------- Enzyme=Validase Milk=skim ------------------------------------

The Mixed Procedure

Fit Statistics

BIC (smaller is better) -40.0

Type 3 Tests of Fixed Effects

Num Den Effect DF DF F Value Pr > F

Time 3 16 85.25 <.0001 Concentration 3 16 49.53 <.0001 Time*Concentration 9 16 5.99 0.0010

Least Squares Means

Standard Effect Time Concentration Estimate Error DF t Value Pr > |t|

Time*Concentration 12 0.25 0.6017 0.03180 16 18.92 <.0001 Time*Concentration 12 0.5 0.3447 0.03180 16 10.84 <.0001 Time*Concentration 12 0.75 0.2333 0.03180 16 7.33 <.0001 Time*Concentration 12 1 0.1120 0.03180 16 3.52 0.0028 Time*Concentration 24 0.25 0.2978 0.03180 16 9.36 <.0001 Time*Concentration 24 0.5 0.1021 0.03180 16 3.21 0.0054 Time*Concentration 24 0.75 0.03420 0.03180 16 1.08 0.2981 Time*Concentration 24 1 -0.00230 0.03180 16 -0.07 0.9432 Time*Concentration 48 0.25 0.1355 0.03180 16 4.26 0.0006 Time*Concentration 48 0.5 0.003300 0.03180 16 0.10 0.9186 Time*Concentration 48 0.75 -0.01440 0.03180 16 -0.45 0.6568 Time*Concentration 48 1 -0.01990 0.03180 16 -0.63 0.5403 Time*Concentration 72 0.25 0.05485 0.03180 16 1.72 0.1038 Time*Concentration 72 0.5 -0.01990 0.03180 16 -0.63 0.5403 Time*Concentration 72 0.75 -0.01990 0.03180 16 -0.63 0.5403 Time*Concentration 72 1 -0.01990 0.03180 16 -0.63 0.5403

92

The SAS System 14:28 Friday, February 19, 2010

difference from .98

----------------------------------- Enzyme=Validase Milk=whole -----------------------------------

The Mixed Procedure

Model Information

Data Set WORK.GOOD Dependent Variable zeroed

Covariance Structure Diagonal Estimation Method REML

Residual Variance Method Profile Fixed Effects SE Method Model-Based Degrees of Freedom Method Residual

Class Level Information

Class Levels Values

Time 4 12 24 48 72 Concentration 4 0.25 0.5 0.75 1

Dimensions

Covariance Parameters 1 Columns in X 25 Columns in Z 0 Subjects 1 Max Obs Per Subject 32

Number of Observations

Number of Observations Read 32 Number of Observations Used 32 Number of Observations Not Used 0

Covariance Parameter Estimates

Cov Parm Estimate

Residual 0.002475

Fit Statistics

-2 Res Log Likelihood -39.5 AIC (smaller is better) -37.5 AICC (smaller is better) -37.2

The SAS System

14:28 Friday, February 19, 2010 difference from .98

----------------------------------- Enzyme=Validase Milk=whole -----------------------------------

The Mixed Procedure

Fit Statistics

93

BIC (smaller is better) -36.8

Type 3 Tests of Fixed Effects

Num Den Effect DF DF F Value Pr > F

Time 3 16 24.97 <.0001 Concentration 3 16 34.38 <.0001 Time*Concentration 9 16 2.58 0.0473

Least Squares Means

Standard Effect Time Concentration Estimate Error DF t Value Pr > |t|

Time*Concentration 12 0.25 0.3565 0.03518 16 10.13 <.0001 Time*Concentration 12 0.5 0.2615 0.03518 16 7.43 <.0001 Time*Concentration 12 0.75 0.1403 0.03518 16 3.99 0.0011 Time*Concentration 12 1 0.04455 0.03518 16 1.27 0.2235 Time*Concentration 24 0.25 0.3369 0.03518 16 9.58 <.0001 Time*Concentration 24 0.5 0.1116 0.03518 16 3.17 0.0059 Time*Concentration 24 0.75 0.02890 0.03518 16 0.82 0.4234 Time*Concentration 24 1 -0.00650 0.03518 16 -0.18 0.8557 Time*Concentration 48 0.25 0.1527 0.03518 16 4.34 0.0005 Time*Concentration 48 0.5 -0.00245 0.03518 16 -0.07 0.9453 Time*Concentration 48 0.75 -0.01990 0.03518 16 -0.57 0.5794 Time*Concentration 48 1 -0.01990 0.03518 16 -0.57 0.5794 Time*Concentration 72 0.25 0.08750 0.03518 16 2.49 0.0243 Time*Concentration 72 0.5 -0.00955 0.03518 16 -0.27 0.7895 Time*Concentration 72 0.75 -0.01440 0.03518 16 -0.41 0.6877 Time*Concentration 72 1 -0.01990 0.03518 16 -0.57 0.5794

94

The SAS System 14:28 Friday, February 19, 2010

difference from .99

------------------------------------ Enzyme=Dansico Milk=raw -------------------------------------

The Mixed Procedure

Model Information

Data Set WORK.GOOD Dependent Variable zeroed

Covariance Structure Diagonal Estimation Method REML

Residual Variance Method Profile Fixed Effects SE Method Model-Based Degrees of Freedom Method Residual

Class Level Information

Class Levels Values

Time 4 12 24 48 72 Concentration 4 0.25 0.5 0.75 1

Dimensions

Covariance Parameters 1 Columns in X 25 Columns in Z 0 Subjects 1 Max Obs Per Subject 32

Number of Observations

Number of Observations Read 32 Number of Observations Used 32 Number of Observations Not Used 0

Covariance Parameter Estimates

Cov Parm Estimate

Residual 0.000153

Fit Statistics

-2 Res Log Likelihood -84.0 AIC (smaller is better) -82.0 AICC (smaller is better) -81.8

The SAS System

14:28 Friday, February 19, 2010 difference from .99

------------------------------------ Enzyme=Dansico Milk=raw -------------------------------------

The Mixed Procedure

Fit Statistics

95

BIC (smaller is better) -81.3

Type 3 Tests of Fixed Effects

Num Den Effect DF DF F Value Pr > F

Time 3 16 554.23 <.0001 Concentration 3 16 358.67 <.0001 Time*Concentration 9 16 71.37 <.0001

Least Squares Means

Standard Effect Time Concentration Estimate Error DF t Value Pr > |t|

Time*Concentration 12 0.25 0.4595 0.008751 16 52.51 <.0001 Time*Concentration 12 0.5 0.2519 0.008751 16 28.78 <.0001 Time*Concentration 12 0.75 0.1194 0.008751 16 13.64 <.0001 Time*Concentration 12 1 0.06315 0.008751 16 7.22 <.0001 Time*Concentration 24 0.25 0.2357 0.008751 16 26.93 <.0001 Time*Concentration 24 0.5 0.08050 0.008751 16 9.20 <.0001 Time*Concentration 24 0.75 0.02945 0.008751 16 3.37 0.0039 Time*Concentration 24 1 -0.00090 0.008751 16 -0.10 0.9194 Time*Concentration 48 0.25 0.07500 0.008751 16 8.57 <.0001 Time*Concentration 48 0.5 0.005600 0.008751 16 0.64 0.5313 Time*Concentration 48 0.75 -0.00990 0.008751 16 -1.13 0.2746 Time*Concentration 48 1 -0.00990 0.008751 16 -1.13 0.2746 Time*Concentration 72 0.25 0.01470 0.008751 16 1.68 0.1124 Time*Concentration 72 0.5 -0.00990 0.008751 16 -1.13 0.2746 Time*Concentration 72 0.75 -0.00990 0.008751 16 -1.13 0.2746 Time*Concentration 72 1 -0.00990 0.008751 16 -1.13 0.2746

96

The SAS System 14:28 Friday, February 19, 2010

difference from .99

------------------------------------ Enzyme=Dansico Milk=skim ------------------------------------

The Mixed Procedure

Model Information

Data Set WORK.GOOD Dependent Variable zeroed Covariance Structure Diagonal Estimation Method REML

Residual Variance Method Profile Fixed Effects SE Method Model-Based Degrees of Freedom Method Residual

Class Level Information

Class Levels Values

Time 4 12 24 48 72 Concentration 4 0.25 0.5 0.75 1

Dimensions

Covariance Parameters 1 Columns in X 25 Columns in Z 0 Subjects 1 Max Obs Per Subject 32

Number of Observations

Number of Observations Read 32 Number of Observations Used 32 Number of Observations Not Used 0

Covariance Parameter Estimates

Cov Parm Estimate

Residual 0.000422

Fit Statistics

-2 Res Log Likelihood -67.8 AIC (smaller is better) -65.8 AICC (smaller is better) -65.6

The SAS System

14:28 Friday, February 19, 2010 difference from .99

------------------------------------ Enzyme=Dansico Milk=skim ------------------------------------

The Mixed Procedure

Fit Statistics

97

BIC (smaller is better) -65.1

Type 3 Tests of Fixed Effects

Num Den Effect DF DF F Value Pr > F

Time 3 16 263.96 <.0001 Concentration 3 16 321.14 <.0001 Time*Concentration 9 16 39.40 <.0001

Least Squares Means

Standard Effect Time Concentration Estimate Error DF t Value Pr > |t|

Time*Concentration 12 0.25 0.6126 0.01452 16 42.19 <.0001 Time*Concentration 12 0.5 0.2582 0.01452 16 17.78 <.0001 Time*Concentration 12 0.75 0.1433 0.01452 16 9.87 <.0001 Time*Concentration 12 1 0.06560 0.01452 16 4.52 0.0004 Time*Concentration 24 0.25 0.3633 0.01452 16 25.02 <.0001 Time*Concentration 24 0.5 0.1169 0.01452 16 8.05 <.0001 Time*Concentration 24 0.75 0.04730 0.01452 16 3.26 0.0049 Time*Concentration 24 1 0.004600 0.01452 16 0.32 0.7555 Time*Concentration 48 0.25 0.1608 0.01452 16 11.08 <.0001 Time*Concentration 48 0.5 0.001300 0.01452 16 0.09 0.9298 Time*Concentration 48 0.75 -0.00990 0.01452 16 -0.68 0.5051 Time*Concentration 48 1 -0.00990 0.01452 16 -0.68 0.5051 Time*Concentration 72 0.25 0.06690 0.01452 16 4.61 0.0003 Time*Concentration 72 0.5 -0.00925 0.01452 16 -0.64 0.5331 Time*Concentration 72 0.75 -0.00990 0.01452 16 -0.68 0.5051 Time*Concentration 72 1 -0.00990 0.01452 16 -0.68 0.5051

98

The SAS System 14:28 Friday, February 19, 2010

difference from .99

----------------------------------- Enzyme=Dansico Milk=whole ------------------------------------

The Mixed Procedure

Model Information

Data Set WORK.GOOD Dependent Variable zeroed

Covariance Structure Diagonal Estimation Method REML

Residual Variance Method Profile Fixed Effects SE Method Model-Based Degrees of Freedom Method Residual

Class Level Information

Class Levels Values

Time 4 12 24 48 72 Concentration 4 0.25 0.5 0.75 1

Dimensions

Covariance Parameters 1 Columns in X 25 Columns in Z 0 Subjects 1 Max Obs Per Subject 32

Number of Observations

Number of Observations Read 32 Number of Observations Used 32 Number of Observations Not Used 0

Covariance Parameter Estimates

Cov Parm Estimate

Residual 0.001516

Fit Statistics

-2 Res Log Likelihood -47.4 AIC (smaller is better) -45.4 AICC (smaller is better) -45.1

99

The SAS System 14:28 Friday, February 19, 2010

difference from .99

----------------------------------- Enzyme=Dansico Milk=whole ------------------------------------

The Mixed Procedure

Fit Statistics

BIC (smaller is better) -44.6

Type 3 Tests of Fixed Effects

Num Den Effect DF DF F Value Pr > F

Time 3 16 41.32 <.0001 Concentration 3 16 28.32 <.0001 Time*Concentration 9 16 5.21 0.0021

Least Squares Means

Standard Effect Time Concentration Estimate Error DF t Value Pr > |t|

Time*Concentration 12 0.25 0.3996 0.02753 16 14.52 <.0001 Time*Concentration 12 0.5 0.1992 0.02753 16 7.23 <.0001 Time*Concentration 12 0.75 0.1146 0.02753 16 4.16 0.0007 Time*Concentration 12 1 0.05785 0.02753 16 2.10 0.0518 Time*Concentration 24 0.25 0.2180 0.02753 16 7.92 <.0001 Time*Concentration 24 0.5 0.09135 0.02753 16 3.32 0.0043 Time*Concentration 24 0.75 0.02175 0.02753 16 0.79 0.4410 Time*Concentration 24 1 -0.00100 0.02753 16 -0.04 0.9715 Time*Concentration 48 0.25 0.05840 0.02753 16 2.12 0.0498 Time*Concentration 48 0.5 0.006500 0.02753 16 0.24 0.8163 Time*Concentration 48 0.75 -0.00990 0.02753 16 -0.36 0.7238 Time*Concentration 48 1 -0.00990 0.02753 16 -0.36 0.7238 Time*Concentration 72 0.25 0.02000 0.02753 16 0.73 0.4780 Time*Concentration 72 0.5 -0.00185 0.02753 16 -0.07 0.9473 Time*Concentration 72 0.75 -0.00585 0.02753 16 -0.21 0.8344 Time*Concentration 72 1 -0.00990 0.02753 16 -0.36 0.7238

100

The SAS System 14:28 Friday, February 19, 2010

difference from .99

------------------------------------- Enzyme=Enzeco Milk=raw -------------------------------------

The Mixed Procedure

Model Information

Data Set WORK.GOOD Dependent Variable zeroed

Covariance Structure Diagonal Estimation Method REML

Residual Variance Method Profile Fixed Effects SE Method Model-Based Degrees of Freedom Method Residual

Class Level Information

Class Levels Values

Time 4 12 24 48 72 Concentration 4 0.5 1 1.5 2

Dimensions

Covariance Parameters 1 Columns in X 25 Columns in Z 0 Subjects 1 Max Obs Per Subject 32

Number of Observations

Number of Observations Read 32 Number of Observations Used 32 Number of Observations Not Used 0

Covariance Parameter Estimates

Cov Parm Estimate

Residual 0.001696

Fit Statistics

-2 Res Log Likelihood -45.6 AIC (smaller is better) -43.6 AICC (smaller is better) -43.3

101

The SAS System 14:28 Friday, February 19, 2010

difference from .99

------------------------------------- Enzyme=Enzeco Milk=raw -------------------------------------

The Mixed Procedure

Fit Statistics

BIC (smaller is better) -42.8

Type 3 Tests of Fixed Effects

Num Den Effect DF DF F Value Pr > F

Time 3 16 96.09 <.0001 Concentration 3 16 53.64 <.0001 Time*Concentration 9 16 4.80 0.0032

Least Squares Means

Standard Effect Time Concentration Estimate Error DF t Value Pr > |t|

Time*Concentration 12 0.5 0.5655 0.02912 16 19.42 <.0001 Time*Concentration 12 1 0.3519 0.02912 16 12.08 <.0001 Time*Concentration 12 1.5 0.2716 0.02912 16 9.32 <.0001 Time*Concentration 12 2 0.1337 0.02912 16 4.59 0.0003 Time*Concentration 24 0.5 0.3297 0.02912 16 11.32 <.0001 Time*Concentration 24 1 0.1507 0.02912 16 5.17 <.0001 Time*Concentration 24 1.5 0.1254 0.02912 16 4.31 0.0005 Time*Concentration 24 2 0.01810 0.02912 16 0.62 0.5430 Time*Concentration 48 0.5 0.1681 0.02912 16 5.77 <.0001 Time*Concentration 48 1 0.02490 0.02912 16 0.86 0.4052 Time*Concentration 48 1.5 0.01035 0.02912 16 0.36 0.7269 Time*Concentration 48 2 -0.00990 0.02912 16 -0.34 0.7383 Time*Concentration 72 0.5 0.07580 0.02912 16 2.60 0.0192 Time*Concentration 72 1 -0.00435 0.02912 16 -0.15 0.8831 Time*Concentration 72 1.5 -0.00990 0.02912 16 -0.34 0.7383 Time*Concentration 72 2 -0.00990 0.02912 16 -0.34 0.7383

102

The SAS System 14:28 Friday, February 19, 2010

difference from .99

------------------------------------ Enzyme=Enzeco Milk=skim -------------------------------------

The Mixed Procedure

Model Information

Data Set WORK.GOOD Dependent Variable zeroed

Covariance Structure Diagonal Estimation Method REML

Residual Variance Method Profile Fixed Effects SE Method Model-Based Degrees of Freedom Method Residual

Class Level Information

Class Levels Values

Time 4 12 24 48 72 Concentration 4 0.5 1 1.5 2

Dimensions

Covariance Parameters 1 Columns in X 25 Columns in Z 0 Subjects 1 Max Obs Per Subject 32

Number of Observations

Number of Observations Read 32 Number of Observations Used 32 Number of Observations Not Used 0

Covariance Parameter Estimates

Cov Parm Estimate

Residual 0.000803

Fit Statistics

-2 Res Log Likelihood -57.5 AIC (smaller is better) -55.5 AICC (smaller is better) -55.3

The SAS System

14:28 Friday, February 19, 2010 difference from .99

------------------------------------ Enzyme=Enzeco Milk=skim -------------------------------------

The Mixed Procedure

Fit Statistics

103

BIC (smaller is better) -54.8

Type 3 Tests of Fixed Effects

Num Den Effect DF DF F Value Pr > F

Time 3 16 242.30 <.0001 Concentration 3 16 163.96 <.0001 Time*Concentration 9 16 17.73 <.0001

Least Squares Means

Standard Effect Time Concentration Estimate Error DF t Value Pr > |t|

Time*Concentration 12 0.5 0.6482 0.02004 16 32.35 <.0001 Time*Concentration 12 1 0.3967 0.02004 16 19.79 <.0001 Time*Concentration 12 1.5 0.2567 0.02004 16 12.81 <.0001 Time*Concentration 12 2 0.1331 0.02004 16 6.64 <.0001 Time*Concentration 24 0.5 0.3974 0.02004 16 19.83 <.0001 Time*Concentration 24 1 0.1207 0.02004 16 6.03 <.0001 Time*Concentration 24 1.5 0.06475 0.02004 16 3.23 0.0052 Time*Concentration 24 2 0.01725 0.02004 16 0.86 0.4020 Time*Concentration 48 0.5 0.1757 0.02004 16 8.77 <.0001 Time*Concentration 48 1 0.02135 0.02004 16 1.07 0.3025 Time*Concentration 48 1.5 0.000450 0.02004 16 0.02 0.9824 Time*Concentration 48 2 -0.00990 0.02004 16 -0.49 0.6280 Time*Concentration 72 0.5 0.07595 0.02004 16 3.79 0.0016 Time*Concentration 72 1 -0.00845 0.02004 16 -0.42 0.6789 Time*Concentration 72 1.5 -0.00990 0.02004 16 -0.49 0.6280 Time*Concentration 72 2 -0.00990 0.02004 16 -0.49 0.6280

104

The SAS System 14:28 Friday, February 19, 2010

difference from .99

------------------------------------ Enzyme=Enzeco Milk=whole ------------------------------------

The Mixed Procedure

Model Information

Data Set WORK.GOOD Dependent Variable zeroed

Covariance Structure Diagonal Estimation Method REML

Residual Variance Method Profile Fixed Effects SE Method Model-Based Degrees of Freedom Method Residual

Class Level Information

Class Levels Values

Time 4 12 24 48 72 Concentration 4 0.5 1 1.5 2

Dimensions

Covariance Parameters 1 Columns in X 25 Columns in Z 0 Subjects 1 Max Obs Per Subject 32

Number of Observations

Number of Observations Read 32 Number of Observations Used 32 Number of Observations Not Used 0

Covariance Parameter Estimates

Cov Parm Estimate

Residual 0.000652

Fit Statistics

-2 Res Log Likelihood -60.9 AIC (smaller is better) -58.9 AICC (smaller is better) -58.6

105

The SAS System 14:28 Friday, February 19, 2010

difference from .99

------------------------------------ Enzyme=Enzeco Milk=whole ------------------------------------

The Mixed Procedure

Fit Statistics

BIC (smaller is better) -58.1

Type 3 Tests of Fixed Effects

Num Den Effect DF DF F Value Pr > F

Time 3 16 195.40 <.0001 Concentration 3 16 133.68 <.0001 Time*Concentration 9 16 13.28 <.0001

Least Squares Means

Standard Effect Time Concentration Estimate Error DF t Value Pr > |t|

Time*Concentration 12 0.5 0.5099 0.01805 16 28.24 <.0001 Time*Concentration 12 1 0.3527 0.01805 16 19.53 <.0001 Time*Concentration 12 1.5 0.1869 0.01805 16 10.35 <.0001 Time*Concentration 12 2 0.1276 0.01805 16 7.07 <.0001 Time*Concentration 24 0.5 0.3407 0.01805 16 18.87 <.0001 Time*Concentration 24 1 0.1416 0.01805 16 7.84 <.0001 Time*Concentration 24 1.5 0.05755 0.01805 16 3.19 0.0057 Time*Concentration 24 2 0.01515 0.01805 16 0.84 0.4137 Time*Concentration 48 0.5 0.1338 0.01805 16 7.41 <.0001 Time*Concentration 48 1 0.02370 0.01805 16 1.31 0.2078 Time*Concentration 48 1.5 -0.00210 0.01805 16 -0.12 0.9088 Time*Concentration 48 2 -0.00990 0.01805 16 -0.55 0.5910 Time*Concentration 72 0.5 0.07615 0.01805 16 4.22 0.0007 Time*Concentration 72 1 0.01140 0.01805 16 0.63 0.5367 Time*Concentration 72 1.5 0.000700 0.01805 16 0.04 0.9696 Time*Concentration 72 2 -0.00990 0.01805 16 -0.55 0.5910

106

The SAS System 14:28 Friday, February 19, 2010

difference from .99

------------------------------------- Enzyme=Sigma Milk=raw --------------------------------------

The Mixed Procedure

Model Information

Data Set WORK.GOOD Dependent Variable zeroed Covariance Structure Diagonal Estimation Method REML

Residual Variance Method Profile Fixed Effects SE Method Model-Based Degrees of Freedom Method Residual

Class Level Information

Class Levels Values

Time 4 12 24 48 72 Concentration 4 0.5 1 1.5 2

Dimensions

Covariance Parameters 1 Columns in X 25 Columns in Z 0 Subjects 1 Max Obs Per Subject 32

Number of Observations

Number of Observations Read 32 Number of Observations Used 32 Number of Observations Not Used 0

Covariance Parameter Estimates

Cov Parm Estimate

Residual 0.000403

Fit Statistics

-2 Res Log Likelihood -68.6 AIC (smaller is better) -66.6 AICC (smaller is better) -66.3

107

The SAS System 14:28 Friday, February 19, 2010

difference from .99

------------------------------------- Enzyme=Sigma Milk=raw --------------------------------------

The Mixed Procedure

Fit Statistics

BIC (smaller is better) -65.8

Type 3 Tests of Fixed Effects

Num Den Effect DF DF F Value Pr > F

Time 3 16 436.09 <.0001 Concentration 3 16 333.80 <.0001 Time*Concentration 9 16 20.93 <.0001

Least Squares Means

Standard Effect Time Concentration Estimate Error DF t Value Pr > |t|

Time*Concentration 12 0.5 0.5952 0.01420 16 41.92 <.0001 Time*Concentration 12 1 0.3825 0.01420 16 26.94 <.0001 Time*Concentration 12 1.5 0.2663 0.01420 16 18.75 <.0001 Time*Concentration 12 2 0.1592 0.01420 16 11.21 <.0001 Time*Concentration 24 0.5 0.4304 0.01420 16 30.31 <.0001 Time*Concentration 24 1 0.1818 0.01420 16 12.80 <.0001 Time*Concentration 24 1.5 0.08965 0.01420 16 6.31 <.0001 Time*Concentration 24 2 0.03320 0.01420 16 2.34 0.0327 Time*Concentration 48 0.5 0.2118 0.01420 16 14.91 <.0001 Time*Concentration 48 1 0.03480 0.01420 16 2.45 0.0261 Time*Concentration 48 1.5 -0.00265 0.01420 16 -0.19 0.8543 Time*Concentration 48 2 -0.00990 0.01420 16 -0.70 0.4957 Time*Concentration 72 0.5 0.1110 0.01420 16 7.82 <.0001 Time*Concentration 72 1 0.000050 0.01420 16 0.00 0.9972 Time*Concentration 72 1.5 -0.00990 0.01420 16 -0.70 0.4957 Time*Concentration 72 2 -0.00990 0.01420 16 -0.70 0.4957

108

The SAS System 14:28 Friday, February 19, 2010

difference from .99

------------------------------------- Enzyme=Sigma Milk=skim -------------------------------------

The Mixed Procedure

Model Information

Data Set WORK.GOOD Dependent Variable zeroed

Covariance Structure Diagonal Estimation Method REML

Residual Variance Method Profile Fixed Effects SE Method Model-Based Degrees of Freedom Method Residual

Class Level Information

Class Levels Values

Time 4 12 24 48 72 Concentration 4 0.5 1 1.5 2

Dimensions

Covariance Parameters 1 Columns in X 25 Columns in Z 0 Subjects 1 Max Obs Per Subject 32

Number of Observations

Number of Observations Read 32 Number of Observations Used 32 Number of Observations Not Used 0

Covariance Parameter Estimates

Cov Parm Estimate

Residual 0.000140

Fit Statistics

-2 Res Log Likelihood -85.5 AIC (smaller is better) -83.5 AICC (smaller is better) -83.2

109

The SAS System 14:28 Friday, February 19, 2010

difference from .99

------------------------------------- Enzyme=Sigma Milk=skim -------------------------------------

The Mixed Procedure

Fit Statistics

BIC (smaller is better) -82.7

Type 3 Tests of Fixed Effects

Num Den Effect DF DF F Value Pr > F

Time 3 16 1337.92 <.0001 Concentration 3 16 925.49 <.0001 Time*Concentration 9 16 62.39 <.0001

Least Squares Means

Standard Effect Time Concentration Estimate Error DF t Value Pr > |t|

Time*Concentration 12 0.5 0.6182 0.008363 16 73.92 <.0001 Time*Concentration 12 1 0.3834 0.008363 16 45.84 <.0001 Time*Concentration 12 1.5 0.2509 0.008363 16 30.00 <.0001 Time*Concentration 12 2 0.1823 0.008363 16 21.79 <.0001 Time*Concentration 24 0.5 0.4117 0.008363 16 49.22 <.0001 Time*Concentration 24 1 0.1611 0.008363 16 19.26 <.0001 Time*Concentration 24 1.5 0.08465 0.008363 16 10.12 <.0001 Time*Concentration 24 2 0.03510 0.008363 16 4.20 0.0007 Time*Concentration 48 0.5 0.2027 0.008363 16 24.23 <.0001 Time*Concentration 48 1 0.02745 0.008363 16 3.28 0.0047 Time*Concentration 48 1.5 -0.00365 0.008363 16 -0.44 0.6683 Time*Concentration 48 2 -0.00990 0.008363 16 -1.18 0.2538 Time*Concentration 72 0.5 0.1002 0.008363 16 11.98 <.0001 Time*Concentration 72 1 -0.00075 0.008363 16 -0.09 0.9297 Time*Concentration 72 1.5 -0.00990 0.008363 16 -1.18 0.2538 Time*Concentration 72 2 -0.00990 0.008363 16 -1.18 0.2538

110

The SAS System 14:28 Friday, February 19, 2010

difference from .99

------------------------------------ Enzyme=Sigma Milk=whole -------------------------------------

The Mixed Procedure

Model Information

Data Set WORK.GOOD Dependent Variable zeroed

Covariance Structure Diagonal Estimation Method REML

Residual Variance Method Profile Fixed Effects SE Method Model-Based Degrees of Freedom Method Residual

Class Level Information

Class Levels Values

Time 4 12 24 48 72 Concentration 4 0.5 1 1.5 2

Dimensions

Covariance Parameters 1 Columns in X 25 Columns in Z 0 Subjects 1 Max Obs Per Subject 32

Number of Observations

Number of Observations Read 32 Number of Observations Used 32 Number of Observations Not Used 0

Covariance Parameter Estimates

Cov Parm Estimate

Residual 0.000279

Fit Statistics

-2 Res Log Likelihood -74.4 AIC (smaller is better) -72.4 AICC (smaller is better) -72.1

111

The SAS System 14:28 Friday, February 19, 2010

difference from .99

------------------------------------ Enzyme=Sigma Milk=whole -------------------------------------

The Mixed Procedure

Fit Statistics

BIC (smaller is better) -71.7

Type 3 Tests of Fixed Effects

Num Den Effect DF DF F Value Pr > F

Time 3 16 569.37 <.0001 Concentration 3 16 404.76 <.0001 Time*Concentration 9 16 28.73 <.0001

Least Squares Means

Standard Effect Time Concentration Estimate Error DF t Value Pr > |t|

Time*Concentration 12 0.5 0.5682 0.01182 16 48.08 <.0001 Time*Concentration 12 1 0.3634 0.01182 16 30.75 <.0001 Time*Concentration 12 1.5 0.2295 0.01182 16 19.42 <.0001 Time*Concentration 12 2 0.1575 0.01182 16 13.33 <.0001 Time*Concentration 24 0.5 0.3803 0.01182 16 32.18 <.0001 Time*Concentration 24 1 0.1385 0.01182 16 11.72 <.0001 Time*Concentration 24 1.5 0.05750 0.01182 16 4.87 0.0002 Time*Concentration 24 2 0.02505 0.01182 16 2.12 0.0500 Time*Concentration 48 0.5 0.1669 0.01182 16 14.12 <.0001 Time*Concentration 48 1 0.01620 0.01182 16 1.37 0.1894 Time*Concentration 48 1.5 -0.00700 0.01182 16 -0.59 0.5619 Time*Concentration 48 2 -0.00990 0.01182 16 -0.84 0.4145 Time*Concentration 72 0.5 0.1049 0.01182 16 8.88 <.0001 Time*Concentration 72 1 0.002550 0.01182 16 0.22 0.8319 Time*Concentration 72 1.5 -0.00990 0.01182 16 -0.84 0.4145 Time*Concentration 72 2 -0.00990 0.01182 16 -0.84 0.4145

112

The SAS System 14:28 Friday, February 19, 2010

difference from .99

------------------------------------ Enzyme=Validase Milk=raw ------------------------------------

The Mixed Procedure

Model Information

Data Set WORK.GOOD Dependent Variable zeroed

Covariance Structure Diagonal Estimation Method REML

Residual Variance Method Profile Fixed Effects SE Method Model-Based Degrees of Freedom Method Residual

Class Level Information

Class Levels Values

Time 4 12 24 48 72 Concentration 4 0.25 0.5 0.75 1

Dimensions

Covariance Parameters 1 Columns in X 25 Columns in Z 0 Subjects 1 Max Obs Per Subject 32

Number of Observations

Number of Observations Read 32 Number of Observations Used 32 Number of Observations Not Used 0

Covariance Parameter Estimates

Cov Parm Estimate

Residual 0.001208

Fit Statistics

-2 Res Log Likelihood -51.0 AIC (smaller is better) -49.0 AICC (smaller is better) -48.7

The SAS System

14:28 Friday, February 19, 2010 difference from .99

------------------------------------ Enzyme=Validase Milk=raw ------------------------------------

The Mixed Procedure

Fit Statistics

113

BIC (smaller is better) -48.2

Type 3 Tests of Fixed Effects

Num Den Effect DF DF F Value Pr > F

Time 3 16 96.62 <.0001 Concentration 3 16 65.68 <.0001 Time*Concentration 9 16 8.52 0.0001

Least Squares Means

Standard Effect Time Concentration Estimate Error DF t Value Pr > |t|

Time*Concentration 12 0.25 0.5034 0.02458 16 20.48 <.0001 Time*Concentration 12 0.5 0.3238 0.02458 16 13.17 <.0001 Time*Concentration 12 0.75 0.1766 0.02458 16 7.18 <.0001 Time*Concentration 12 1 0.08965 0.02458 16 3.65 0.0022 Time*Concentration 24 0.25 0.2922 0.02458 16 11.89 <.0001 Time*Concentration 24 0.5 0.06915 0.02458 16 2.81 0.0125 Time*Concentration 24 0.75 0.02835 0.02458 16 1.15 0.2656 Time*Concentration 24 1 0.001100 0.02458 16 0.04 0.9649 Time*Concentration 48 0.25 0.1141 0.02458 16 4.64 0.0003 Time*Concentration 48 0.5 0.000950 0.02458 16 0.04 0.9696 Time*Concentration 48 0.75 -0.00185 0.02458 16 -0.08 0.9409 Time*Concentration 48 1 -0.00990 0.02458 16 -0.40 0.6924 Time*Concentration 72 0.25 0.06045 0.02458 16 2.46 0.0257 Time*Concentration 72 0.5 -0.00335 0.02458 16 -0.14 0.8933 Time*Concentration 72 0.75 -0.00990 0.02458 16 -0.40 0.6924 Time*Concentration 72 1 -0.00990 0.02458 16 -0.40 0.6924

114

The SAS System 14:28 Friday, February 19, 2010

difference from .99

----------------------------------- Enzyme=Validase Milk=skim ------------------------------------

The Mixed Procedure

Model Information

Data Set WORK.GOOD Dependent Variable zeroed

Covariance Structure Diagonal Estimation Method REML

Residual Variance Method Profile Fixed Effects SE Method Model-Based Degrees of Freedom Method Residual

Class Level Information

Class Levels Values

Time 4 12 24 48 72 Concentration 4 0.25 0.5 0.75 1

Dimensions

Covariance Parameters 1 Columns in X 25 Columns in Z 0 Subjects 1 Max Obs Per Subject 32

Number of Observations

Number of Observations Read 32 Number of Observations Used 32 Number of Observations Not Used 0

Covariance Parameter Estimates

Cov Parm Estimate

Residual 0.002023

Fit Statistics

-2 Res Log Likelihood -42.8 AIC (smaller is better) -40.8 AICC (smaller is better) -40.5

115

The SAS System 14:28 Friday, February 19, 2010

difference from .99

----------------------------------- Enzyme=Validase Milk=skim ------------------------------------

The Mixed Procedure

Fit Statistics

BIC (smaller is better) -40.0

Type 3 Tests of Fixed Effects

Num Den Effect DF DF F Value Pr > F

Time 3 16 85.25 <.0001 Concentration 3 16 49.53 <.0001 Time*Concentration 9 16 5.99 0.0010

Least Squares Means

Standard Effect Time Concentration Estimate Error DF t Value Pr > |t|

Time*Concentration 12 0.25 0.6117 0.03180 16 19.23 <.0001 Time*Concentration 12 0.5 0.3547 0.03180 16 11.15 <.0001 Time*Concentration 12 0.75 0.2433 0.03180 16 7.65 <.0001 Time*Concentration 12 1 0.1220 0.03180 16 3.84 0.0015 Time*Concentration 24 0.25 0.3078 0.03180 16 9.68 <.0001 Time*Concentration 24 0.5 0.1121 0.03180 16 3.53 0.0028 Time*Concentration 24 0.75 0.04420 0.03180 16 1.39 0.1836 Time*Concentration 24 1 0.007700 0.03180 16 0.24 0.8118 Time*Concentration 48 0.25 0.1455 0.03180 16 4.58 0.0003 Time*Concentration 48 0.5 0.01330 0.03180 16 0.42 0.6813 Time*Concentration 48 0.75 -0.00440 0.03180 16 -0.14 0.8917 Time*Concentration 48 1 -0.00990 0.03180 16 -0.31 0.7596 Time*Concentration 72 0.25 0.06485 0.03180 16 2.04 0.0583 Time*Concentration 72 0.5 -0.00990 0.03180 16 -0.31 0.7596 Time*Concentration 72 0.75 -0.00990 0.03180 16 -0.31 0.7596 Time*Concentration 72 1 -0.00990 0.03180 16 -0.31 0.7596

116

The SAS System 14:28 Friday, February 19, 2010

difference from .99

----------------------------------- Enzyme=Validase Milk=whole -----------------------------------

The Mixed Procedure

Model Information

Data Set WORK.GOOD Dependent Variable zeroed

Covariance Structure Diagonal Estimation Method REML

Residual Variance Method Profile Fixed Effects SE Method Model-Based Degrees of Freedom Method Residual

Class Level Information

Class Levels Values

Time 4 12 24 48 72 Concentration 4 0.25 0.5 0.75 1

Dimensions

Covariance Parameters 1 Columns in X 25 Columns in Z 0 Subjects 1 Max Obs Per Subject 32

Number of Observations

Number of Observations Read 32 Number of Observations Used 32 Number of Observations Not Used 0

Covariance Parameter Estimates

Cov Parm Estimate

Residual 0.002475

Fit Statistics

-2 Res Log Likelihood -39.5 AIC (smaller is better) -37.5 AICC (smaller is better) -37.2

117

The SAS System 14:28 Friday, February 19, 2010

difference from .99

----------------------------------- Enzyme=Validase Milk=whole -----------------------------------

The Mixed Procedure

Fit Statistics

BIC (smaller is better) -36.8

Type 3 Tests of Fixed Effects

Num Den Effect DF DF F Value Pr > F

Time 3 16 24.97 <.0001 Concentration 3 16 34.38 <.0001 Time*Concentration 9 16 2.58 0.0473

Least Squares Means

Standard Effect Time Concentration Estimate Error DF t Value Pr > |t|

Time*Concentration 12 0.25 0.3665 0.03518 16 10.42 <.0001 Time*Concentration 12 0.5 0.2715 0.03518 16 7.72 <.0001 Time*Concentration 12 0.75 0.1504 0.03518 16 4.27 0.0006 Time*Concentration 12 1 0.05455 0.03518 16 1.55 0.1405 Time*Concentration 24 0.25 0.3469 0.03518 16 9.86 <.0001 Time*Concentration 24 0.5 0.1217 0.03518 16 3.46 0.0032 Time*Concentration 24 0.75 0.03890 0.03518 16 1.11 0.2851 Time*Concentration 24 1 0.003500 0.03518 16 0.10 0.9220 Time*Concentration 48 0.25 0.1628 0.03518 16 4.63 0.0003 Time*Concentration 48 0.5 0.007550 0.03518 16 0.21 0.8328 Time*Concentration 48 0.75 -0.00990 0.03518 16 -0.28 0.7820 Time*Concentration 48 1 -0.00990 0.03518 16 -0.28 0.7820 Time*Concentration 72 0.25 0.09750 0.03518 16 2.77 0.0136 Time*Concentration 72 0.5 0.000450 0.03518 16 0.01 0.9900 Time*Concentration 72 0.75 -0.00440 0.03518 16 -0.13 0.9020 Time*Concentration 72 1 -0.00990 0.03518 16 -0.28 0.7820


Recommended