BETTER CROPS W I T H P L A N T f O O D \\ inter 1993-94 N THIS ISSUE A ssessing P hosphorus B uildup in C rop A creage P otassium I nteractions and B alanced P lant N utrition T ake-all R oot R ot in W inter W heat W heat D isease and C opper N utrition and much more
Transcript
B E T T E R CROPS
W I T H P L A N T f O O D \\ inter 1993-94
N T H I S I S S U E
A s s e s s i n g P h o s p h o r u s
B u i l d u p i n C r o p A c r e a g e
P o t a s s i u m I n t e r a c t i o n s
a n d B a l a n c e d P l a n t
N u t r i t i o n
T a k e - a l l R o o t R o t i n
W i n t e r W h e a t
W h e a t D i s e a s e a n d
C o p p e r N u t r i t i o n
a n d m u c h m o r e
B E T T E R C R O P S
W I T H P L A N T F O O D
Vol. LXXVI1I (78), No. 1. Winter 1993-94
Our Cover: Wheat field near Towner, CO.
Photo Credit: Dr. Lam- S. Murphy.
Editor: Donald L. Armstrong Assistant Editor: Kathy Hefner Editorial Assistant: Katherine P. Griffin Circulation Mgr.: Carol Mees
POTASH & PHOSPHATE INSTITUTE (PPI) C. Steve Hoffman, Chairman of the Board
IMC Fertilizer Group, Inc. C. E. Childers, Vice Chairman of the Board
Potash Corporation of Saskatchewan Inc.
HEADQUARTERS: NORCROSS, GEORGIA, U.S.A. D. W. Dibb, President B. C. Darst, Executive Vice President R.T. Roberts, Vice President C. V. Holcomb, Asst. Treasurer S.O. Fox, Executive Secretary W.R. Agerton, Communications Specialist
MANHATTAN, KANSAS L.S. Murphy, Senior Vice President, North American Programs
REGIONAL DIRECTORS-North America P.E. Fixen, Brookings, South Dakota A.E. Ludwick, Mil l Valley, California H.F. Reetz, Jr., Monticello, Illinois T.L. Roberts, Coaldale, Alberta M.D. Stauffer, London, Ontario W.R. Thompson, Jr., Starkville, Mississippi N.R. Usherwood, Norcross, Georgia
INTERNATIONAL PROGRAMS Saskatoon, Saskatchewan, Canada
J.D. Beaton, Senior Vice President, International Programs (PPI), and President, Potash & Phosphate Institute of Canada (PPIC)
J. Gautier, Dir., Admin. Serv.
INTERNATIONAL PROGRAM LOCATIONS Brazil-POTAFOS T. Yamada, Piracicaba China S.S. Portch, Hong Kong
J. Wang, Hong Kong Jin Ji-yun, Beijing Wu Ronggui, Beijing
India G. Dev, Dundahera, Gurgaon Latin America J. Espinosa, Quito, Ecuador Southeast Asia E. Mutert, Singapore
Woo Yin Chow, Singapore
BETTER CROPS WITH PLANT FOOD (ISSN: 0006-0089) is published quarterly by Potash & Phosphate Institute (PPI), 655 Engineering Drive, Suite 110, Norcross, GA 30092-2821. Phone (404) 447-0335; fax (404) 448-0439. Subscriptions: Free on request to qualified individuals; others $8.00 per year or $2.00 per issue.
C O N T K IN T S
P and K Fertilization for Corn and Soybeans in 1994
L.S. Murphy and B.C. Darst
3
Copper Deficiency in Prairie Soils (Alberta) E.D. Solberg, D.C. Penney, I.R. Evans and D.C. Maurice
4
Wheat Diseases and Copper Nutrition (Alberta) I.R. Evans, D.C. Maurice, D.C. Penney and E.D. Solberg
6
Nutrient Management Conference Announced for May 16-18, 1994
8
Starter Fertilizer Can Improve Growth and Yield of Cotton (Louisiana)
John L. Kovar, Eddie R. Funderburg and Robert L. Hutchinson
9
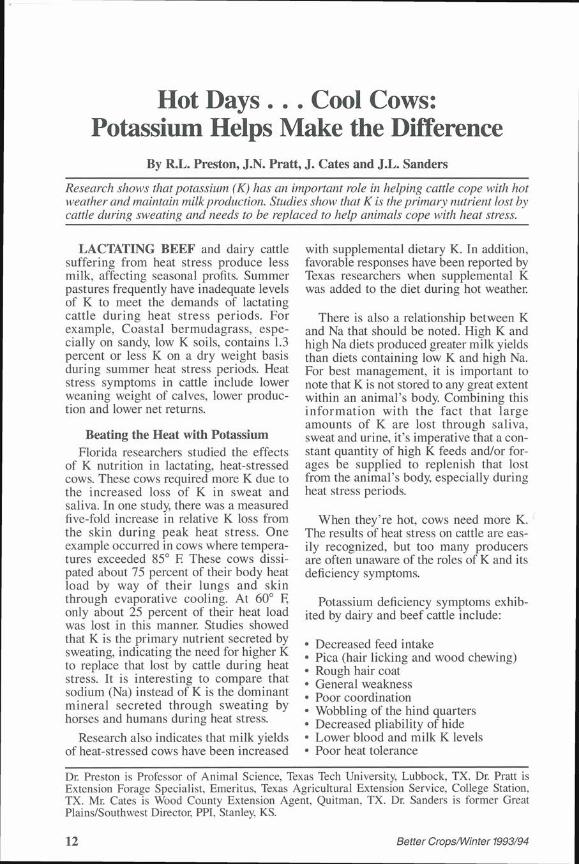
Hot Days... Cool Cows: Potassium Helps Make the Difference
R.L. Preston, J.N. Pratt, J. Cates and J.L. Sanders
12
Proceedings of North Central Extension-Industry Soil Fertility Conference Available
13
Phosphorus and Magnesium Reduce Grass Tetany Potential (Missouri)
Dr. W.K. Griffith Retires as PPI Eastern U.S. Program Director
20
Dr. J.D. Beaton Retires, Dr. M.D. Stauffer Elected Vice President for PPI International Programs
21
Take-all Root Rot in Winter Wheat (Oregon) John M . Hart and Neil W. Christensen
22
1993 Southern Soil Fertility Conference Proceedings Available
25
Potassium Interactions and Balanced Plant Nutrition
N.R. Usherwood
26
Profit Protection Ideas: Batch Applications of Phosphorus Can Boost Wheat Profits
29
Environotes from TVA John E. Culp
30
Dr. H.F. Reetz Honored as Fellow of ASA 31
Dr. B.C. Darst Elected as Fellow of SSSA 31
Is Your Underwear Safe? J. Fielding Reed
32
Members: CF Industries, Inc. • Cargill, Incorporated • Cedar Chemical Corporation • Central Canada Potash • Cominco Fertilizer!
IMC Fertilizer Croup. Inc. • Kalium Chemicals • Mississippi Chemical Corporation • Mobil Mining and Minerals Cornpam
Potash Corporation of Saskatchewan Inc. • Texasgulf Inc. • Western Ag-Minerals Cornpam
» Great Sail Like .Mineral- Corporation
Potash Company ol Canada, limited
P and K Fertilization for Corn and Soybeans in 1994
By L.S. Murphy and B.C. Darst
F O R C R O P P R O D U C T I O N , 1993 was an extraordinary year. Floods in the Midwest and drought in the South and Southeast cut yields in some areas and destroyed crops in others. As corn and soybean farmers plan for the 1994 crop year, an important management decision will be how to handle phosphorus (P) and potassium (K) fertilization. Several factors need to be included in the decisionmaking process.
First, P and K requirements are site specific as well as crop specific. That means soil testing is the first step in knowing where the investment in PK fertilization should be made. In weather stricken areas, i f soil tests were not done last fall, they should be done now. They wil l show what nutrients were carried over in soils because of drought. On flooded soils, a farmer might be looking at a whole new soil fertility regime. Soils should be tested as a matter of routine i f current tests are more than a couple of years old.
Consider the following factors, along with soil tests, in determining P and K needs in 1994.
• Soil tests, cropping systems, fallow, soil temperature, compaction, planting date, yield history and yield goal . . . all affect PK needs. Responses to additional P and K on high testing soils may occur due to many of these factors.
• Conservation tillage makes starters important even when soil tests are high. Cool, wet, compacted soils and nutrient stratification depress nutrient uptake.
• Starter fertilization, especially P, might be critical on soils which were flooded in 1993. Flooding and fallow
ing interfere with important soil fungi (mycorrhizae) activities which aid in the uptake of P and other nutrients. Use of a P starter, at rates of 40 to 70 lb P 20 5/A, usually corrects P deficiency under these conditions.
• Research has documented the importance of banded K in ridge-till systems . . . even when K soil tests are adequate. Starter K is particularly important when soils are compacted, wet and/or cold.
• Starter response is greatest when environmental conditions result in high nutrient demand relative to the root system's capacity to take up nutrients. Cold soils lower uptake, slow nutrient movement in the soil and decrease nutrient movement from roots to above-ground plant parts.
• Conservation tillage increases the importance of fert i l izer K . Potassium deficiencies in conservation tillage systems are becoming more common, especially under stress conditions.
• P and K fertilization should be a long-term production input. In a 20-year Kansas study, adequate P and K gave a 16 bu/A soybean yield increase in a good production year, on a soil which tested adequate for both nutrients at the beginning of the study. That emphasizes the importance of having everything in place to take advantage of outstanding grain conditions.
Finally, P and K fertilization should be balanced with other nutrients and needed lime for highest use efficiency. Fertilizer P and K can be real profit makers in 1994, so this critical management input should be given proper attention. •
Dr. Murphy is Senior Vice President, PPI, Manhattan, KS; Dr. Darst is Executive Vice President, PPI, and President, Foundation for Agronomic Research (FAR), Norcross, GA.
Better Crops/Winter 1993/94 3
Alberta
Copper Deficiency in Prairie Soils By E.D. Solberg, D.C. Penney, I.R. Evans and D.C. Maurice
Alberta researchers suspect significant areas of the prairie provinces may be copper (Cu) deficient. Field studies conducted in Alberta since 1987 are showing wheat and barley grown on light textured, high organic matter soils can be highly responsive to Cu fertilization.
C O P P E R D E F I C I E N C Y has rarely been reported in the wheat growing regions of the Northern Great Plains. However, research is now showing significant areas of Alberta mineral soils are potentially Cu responsive. These Cu deficient areas frequently occur in Black Chernozems (Borolls) or transitional soils on sandy hilltops and light loamy lower slopes with high organic matter (6 to 10 percent) and deep surface horizons.
Alberta Studies Six years of field and laboratory studies
in Alberta have evaluated diagnostic methods, fertilization and crop response related to Cu deficiency. Tissue testing has not proven as effective as soil analysis. Results show DTRA extractable Cu to be a reliable indicator of soil Cu deficiency. However, critical levels are higher than the 0.2 parts per mil l ion (ppm) standard accepted in many areas. In Alberta soils, response to Cu fer t i l iza t ion occurs between 0.4 and 0.8 ppm DTPA extract-able Cu, and symptoms of Cu deficiency have been observed in heavily manured fields with greater than 1 ppm soil test Cu.
Deficiency Symptoms Copper deficiency symptoms in cereals
are numerous. They include: • limpness or wilting at mid-tillering
or stem elongation • pale yellow, curled leaves at
tillering • pig tail, whip tail and death of leaf
tip
• retarded stem elongation • excessive tillering, high mortality
rate of late tillers and delay in heading
• aborted heads and spikelets • normal heads with empty spikelets
or shriveled grain • delayed maturity and senescence • head bending • increased susceptibility to disease • reduced yields
Individually, symptoms are easily confused with those resulting from herbicide, insect or frost damage, but collectively they are an effective diagnostic tool. Unfortunately, yield losses commonly occur even when early visual symptoms are not evident. Depending on the severity of the symptom, loss in grain yield can range from 5 to 100 percent and can be variety sensitive.
BARLEY growing on a peat soil responded dramatically to applied Cu. Dead area on the left received no soil-applied Cu.
The authors are with Alberta Agriculture, Food and Rural Development, Soil and Crop Management Branch, 6909 - 116 St., Edmonton, AB, Canada T6H 4P2.
4 Better Crops/Winter 1993/94
Al l common wheat and barley varieties grown in Alberta are sensitive to Cu deficiency and respond to Cu fertilization, Figure 1.
90
85
* 80
2 75
>• 70
g 65
iH 60 tt 55
50 Roblin Laura Katepawa Park Conway
Hard red spring wheat varieties
90
85
80
75
70
65
60
55
50 Condor Virden Brier Noble
Barley varieties
Duke
Figure 1. Relative yield (Cu-/Cu+) of several wheat (7 site-years) and barley (4 site-years) varieties grown on Cu deficient soils.
Wheat is the most sensitive of the cereals. There appears to be little difference among wheat varieties. Barley can be as sensitive to insufficient Cu as wheat, but varieties are much more variable in their response.
Table 1. Park wheat response to Cu fertilization1
near Tofield, Alberta.
Yield, bu/A
Method 1990 1991 1992 Avg.
Control 45 41 46 44 Cu Chelate Soil spray 58 61 57 59 Cu Sulfate Seed-row 50 58 60 56
Band 50 44 54 50 Broadcast 60 61 61 60
Correcting Deficiencies Because Cu is very immobile in the
soil, broadcast and incorporation is generally the best way to correct a deficiency. Table 1 compares broadcast and incorporation to band and seed-placement in spring wheat. Both the Cu chelate and the Cu sulfate were equally effective in increasing yields, and both produced 10 bu/A more than the band application.
10ne-time application of Cu chelate (1 lb Cu/A as Cu-EDTA) and Cu sulfate (3 lb Cu/A as Cu sulfate)
P205 rate, lb/A
Figure 2. Copper and P influence barley yields in Alberta.
Copper deficiency can inhibit the response of other nutrients, and other nutrients may aggravate Cu deficiency. Figure 2 shows how applied phosphorus (P) increased barley yields when Cu levels were not limiting and decreased yields when Cu was limiting.
Summary Copper deficiency is being detected in
increasing areas in Alberta soils. It may be l imi t ing cereal yields, especially wheat, in many other prairie soils, including those in the U.S. The problem is easily corrected with a small amount of Cu fertilizer (5 to 10 lb Cu/A). Our research suggests a single application should be effective for at least 7 to 10 years. In addition to dramatic yield increases, our studies also show Cu fertilization effectively controls several diseases common to prairie cereals. •
Better Crops/Winter 1993/94 5
Alberta
Wheat Diseases and Copper Nutrition
By I.R. Evans, D.C. Maurice, D.C. Penney and E.D. Solberg
Field studies in Alberta show copper (Cu) fertilization plays a role in the control of ergot infection, take-all and melanosis in hard red spring wheat.
Y I E L D S AND DISEASES of spring wheat growing in Cu deficient soils can be profoundly influenced by soil or foliar Cu amendments. Ergot infection, take-all root rot and melanosis are markedly reduced or eliminated when Cu fertilizers are added to soils containing less than 1 part per million (ppm) available Cu.
Table 1. Copper fertilization decreased ergot infection of Park wheat.
ERGOT INFECTION in wheat can be markedly reduced by providing adequate Cu.
Copper Effects on Ergot
Field studies conducted in Alberta demonstrate how effectively Cu controls ergot infection. In two experiments in 1989, varying amounts of Cu, applied as copper sulfate (CuS04), were applied to Cu deficient soils in replicated small plots or field-scale strips. In the small plot t r i als, Cu application decreased the number of ergots per square yard from 11 to 2 and increased yields by more than 300 per cent, Table 1.
Cu Rate, Grain yield, Ergots, lb/A1 bu/A number/sq yd.
0 13 11 10 43 2
Dark Gray Chernozem with Stony Plain, Alberta 0.6 parts per million (ppm) DTPA extractable Cu 140 lb CuS04/A applied in 1987
Table 2 shows the results from the field scale test strips. In this study, the number of ergots per square yard ranged from a high of 45 in the non-amended soil to a low of 1 where Cu was applied.
Table 2. Copper fertilization decreased ergot infection of Katepawa wheat.
Cu Rate, Grain yield, Ergots, lb/A1 bu/A number/sq yd.
1 4
10
IS 34
41 2 1
Organic soil with 0.6 ppm DTPA Westlock, Alberta extractable Cu 115 and 40 lb CuS04/A applied in 1989
In another study in central Alberta, Roblin spring wheat, in a 120 acre field on soil known to be Cu deficient, developed signs of crop damage two weeks after herbicide application. The wheat showed yellowing, stunting and pig tai l ing, all indicative of severe Cu deficiency. Foliar applications of Cu chelate, CuS0 4
and CuS0 4 buffered to pH 5.0 were sprayed directly on the wheat on June 30
The authors are with Alberta Agriculture Food and Rural Development, Soil and Crop Management Branch, 6909 - 116 St., Edmonton, AB, Canada T6H 4P2. Funding for this study was provided by Alberta Agriculture's "Farming for the Future" research program.
6 Better Crops/Winter 1993/94
COPPER DEFICIENCY symptoms in small grain (barley pictured here) include stunted plants, deformed leaves and heads, and chlorosis.
Wheat Yield
Cu Chelate CuSO, Buffered CuS04
Ergot Infection
70 y nEarly Applicatioj^Late Application
m — B — B -g 30-^ |
1StQ P r ^ j % Cu Chelate CuS04 Buffered
CuS04
Figure 1. Foliar Cu application (0.25 lb Cu/A) improved yields and controls ergot in Roblin wheat.
(Bearhills, Alberta, July 1992)
(early) and July 21 (late) at a rate of 0.25 lb Cu/A. The early Cu application was the most effective, averaging 2.5 ergots per pound of grain compared to 56.5 for the late application, Figure 1. It also produced three times more yield than the later application.
The mechanism of ergot infection is correlated with pollen sterility on Cu deficient soils. Self-pollinated florets are normally closed, but under Cu deficiency they remain open, thus greatly increasing the probability of ergot infection and possibly other diseases. Melanosis (depending on cultivar) on a Cu deficient soil can range from zero (not evident) to a chocolate brown discoloration of the stems and heads.
Table 3. Copper reduced take-all disease symptoms and melanosis in spring wheat cultivars.
Take-all, % Melanosis
Cultivar + Cu1 - Cu + Cu - C u
Roblin 4 70 none slight-severe Oslo 12 69 none none Laura 4 52 none none Park 6 78 none slight-severe 1DTPA extractable Cu, 0.6 ppm Stony Plain, Alberta Application rate, 12 lb Cu/A (as CuSOJ
Table 3 demonstrates the dramatic effect Cu can have on take-all root rot and melanosis. In this study, applied Cu decreased the severity of take-all in several cultivars of spring wheat by 48 to 72 percent and eliminated melanosis in Roblin and Park wheat. Recent research in Australia has also shown that Cu application reduces take-all severity in wheat. Melanosis ranged from an absence of any obvious symptoms to pale brown (slight), mid-brown (moderate) and dark brown (severe) discoloration of the head and straw of the ripening wheat.
(continued on next page)
Better Crops/Winter 1993/94 7
Copper deficiency delays or reduces starch formation during grain filling, causing the accumulation of soluble carbohydrates which makes the crop susceptible to stem and head diseases l i ke melanosis.
Summary
Our studies in Alberta indicate a significant area, estimated to exceed 3 million acres, i n wheat growing regions may be yield-limited because of Cu deficiency. It's INCREASING MELANOSIS (right) is associated with increasing clear that low or deficient s e v e r i t y o f C u deficiency, levels of Cu predispose wheat to yield-reducing infectious diseases like take-all, ergot infection and melanosis and to a range of other disorders from seedling to crop maturity. Such yield losses and disease problems can be dramatic, but are easily minimized or eliminated with small applications of foliar Cu (0.25 lb/A) or larger amounts of soil applied Cu (10 lb/A). •
Nutrient Management Conference Announced for May 16-18,1994
PLANS for a 1994 conference entitled "Nutrient Management on Highly Productive Soils" have been announced by the Potash & Phosphate Institute (PPI) and the Foundation for Agronomic Research (FAR), co-organizing groups. The Conference is scheduled for May 16-18, 1994 at the Atlanta Airport Hilton Hotel, Atlanta, GA.
The program wi l l feature a range of interesting topics including: the importance of maintaining soil fertility, fertilizer recommendations and spatial variability, site-specific nutrient management, individualized nutrient management recommendations, the roles of fertilizer placement in improving product iv i ty , economic and environmental impacts of intensive cropping systems, outline of the U.S. Agricultural Pollution Prevention Plan and a discussion
of regulatory effects on fertility use.
The Conference is attracting co-sponsorship from both private and governmen-ta l sectors. A broad spectrum of participants is expected, ranging from agricultural producers to fertilizer and agricultural chemicals dealers, fertilizer and agricultural industry representatives, crop management consultants, state and federal regulatory agency personnel, federal service agency personnel, researchers, Extension workers and journalists. A proceedings of the Conference papers wi l l be available at the time of the meeting.
For more information on the Conference program, registration cost and housing, contact the Potash & Phosphate Institute, 2805 Claflin Rd., Suite 200, Manhattan, KS 66502. Phone: (913) 776-0273; fax: (913) 776-8347. •
Better Crops/Winter 1993/94
Louisiana
Starter Fertilizer Can Improve Growth and Yield of Cotton
By John L . Kovar, Eddie R. Funderburg and Robert L . Hutchinson
Research in Louisiana has shown that starter fertilizer applications may increase early-season growth and lint yields of cotton. Addition of starters containing nitrogen (N) and phosphorus (P) does not increase yields in every location, every year. Further research will help to determine situations in which starter fertilizers can consistently provide economically favorable yield responses.
R E C E N T L Y , there has been renewed interest in the use of starter fertilizer for cotton production in the Midsouth. Changes in production practices have sparked this interest. Cotton varieties with greater yield potential and greater nutrient requirements are being grown. Many producers have adopted no-till or reduced tillage systems, which result in greater residue cover and cooler, wetter soils at the time of planting.
To increase management flexibility, growers are planting at earlier dates, which also means lower soil temperatures at planting. Research has shown that starter fertilizers often increase soil nutrient availability when seedling requirements are great. They also promote root growth and plant vigor under adverse conditions found early in the growing season.
Starter fertilizers can be mixtures of various nutrients, applied in various ways. In general, starters used in cotton production contain some amounts of N and P and are applied at the time of planting within the seed furrow, as a band 2 inches below and to the side of the seed, or as a surface band near or over the top of the furrow. In some cases, potassium (K) and micro-nutrients, such as zinc (Zn) and boron (B), are also included in the starter in areas where the soil availability of these nutrients is low.
Research over the last several years has shown that cotton responses to starter fert i l izer can be variable. Significant increases in cotton lint yield were found at 13 of 18 locations from starter applications in three years of Mississippi field trials. Averaged over all locations, lint yields from check plots were 1,000 lb/A, while plots with starter produced 1,093 lb/A. Surface band and 2 x 2 band placements consistently resulted in yield increases, whereas a surface dribble application 2 inches to the side of the seed furrow did not.
A Louisiana study on a Bruin/Commerce silt loam showed that 4.5 gal/A of either 4-11-11 or 11-37-0 (2.5-6.9-6.9 lb/A or 6-20-0 lb/A N-P 2 0 5 -K 2 0, respectively) applied as a 6-inch surface band or injected near the furrow at planting did not affect early-season growth. Similarly, total lint yields were not significantly greater than those harvested from plots to which starter was not applied.
In Alabama, surface banding of N-P starter significantly increased cotton lint yields at only one of 16 field locations over a two-year period. Researchers concluded that use of starter fertilizer was a "hit or miss" situation and that proper early-season weather and a lint yield potential of 1,000 lb/A was necessary for a positive response. A separate study, however, showed that a liquid N (30-0-0) and a granular blend including sulfur (S)
Dr. Kovar is Assistant Professor and Dr. Funderburg is Extension Soils Specialist, Louisiana State University Agricultural Center, Baton Rouge, LA; Dr. Hutchinson is Professor, LSU Agricultural Center, Northeast Research Station, Winnsboro, LA.
Better Crops/Winter 1993/94 9
(10-10-10-12 with micronutrients) applied as starter, significantly increased lint yields.
North Carolina research showed that a 2 x 2 band application significantly increased lint yields at four locations during a two-year period. In this case, response to banded starter did not depend on early-season environmental stress.
Positive yield responses to starter in a three-year Texas study occurred when rainfall was above average, under both conventional and reduced tillage conditions on a sandy loam soil.
Recent studies in Louisiana have focused on rate and placement of ammonium polyphosphate (11-37-0 or 10-34-0) solutions. Application rates and placements that have been tested include: 1) low rates (1.5 gal/A) applied in-furrow; 2) higher rates (2.5 to 5 gal/A) applied in-furrow; 3) 7.5 gal/A banded 2 inches below and to the side of the seed; 4) 4 gal/ A applied as a 4-inch surface band at planting; and 5) 7.5 to 12 gal/A applied as a 4-inch surface band at planting. Based on experimental results, the 1.5 gal/A in-furrow, 7.5 gal/A 2 x 2 band, and 12 gal/A surface band are the methods that justify further testing.
Starter Effects on Shoot and Root Growth
Dramatic increases in early-season growth are sometimes observed when starter fertilizers are applied to cotton (see photos). However, visual responses do not occur at every location, every year. Even at the same location, management practices can affect the response of the crop to
starter. For example, in a three-year test at the Northeast Louisiana Research Station, seedling height was not significantly increased by starter applications under conventional tillage and no-till systems compared with broadcast N and P applications. In several instances, however, other measurements of early growth, including leaf size, leaf area per plant and shoot weight, showed significant improvements with starter fertilizers. Positive responses were more consistent under no-till compared to conventional tillage.
Applications of ammonium polyphosphate (APP) starter can also stimulate early-season root growth of cotton, even in soil with high levels of available P, Table 1. As with shoots, the response does not occur every year at every location. In addition, by the early bloom stage, other environmental conditions probably influence root growth more than N-P fertilizer applied at planting, so that differences in root growth disappear, Table 1.
Table 1. Effect of 11-37-0 starter fertilizer rate and placement on cotton root growth 33 and 56 days after planting on a Commerce silt loam soil. Samples were collected in the row.
Root length density, cm/cm3
Seedling Early bloom
Treatment 0-4 in.* 0-4 in.* 4-8 in.*
Check Surface band,
150 lb/A In-furrow, 18 lb/A In-furrow, 30 lb/A
1.00 b
1.34 ab 1.46 a 1.48 a
0.95 a 1.71a
0.97 a 1.72 a 1.25 a 1.25 ab 1.18 a 0.82 b
*Means followed by the same letter are not significantly different at the 0.05 level
STARTER FERT
4 j
I 11 c
1! i f 1
STARTER FERT
- ' j
>
[ m
i
c i ) T.
QUALITATIVE COMPARISON of the effect of 11-37-0 rate and placement on the early growth of cotton seedlings. Treatments are, from left: control, 12 gal/A surface banded, and 1.5 gal/A applied in-furrow. Seedlings were harvested 25 days after planting.
Better Crops/Winter 1993/94
In-furrow applications of 11-37-0 at rates greater than 1.5 gal/A (18 lb/A) are not recommended. Three years of data f rom the Northeast Research Station showed that significant stand reductions usually occurred when 3.0 and 4.5 gal/A of 11-37-0 were applied in the seed furrow. Reduced stands have not been a problem at any location with the 1.5 gal/A rate applied in-furrow or with the 7.5 gal/A rate banded 2x2 or in a surface band.
Yield Responses Based on four years of research at a
number of on-farm locations, in-furrow applications of 1.5 gal/A of 11-37-0 or 10-34-0 and surface band applications of 12 gal/A of 11-37-0 or 10-34-0 showed the most promise, Tables 2 and 3. Although significant yield increases were not recorded at every location in every year, starter treatments did not significantly decrease lint yields in any of the experiments. It should be noted that the starters applied in these trials were in addition to the base N-P 2 0 5 -K 2 0 rates applied to all plots.
In a three-year study at the Northeast Research Station, yield responses were inconsistent, Table 4. Significant yield increases did not occur under conventional tillage, Table 4. In a no-till system, a yield increase was observed one of three years when 7.5 gal/A of 11-37-0 was applied as a surface band over the seed furrow. Total applications of N, P 2 0 5 and K 2 0 were held constant.
Table 2. Effect of in-furrow application of 1.5 gal/A 11-37-0 at planting on cotton yields at nine on-farm locations in Louisiana.
Cotton lint yield, lb/A n i f f p m n p p
Year Soil Check Starter + or (-)
1990 Commerce sil 1,255 1,400 145* 1991 Commerce sil 1,184 1,191 7 1991 Necessity sil 1,503 1,586 83* 1992 Loring sil 878 889 11 1992 Caspiana sil 922 911 (11) 1992 Commerce sil 999 1,040 41 1992 Sharkey 515 697 182* 1992 Norwood sil 734 837 103** 1993 Rilla sil 941 1,174 233** Mean 992 1,081 89
'Difference significant at 0.05 level "Difference significant at 0.01 level
Table 3. Effect of 3-inch surface band application of 12 gal/A 11-37-0 at planting on cotton yields at eight on-farm locations in Louisiana.
Cotton lint yield, lb/A Difference, Year Soil Check Starter + or (-)
1990 Commerce sil 1,255 1,443 188** 1990 Norwood sil 823 895 72 1990 Loring sil 1,045 1,032 (13)
147* 1991 Commerce sil 1,184 1,331 (13)
147* 1991 Loring sil 949 1,073 124** 1992 Commerce sil 999 1,144 145 1992 Loring sil 878 957 79* 1993 Loring sil 860 969 109* Mean 999 1,106 107 'Difference significant at 0.10 level "Difference significant at 0.05 level
Table 4. Effect of 11-37-0 starter fertilizer on cotton lint yields on a Gigger silt loam soil under conventional tillage and no-till.
Cotton lint yield, lb/A
1991 1992 1993
Treatment* CTf NTt CT NT CT NT
No starter, 80-0-60 be* 1,006 1,019 847 823 1,061 891
No starter, 80-40-60 be 973 1,080 807 862 1,091 907
LSD (0.05) NS 74 NS NS NS NS * All starter plots received a total of 80-40-60 lb/A
N-P205-K20, respectively t CT is conventional tillage; NT is no-till i bc=broadcast and incorporated prior to planting
Summary Based on four years of research, a number
of conclusions can be drawn. Applications of N-P starter fertilizers may significantly increase cotton lint yields at some locations in some years. Early-season plant and root growth often are stimulated, but this does not always lead to significant yield increases. On the other hand, significant yield increases have been observed when early-season growth was not stimulated. Further starter research is being conducted in Louisiana, Tennessee and other states to determine treatments that will provide more consistent responses. •
Better Crops/Winter 1993/94 11
Hot Days . . . Cool Cows: Potassium Helps Make the Difference
By R . L . Preston, J.N. Pratt, J . Cates and J . L . Sanders
Research shows that potassium (K) has an important role in helping cattle cope with hot weather and maintain milk production. Studies show that K is the primary nutrient lost by cattle during sweating and needs to be replaced to help animals cope with heat stress.
LACTATING B E E F and dairy cattle suffering from heat stress produce less milk, affecting seasonal profits. Summer pastures frequently have inadequate levels of K to meet the demands of lactating cattle during heat stress periods. For example, Coastal bermudagrass, especially on sandy, low K soils, contains 1.3 percent or less K on a dry weight basis during summer heat stress periods. Heat stress symptoms in cattle include lower weaning weight of calves, lower production and lower net returns.
Beating the Heat with Potassium Florida researchers studied the effects
of K nutrition in lactating, heat-stressed cows. These cows required more K due to the increased loss of K in sweat and saliva. In one study, there was a measured five-fold increase in relative K loss from the skin during peak heat stress. One example occurred in cows where temperatures exceeded 85° F. These cows dissipated about 75 percent of their body heat load by way of their lungs and skin through evaporative cooling. At 60° F, only about 25 percent of their heat load was lost in this manner. Studies showed that K is the primary nutrient secreted by sweating, indicating the need for higher K to replace that lost by cattle during heat stress. It is interesting to compare that sodium (Na) instead of K is the dominant mineral secreted through sweating by horses and humans during heat stress.
Research also indicates that milk yields of heat-stressed cows have been increased
with supplemental dietary K. In addition, favorable responses have been reported by Texas researchers when supplemental K was added to the diet during hot weather.
There is also a relationship between K and Na that should be noted. High K and high Na diets produced greater milk yields than diets containing low K and high Na. For best management, it is important to note that K is not stored to any great extent within an animal's body. Combining this information wi th the fact that large amounts of K are lost through saliva, sweat and urine, it's imperative that a constant quantity of high K feeds and/or forages be supplied to replenish that lost from the animal's body, especially during heat stress periods.
When they're hot, cows need more K. The results of heat stress on cattle are easily recognized, but too many producers are often unaware of the roles of K and its deficiency symptoms.
Potassium deficiency symptoms exhibited by dairy and beef cattle include:
• Decreased feed intake • Pica (hair licking and wood chewing) • Rough hair coat • General weakness • Poor coordination • Wobbling of the hind quarters • Decreased pliability of hide • Lower blood and milk K levels • Poor heat tolerance
Dr. Preston is Professor of Animal Science, Texas Tech University, Lubbock, TX. Dr. Pratt is Extension Forage Specialist, Emeritus, Texas Agricultural Extension Service, College Station, TX. Mr. Cates is Wood County Extension Agent, Quitman, TX. Dr. Sanders is former Great Plains/Southwest Director, PPI, Stanley, KS.
12 Better Crops/Winter 1993/94
These conditions may be intensified under situations where there is a combination of limited dietary K and heat stress.
The Proof Is in the Balance Experience in east Texas has shown that
for enhanced milk production during heat stress periods of the year, bermudagrass K content should be 2.0 percent or higher on a dry weight basis. Remember, the K content of bermudagrass on many dairy and beef operations is often lower than 1.3 percent.
Table 1 shows an estimation of K intake and output of a 1,500 lb lactating dairy cow under heat stress (over 85° F) conditions assuming an average concentrate
intake of 30 lb/day and a forage intake of 20 lb/day, minus the K loss in milk, sweat, urine and feces.
Summary Under certain environmental conditions
such as heat stress and physiological conditions such as lactation, cattle nutritional requirements for K may vary dramatically. Researchers have noted that K requirements for dairy and beef cattle are higher under these conditions than previously reported. One way to off-set high K loss during heat stress is to provide forages higher in K (i.e., bermudagrass with 2 percent K). That requires adequate amounts of K fertilization. Adequate K in forage will help dairy and beef cattle tolerate heat and stave off declining milk production. •
Table 1. Estimated daily K balance for a 1,500 lb lactating dairy cow.
Estimated daily K balance (based on 1.3 percent K forage)
K Intake, lb K Output, lb K Balance
Concentrate Forage Milk Sweat Urine Feces ( ± )
0.15 0.26 0.10 0.10 0.30 0.05 -0.14
Estimated daily K balance (based on 2 percent K forage)
K Intake, lb K Output, lb K Balance
Concentrate Forage Milk Sweat Urine Feces ( ± )
0.15 0.40 0.10 0.10 0.30 0.05 0.0
Proceedings of North Central Extension-Industry Soil Fertility Conference Available PROCEEDINGS of the 23rd North Central Extension-Industry Soil Fertility Con
ference, October 27-28, 1993 in St. Louis, MO are available through the Potash & Phosphate Institute (PPI). This Conference annually brings together researchers, Extension personnel, consultants, fertilizer dealers and ag industry representatives to be updated on the latest developments in soil fertility research and education. Reports from North Dakota, South Dakota, Nebraska, Kansas, Minnesota, Iowa, Missouri, Wisconsin, Illinois, Kentucky, Michigan, Indiana, Ohio and Ontario are included along with special invited topics. Some specific items of interest in the ninth volume of this publication include: variable-rate fertilizer application; update and economics; regionalizing nutrient recommendations; field scale fertility recommendations and spatial variability; the state-of-the-art of starters; residue management effects on fertilizer use efficiency and other interesting topics.
To order a copy of this publication contact PPI, 2805 Claflin Road, Suite 200, Manhattan, KS 66502. Copies are $15 each. Copies of earlier editions of this Conference proceedings are also available on request, $15 per copy. •
Better Crops/Winter 1993/94 13
Missouri
Phosphorus and Magnesium Reduce Grass Tetany Potential
By D.G. Blevins and J . L . Sanders
Research in Texas, Kansas and Missouri indicates that adequate phosphorus (P) fertilization decreases the possibilities of grass tetany in cattle by increasing magnesium (Mg) uptake and translocation to the leaves of forages.
BOTH P AND Mg have long been recognized as important nutrients for energy transformations within the plant and for animal health, reproduction and performance. Many forage soils are characteristically low in P, and many are low to moderate in Mg levels. Research indicates that P is important in plant uptake of Mg and calcium (Ca). When increased concentrations of P are supplied to forages, plant uptake and translocation of Mg and Ca from roots to the leaves are enhanced. This relationship lowers the potential for grass tetany which affects cattle grazing lush green pastures and is related to low blood serum Mg.
Grass Tetany Grass tetany, also known as "grass
staggers" or wheat poisoning, is a serious and often fatal disorder, especially in lactating ruminants. Tetany is usually associated with a potassium (K)/Ca + Mg ratio in forage tissue that exceeds 2.2, Mg concentration less than 0.2 percent, or a Ca concentration of less than 0.4 percent. It can reach epidemic proportions during spring in some years, kill ing livestock grazing on what appears to be high quality pasture. Affected animals may show symptoms of excitability, uncoordinated walking, and stumbling or falling down. Often an animal wi l l die suddenly without showing any symptoms.
Grass tetany has been studied for years. During this time, scientists have deter
mined that the disease is linked to a shortage of Mg and sometimes Ca in forages. In laboratory and greenhouse studies, researchers have found that when sufficient P is applied, Mg and Ca uptake and movement from the roots to the leaves of the plant are enhanced. Without sufficient P, even i f there is enough Mg in the soil, Mg levels in forage tissue may not be sufficient and grass tetany may result.
Texas Researchers have studied the influence
of P fertilizers on the P, K, Ca and Mg concentrations in tissue of ryegrass, Table 1, and Coastal bermudagrass (data not shown). Applied P increased tissue Mg concentrations of ryegrass and Coastal bermudagrass in all three years of both experiments. Phosphorus also increased Ca concentrations in the leaf tissue of both species, but had a slightly depressing effect on K.
Dr. Blevins is with the Department of Agronomy, University of Missouri, Columbia. Dr. Sanders is former Great Plains/Southwest Director, PPI, Stanley, KS.
14 Better Crops/Winter 1993/94
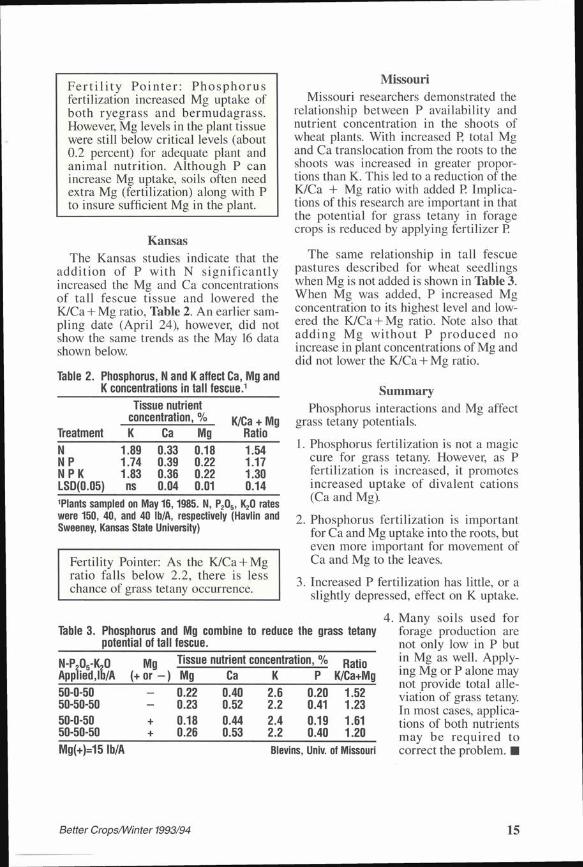
F e r t i l i t y Pointer: Phosphorus fertilization increased Mg uptake of both ryegrass and bermudagrass. However, Mg levels in the plant tissue were still below critical levels (about 0.2 percent) for adequate plant and animal nutrition. Although P can increase Mg uptake, soils often need extra Mg (fertilization) along with P to insure sufficient Mg in the plant.
Kansas The Kansas studies indicate that the
addition of P wi th N significantly increased the Mg and Ca concentrations of tall fescue tissue and lowered the K/Ca + Mg ratio, Table 2. An earlier sampling date (April 24), however, did not show the same trends as the May 16 data shown below.
Table 2. Phosphorus, N and K affect Ca, Mg and K concentrations in tall fescue.1
Treatment
Tissue nutrient concentration, %
K Ca Mg K/Ca + Mg
Ratio
N NP NPK LSD(0.05)
1.89 1.74 1.83 ns
0.33 0.39 0.36 0.04
0.18 0.22 0.22 0.01
1.54 1.17 1.30 0.14
were 150, 40, and 40 lb/A, respectively (Havlin and Sweeney, Kansas State University)
Fertility Pointer: As the K/Ca + Mg ratio falls below 2.2, there is less chance of grass tetany occurrence.
Table 3. Phosphorus and Mg combine to reduce the grass tetany potential of tall fescue.
N-P205-K20 Mg Tissue nutrient concentration, % p a t j 0
Missouri researchers demonstrated the relationship between P availability and nutrient concentration in the shoots of wheat plants. With increased P, total Mg and Ca translocation from the roots to the shoots was increased in greater proportions than K. This led to a reduction of the K/Ca + Mg ratio with added P. Implications of this research are important in that the potential for grass tetany in forage crops is reduced by applying fertilizer P.
The same relationship in tall fescue pastures described for wheat seedlings when Mg is not added is shown in Table 3. When Mg was added, P increased Mg concentration to its highest level and lowered the K/Ca + Mg ratio. Note also that adding Mg without P produced no increase in plant concentrations of Mg and did not lower the K/Ca + Mg ratio.
Summary
Phosphorus interactions and Mg affect grass tetany potentials.
1. Phosphorus fertilization is not a magic cure for grass tetany. However, as P fertilization is increased, it promotes increased uptake of divalent cations (Ca and Mg).
2. Phosphorus fertilization is important for Ca and Mg uptake into the roots, but even more important for movement of Ca and Mg to the leaves.
3. Increased P fertilization has little, or a slightly depressed, effect on K uptake.
Many soils used for forage production are not only low in P but in Mg as well. Applying Mg or P alone may not provide total alleviation of grass tetany. In most cases, applications of both nutrients may be required to correct the problem. • Blevins, Univ. of Missouri
Better CropsA/Vinter 1993/94 15
Ohio
Assessing Phosphorus Buildup in Crop Acreage-The Upper Vermilion Watershed Project
By B.W. Ward
Much has been said in recent years about the sediment and phosphorus (P) loading of our nation s rivers and lakes from the practices of agricultural producers in raising crops. The term, 'nonpoint source pollution', has been used extensively in describing agricultural (among other) contributions to water quality problems. Results of the project reported in this article emphasize the importance of gathering data before drawing conclusions.
NUTRIENTS mov ing off of a particular field site in the form of nonpoint source pollut ion w i l l impact streams that receive them. The major effect is most often noticed once nutrients reach the stagnant part of a stream, lake or pond. Phosphorus does a good job of growing plants both on land and in water.
Phosphorus closely adheres to soil particles. Therefore, keeping soil in its place wil l eliminate many of the concerns of P loading of streams and rivers. Best management practices (BMPs) that are used to stabilize soil, along with maintaining optimum levels of soil P, wi l l minimize the problem of P loading.
One of the objectives of the Upper Vermilion Watershed Project (UVWP) was to gather data from this watershed which was suspected of having an excess P buildup in cropped soils. The Ohio Environmental Protection Agency (OEPA) identified this watershed as ranking ninth out of 285 basins in agricultural P contributions to Lake Erie in the 1985 State of Ohio Phos-
RIVER WATERSHED
Figure 1. Upper Vermilion River Watershed. (Source: Ohio EPA)
phorus Strategy for Lake Erie, Figure 1. The project goal was to improve water quality of the Upper Vermilion Watershed by improving nutrient management by farmers. Two of the project objectives were as follows: 1) maintain complete records and submit timely reports of data collected and efforts spent on the program; and 2) utilize information gathered in the program to educate the public about nutrient management concerns and achievements.
Mr. Ward is Extension Agent, Agriculture and Natural Resources, Community Development and Chairman; Ohio State University Extension, Richland County, Mansfield, OH.
1:5 Better Crops/Winter 1993/94
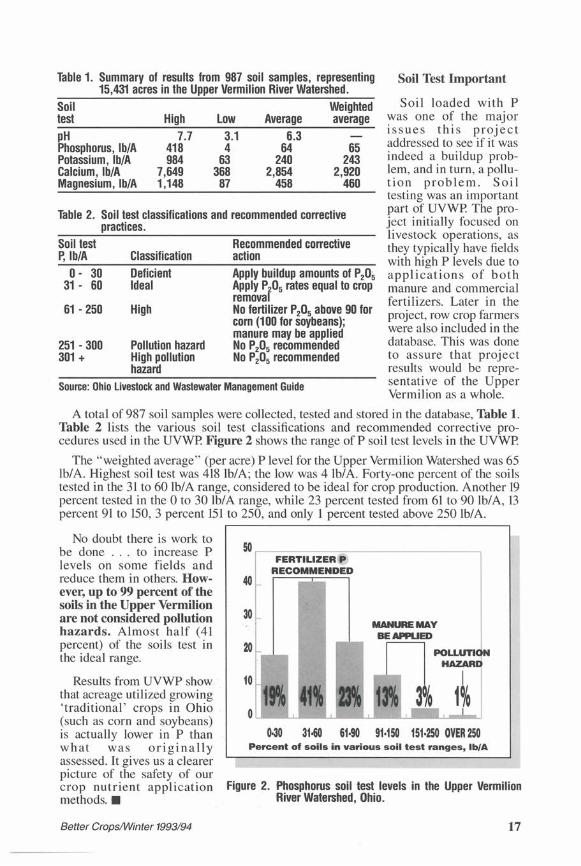
Table 1. Summary of results from 987 soil samples, representing 15,431 acres in the Upper Vermilion River Watershed.
Table 2. Soil test classifications and recommended corrective practices.
Soil test Recommended corrective P, lb/A Classification action
0- 30 Deficient Apply buildup amounts of P 20 5
3 1 - 60 Ideal Apply P 20 5 rates equal to crop removal
61 - 250 High No fertilizer P 20 5 above 90 for High corn (100 for soybeans); manure may be applied
251 - 300 Pollution hazard No P 20 5 recommended 301 + High pollution No P 20 5 recommended
hazard
Source: Ohio Livestock and Wastewater Management Guide
Soil Test Important
Soil loaded with P was one of the major issues this projec t addressed to see i f it was indeed a buildup problem, and in turn, a pollut ion problem. So i l testing was an important part of UVWP. The project initially focused on livestock operations, as they typically have fields with high P levels due to applications of both manure and commercial fertilizers. Later in the project, row crop farmers were also included in the database. This was done to assure that project results would be representative of the Upper Vermilion as a whole.
A total of 987 soil samples were collected, tested and stored in the database, Table 1. Table 2 lists the various soil test classifications and recommended corrective procedures used in the UVWP. Figure 2 shows the range of P soil test levels in the UVWP.
The "weighted average" (per acre) P level for the Upper Vermilion Watershed was 65 lb/A. Highest soil test was 418 lb/A; the low was 4 lb/A. Forty-one percent of the soils tested in the 31 to 60 lb/A range, considered to be ideal for crop production. Another 19 percent tested in the 0 to 30 lb/A range, while 23 percent tested from 61 to 90 lb/A, 13 percent 91 to 150, 3 percent 151 to 250, and only 1 percent tested above 250 lb/A.
No doubt there is work to be done . . . to increase P levels on some fields and reduce them in others. However, up to 99 percent of the soils in the Upper Vermilion are not considered pollution hazards. Almost half (41 percent) of the soils test in the ideal range.
Results from UVWP show that acreage utilized growing 'traditional' crops in Ohio (such as corn and soybeans) is actually lower in P than what was o r i g i n a l l y assessed. It gives us a clearer picture of the safety of our crop nutrient application methods. •
FERTIL IZER P RECOMMENDED
MANURE MAY
50
40
30
20
10
O U
0-30 31-60 61-90 91-150 151-250 OVER 250 Percent of soils in various soil test ranges, lb/A
POLLUTION HAZARD
23% 13% 3% 1% 1,1 I , • • • L.
Figure 2. Phosphorus soil test levels in the Upper Vermilion River Watershed, Ohio.
Better Crops/Winter 1993/94 17
Liming and Southern Crops: A Working Partnership
By W.R. Thompson and N.R. Usherwood
Soil acidity is an increasing concern in crop production. Correction of this fundamental problem by liming is essential for profitable crop production.
R E V I E W S of recent soil testing summaries indicate that the number of samples testing below pH 6.0 is increasing in Southern states, Table 1. These continuing drops in soil pH are a concern for optimum crop production and profitability and are due to several factors: crop production economics; reduced lime recommendations; reduced use of l ime ; continuing use of ammonium nitrogen (N)
Table 1. Percent of samples testing below pH 6.0 for selected southern states.
State Percent below pH 6.0
Alabama 56 Arkansas 47 Florida 60 Georgia m Louisiana m Mississippi 58 North Carolina 62 South Carolina 47 Tennessee 46 Kentucky 32
Table 2. Response of crops to liming acid soils.
from legumes, animal and poultry wastes and commercial fertilizers; and less emphasis on l im ing in educational programs.
In 1989, a similar review found that the percentage of samples testing below pH 6.0 was 49 percent in Mississippi, 46 percent in Alabama, 36 percent in Arkansas and 50 percent in Florida. One commercial soil test laboratory in the South indicates that 80 percent of all diagnostic soil samples it analyzes have a low pH.
The fundamental value of optimum soil pH in crop production has been recognized and publicized for decades. University research and demonstrations have documented that liming to correct acid soil pH produces the following benefits:
• Increased nutrient availability • Improved use efficiency of fertilizers • Increased soil microbial activity
Dr. Thompson is Midsouth Director, PPI, Starkville, MS and Dr. Usherwood is Southeast Director, PPI, Norcross, GA.
Better Crops/Winter 1993/94
Table 3. Relationship of pH, manganese toxicity and cotton yields.
Degree of toxicity Soil pH Mn level,ppm Yield reduction,%
Severe 4.2 to 4.8* 3,000 to 5,000 50 to 100 Moderate 4.6 to 5.1* 1,800 to 3,000 20 to 50 Slight 5.2 to 5.4* 1,000 to 1,800 4 to 20 None above 5.5 less than 1,000 0 to 4
^Manganese toxicity of greater or less magnitude than indicated may occur within this pH range
• Higher N fixation by legumes • Reduced toxicity of aluminum (Al) and
Crop yield responses to liming can be spectacular, as shown in Table 2. Responses vary as soil conditions vary University research has also shown that responses to liming can vary with crop varieties and their sensitivity to conditions produced by low soil pH.
MANGANESE toxicity symptoms on cotton may be related to acid soil.
Adverse effects of low pH are strongly affected by increased solubility and availability of Mn and Al , leading to plant toxicities from both elements. The result is reduced plant growth, plant death in extreme situations, and severely reduced yields. The effects of Mn toxicity on cotton yields are illustrated in Table 3.
The Solution: Liming
Liming is the only long-term solution to the problems associated with soil acidity. It is economically sound and essential for profitable crop production, including forages. Soil pH must be monitored on a regular basis, through soi l test ing. Remember, development of soil acidity is a continual process that requires repeated applications of lime over the years.
Soil testing is a dependable tool for measuring soil acidity and determining lime requirements. Soil tests are only as good as the sample, so laboratory sampling procedures should be closely followed to produce the most accurate information.
Conservation tillage systems, particularly no-till, encourage the development
Better Crops/Winter 1993/94 19
Table 4. Soil pH of surface inch after 5 years in no-till.
Control
Nitrogen source and soil pH N sol., Ammon.
Urea 28% nitrate Ammon. sulfate
6.7 5.9 5.8 5.5 4.7
Pennsylvania of an extremely acid layer, 1 to 2 inches deep, at the soil surface due to the application of N fertilizers, decomposition of crop residues and little disturbance of this accumulation zone by tillage, Table 4. This acid soil zone can depress the effectiveness of herbicides, lower the availability of plant nutrients, and damage roots of emerging seedlings. It is a good idea to monitor this surface soil pH by taking shallow soil samples, about 2 inches deep and to correct the problem by lime applications. The amount of lime needed to
neutralize the accumulated acidity may be quite small. Be sure to indicate the shallow sampling depth when these samples are sent to the lab.
Summary Proper soil pH and profitable farming
are a team. I f soil pH is extremely acid, soil fertility suffers and farm profits wi l l be lowered. Liming is a capital investment that affects crop production over several years and should be treated as such. Its total cost should not be charged against the first crop after liming.
Acid soil, infertility and low soil pH are problems that seem to be growing in magnitude. The solution to this trend requires increased emphasis on liming . . . and increased use of agricultural lime. •
Dr. W.K. Griffith Retires as PPI Eastern U.S. Program Director
Dr. W.K. Griffith
DR. W I L L I A M K. G R I F F I T H of Great Falls, VA, is ret ir ing effective March 4 from his posi t ion as Eastern Director for the Potash & Phosphate Institute (PPI). The announcement came f r o m Dr. David W. Dibb , President of PPL
"Dr. Griffith has been an effective, dedicated and highly respected leader in market development during his many years of service," Dr. Dibb stated. "He wil l certainly be missed both inside and outside of PPI. His many friends and colleagues join in wishing him continued success."
As Eastern Director, Dr. Griffith coordinated research and education programs for PPI in 14 states in the Eastern U.S. His tireless efforts encouraged greater understanding among university and USDA scientists, agribusiness, and others, helping build sound crop production systems.
A native of Henry, I L , Dr. Gr i f f i th earned his B.S. degree from Western I l l i nois University at Macomb, where he was also an All-American basketball player. He later received his M.S. in agronomy from the University of Illinois at Urbana, and the Ph.D. in agronomy from Purdue University at West Lafayette, IN.
Dr. Griffith served four years in the U.S. Navy as a weather specialist. He later worked as an assistant county agent in Arizona. He joined the staff of the American Potash Institute (now PPI) in 1960.
Through involvement in numerous organizations and associations, Dr. Griffith has contributed in many capacities. He has held several offices in the American Forage and Grassland Council, including a term as President. He received the Agronomic Service Award and the Industrial Agronomist Award of the American Society of Agronomy (ASA). He was elected a Fellow of ASA and of the Soil Science Society of America. Dr. Griffith received a special award from the Virginia Small Grains Association in 1992, recognizing a decade of leadership in improved management for soft red winter wheat production. •
Better Crops/Winter 1993/94
Dr. J.D. Beaton Retires, Dr. M.D. Stauffer Elected Vice President
for PPI International Programs DR. MARK D. STAUFFER has been
elected Vice President for International Programs of PPL He wil l assume the role of International Programs Coordinator for the Institute effective March 1, 1994. The announcement came from Dr. David W. Dibb, President of PPI. Dr. Stauffer wil l succeed Dr. James D. Beaton, who retired as of February 28,1994.
"Dr. Beaton has been extremely valuable in this important role over the past several years and his leadership wil l be missed. However, we are confident that Dr. Stauffer wil l be an able and effective successor," Dr. Dibb explained.
Dr. Stauffer joined the PPI staff in 1988 as Western Canada Director and in 1989 moved to London, Ontario, to serve as Director for Eastern Canada, Michigan and Ohio. He will move to Saskatoon, Saskatchewan, to assume the duties of International Programs Coordinator and President of PPIC.
A native of Ontario, Dr. Stauffer took his undergraduate training at the University of Guelph and earned his Doctorate in Agronomy at the Virginia Polytechnic Institute and State University. He has
worked in agricultural research, sales and management in the United States and Canada. He was a research scientist w i t h a major agricultural chemical company in Regina, Saskatchewan, before j o i n i n g the PPI staff. Dr. M.D. Stauffer
A native of British Columbia, Dr. Beaton earned his B.S.A. and M.S.A. degrees from the University of British Columbia and received his Ph.D. at Utah
State University. Early in his career, he was an Instructor of Soil Science with the University of British Columbia. He also served as a researcher with Agriculture Canada for six years. Dr. Beaton was employed with Cominco Ltd. for 11 years, reaching the position of Chief Agronomist. He later joined the staff of The Sulphur Institute, serving for over five years as Director of Agricultural Research.
Dr. Beaton began his tenure with PPI/ PPIC in 1978 as Western Canada and Northwest U.S. Director. In 1988, he was named Vice President, International Programs, PPI, and President, PPIC. He was promoted to Senior Vice President of PPI in 1989. PPI/PPIC international programs have flourished under his direction.
A prolific researcher and writer, Dr. Beaton's papers and presentations embrace a wide agronomic spectrum. He is coauthor of the widely used textbook, Soil Fertility and Fertilizers, now in its fifth edition.
For his many achievements, Dr. Beaton has been honored with numerous awards. He is a Fellow of the Canadian Society of Soil Science, the Soil Science Society of America, and the American Society of Agronomy (ASA). He is also a recipient of the Agronomic Service Award of ASA and of the Agronomy Merit Award. In 1990, Dr. Beaton was elected a Fellow of the Agricultural Institute of Canada. He recently received the Award of Merit of the Western Canada Fertilizer Association. •
Dr. J.D. Beaton
Better Crops/Winter 1993/94 21
Oregon Research
Take-all Root Rot in Winter Wheat By John M. Hart and Neil W. Christensen
Researchers have developed a package of best management practices (BMPs) for high yield wheat production in western Oregon. A major problem with wheat following wheat in the area is take-all root rot which can reduce yields as much as 50 percent. The BMPs developed focus on controlling this pathogen as a basic part of the management program. Recommendations are divided into: preplant-liming and stubble management, and growing season-fertilization and weed and disease control.
T A K E - A L L ROOT ROT of wheat is common in western Oregon whenever consecutive crops of wheat are grown. This disease may reduce yield by as much as 50 percent in second or third winter wheat crops.
Take-all is caused by the soilborne fungus Gaeumannomyces graminis var. tritici (Ggt) which infects the roots, crown and basal stem of plants. Symptoms are most obvious near heading and include stunting or uneven growth, poor tillering, blackened roots and crowns, premature ripening, and white heads with few kernels. Fungicides and resistant cultivars are not viable options for disease control.
Where take-all is anticipated, specific soil and crop management practices can be used to minimize yield loss. Important management practices include cropping history and rotation, weed control, stubble management, planting date, soil pH and liming, fall and spring fertilization, and control of other diseases.
The authors acknowledge the contributions of the late Thomas L. Jackson. For over 30 years, Dr. Jackson promoted Oregon agriculture through practical scientific endeavors as professor of soil science at Oregon State University. In 1976, Dr. Jackson observed that wheat plots fertilized with ammonium chloride were less affected by take-all than were plots fertilized with other N sources. This observation was the starting point for research that developed the management program described in this article.
Cropping History and Rotation-Crop rotation is the best way to control take-all. The pathogen persists in infected host debris which serves as the primary source of inoculum for infection of subsequent wheat crops. Survival of the fungus in the absence of a host is poor. A 1-year break from wheat or barley is usually sufficient to reduce the take-all risk to an insignificant level. Suitable break crops include oats, corn, beans, vegetables, oilseed crops and annual legumes for seed.
Disease severity and yield loss can be substantial in second, third and fourth wheat crops, with the worst take-all usually occurring in the third consecutive crop. Take-all becomes less severe, and yields usually increase, with the fifth or sixth successive wheat crop.
Weed Control and Stubble Manage-ment-The take-all fungus invades wheat-grass and quackgrass (Agropyron spp.\ bromegrass (Bromus spp.) and bentgrass
DR. T.L. JACKSON (now deceased) is shown as he examined wheat roots for evidence of take-all infection.
Dr. Hart is Extension Soil Specialist and Dr. Christensen is Professor of Soil Science in the Department of Crop and Soil Science, Oregon State University, Corvallis, OR.
22 Better Crops/Winter 1993/94
ROOTS shown in photo exhibit little to severe infection by take-all fungus.
{Agrostis spp.\ as well as wheat and barley. These weeds along with volunteer wheat and barley may contribute to unexpected disease outbreaks when first-year wheat follows a legume crop infested with host grasses. Killing grassy hosts with tillage or herbicides a few months before planting wheat may not reduce the risk of take-all since the fungus persists in host debris. We recommend advance, long-term control of grassy hosts for rotations including wheat.
When wheat wil l be planted following wheat, stubble should be chopped to reduce size before plowing to a depth of 8 inches to bury host crop residue, the primary inoculum source. This delays or minimizes seedling infection and increases the probability that other control measures wil l slow disease progress.
Soil pH and Liming-Increasing the pH of moderately acid soils through liming generally increases the severity of take-all and reduces grain yield, Table 1. Other management practices such as application of ammonium-N (NH 4
+) plus chloride (CI)
in the spring are more effective in controlling take-all when soil pH is near 5.5. In contrast, soils with pH 5.2 or less, especially those with low phosphorus (P) soil tests, may respond favorably to liming. Liming an acidic, low-P Nonpareil soil . . . pH 5.2, 12 parts per million (ppm) Bray P-l P . . . increased yield of third-year wheat from 30 to 64 bu/A and decreased the percentage of whiteheads (a symptom of take-all) from 63 to 14 percent. When pH-sensitive crops are grown in rotation with two or more years of wheat, lime should be applied after the last wheat crop is harvested.
Planting Date-On well-drained valley-floor soils, delaying planting until late October can reduce early infection of seedlings and increase grain yield, especially i f other disease control measures are practiced. Care should be taken, however, because of the risk of fall rains. Planting on valley-floor soils with reduced drainage or on hill soils should not be delayed. A survey of 126 growers reporting results from 495 fields showed that planting after October 12 reduced yields by 14 to 26 bu/A on hill or poorly-drained soils.
Fertilizer Management-Nutrient deficiencies at any time during the growing season wil l increase the severity of take-all. Ensuring that nitrogen (N), P, sulfur (S) and potassium (K) are adequate at planting is especially important. Nitro-gen-P-S or N-P-K-S fertilizers should be banded with the seed when the risk of take-all is high.
Ammonium-N, rather than nitrate (N0 3~), should be applied because uptake of N H / - N creates an environment favor-
Table 1. Liming (soil pH) and N fertilizer source affect winter wheat grain yield on moderately acid soils with a high risk of take-all.
able to the growth of microorganisms antagonistic to the take-all fungus. Sulfur is more often deficient for wheat in western Oregon than is K and should be routinely applied at planting. Phosphorus should be routinely applied since P deficient plants are more susceptible to take-all, and infected seedlings have poorly functioning root systems. When take-all is present, wheat wil l respond to banded P fertilizer on soils where no response would be expected in the absence of take-all.
Much like the yield response to soil pH, response to banded P is also affected by other factors. Planting date and CI application affected yield response from banded P on a soil with a high soil test P level, Table 2. The highest yield (but not always significantly higher) at either planting date was obtained with a band application of P and more than 100 lb Cl/A. Comparison of yields with 435 vs 35 lb Cl/A emphasizes the need for adequate CI before the banded P is effective. Grain yields from later planting on well-drained soils tend to be higher.
These data also illustrate that the entire management package must be adopted for maximum benefit.
Sources of spring-topdressed N can influence the severity of take-all and grain yield. Studies have shown that yields were generally higher with ammonium chloride (NH4C1) than
with ammonium nitrate (NH 4 N0 3 ) or urea. Fertilization with NH4C1 compared to ammonium sulfate [(NH 4 ) 2 S0 4 ] also significantly increased grain yield in seven of nine growing seasons, Table 3. This compares favorably with results of a survey of 126 growers who reported average CI responses of 12 bu/A.
Since NH4C1 is not commonly available, a combination of (NH 4 ) 2 S0 4 plus potassium chloride (KCI) to supply ammonium-N and CI is recommended for areas likely to be infected with take-all. Sufficient KCI to supply at least 100 lb C l / A should be topdressed w i t h (NH 4 ) 2 S0 4 by Feekes Growth Stage 5.
Control of Other Diseases-Other common diseases that may need control measures include strawbreaker foot rot caused by Pseudocercosporella herpotrichoides and Septoria leaf and glume blotches caused by Septoria tritici and S. nodorum. Plants infested with take-all are commonly much more susceptible to Septoria.
Table 3. Spring-topdressed N fertilizer effects on wheat yield.
Year of harvest (no. of experiments)
Spring N source
1978 (2)
1980 (3)
1981 (3)
1983 (1)
1984 (1)
» bu/A»
1986 (4)
1987 (2)
1988 (2)
1989 (1)
Urea - - - - - 111a 93a 86a 144ab
NH4N03 - - 85a 109b 94ab 93b 141ab
(NH4)2S04 54a 88a 66a 52a 106b 111a 99b 98b 138a
NH4CI1 66b 107b 80b 70b 106b 111a 107c 116c 151b
'Equivalent to (NH4)2S04 (21-0-0) plus KCI (0-0-60) to supply at least 100 lb Cl/A N rates varied from 120 to 160 lb/A Yields in a column followed by the same letter are not significantly different (P=0.05)
24 Better Crops/Winter 1993/94
Summary
Crop management plays an important role in controlling take-all induced yield losses and reduced profitability. But remember, adoption of a complete management package produces the best results . . . and best returns. Summarized recommendations include:
Pre-plant management • Liming. A soil pH of 5.5 is desirable for
combating take-all. Apply lime only i f the soil pH is 5.2 or less.
• Stubble. Chop stubble and plow deeply to bury the inoculum.
Planting
• Planting date. On well-drained valley-floor soils, delay planting until late October i f possible. Do not delay planting beyond mid-October on hill soils or valley-floor soils with reduced drainage.
• Fertilization. Band 20 to 30 lb N/A as ammonium, 30 to 50 lb P 20 5/A and 10 to 15 lb S/A. Apply 25 to 30 lb K 2 0 /A i f a soil test indicates the need for K.
Growing season
• Fertilization. Apply 140 to 180 lb N/A as (NH 4) 2S0 4 plus 100 lb Cl/A as KCI before Feekes growth stage 5. Alternatively, apply 40 lb N/A and 100 lb CI/ A at late tillering (Feekes 4; mid-Feb.) and the remaining N within 3 to 4 weeks, but before jointing (Feekes 6).
• Weed Control. Control weeds to minimize competition with wheat for nutrients and moisture.
• Disease Control. Control leaf diseases such as Septoria and other root diseases by using resistant varieties or fungicides to ensure maximum benefit from other aspects of this management plan to reduce yield loss from take-all.•
1993 Southern Soil Fertility Conference Proceedings Available
PROCEEDINGS of the 1993 Southern Soil Fertility Conference October 12-13, Memphis, TN, are available through PPI. This annual Conference reviews soil fertility and crop production research and educational activities for the region extending from Texas to North Carolina. Specific topics of interest in Volume 4 of this publication include an accreditation program for soil and plant analysis laboratories; effects of continuous no-till corn production on soil test levels and nutrient removal; boiler wood ash as a soil liming material; no-till cotton research summaries and more.
Copies of this and earlier volumes are available from Potash & Phosphate Institute, 2805 Claflin Road, Suite 200, Manhattan, KS 66502 at a price of $15 per copy. •
Soil Fertility Manual Videotapes Now Available
VIDEOTAPES are now available to accompany the popular Soil Fertility Manual. PPI has prepared videotapes for each of the 10 chapters, varying from 15 to 25 minutes in length. The tapes are VHS format and are available by individual chapter at a cost of $20.00 each or as a complete set for $150.00.
Discounts are available to members of PPI, contributors to FAR, and to university and government agencies.
For additional information or to place an order, contact: Circulation Department, PPI, 655 Engineering Drive, Suite 110, Norcross, GA 30092; phone (404) 447-0335, fax (404) 448-0439. K
Better Crops/Winter 1993/94 25
Potassium Interactions and Balanced Plant Nutrition
By N.R. Usherwood
Potassium (K) is well known for its role in balanced plant nutrition. But, is it well understood? Probably not. A review of the research-based reasons might be helpful when making decisions regarding K fertilizer use.
B A L A N C E D NUTRITION of plants should be a high priority management objective for every grower. This holds for nursery and ornamental plants just as much as it does for frui t trees or the feed and fiber crops. Nutrition is just as vital for a plant as it is for a high producing dairy cow. Both require a balanced nutrition program formulated to provide specific needs for maintenace and for expected production performance. Properly nourished plants and animals grow stronger, produce more consistently, have better disease resistance, and are more tolerant to stress.
Potassium requirements for a balanced nutrition program can be crop, site and management specific. Thus, to obtain the optimum return from this investment, it helps to understand the benefits from proper supply as well as the problems associated with a shortage. To provide plant K needs, then, the nutrient reservoir must be monitored frequently by soil testing and resup-plied from fertilizer sources. The objective is clear but challenging. It is to eliminate nutrient shortage as a condition which limits the development of a plant's fu l l genetic potential.
What Is Potassium's Role? Potassium is a "work horse" plant
nutrient. Perhaps this is because it is not bound into any specific plant compound. Therefore, K is free to travel and to wheel and deal within the plant almost at wi l l . Since K is directly or indirectly involved
in most plant processes, it should not be surprising that K nutrition is closely tied to each of the following important crop functions. These are reasons why a shortage of K can result in lost crop yield, quality and profitability.
• Regulation of enzyme systems . . . K is known to influence more than 60 enzyme reactions. Thus, K is associated with almost every major plant function
• Photosynthesis . . . K regulates the carbon dioxide supply by control of the opening of leaf pores (stomates)
• Respiration . . . K improves the efficiency of plant use of sugars for maintenance and normal growth functions
• Translocation . . . K moves sugars from sites of photosynthesis to cotton bolls or other storage depots
• Root development. . . K works with phosphorus to stimulate and maintain rapid root growth of seedling plants
• Legume nodulation . . . K is needed for optimum nodule formation and efficient fixation of N by legume plants
• Winter hardiness . . . K serves as an "anti-freeze" by lowering the freezing point of the cell sap in roots and by building plant tolerance to low temperature stress
• Protein synthesis . . . K stimulates the synthesis of true protein in plants from the amino acid building blocks
Dr. Usherwood is Southeast Director of PPI, Norcross, GA.
26 Better Crops/Winter 1993/94
• Disease resistance . . . K improves plant health and natural resistance to many leaf, root and shoot diseases
• Insect tolerance . . . K-healthy plants better tolerate pests and often recover more quickly from root and shoot injury inflicted by nematodes and insects.
Potassium Strengthens Crop Use of Other Inputs
Potassium's involvement in so many functions is the very reason why it is a vital part of any balanced nutrition program. It improves the use of nitrogen (N) and other inputs which are also responsible for developing a plant's genetic potential into reality at harvest time. Following are a few examples which illustrate how N and K share responsibilities.
Converting into amino acids and proteins. Too much N or too little K can result in a back-up of the protein building blocks. These can increase susceptibility to diseases on crops like corn. An imbalance can also lower the quality of forage crops or it can reduce use efficiency of N and K by others.
Improving crop disease resistance. Nitrogen teamed with too little K sets the stage for disease problems like Fusarium stalk rot in corn or some of the leaf rust problems on wheat and other small grains. In Kansas, for example, potassium chloride (KCI) improved wheat tolerance to disease and that helped to boost grain yield by nearly 10 bu/A.
Improving fruit development and quality. Potassium is needed for the production of carbohydrates and for proper balance of these with N for best fruiting. The symptoms of a shortage are poorly filled grain on the tip end of an ear of corn, dropped fruit under an orange tree, low test-weight in small grains, or perhaps dockage due to shriveled and diseased soybean seeds.
Regulating photosynthesis. A shortage of K keeps plant leaf pores from opening properly and restricts the flow of air and
carbon dioxide into the leaf. This slows photosynthesis and the production of sugars. Nitrogen, in the meantime, is also helping to regulate this process.
Interacting Nutrients Have Many Plant Functions in Common
Potassium and 15 other nutrients are equally essential for plant growth. How K interacts with each nutrient is best illustrated by the number of crop functions they have in common. Such interactions are the reasons why nutrient balance is so important. The following are examples.
Phosphorus and potassium • root development • photosynthesis • regulation of enzymes • seed formation • crop maturity • energy transfer • crop winter hardiness
Sulfur and potassium • photosynthesis • winter hardiness • nitrogen fixation • chlorophyll formation • enzyme system and vitamin
development • amino acids and protein formation
Magnesium and potassium • photosynthesis • chlorophyll formation • plant respiration • seed formation • enzyme systems • phosphate metabolism • forage quality • sugar and nutrient transport
Calcium and potassium • enzyme systems • fruit quality • cell walls and plant structure • nitrate reduction during protein
formation • needed by Rhizobium and for N
fixation
Micronutrients and potassium • nitrogen metabolism and fixation
(molybdenum, manganese)
Better Crops/Winter 1993/94 27
• chlorophyll formation (iron, zinc, manganese)
• enzyme systems (zinc, molybdenum, manganese, iron, copper)
• cell development (boron, iron) • respiration (copper)
How Can These Interactions Be Harnessed?
Consider the following guidelines for building plant nutrition facts into existing farm management systems.
Use available knowledge. It is important to know what each nutrient is capable of doing for the crop and to recognize when it is in short supply. Unexpected plant growing conditions can restrict crop use of the soil nutrient supply. Early recognition of a nutrient shortage often allows in-season adjustments.
Establish a quality soil analysis program. This best management practice (BMP) is a good starting point. Sampling is critical, but so is recent, optimum-yield, specific-crop correlation information. Remember, a highly productive soil must also be highly fertile.
Obtain total crop nutrient requirement facts. These data are most helpful when they also indicate nutrient need by growth stage, by yield level, and for special market quality requirements. These data can also be used with the soil test results when establishing fertilizer needs.
Consider special soil, climate, and management conditions. These are equally important in establishing crop nutrient needs. Consider nutrient leaching loss from sandy soils, risk of low temperature crop injury, use of manure, availability of irrigation, or use of foliar fertilization.
Coordinate nutrient management with tillage practices. Reduced tillage can
change surface soil characteristics which influence root growth and nutrient management. For example, an increase in crop residue on the soil surface can lower soil temperature, increase the soil moisture level, and result in a build-up of P and soil acidity near the soil surface.
Time fertilizer applications with crop need. Time, rate and method of application of plant nutrients are crop and site specific. Computers now allow precision and prescription fertilization programs to be developed. They provide the capability for considering more of the variables, such as nutrient interactions, which influence plant nutrition and fertilizer use.
Maintain an environmental awareness. Top farmers are skilled managers of inputs needed for optimum crop yield, quality, profitability and protection of the soil and water resources. Practices which eliminate soil erosion also prevent fertilizer P from getting into surface waters. By using BMPs and developing a balanced nutrition program, most problems with N loss can be avoided.
Properly utilized, fertilizer protects the soil from erosion and improves groundwater quality by improving rapid seedling development, early vegetative cover of the soil, and optimum production of roots and shoots which become soil protecting crop residue.
Turn challenges into opportunities. Today's challenges at the farm level require more attention to the details of doing business than ever before. Potassium's specific functions in plant development and its interactions with other nutrients and practices illustrate well its vital role in a truly sustainable agriculture. •
Batch Applications of Phosphorus Can Boost Wheat Profits
BROADCASTING large, single applications of phosphorus (P) can be more profitable over a several-year period than smaller annual additions of seed-placed P
The figure above used cost-benefit analysis to compare the net present value of return between single broadcast applications and consecutive annual seed-placed P treatments. In this t r i a l , a onetime investment for 160 lb P 20 5/A gave greater profits than any of the small annual applications over a five-year period.
Banding phosphate with or near the seed often results in greater fertilizer efficiency and crop response than broadcast and incorporated P. However, the agronomic advantages of banding compared to broadcasting are apparent at only low soil test levels or low application rates.
Studies in the northern Great Plains have shown that residual effects of fertil
izer P can last for several years. One Saskatchewan study found the five-year cumulative grain yield from a single broadcast P application of 160 lb P 20 5/A was greater than 40 lb P 2O s/A seed-placed in each of five crop years. Combining a single P broadcast application with annual seed-placed P produced a better yield response than either treatment applied alone. The highest yields required 360 lb P 20 5/A (160 lb/A broadcast initially and 40 lb/A applied annually) over the five-year period.
Near maximum yields were produced by an initial broadcast application of 80 lb P 20 5/A plus 20 lb P 20 5/A applied with the seed each crop year.
Building and maintaining high levels of soil P is a good investment, a capital improvement to the land and a key to higher profits. •
This message is available on a 3V2 " X 7V2 " information card. This is one of a series of publications on Profit Protection Ideas, a service of PPI, 655 Engineering Drive, Suite 110, Norcross, GA 30092-2821. Phone (404) 447-0335.
Better Crops/Winter 1993/94 29
Environotes from TVA By John E . Culp
MORE THAN 60 R E T A I L E R S in 27 states are working with the Tennessee Valley Authority (TVA) to research and demonstrate improved technologies and strategies to prevent contamination of surface and groundwater from plant nutrients and agrichemical mixing operations. These include model site demonstrations that TVA initiated three years ago and individual technology demonstrations.
Specific practices are being introduced, such as innovative structures to contain spills from mixing and rinsing operations. New construction methods are needed, and many of these are being tested at agricultural dealer sites. Progress is being made in such areas as concrete strength and cost-effective containment structures.
Some states require monitoring of releases from mixing sites. TVA is working with retailers to test and commercialize monitoring techniques. Another growing concern is stormwater containment. TVA and cooperating agricultural retailers are demonstrating ways to capture stormwater and to use or dispose of it in the most economical way.
Poultry Litter Use About 20 states recognize poultry pro
duction as one of the four primary agricultural income generators for farmers. It is an impressive $30 billion a year industry. The downside, however, is the huge volume of poultry litter and other poultry wastes and by-products that must be disposed of in environmentally acceptable ways.
TVA has recently established a compost research and demonstration facility. The idea is to develop composting as an industrial process, generating products with controllable properties and designated uses. Poultry litter, a significant potential pollutant of lakes, streams and groundwater, is the primary component of the compost project.
Researchers are investigating the use of nutrient-enhanced broiler litter as an organic-based plant nutrient source for turf . Comparisons are being made between fresh and composted poultry litter combined with a nitrification inhibitor and used on turf and agricultural crops. The potential for concentrating the litter and promoting it as a plant nutrient source for bulk blending and other commercial operations is also being considered. Private organizations, the Environmental Protection Agency (EPA), and others appear to be interested in looking at this possibility.
Another way TVA is approaching the poultry litter problem is the creation of a Poultry Water Quality Consortium. Other partners in the activity include the private industry through the Southeastern Poultry and Egg Association, the EPA and USDA's Soil Conservation Service. The consortium is promoting communication between the industry and government agencies on quality and by-product use issues.
River Action Teams One of TVA's major corporate goals is
to make the Tennessee River system the cleanest river system in the nation by the year 2000. The agency is conducting an extensive Clean Water Initiative in the Tennessee Valley which includes parts of seven states-Alabama, Georgia, Kentucky, Mississippi, North Carolina, Tennessee and Virginia.
Centerpiece of the Clean Water Initiative are the River Action Teams (RAT). There are 35 watershed areas in the 125-county area of 41,000 square miles. The plan is to have a team in each of these areas to help build alliances and programs to solve nonpoint source and point source pollution problems. •
Mr. Culp is with the National Environmental Research Center, Tennessee Valley Authority, Muscle Shoals, A L 35660.
Better Crops/Winter 1993/94
Dr. H.F. Reetz Honored as Fellow of American Society of Agronomy n
DR. HAROLD F. R E E T Z , JR., Mid west Director of the Potash & Phosphate Institute (PPI) has been elected a Fellow of the American Society of Agronomy (ASA). The award was presented at the ASA's 1993 annual meeting recently in Cincinnati.
Dr. Reetz earned degrees from the University of Illinois and Purdue University. His research has focused on corn production and environmental interactions, with emphasis on high yield management systems. He has served as Chair of Divisions A-3 (Agroclimatology and Agronomic Modeling) and S-8 (Fertilizer Management and Technology); is Co-founder and Chair of ASA's Software Scene; Chair of the Electronic Communications Feasibility Committee; and Chair
of the Agro nomic Service Award Committee. Dr. Reetz also has served as Associate Editor of Agronomy Journal.
The Society has been electing outstanding members to the position of Fellow since 1924. Friends and colleagues within the Society nominate worthy members and the ASA Committee on the Nomination of Fellows, with the ASA Past President acting as nonvoting chair, rank the nominees. Final election is made by the ASA Executive Committee. •
Dr. H.F. Reetz
Dr. B.C. Darst Elected as Fellow of Soil Science Society of America
DR. B .C. DARST, Executive Vice President of the Potash & Phosphate Institute (PPI) and President of the Foundation for Agronomic Research (FAR), has been elected a Fellow of the Soil Science Society of America (SSSA). He was honored at the 1993 annual meeting of the Society recently in Cincinnati.
Dr. Darst earned degrees from Oklahoma State University and Auburn University. He directs the Communications Group at PPI and represents the Institute internationally in environmental affairs. As President of FAR, he manages day-to-day operations and is primarily
responsible for fund-raising act iv i t i e s of the Foundation.
Dr. Darst is a Fellow of the American Society of Agronomy, recipient of the Medallion Award Dr. B.C. Darst
from the American Forage and Grassland Council, and is a member of the Executive Committee of the Council for Agricultural Science and Technology. •
BETTER CROPS WITH PLANT FOOD FALL 1993
YOU DO US A FAVOR
AND
WE WILL DO A FAVOR FOR YOU
(But your favor has to come first.)
Did You Return A Response Card? T H E previous issue of Better Crops With Plant Food (Fall 1993)
included a response card to indicate i f you request to be on our mailing list. The cards are being processed. I f you responded, we thank you.
If you did not return the card yet, please don't forget. Or, simply clip or copy the mailing label on back cover and send to us. (If there is no label on your magazine, you do not need to send a response. You may be receiving Better Crops through a group request.)
Send to: Circulation Manager, Better Crops, PPI, 655 Engineering Drive, Suite 110, Norcross, GA 30092-2821. Fax: 404-448-0439. •
Better Crops/Winter 1993/94 31
Is Your Underwear Safe? Public radio recently featured a program on use of organically grown cotton for
wearing apparel. Though the cost of cotton and clothing production is much higher, the demand currently exceeds the supply. The demand comes from those who fear health problems i f they wear clothes produced from cotton grown with "synthetics." (I 'm lucky to have survived more than 81 years of use of such "poison" undergarments).
Actually, there is no scientific research to support such concerns, but then research is slow, and who can afford to wait for it when confronted with this life-threatening menace?
In the broadcasts, this entire "pure cotton" issue was frequently associated with sustainable agriculture and environmental protection, though the relationship was quite hazy.
Get used to environmental protection. It's part of life. We all must stand behind environmental concerns for pollution and land destruction. Fortunately, efficient high yield agriculture is the friend of the environment. It permits production on the better lands, while saving wetlands and the poorer, erodible areas for wildlife, trees and pasture.
High yields provide more cover, allow less runoff, and build up soil organic matter. Fertilizer . . . whether organic or inorganic . . . is essential to meet these goals.
You know that and I know that, but the facts are not always being told by some. •