May 31, 2018 Abdullah A. Alrayes Riyad Capital is licensed by the Saudi Arabia [email protected]Capital Market Authority (No. 07070-37) +966-11-203-6814 Better Days Ahead We update our 2018-2020 outlook on Saudi Arabia Fertilizers Co. (SAFCO) and raise our 12-month target price to SAR 74.00 (earlier SAR 65.00) on better earnings expectations after a tough year in 2017. This is driven by a modest recovery in urea price forecasts for 2018 coupled with higher production levels due to less scheduled shutdowns in 2018 compared with last year. Stable performance after the ammonia reliability enhancement project at SAFCO 3 will also help and lead SAFCO to better revenues levels in 2018. Better topline on higher selling prices will expand gross margins to 52%. SAFCO’s associate, Ibn-Baytar, is also expected to post higher earnings (due to recovery in urea prices), which will further support SAFCO bottomline. We value SAFCO using a combination of DCF and DDM methods and raise our target price to SAR 74.00. We upgrade the stock to a Buy. Higher prices and operating rates to drive revenues We expect revenue growth of +5.5% CAGR over the next 5 years as urea prices are expected to witness a decent recovery in the coming years as we believe it has already seen its worst in 2016. Recovery has already begun as prices went up from USD 214/ton in 2016 to USD 235/ton in 2017. In addition, operating rates are expected to increase compared with last year as the company completed its ammonia reliability enhancement project at SAFCO 3. Scheduled shutdowns in 2018 are likely to be limited (SAFCO 2 for 7 days in 2Q2018 and SAFCO 3 for 9 days). Thus, expect revenues to increase to SAR 3.2 billion in 2018 compared with SAR 2.8 billion in 2017. We believe demand from Asia Pacific markets will drive up volume sales as China’s exports are expected to decline in 2018 benefiting SAFCO, as most of its sales are concentrated in Asia-Pacific markets (representing 67% of total). Expect earnings recovery Net margin decreased significantly from 71% in 2014 to 32% in 2017, as the contribution from Ibn-Baytar has not been up to the mark on weak trends in the fertilizers market. With a better outlook, we expect SAFCO’s net income at SAR 1.38 billion for 2018 (Ibn-Baytar profits will increase by 5.1% in 2018). This rise in earnings will lead to net margins recovering to 43%. As for Ibn-Baytar acquisition, we lean more towards the scenario that SAFCO will fund it internally. SABIC’s direct share in Ibn- Baytar is worth approximately SAR 677 million. According to our assumptions, SAFCO can fund it internally with an expected cash flow for 2018 and 2019 of SAR 818 million and SAR 984 million respectively. However, this may give less room for SAFCO to increase its dividend in the short-term. Raise target price to SAR 74, upgrade to Buy We value SAFCO using a combination of DCF and DDM methods and raise our target price to SAR 74.00. With a +19.7% upside and a dividend yield of 3.2%, we upgrade the rating to a Buy. Summary Forecasts and Ratio's FY Dec 31 (SAR mln) 2016 2017 2018 E 2019 E 2020 E Revenue 2,856 2,759 3,249 3,390 3,478 EBITDA 1,441 1,304 1,669 1,804 1,905 Net Income 1,036 879 1,380 1,548 1,659 EPS (SAR) 2.49 2.11 3.31 3.72 3.98 DPS (SAR) 2.50 1.75 2.00 3.00 3.50 P/E (x) 28.4x 33.5x 21.9x 19.5x 18.8x P/B (x) 4.4x 4.3x 4.0x 3.8x 3.6x EV/Sales (x) 9.8x 10.6x 9.3x 8.7x 8.5x EV/EBITDA (x) 19.4x 22.4x 17.9x 16.3x 15.7x SAUDI ARABIA FERTILIZERS CO. (SAFCO) Transfer of Coverage Rating Buy 12-Month Target Price SAR 74.00 Expected Total Return Price as on May-30, 2018 SAR 61.80 9 Upside to Target Price 19.7% Expected Dividend Yield 3.2% Expected Total Return 22.9% Market Data 52 Week H/L SAR 73.1/57.0 Market Capitalization SAR 25,746 mln Shares Outstanding 416.6 mln Free Float 41.6% 12-Month ADTV(000) 201.0 Bloomberg Code SAFCO AB 1-Year Price Performance Source: Bloomberg Shareholders SABIC 42.99% GOSI 10.54% Public Float 46.49% 70 80 90 100 110 120 130 M J J A S O N D J F M A M SAFCO TASI -10% -5% 0% 5% 10% 15% 20% 25% 30% 6M 1Y 2Y SAFCO TASI
Transcript
May 31, 2018
Abdullah A. Alrayes Riyad Capital is licensed by the Saudi Arabia
Better Days Ahead We update our 2018-2020 outlook on Saudi Arabia Fertilizers Co. (SAFCO) and raise our 12-month target price to SAR 74.00 (earlier SAR 65.00) on better earnings expectations after a tough year in 2017. This is driven by a modest recovery in urea price forecasts for 2018 coupled with higher production levels due to less scheduled shutdowns in 2018 compared with last year. Stable performance after the ammonia reliability enhancement project at SAFCO 3 will also help and lead SAFCO to better revenues levels in 2018. Better topline on higher selling prices will expand gross margins to 52%. SAFCO’s associate, Ibn-Baytar, is also expected to post higher earnings (due to recovery in urea prices), which will further support SAFCO bottomline. We value SAFCO using a combination of DCF and DDM methods and raise our target price to SAR 74.00. We upgrade the stock to a Buy.
Higher prices and operating rates to drive revenues We expect revenue growth of +5.5% CAGR over the next 5 years as urea prices are expected to witness a decent recovery in the coming years as we believe it has already seen its worst in 2016. Recovery has already begun as prices went up from USD 214/ton in 2016 to USD 235/ton in 2017. In addition, operating rates are expected to increase compared with last year as the company completed its ammonia reliability enhancement project at SAFCO 3. Scheduled shutdowns in 2018 are likely to be limited (SAFCO 2 for 7 days in 2Q2018 and SAFCO 3 for 9 days). Thus, expect revenues to increase to SAR 3.2 billion in 2018 compared with SAR 2.8 billion in 2017. We believe demand from Asia Pacific markets will drive up volume sales as China’s exports are expected to decline in 2018 benefiting SAFCO, as most of its sales are concentrated in Asia-Pacific markets (representing 67% of total).
Expect earnings recovery Net margin decreased significantly from 71% in 2014 to 32% in 2017, as the contribution from Ibn-Baytar has not been up to the mark on weak trends in the fertilizers market. With a better outlook, we expect SAFCO’s net income at SAR 1.38 billion for 2018 (Ibn-Baytar profits will increase by 5.1% in 2018). This rise in earnings will lead to net margins recovering to 43%. As for Ibn-Baytar acquisition, we lean more towards the scenario that SAFCO will fund it internally. SABIC’s direct share in Ibn-Baytar is worth approximately SAR 677 million. According to our assumptions, SAFCO can fund it internally with an expected cash flow for 2018 and 2019 of SAR 818 million and SAR 984 million respectively. However, this may give less room for SAFCO to increase its dividend in the short-term.
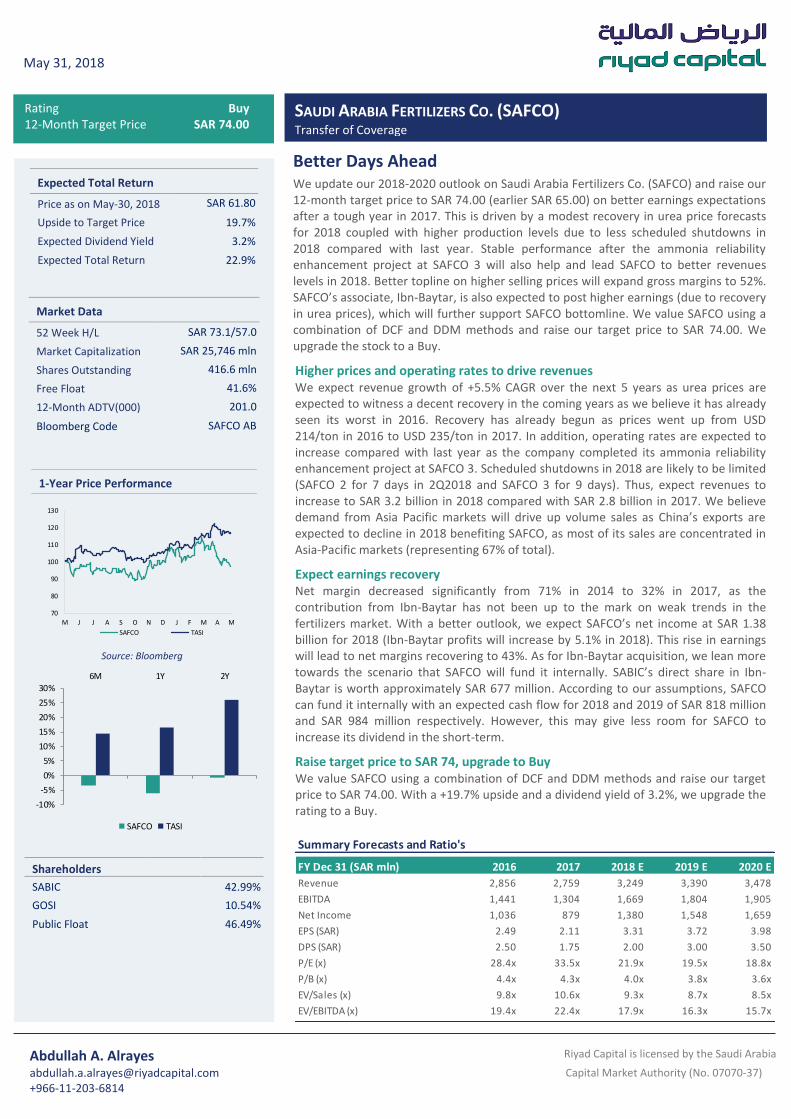
Raise target price to SAR 74, upgrade to Buy We value SAFCO using a combination of DCF and DDM methods and raise our target price to SAR 74.00. With a +19.7% upside and a dividend yield of 3.2%, we upgrade the rating to a Buy.
Summary Forecasts and Ratio's
FY Dec 31 (SAR mln) 2016 2017 2018 E 2019 E 2020 E
Revenue 2,856 2,759 3,249 3,390 3,478
EBITDA 1,441 1,304 1,669 1,804 1,905
Net Income 1,036 879 1,380 1,548 1,659
EPS (SAR) 2.49 2.11 3.31 3.72 3.98
DPS (SAR) 2.50 1.75 2.00 3.00 3.50
P/E (x) 28.4x 33.5x 21.9x 19.5x 18.8x
P/B (x) 4.4x 4.3x 4.0x 3.8x 3.6x
EV/Sales (x) 9.8x 10.6x 9.3x 8.7x 8.5x
EV/EBITDA (x) 19.4x 22.4x 17.9x 16.3x 15.7x
SAUDI ARABIA FERTILIZERS CO. (SAFCO) Transfer of Coverage
SAUDI ARABIA FERTILIZERS CO. (SAFCO) Transfer of Coverage
Sector Update
Fertilizers Fertilizers are essential to plants’ growth pace. They are considered an important component for the agricultural industry to produce key crops. These components are either applied to the soil, directly on the plant leaves or added to liquid solutions, in order to maintain soil fertility and improve crop development, production and quality. There are 8 to 9 groups of fertilizer but the most important in the industry are three groups, which are: Nitrogen, Phosphate and Potassium.
Nitrogen fertilizers (which we will focus on in our report) are made by using nitrogen from the atmosphere and hydrogen from natural gas to produce nitrogen based products. It is considered an essential element required for successful plant growth. Most farmers apply Nitrogen fertilizers once or sometimes twice, in the growing season. Most important Nitrogen fertilizers are ammonia and urea which are widely used in the fertilizer industry. Nitrogen based products are the most important primary nutrient, accounting for 60% of total consumption. Nitrogen fertilizers are produced in many countries, because of the wide availability of key raw materials (natural gas and air). The main two products among nitrogen fertilizers are urea and ammonia. The main markets for nitrogen fertilizers are East Asia (comprising 34% of world consumption) and South Asia (comprising 21% of world consumption).
Ammonia
One of the most important nitrogen based fertilizers is ammonia, which is used as an intermediate for all other nitrogen products. Ammonia (NH3) is considered the basis for all nitrogen fertilizers as it contains the highest amount of nitrogen (around 82%).
Table 1:Nutrient Overview
Potash Nitrogen Phosphate
Production MethodMined from evaporated
sea deposits
Synthesized from
hydrogen source steam
and air
Mined from sea fossils
Number of Major
Producing Countries15 ~65 ~40
Percent of Global
Production Traded77% 29% 49%
Largest Importers Brazil,US,China,India US,India,Brazil India,Brazil, US, Pakistan
Largest ExportersCanada, Belarus, Russia,
Israel
China, Russia, Qatar, Saudi
Arabia
China, Morocco, US,
Russia
Source: Fertecon,CRU, AMEC, Company Reports
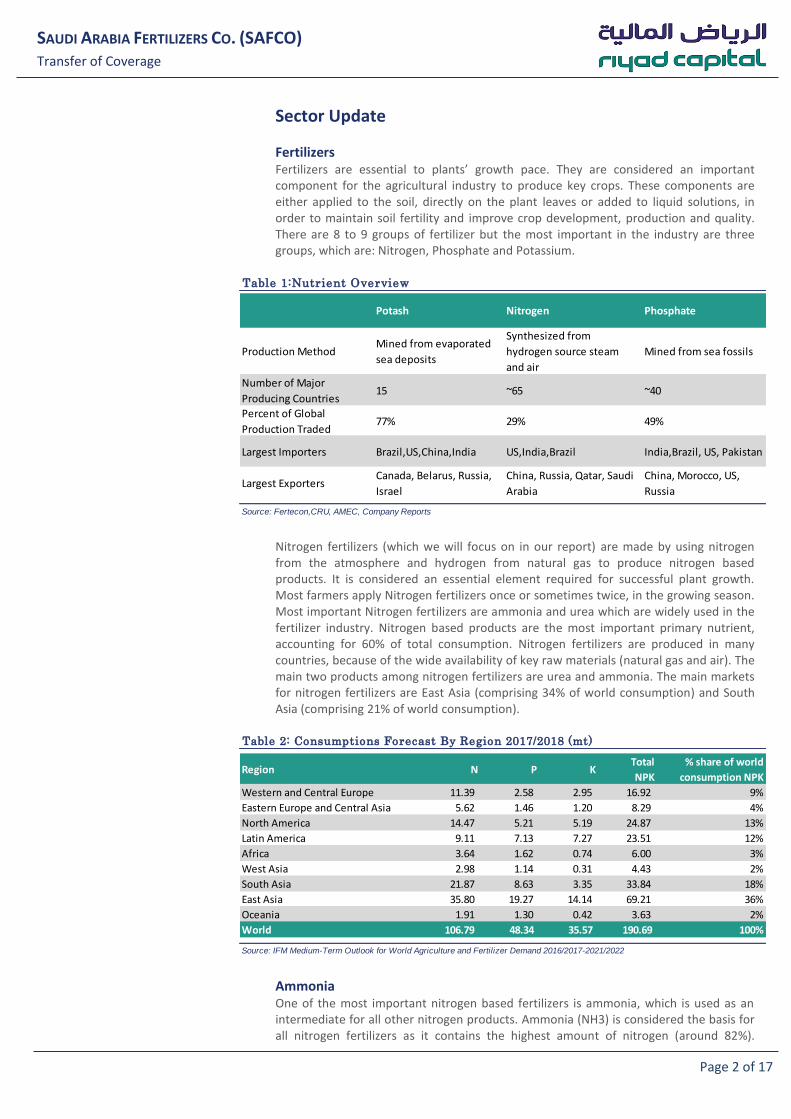
Table 2: Consumptions Forecast By Region 2017/2018 (mt)
Region N P KTotal
NPK
% share of world
consumption NPK
Western and Central Europe 11.39 2.58 2.95 16.92 9%
Eastern Europe and Central Asia 5.62 1.46 1.20 8.29 4%
North America 14.47 5.21 5.19 24.87 13%
Latin America 9.11 7.13 7.27 23.51 12%
Africa 3.64 1.62 0.74 6.00 3%
West Asia 2.98 1.14 0.31 4.43 2%
South Asia 21.87 8.63 3.35 33.84 18%
East Asia 35.80 19.27 14.14 69.21 36%
Oceania 1.91 1.30 0.42 3.63 2%
World 106.79 48.34 35.57 190.69 100%
Source: IFM Medium-Term Outlook for World Agriculture and Fertilizer Demand 2016/2017-2021/2022
Page 3 of 17
SAUDI ARABIA FERTILIZERS CO. (SAFCO) Transfer of Coverage
Ammonia can be applied directly to the soil but for several reasons, including environmental ones, it is common to further process ammonia into urea or nitrates. Ammonia is usually consumed within its local market of production (mostly as a feedstock) as it is expensive and difficult to transport. Top exporters for ammonia are Trinidad and Tobago, Russia and Saudi Arabia. Top importers are USA, India and Morocco.
The largest producer and consumer for ammonia is China, around 38% of global consumption and 40% of world supply. On the demand side, North America represents close to 26% of total global ammonia imports while Latin America represents around 27% of total global exports.
Ammonia demand saw an increase through the years increasing from 143 mt in 2011 to 189 mt in 2017. On the other hand, capacity witnessed similar trends increasing from 187 mt in 2011 to 233 mt in 2017. This oversupply in the ammonia market led utilization rates to fluctuate until it settled at 80% in 2017. In the future, we see a recovery in the utilization rates as it is expected to rise to 87% in 2026 due to decline in the difference between supply and demand.
Table 3: Largest Exports (mt) Top Three Destinations (2016)
Rank Exporting Regions 2014 2015 2016 First Second Third
1 Trinidad and Tobago 4,350 4,471 4,599 USA Brazil Morocco
2 Russia 3,647 3,641 3,677 Belgium India Morocco
3 Saudi Arabia 1,489 1,002 1,407 India Taiwan Korea Rep.
4 Algeria 1,104 1,168 1,296 Spain France Portugal
5 Canada 942 1,150 1,257 USA - -
6 Indonesia 634 1,079 1,116 Korea Rep. China Japan
SAUDI ARABIA FERTILIZERS CO. (SAFCO) Transfer of Coverage
Ammonia prices have witnessed decent recovery in the last two quarters of 2017, with the average price for 1Q2018 at USD 308/ton, increasing by +9.2% Q/Q and +4.6% Y/Y. Although this recovery is not likely to continue as prices are likely to favor buyers over producers as more capacities are expected to come to the market (from Indonesia and US). Indeed the additional supply will potentially cap prices. On the other hand, China is cutting down on its exports, leaving more room for US and Arabian Gulf producers to capture market share in Asian markets over the coming years.
Urea Worldwide, the most widely used nitrogen product is urea. It is preferred by fertilizer producers since it is relatively easy to manufacture. Urea also has higher nitrogen content (46%) versus other fertilizers. Top exporters for urea are China, Russia, Qatar and Saudi Arabia. Top importers are India, USA, Brazil and Australia.
The two largest producers and consumers are China and India. China is self-sufficient in nitrogen fertilizer but India’s need for imports is growing. The main urea exporters are gas rich countries with small domestic markets. Although China has a large capacity, its main goal is to focus on supplying the domestic market while its imports increase when there is an incremental global demand. The main importing regions are North and Latin America as well as East Asia. As the overcapacity continues in the nitrogen fertilizers market, recent price recovery gave some hope the market is on its way to equilibrium. As more capacities are set to start next year, the key element is China cutting its export for balancing supply and
Exhibit 5: Ammonia Global Prices (USD/ton)
Source: Bloomberg
0
100
200
300
400
500
600
700
27
-May
-13
27
-Au
g-1
3
27
-No
v-1
3
27
-Feb
-14
27
-May
-14
27
-Au
g-1
4
27
-No
v-1
4
27
-Feb
-15
27
-May
-15
27
-Au
g-1
5
27
-No
v-1
5
27
-Feb
-16
27
-May
-16
27
-Au
g-1
6
27
-No
v-1
6
27
-Feb
-17
27
-May
-17
27
-Au
g-1
7
27
-No
v-1
7
27
-Feb
-18
Black Sea Ammonia Middle East Ammonia
Table 4: Largest Exports (mt) Top Three destinations (2016)
Rank Exporting Regions 2014 2015 2016 First Second Third
1 China 13,615 13,748 8,872 India Mexico USA
2 Russia 5,291 4,994 6,002 Brazil Turkey Ukraine
3 Qatar 5,007 5,387 5,404 Brazil USA Australia
4 Saudi Arabia 3,319 3,725 4,239 Thailand USA Australia
5 Oman 2,791 3,435 3,372 India USA Brazil
6 Iran 1,765 2,643 2,874 India Turkey Iraq
7 Egypt 1,122 622 2,796 Turkey France Italy
8 Algeria 817 1,480 2,065 France USA Spain
9 UAE 1,914 1,868 1,833 USA Australia Brazil
10 Ukraine 1,647 1,612 1,417 Turkey Italy India
Total Top 10 37,288 39,514 38,874
Total World 47,522 49,713 50,359
Source: Nutrien factbook 2018
Page 5 of 17
SAUDI ARABIA FERTILIZERS CO. (SAFCO) Transfer of Coverage
demand. It is worth noting that in the short term, higher coal prices (for which China depends in manufacturing urea) will help in lifting global urea prices.
Urea demand increased through the years and reached 178 mt in 2017 from 156 mt in 2011. Also, capacity has risen to 230 mt in 2017 from 182 mt in 2011. As capacity increase outpaced demand increase, it led utilization rate to decline from 85.6% in 2011 to 72.6%.
The global overcapacity in the urea market is expected to continue until 2022, driving global utilization rates to around 75%, after that a decent recovery is expected in utilization rate, increasing from 76% in 2023 to 81% in 2026. North America urea capacity expanded by almost 30% between 2015 and 2018 (new expansions are set to come in 2018 in USA). Global supply is expected to increase by a CAGR of 1.5% until 2022, while global demand growth is estimated at 1.6%. After that, the difference between the demand and supply will expand as demand will grow by 1.8% and supply will grow by 1.0%. As we can see, the small difference between demand and supply and the fact the urea market is still at an overcapacity (with the 2017 demand at 178 mt and supply at 229 mt), we don’t see any significant recovery in urea prices in the short term.
Table 5: 2017 Global Urea Supply/Demand Balance (mt)
RegionCapacity
Non-Fertilizer
Use
Fertilizer
DemandTotal Demand
Western Europe 6.70 4.50 5.00 9.40
Central Europe 5.00 0.80 2.80 3.60
Eastern Europe & Central Asia 17.40 1.10 4.60 5.70
SAUDI ARABIA FERTILIZERS CO. (SAFCO) Transfer of Coverage
The last two quarters of 2017 were good for nitrogen’s two important products (urea and ammonia) as urea prices witnessed decent recovery. Urea prices averaged almost USD 256/ton in 1Q2018, decreasing by -4.1% Q/Q and -3.1% Y/Y. The trend of urea prices was muted at the beginning of the New Year and expected to remain under pressure for most of the year given the oversupply situation, only to witness some recovery in the 2H.
The most important export hubs in the urea business are the Black Sea and the Arabian Gulf, where urea prices are determined. Black Sea exports supply Europe and Latin America, while Arabian Gulf exports supply North America and Asia/Oceania. The relative pricing between Black Sea and Arabian Gulf depends on where they compete on the marginal volume. If the main drive is from Latin America, Europe or Africa, Black Sea will lead. While if it is Asia or North America, Arabian Gulf will lead.
Exhibit 8: Expected Increase In Urea Demand Exhibit 9: Urea Capacity to See Mixed Trends and Utilization to Rise
Source: Bloomberg Source: Bloomberg
165
170
175
180
185
190
195
200
205
210
215
2018 2019 2020 2021 2022 2023 2024 2025 2026
Urea Demand (mt)
225
230
235
240
245
250
255
260
265
0.7
0.72
0.74
0.76
0.78
0.8
0.82
2018 2019 2020 2021 2022 2023 2024 2025 2026
Urea Capacity (mt) Urea Utilization (%)
Exhibit 10: Urea Global Prices (USD/ton)
Source: Bloomberg
0
50
100
150
200
250
300
350
400
450
3-J
un
-13
3-S
ep
-13
3-D
ec-
13
3-M
ar-
14
3-J
un
-14
3-S
ep
-14
3-D
ec-
14
3-M
ar-
15
3-J
un
-15
3-S
ep
-15
3-D
ec-
15
3-M
ar-
16
3-J
un
-16
3-S
ep
-16
3-D
ec-
16
3-M
ar-
17
3-J
un
-17
3-S
ep
-17
3-D
ec-
17
3-M
ar-
18
Black Sea Urea Middle East Urea
Page 7 of 17
SAUDI ARABIA FERTILIZERS CO. (SAFCO) Transfer of Coverage
Coal is the production cost driver for fertilizers in the Chinese market. In recent years, China exports have shrunk as coal costs outpaced rising urea prices. Against the current coal prices of USD 102/ton, the optimal price band for China to raise its exports again is between USD 75 - 89/ton. Since the price range moved up, the coal driven cost for China have surged which made China nitrogen products less competitive since 2015.
Exhibit 11:Coal Prices and Optimal Price Band (USD/ton)
Source: Bloomberg
60
70
80
90
100
110
120
130
9-J
an-1
7
29
-Jan
-17
18
-Feb
-17
10
-Mar
-17
30
-Mar
-17
19
-Ap
r-1
7
9-M
ay-
17
29
-May
-17
18
-Ju
n-1
7
8-J
ul-
17
28
-Ju
l-1
7
17
-Au
g-1
7
6-S
ep
-17
26
-Sep
-17
16
-Oct
-17
5-N
ov
-17
25
-No
v-1
7
15
-Dec
-17
4-J
an-1
8
24
-Jan
-18
13
-Feb
-18
5-M
ar-
18
25
-Mar
-18
Qinhuangdao 5500 kc FOB
Optimal range
Page 8 of 17
SAUDI ARABIA FERTILIZERS CO. (SAFCO) Transfer of Coverage
Company Overview
Saudi Arabia Fertilizers Company (SAFCO) is one of the largest producers for nitrogen fertilizers in the region, primarily based on urea and ammonia. The company operates 4 plants with a total designed capacity of 6 mt (capacity for urea is 3.4 mt and ammonia close to 2.1 mt). Furthermore, SAFCO has an additional capacity through its share in Ibn-Baytar Company of around 250K mt of urea and 290K mt of ammonia. Additionally, the company has a limited amount of melamine and sulfuric acid products. SAFCO’s last expansion was in 2015 through SAFCO 5 which added an additional capacity of 1.1 million tons to urea production. Future plans for SAFCO is to acquire the rest of Ibn-Baytar shares from SABIC (50% between SAFCO and SABIC) and it is in the final stages as per their announcement. We don’t expect any more expansions for the company (other than Ibn-Baytar acquisition which was announced in 2016) due to the oversupply in the urea market.
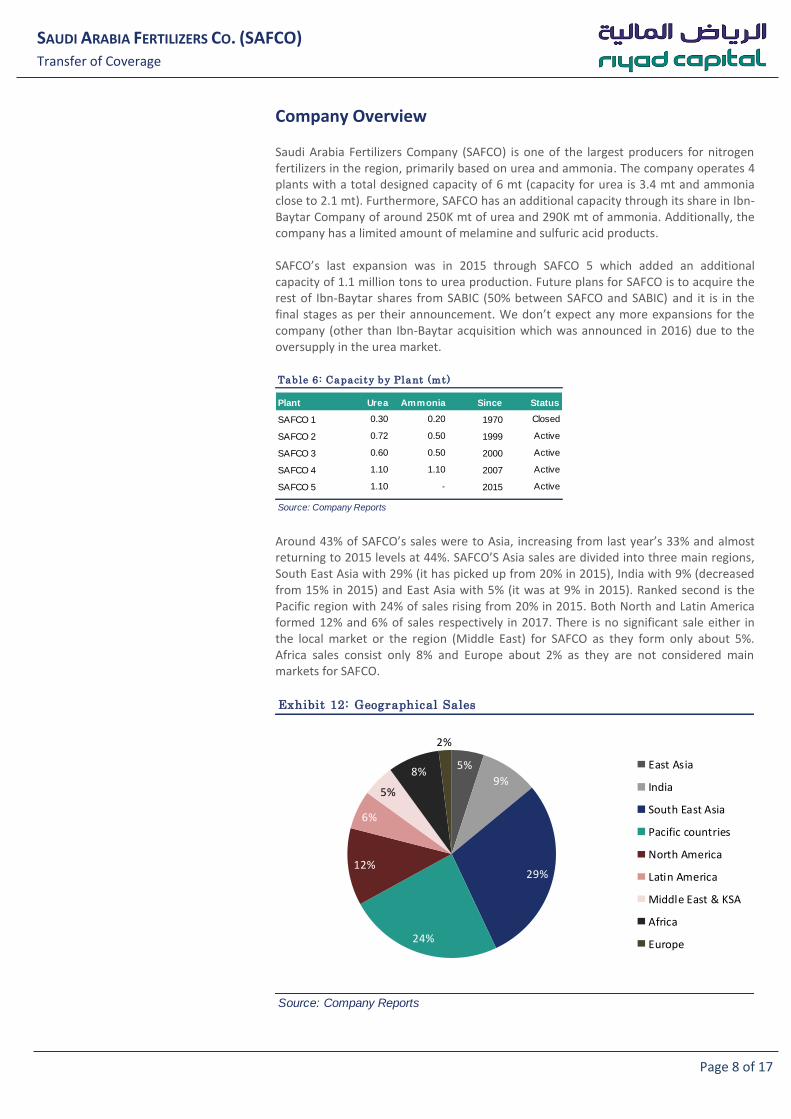
Around 43% of SAFCO’s sales were to Asia, increasing from last year’s 33% and almost returning to 2015 levels at 44%. SAFCO’S Asia sales are divided into three main regions, South East Asia with 29% (it has picked up from 20% in 2015), India with 9% (decreased from 15% in 2015) and East Asia with 5% (it was at 9% in 2015). Ranked second is the Pacific region with 24% of sales rising from 20% in 2015. Both North and Latin America formed 12% and 6% of sales respectively in 2017. There is no significant sale either in the local market or the region (Middle East) for SAFCO as they form only about 5%. Africa sales consist only 8% and Europe about 2% as they are not considered main markets for SAFCO.
Table 6: Capacity by Plant (mt)
Plant Urea Ammonia Since Status
SAFCO 1 0.30 0.20 1970 Closed
SAFCO 2 0.72 0.50 1999 Active
SAFCO 3 0.60 0.50 2000 Active
SAFCO 4 1.10 1.10 2007 Active
SAFCO 5 1.10 - 2015 Active
Source: Company Reports
Exhibit 12: Geographical Sales
Source: Company Reports
5%
9%
29%
24%
12%
6%
5%
8%
2%
East Asia
India
South East Asia
Pacific countries
North America
Latin America
Middle East & KSA
Africa
Europe
Page 9 of 17
SAUDI ARABIA FERTILIZERS CO. (SAFCO) Transfer of Coverage
We saw a decline in SAFCO’S production last year and we believe this is due to the major shutdowns in its largest plants during the last quarter (84 days in SAFCO 4 and 24 days in SAFCO 5). Production decreased by -15% compared with 2016. The last expansion that the company had was in 3Q2015 when it launched SAFCO 5 with a capacity of 1.1 mt of Urea. On the ammonia side, the last expansion was in 2007 through SAFCO 4 with a capacity of 1.1 mt of ammonia and also 1.1 mt for urea. Further plans for SAFCO are towards acquiring SABIC’s share in Ibn-Baytar company (50%) which will increase SAFCO’s capacity by 250K per ton of ammonia and 292K per ton of urea. In addition, it will give SAFCO a variety of fertilizer products capacities other than nitrogen, enabling the company to grow. We believe that SAFCO’S production will rise in 2018 as it announced only two shutdowns in SAFCO 2 for 7 days in 2Q2018 and in SAFCO 3 for 9 days, furthermore, Ibn-Baytar announced a 30 days shutdown in 4Q2018, so total shutdowns are less than last year.
Page 10 of 17
SAUDI ARABIA FERTILIZERS CO. (SAFCO) Transfer of Coverage
Financial Analysis
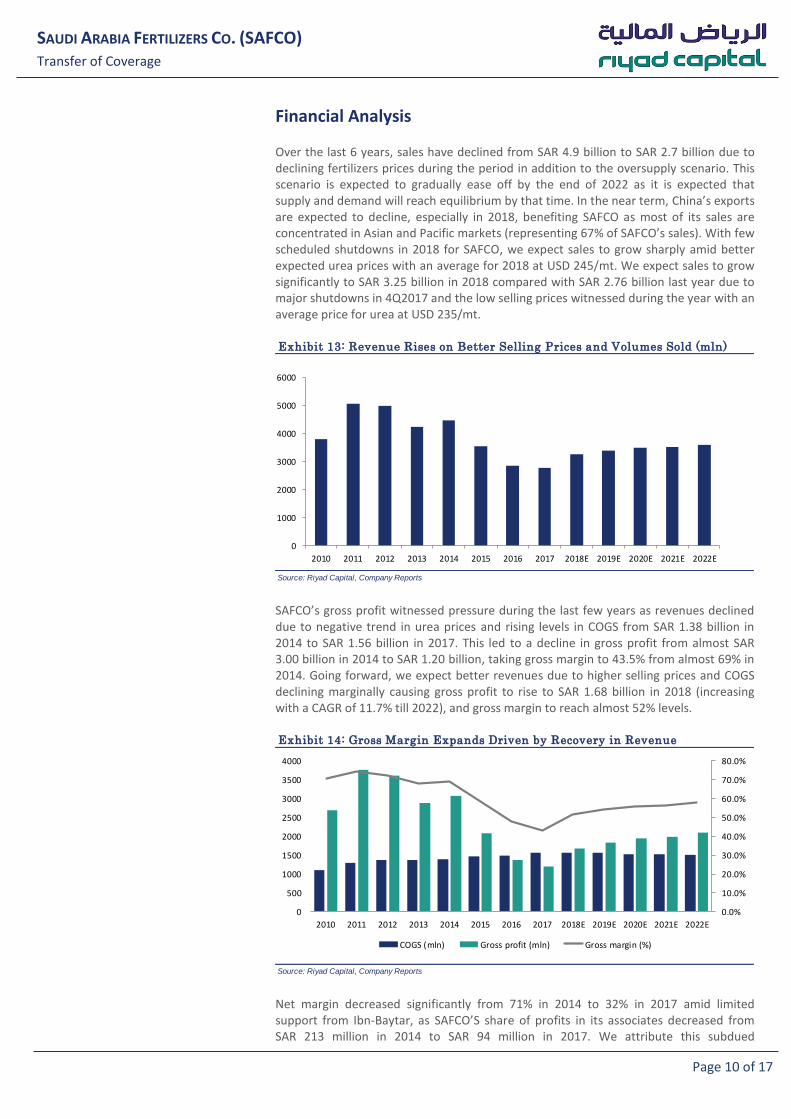
Over the last 6 years, sales have declined from SAR 4.9 billion to SAR 2.7 billion due to declining fertilizers prices during the period in addition to the oversupply scenario. This scenario is expected to gradually ease off by the end of 2022 as it is expected that supply and demand will reach equilibrium by that time. In the near term, China’s exports are expected to decline, especially in 2018, benefiting SAFCO as most of its sales are concentrated in Asian and Pacific markets (representing 67% of SAFCO’s sales). With few scheduled shutdowns in 2018 for SAFCO, we expect sales to grow sharply amid better expected urea prices with an average for 2018 at USD 245/mt. We expect sales to grow significantly to SAR 3.25 billion in 2018 compared with SAR 2.76 billion last year due to major shutdowns in 4Q2017 and the low selling prices witnessed during the year with an average price for urea at USD 235/mt.
SAFCO’s gross profit witnessed pressure during the last few years as revenues declined due to negative trend in urea prices and rising levels in COGS from SAR 1.38 billion in 2014 to SAR 1.56 billion in 2017. This led to a decline in gross profit from almost SAR 3.00 billion in 2014 to SAR 1.20 billion, taking gross margin to 43.5% from almost 69% in 2014. Going forward, we expect better revenues due to higher selling prices and COGS declining marginally causing gross profit to rise to SAR 1.68 billion in 2018 (increasing with a CAGR of 11.7% till 2022), and gross margin to reach almost 52% levels.
Net margin decreased significantly from 71% in 2014 to 32% in 2017 amid limited support from Ibn-Baytar, as SAFCO’S share of profits in its associates decreased from SAR 213 million in 2014 to SAR 94 million in 2017. We attribute this subdued
Exhibit 13: Revenue Rises on Better Selling Prices and Volumes Sold (mln)
SAUDI ARABIA FERTILIZERS CO. (SAFCO) Transfer of Coverage
performance from Ibn-Baytar to weakness in the fertilizer market. This led to a decrease in net income by -72% from 2014 levels, reaching SAR 879 million. With a better outlook we expect more contribution from Ibn-Baytar over the coming years, though it may face some challenges this year as it made an announcement regarding 30 days shutdowns in the fourth quarter. We expect SAFCO’s earning to increase to SAR 1.38 billion for 2018 as we are optimistic that SAFCO has faced the worst in the last few years and it has more chances to grow volumes sales in 2018 due to favorable market conditions. This rise in earnings will lead to net margin recovery to 43% from 32% in 2017.
Additionally, we expect a recovery in EBITDA margins during 2018 to 51% levels after it declined over the last few years from 75% in 2014. SAFCO used to have high EBITDA margins between 2010 and 2014, recording its highest in 2010 at 85%. EPS should also see a similar trend as we expect it to reach SAR 3.31 next year. Through last year, EPS witnessed significant pressure declining to SAR 2.11 compared to an average of SAR 7.10 for the past 7 years.
DPS has decreased significantly during the years as it used to distribute SAR 7.00 dividend per share in 2014, which has come down to SAR 1.75 in 2017; total decline of 75% compared with 2014. This is due to the pressure it witnessed in cash flow through the years declining by 85% from SAR 1.6 billion in 2014 to SAR 245 million in 2017. We expect better net cash flow for SAFCO in coming years as higher urea prices will lead to better cash flow from operations and increased net income as well, which will give SAFCO more space to raise its dividends. As for Ibn-Baytar acquisition, we lean more for the scenario that SAFCO will fund it internally without taking a loan for the acquisition. SABIC’s direct share in Ibn-Baytar is worth approximately SAR 677 million and according
Exhibit 15: More Contribution From Ibn-Baytar Helps Earnings to Recover
SAUDI ARABIA FERTILIZERS CO. (SAFCO) Transfer of Coverage
to our assumptions, SAFCO is capable of funding it as its’ net cash flow for 2018 and 2019 is expected to be at SAR 818 million and SAR 984 million respectively. However, this may give less room for SAFCO to increase its dividend in the short-term.
2H2018 to be better SAFCO started the year with a negative surprise, as it recorded net income of SAR 237 million decreasing by -44% Y/Y. This is attributed to the unexpected continuity of the shutdown effect from 4Q2017, as it recorded higher depreciation cost which led to higher COGS and lower gross profit. We expect revenues to be lower in 2Q2018 as shutdowns are scheduled at SAFCO 2 for 7 days and at SAFCO 3 for 9 days, which will lead to lower production volumes. We expect sales to pick up in the 2H as SAFCO will operate at higher capacity (without any shutdowns in their main plants), and also expectation for better urea prices which will help revenues to recover.
Table 7: Quarterly Income Statement Summary (SAR mln)
SAUDI ARABIA FERTILIZERS CO. (SAFCO) Transfer of Coverage
Valuations
DCF and DDM are appropriate We update our models and value SAFCO using a combination of discounted cash flow and dividend discounted model. For DCF valuations, SAFCO would be declining its capex as we do not expect any new projects after they finish the ammonia reliability enhancement at SAFCO 3 plant in 4Q2017, which will lead to higher free cash flows as fertilizer markets recover in the coming years. We have also used DDM as SAFCO is considered to be a divided paying company with an average payout ratio for the past 7 years of 99%. DPS may see some pressure in the near term as SAFCO and SABIC are in their final stages for Ibn-Baytar acquisition; expected to be in late 2018 or 2019. In the long term, DPS would likely increase as the fertilizers market moves to rebalance from its oversupply situation by 2022.
DCF method: Fair value at SAR 72.14 Our DCF valuation with forecasts assumed for 2018-22E uses a long-term terminal growth rate of 1.5% and risk-free rate assumption of 3.7%, and a market return of 7.3% (TASI’s return for 15 years). WACC of 6.74% is assumed as the discount rate with a capital structure free of debt.
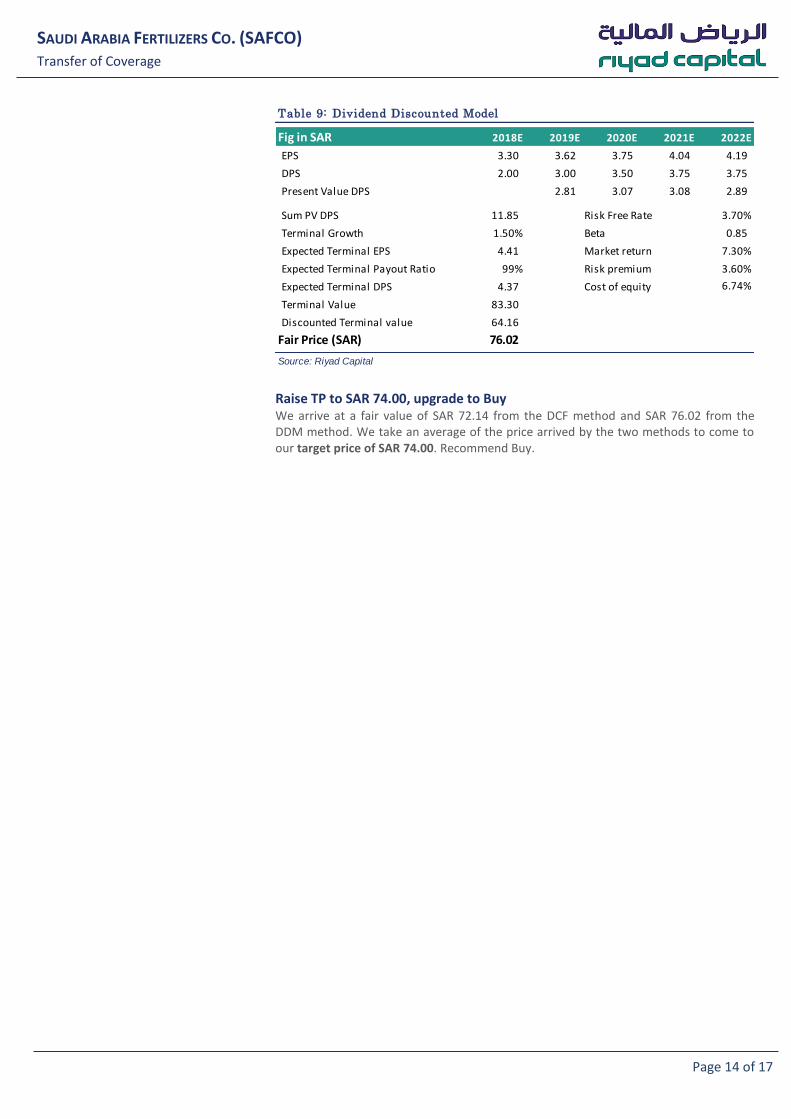
DDM method: Fair value at SAR 76.02 Our DDM valuation with forecasts assumed for 2018-22E using the same components of WACC in the DCF method (WACC of 6.74%), with a terminal growth of 1.5%. Also assuming an expected terminal payout ratio of 99% (the average payout ratio for the past 7 years).
SAUDI ARABIA FERTILIZERS CO. (SAFCO) Transfer of Coverage
Raise TP to SAR 74.00, upgrade to Buy We arrive at a fair value of SAR 72.14 from the DCF method and SAR 76.02 from the DDM method. We take an average of the price arrived by the two methods to come to our target price of SAR 74.00. Recommend Buy.
Table 9: Dividend Discounted Model
Fig in SAR 2018E 2019E 2020E 2021E 2022E
EPS 3.30 3.62 3.75 4.04 4.19
DPS 2.00 3.00 3.50 3.75 3.75
Present Value DPS 2.81 3.07 3.08 2.89
Sum PV DPS 11.85 Risk Free Rate 3.70%
Terminal Growth 1.50% Beta 0.85
Expected Terminal EPS 4.41 Market return 7.30%
Expected Terminal Payout Ratio 99% Risk premium 3.60%
Expected Terminal DPS 4.37 Cost of equity 6.74%
Terminal Value 83.30
Discounted Terminal value 64.16
Fair Price (SAR) 76.02
Source: Riyad Capital
Page 15 of 17
SAUDI ARABIA FERTILIZERS CO. (SAFCO) Transfer of Coverage
Summary Financial Projections
Table 10: Financials and Forecasts
2012 2013 2014 2015 2016 2017 2018 E 2019 E 2020 E