by John IE, Baumgras BETTER LOAD-WEIGHT DISTRIBUTION IS NEEDED FOR TANDEM-AXLE LOGGING TRUCKS USDA FOREST SERVICE RESEARCH PAPER NE-342 I976 FOREST SERVICE, U. S. DEPP,RTMENT OF AGRICULTURE NORTHEASTERN FOREST EXPERIMENT STATiCN 6816 MP,RKET STREET, UPPER DAREY, PA. 19082 F. BRYAN CLARK, STATION DIRECTOR
Transcript
by John IE, Baumgras
BETTER LOAD-WEIGHT DISTRIBUTION IS NEEDED FOR TANDEM-AXLE
LOGGING TRUCKS
U S D A FOREST SERVICE R E S E A R C H PAPER NE-342 I976
FOREST SERVICE, U. S. DEPP,RTMENT OF AGRICULTURE N O R T H E A S T E R N FOREST EXPERIMENT STATiCN 6816 MP,RKET STREET, UPPER DAREY, PA. 19082
F. BRYAN CLARK, STATION DIRECTOR
The Author
JOHN E. BAUMGRAS, research forester, attended Michigan State University, where he received a B.S. degree in forestry in 1965 and an M.S. degree in forest management in 1967. He worked a year as a forester on the Monongahela National Forest before joining the Northestern Forest Experiment Station, Forest Products Marketing Laboratory, at Princeton, West Virginia. He is doing research in timber-harvesting techniques and economics.
BETTER LOAD-WEIGHT DISTRIBUTION IS NEEDED FOR TANDEM-AXLE
LOGGING TRUCKS
ABSTRACT
To determine the GVW and axle weights of tandem-axle logging trucks hauling into two West Virginia sawmills, 543 truckloads of hardwood sawlogs were weighed. The results showed that less than 2 percent of the truckloads exceeded the 48,000 pound GVW limit. While 58 percent of the truckloads exceeded the 32,000 pound tandem-axle weight limit, the front-axle weights never exceeded the 18,000-pound single-axle limit and seldom exceeded 10,000 pounds. Because the trucks sampled carried an average of 93 per- cent of the load weight on the rear axles, they could not haul maximum payloads without exceeding the tandem-axle weight limit on the rear axles.
The wheelbase dimension of the trucks and the location of the body on the truck determined the distribution of load weight. From these results, a truck design guide was developed in the form of an easy-to-use nomogram. The configuration of tandem-axle logging trucks needs to be changed, and loggers should select a truck de- sign that will provide the correct distribution of load weight and have the capacity to handle the front- and rear-axle loads needed for maximum payloads.
BY DISTRIBUTING THE PAYLOAD weight so that both front and rear axle
weights are maximized, loggers could very often increase payloads. This would also re- duce axle-weight overloads that can result in heavy fines being levied on truck operators.
An increase in payloads would increase trucking efficiency. Martin (1 972) reported that a 25-percent increase in tandem-truck payloads would reduce the hauling cost by 21 percent. Moreover, maximizing logging-truck payloads would help loggers maintain a more efficient; harvesting system because trucking frequently regulates the productivity of the entire logging operation.
In a study a t our Forest Products Market- ing Laboratory, we found that the payloads transported by tandem-axle logging trucks were located so f a r to the rear of the truck that i t was impossible to attain proper axle loading or maximum payloads. The results from this study point out a real need for im- proving payload weight distribution so that payloads can be corzsistently maximized within the legal axle-weight limits prescribed by law.
THE AXLE-WEIGHT STUDY The study was made a t two West Virginia
sawmills. At one mill, 464 loads of logs were weighed, on 10 tandem-axle trucks hauling from several diEerent sites. At the second mill, 79 toads were weigl~ed, on 4 tandem- axle trucks hauling from 2 different sites. All the loads weighed were hardwood sawlogs. None of the trueks weighed were equipped with log loaders.
The 464 loads weighed at the first mill were unloaded with a forklift truck, We felt that this method of unloading might affect the truck loading and subsequent weight dis- tribution because all logs had to be accessible to the forklift working between the stakes on the truckbed. Therefore the second sampling
site was selected a t a mill where trucks were unloaded with tr ip stakes.
By weighing front and rear axles sepa- rately, both loaded and empty, we were able to determine payload weight on the front axle as well as on the rear tandem axles. Dividing the payload on the rear axles by the total payload, we were able to calculate the percentage of the payload transferred to the rear axles. This procedure provided a meas- ure of weight distribution and served as the basis for estimating the load center of grav- ity (LCG). The following formula for cal- culating the load center of gravity, measured in inches from the front axle, was derived from a load-transfer equation presented by Fitcb (1969) :
Payload rear axle (Wheelbase) = LCG (inches from
Total payload front axle)
GROSS VEHICLE WEIGHTS AND AXLE WEIGHTS
The gross vehicle weight (GV'CV) limit in West Virginia is 48,000 pounds for three- axle trucks of the wheelbase dimensions we sampled (FV. Va. Dep. iWotor. Vehicles 196'8). Less than 2 percent of the truckloads sampled exceeded this GVW limit (table 1). Eleven of the 14 study trucks never exceeded 48,000 pounds CVJV. The average GVW sampled was 41,365 pounds, and in most cases several tho~zsand pounds of payload could have been added without exceeding the GVTV limit.
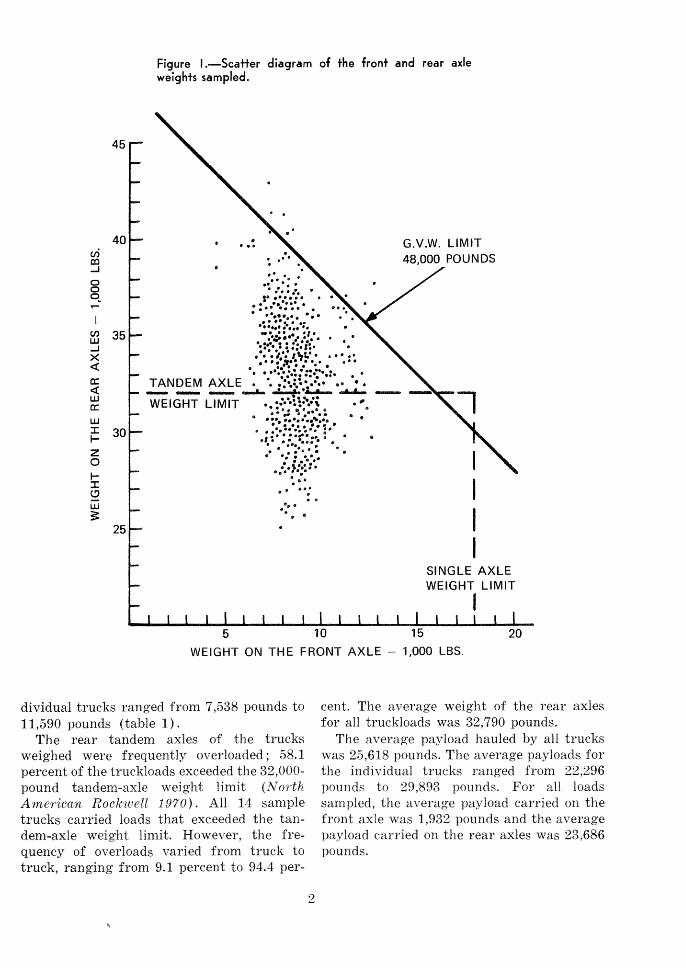
Althougf~ the weight limit for single axles is 18,000 lrtounds (;V"orth American Rockwelt 19Y0) none of the trucks used in the study were equipped with front axles or tires cap- able of safely lzandling the maximum legal single-axle load. Front-axle weights seldom exceeded 10,000 pounds (fig. 1 ) . The average front-axle weight for all trucks was 8,675 pounds, and the front-axle weights of in-
Figure I.-Scatter diagram of the front and rear axle weights sampled.
G.V.W. LIMIT
r . .
5 10 15 20
WEIGHT ON THE FRONT AXLE - 1,000 LBS.
dividual trucks ranged from 7,538 pounds to 11,590 pounds (table I ) .
The rear tandem axles of the trucks weighed were frequently overloaded ; 58.1 percent of the truckloads exceeded the 32,000- pound tandem-axle weight- limit (hTorth America~ RockzveEt f 97'0). All 14 s a ~ ~ p l e trucks carried loads that exceeded the tan- dem-axle weight limit;, However, the fre- quency of overloads varied from truck to truck, ranging frorn 9.1 percent to 94.4 per-
cent. The average weight of the rear axles for all truckloads was 32,790 pounds.
The average payload hauled by all trucks was 25,618 pounds. The average payloads for the individual trucks ranged from 22,296 pounds to 29,893 pounds. For all loads sampled, the average payload carried on the front axle zvas 1,932 lsounds and the average payload carried on the rear axles was 23,686 pounds.
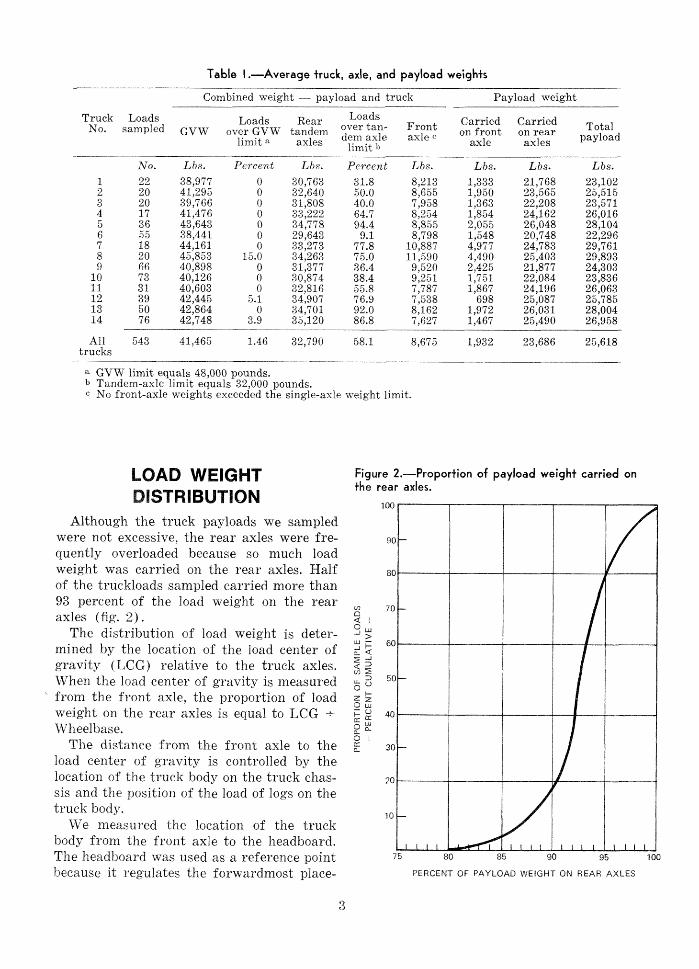
Table I .-Average truck, axle, and payload weights
Combined weight - payload and truck Payload weight
Truck Loads Loads Rear Loads Carried Carried No. sampled GVW aver GVW tandem Over tan- fi~:: on front an rear
a GV'CV limit equals 48,000 pounds. b Tandem-axle lirnit equals 32,000 pounds. e No front-axle weights exceeded the single-axle weight limit.
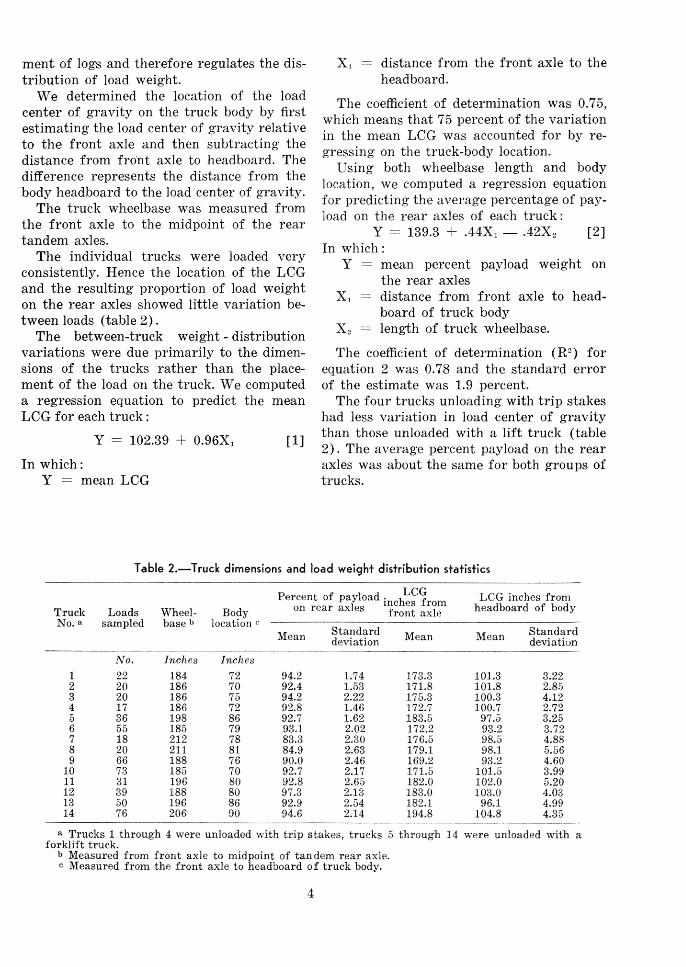
LOAD WEIGHT Figure 2.-Proportion of payload weight carried on
DISTRIBUTION Ihe rear axles.
100
Although the truck payloads we sampled were not excessive, the rear axles were fre- 90
quently overloaded because so much load weight was carried on the rear axles. Half 80
of the truckloads sampled carried more than 93 percent of the load weight on the rear ,, axles (fig. 2). Q I
The distribution of load weight is deter- " mined by the location of the load center of 5 60
2 2 gravity (LCG) relative to the truck axles. When the load center of gravity is measured 6 from the front axle, the proportion of load z !ii
0 weight on the rear axles is equal to LCG +- k; 40 Wheelbase. g
The distance from the front axle to the :: ' 30
load center of gravity is controlled by the location of the truck body on the truck chas- 20
sis and the position of the load of logs on the truck body.
I 0 We measured the location of the truck
body from the front axle to the headboard. The headboard was used as a reference point 7 5 80 85 90 95 100
because i t regulates the forwardmost place- PERCENT OF PAYLOAD WEIGHT ON REAR AXLES
ment of logs and therefore regulates the dis- X, = distance from the front axle to the tribution of load weight. headboard.
We determined the location of the load center of gravity on the truck body by first estimating the load center of gravity relative to the front axle and then subtracting the distance from front axle to headboard. The diff'erence represents the distance from the body headboard to the load center of gravity.
The truck wheelbase was measured frorn the front axle to the midpoint of the rear tandem axles.
The individual trucks were loaded very consistently. Hence the location of the LCG and the resulting proportion of load weight on the rear axles showed little variation be- tween loads (table 2).
The between-truck weight - distribution variations were due primarily to the dimen- sions of the trucks rather than the place- ment of the load on the truck. We computed a regression equation to predict the mean LCG for each truck :
Y = 102.39 + 0.9611, [ 11 In which :
Y = mean LCG
The coefficient of determination was 0.75, which means that 75 percent of the variation in the mean LCG was accounted for by re- gressing on the truck-body location.
Using both wheelbase length and body location, we computed a regression equation for predicting the average percentage of pay- load on the rear axles of each truck:
Y = 139.3 + .44X, - .42X, [ 2 ] In which :
Y == mean percent payload weight on the rear axles
X, == distance from front axle to head- board of truck body
X2 == length of truck wheelbase.
The coefficient of determination (R2) for equation 2 was 0.78 and the standard error of the estimate was 1.9 percent.
The four trucks unloading with tr ip stakes had less variation in load center of gravity than those unloaded with a lift truck (table 2). The average percent payload on the rear axles was about the same for both groups of trucks.
Table 2.-Truck dimensions and road weight distribution sfatistics
LCG Percent of payload inches from LCG inches from Truck Loads Wheel- Bodv on rear axles front axle headboard of body No. a sampled base b location
Mean Standard B%Pcl,an Standard deviation &Iean deviation
a Trucks 1 through 4 were unloaded with t r ip stakes, trucks 5 through 14 were unloaded with a forklift truck.
b Measured from front axle to rnidpoint of tandem rear axle. e Measured frorn the front axle to headboard of truck body.
MAXIMiZING PAYLOADS pounds on the rear, 9,000 pounds of payload weight can be carried on the front axle and W'THoUT AXLE OVERLOAD 23,000 pounds on the rear.
The trucks we sampled should have car- ried proportionately more load weight on the front axle. If the distribution of load weight is not changed, axle overloading can be avoided only by reducing payloads. However, near-maximum payloads can be hauled with- out axle overloading if the load weight is properly distributed.
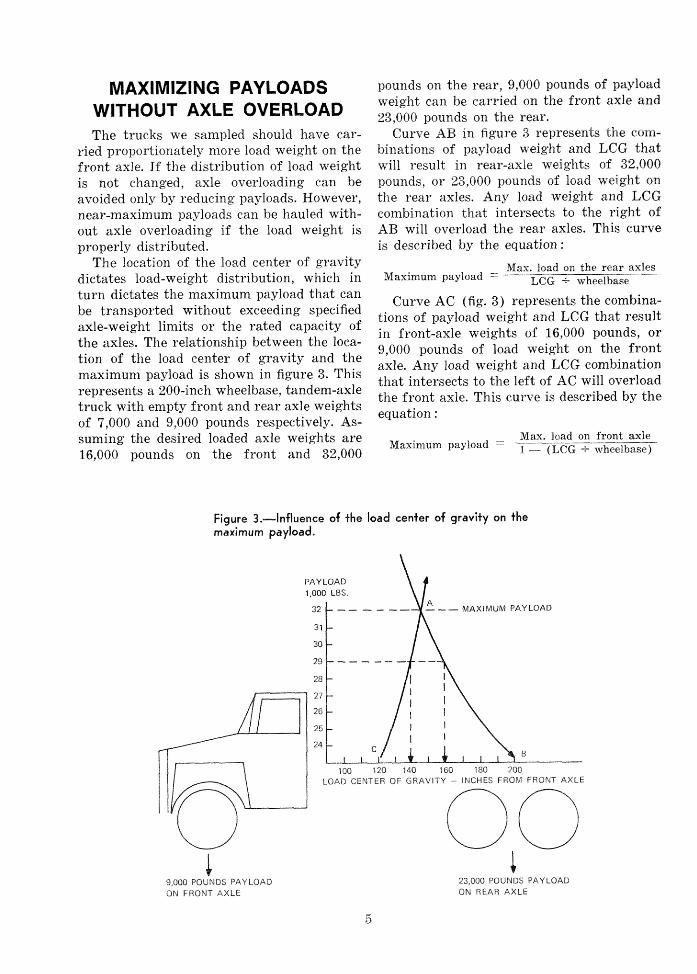
The !ocation of the load center of gravity dictates load-weight distribution, which in turn dictates the maximum payload that can be transported without exceeding specified axle-weight limits or the rated capacity of the axles. The relationship between the loca- tion of the load center of gravity and the maximum payload is shown in figure 3. This represents a 200-inch wheelbase, tandenl-axle truck with empty front and rear axle weights of 7,000 and 9,000 pounds respectively. As-
Curve AB In figure 3 represents the corn- binations of payload weight and LCG that will result in rear-axle weights of 32,000 pounds, or 23,000 pounds of load =eight on the rear axles. Any load weight and LCG combination that intersects to the right of AB will overload the rear axles. This curve is described by the equation:
Nax. load on the rea r axles Maximum payload = LCG + wheelbase
Curve AC (fig. 3 ) represents the combina- tions of payload weight and LCG that result in front-axle weights of 16,000 pounds, or 9,000 pounds of load weight on the front axle. Any load weight and LCG combination that intersects to the left of AC will overload the front axle. This curve is described by the equation :
suming the desired loaded axle weights are Max. load on f ront axle
16,000 pounds on the front and 32,000 Maximum payload = 1 - (LCG + wheelbase)
Figure ).--Influence of the load center of gravity on the maximum payload.
PAY LOAD
A - - MAXIMUM PAYLOAD
100 120 140 160 180 200 LOAD CENTER OF GFIAVITY - INCHES FROM FRONT AXLE
9,000 POUNDS PAYLOAD 23,000 POUNDS PAY LOAD ON FRONT AXLE ON REAR AXLE
The AB and AC curves intersect a t the maximum payload and the optimum load center of gravity. The maximum payload is equal to the surn of the maximum axle loads. The optimum LCG is a t the point where the proportion of load weight carried by each axle is equal to the ratio of the maximum axle load and maximurn payload.
In this case, the optimum LCG is 143.75 inches. The proportion of load weight on the rear axle is equal to 143.75 -+ 200 or .72 which is equal to 23,000 +- 32,000 pounds. The proportion of load weight on the front axle would equal 1 - (143.75 +- 200) or -28, which is equal to 9,000 + 32,000 pounds.
For the 543 loads sampled, the average payload on the rear axle was 93 percent. For this example, this would correspond to a 186- inch center of gravity: -93 x 200 = 186. With the LCG a t this point, any load in ex- cess of 25,000 pounds will result in overloaded rear axles. This is 7,000 pounds less than the maximum legal payload.
Because loggers cannot precisely position the center of gravity of each load of logs, the LCG varies from load to load. Although this variation seems to be limited, when GVW is equal to the sum of the maximum axle weights, this variation can cause axle-weight overloads even when the mean LCG is located a t the optimum point.
To prevent this type of overloading, the GSTW of logging trucks should be less than the surn of the n-laximum axle weights. This margin allows the LCG to vary without over- loading the axles. In the preceding example, the sum of the maximum axle weights is 48,000 pounds. If the payload is reduced to 29,000 pounds so that the GVW is 45,000 pounds, the LCG can vary approximately 20 inches without axle overload (fig. 3 ) .
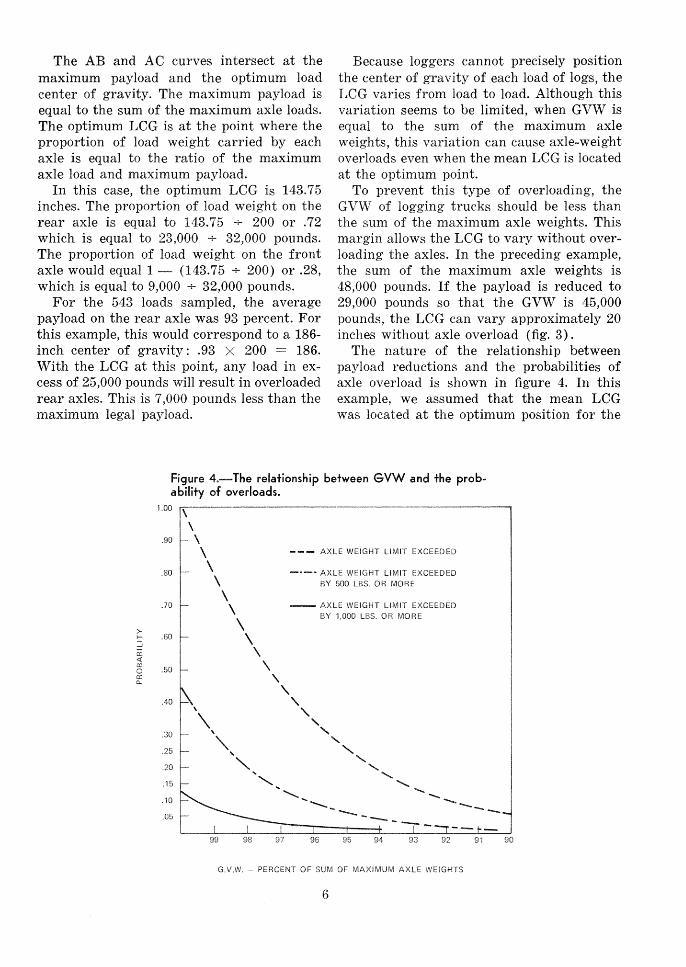
The nature of the relationship between payload reductions and the probabilities of axle overload is shown in figure 4. In this example, we assumed that the mean LCG was located a t the optimum position for the
Figure 4.----The relationship between GVW and the prob- ability of overloads.
\ --- AXLE WEIGHT LIMIT EXCEEDED
.80 \ -.-- \
AXLE WEIGHT LIMIT EXCEEDED BY 500 LBS. OR MORE
.75 \ \ - AXLE WEIGHT LIMIT EXCEEDED
\ BY 1,050 LBS. OR MORE
G.V.W. - PERCENT OF SUM OF MAXIMUM AXLE WEIGHTS
6
maxirnum payload, and that the standard deviation was 4.0 inches, which is about the average value for the standard deviation of LCG shown in table 2.
Assuming that the LCGs a re normally dis- tributed, we can compute the probabilities of overload that are given in figure 4. By reducing the payload 5 percent so that the GVIV equals 95 percent of the sum of the maximum axle weights, the probability of overload is only .26 and the probability of a 500-pound orierload is less than .06,
RECOMMENDATIONS The study results show that tandem-axle
logging trucks can transport near-maximum payloads without significant axle overload, if more payload weight is shifted to the front axle. To make this change, loggers can change the configuration of the log loads or change the configuration of the logging trucks.
The load configuration can be changed by loading all logs as f a r forward on the truck body as possible. This practice would shift the weight of 8-, lo-, 12-, and 14-foot logs forward and transfer more weight onto the front axle.
The trucks in this study were loaded so most of the short logs were centered on the truckbed rather than butted up against the headboard. This was done because the retain- ing stakes were located too fa r back on the truckbed. By moving the stakes on the truck- bed or adding stakes and load binders, the shorter logs could be secured in a forward- most position.
To optimize the distribution of load weight, the configuration of logging trucks must be clzanged. With the trucks and sawlog len@hs observed in this study, it would be impossible to move the toad forward f a r enough to load the front axle properly. Furthermore, the analysis of weight distribution sl~owed that the dimensions of the logging truck are the most important determinants of weight dis- tribution,
bVe have prepared a guide to selecting the eorrect combinations of wheelbase length and
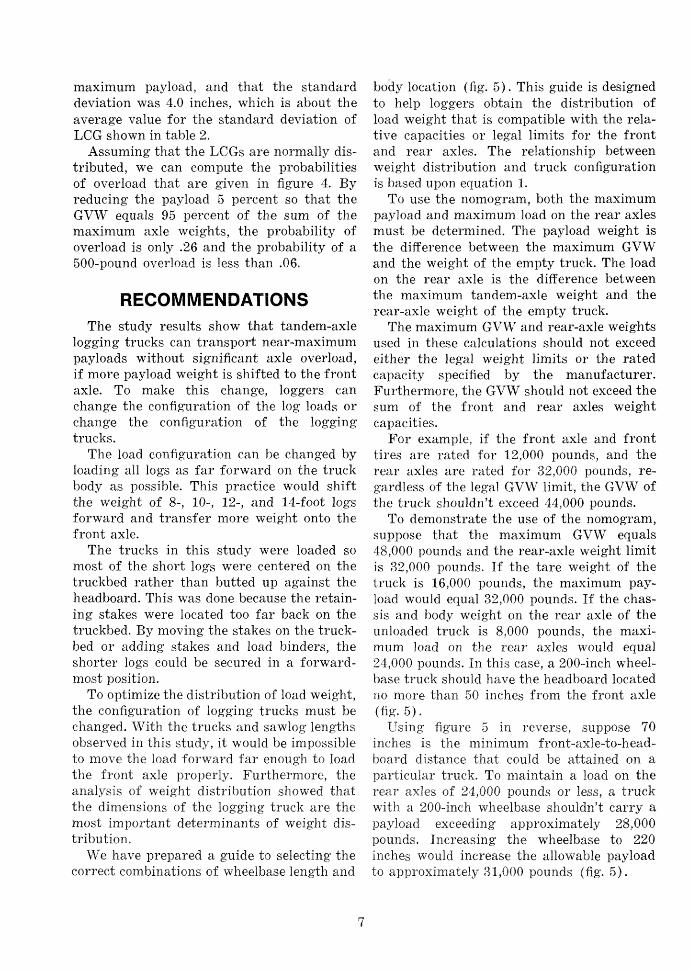
body location (fig. 5) . This guide is designed to help loggers obtain the distribution of load weight that is compatible with the rela- tive capacities or legal limits for the front and rear axles. The relationstlip between ~veight distribution and truck configuration is based upon equation I.
To use the nomogram, both the maxirnum payload and maximum load on the rear axles must be determined, The payload weight is the difference between the maximum GVW and the weight of the empty truck. The load on the rear axle is the difference between the maxirnum tandem-axle weight and the rear-axle weight of the empty truck.
The maximum GVW and rear-axle weights used in these calculations should not exceed either the legal weight limits or the rated capacity specified by the manufacturer. Furthermore, the GVW should not exceed the sum of the front and rear axles weight capacities,
For example, if the front axle and front tires are rated for 12,000 pounds, and the rear axles are rated for 32,000 poutids, re- gardless of the legal GVIV limit, the GVW of the truclt shouldn't exceed 44,000 pounds.
To demonstrate the use of the nomogram, suppose that the maximum GVW equals 48,000 pounds and the rear-axle weight limit is 32,000 pounds. If the tare weight of the truck is 16,000 pounds, the maximum pay- load would equal 32,000 pounds. If the chas- sis and body weight on the rear axle of the unloaded truck is 8,000 pounds, the maxi- mum load on the rear axles would equal 24,000 pounds. In this case, a 200-inch wheel- base truck should have the headboard located no more than 50 inches from the front axle (fig. 5) *
Using figure 5 in reverse, suppose 70 inches is the minimum front-axle-to-head- board distance that could be attained on a particular truck. To rriaintain a load on the rear axles of 24,000 pounds or less, a truck with a 200-inch wl~eelbase shouldn't carry a payload exceeding approximately 28,000 pounds. Increasing the wheelbase to 220 inches would increase the allowable payload to approximately 31,080 pounds (fig, 5) .
AND SUMMARY Loggers should put more load w e i g h o n
the front axle of the tandem-axle logging truck if they expect to niaximize payload without exceeding the legal axle-weight limits. To do this, they should select a truck design that will properly distribute the weight between the front and rear axles and safely handle the added front-axle loads.
From the truek-design guide, the combina- tions of truck wheelbase length and body location can be determined that will dis- tribute the load weight in accordance with the relative capacities of the front and rear axles. The truck dimensions recommended b57 this guide may require loggers to select a longer-wheelbase truck or one with a setback front-axle design. The bunks and log-retain- ing stakes on the truck body should also be located as f a r forward on the truck as pos- sible.
RECOMMENDED DISTANCE, FRONT AXLE TO HEADBOARD - INCHES -
The legal axle-weight limits or the weight capacity of the truck axles should determine how much weight should be carried by both front and rear axles. Certainly, every logger should not load the front axle to the maxi- mum single-axle weight limit, which varies from 18,000 pounds to 22,400 pounds for the various eastern states (4). Such loads on the steering axle would create severe handl- ing problems. However, the average front- axle weight sampled was 8,675 pounds, and any improvement over this would help reduce rear-axle overloads and increase legal pay- loads.
To keep the capacity of the front axle in line wit11 increased front-axle foads, trucks should be equipped with heavy-duty front axles and tires. Front axles with ratings of 16,000 to 18,000 pounds are ofered as op- tions by many truck manufacturers. KTider tires will keep the added foads within. the legal weigbt-per-t ire-id restrictions.
The added cost of these heavy-duty com- ponents should be conipared with the ex- pected benefits, such as increased payloads axid safer operation. that wouid be realized over the fife of the truck.
Loggers trying to maintain the most ef- ficient and productive operations possible should carefully select logging trucks, truck components, and truck bodies. To maximize payloads and minimize costs, every aspect of truck design should be considered.
LITERATURE CITED Pitch, James 1.Y.
1969. MOTOR TR'IJCK ENGINEERIWG HANDBOOK. 264 p., iliils. James IV. Fiteh, publisher, San Franciscs,
Martin, A. Jeff. 1971. THE R m A T I V E IMPORTANCE OF FACTORS T H A T DETE;It&XIh'E LOG H A U L I N G COSTS. USDA For. S e n . Res. Pap. KE-197. 16 p. Northeast. For. Exp. Stn., Cpper Darby, Pa.
North Arnerican Rockwell. 1970. STATE SIZE, WEIGHT, AND SPEED M A X I M U M S FOR TRUCKS AND TRUCK TRAILERS.. 13 P., ~ I ~ U S .
West Virginia Department of Motor Vehicles. 1968. WEST VIRGINIA MOTOR VEHICLE LAWS. 1968 C u r n u l , Supl. 85 p.
Headquarters of the Northeastern Forest Experiment Station are in Upper Darby, Pa. Field laboratories and research units are maintained at: * Amherst, Massachusetts, in cooperation with the University
of Massachusetts.
* Beltsville, Maryland. Berea, Kentucky, in cooperation with Berea College. Burlington, Vermont, in cooperation with the University of Vermont.
* Delaware, Ohio. * Durham, New Hampshire, in cooperation with the University
of New Hampshire.
* Hamden, Connecticut, in cooperation with Yale University. * Kingston, Pennsylvania.
Morgantown, West Virginia, in cooperation with West Vir- ginia University, Morgantown. Orono, Maine, in cooperation with the University of Maine, Orono.
* Parsons, West Virginia. * Pennington, New Jersey.
Princeton, West Virginia. * Syracuse, New York, in cooperation with the State University
of New York College of Environmental Sciences and Forest- ry at Syracuse University, Syracuse.