BetterBricks Smart Markets Program Market Progress Evaluation Report prepared by Research Into Action report #E06-155 June 21, 2006 529 SW Third Avenue, Suite 600 Portland, Oregon 97204 telephone: 503.827.8416 fax: 503.827.8437
Transcript
BetterBricks Smart Markets Program M a r k e t P r o g r e s s E v a l u a t i o n R e p o r t
prepared by
Research Into Action
report #E06-155
June 21, 2006
529 SW Third Avenue, Suite 600 Portland, Oregon 97204 telephone: 503.827.8416 fax: 503.827.8437
Final Report
MARKET PROGRESS EVALUATION REPORT: BETTERBRICKS SMART MARKETS PROGRAM
As always, there are many in addition to the evaluation team who contribute to the production of a market progress report. The grocery store managers, corporate facility leads, refrigeration contractors and planning department leads for grocery wholesale companies all were willing and friendly respondents to our requests for information – without them we would have nothing to report.
We would also like to acknowledge the assistance of David Cohan of the Northwest Energy Efficiency Alliance (the Alliance) who served as our evaluation project manager. Also of the Alliance, Kyle Kobel, Skip Schick and Paul Warila, who oversee the grocery store market segment, and Paul Enfield and Les Tumidaj, who are business advisors for the grocery store segment: these people all provided on-going assistance to ensure that our efforts addressed the program as implemented.
Finally, we want to thank Steven Scott of MetaResource Group for his assistance in reviewing the ACE model and Laurie Lago of Business Service Bureau, our able production specialist.
MPER: BETTERBRICKS SMART MARKETS PROGRAM PAGE I
TABLE OF CONTENTS
EXECUTIVE SUMMARY .................................................................................................................. I SUMMARY OF FINDINGS............................................................................................................I CONCLUSIONS AND RECOMMENDATIONS ........................................................................III
Context for the Smart Markets Initiative ....................................................................... 3 EVALUATION APPROACH.......................................................................................................... 3 CONTENTS OF THIS MPER........................................................................................................ 6
2. PROGRAM DESCRIPTION AND INDICATORS OF PROGRESS ................................................ 7 DESCRIPTION OF THE BETTERBRICKS SMART MARKETS PROGRAM .......................... 7
Background ........................................................................................................................ 7 Energy Plans...................................................................................................................... 8 Program Implementation.................................................................................................. 9
PROGRAM MODEL..................................................................................................................... 10 PROGRAM GOALS, KEY OBJECTIVES AND EXPECTED OUTCOMES............................. 12
Albertsons ........................................................................................................................ 27 New Seasons Market....................................................................................................... 27 Yoke’s Fresh Markets...................................................................................................... 28 Town & Country Markets ............................................................................................... 28 Other Program Activities................................................................................................ 29
PERCEPTIONS OF THE PROGRAM ........................................................................................ 29 Goals and Objectives ....................................................................................................... 30 Implementation ............................................................................................................... 32 Expectations for Program Progress................................................................................ 35
Table of Contents
MPER: BETTERBRICKS SMART MARKETS PROGRAM PAGE II
4. BASELINE RESULTS ................................................................................................................. 37 SUMMARY OF BASELINE RESULTS FROM REGIONAL GROCERY CHAIN
FACILITY DECISION-MAKERS .......................................................................................... 37 SUMMARY OF BASELINE RESULTS FROM GROCERY STORE MANAGERS ................. 39 SUMMARY OF BASELINE RESULTS FROM REFRIGERATION CONTRACTORS........... 40 SUMMARY OF SURVEY RESULTS FROM REGIONAL WHOLESALER DESIGN
AND CONSTRUCTION LEADS............................................................................................ 41
5. REVIEW OF PROGRAM EXPECTATIONS AND ACE MODEL ................................................. 45 SUMMARY ................................................................................................................................... 45 REVIEW OF PROGRAM EXPECTATIONS .............................................................................. 45 ALLIANCE COST-EFFECTIVENESS MODEL REVIEW........................................................ 49
Alignment of Program Expected Outcomes and Cost-Effectiveness Analyses ........... 52
6. CONCLUSIONS AND RECOMMENDATIONS........................................................................ 55 SUMMARY OF FINDINGS......................................................................................................... 55 CONCLUSIONS AND RECOMMENDATIONS ........................................................................ 57
APPENDIX E: SUPPORTING INFORMATION FOR THE ACE MODEL ANALYSIS ....... E-1
APPENDIX F: DATA COLLECTION INSTRUMENTS...........................................................F-1 Grocery Store Market Segment: Corporate Facility Leader Survey..........................F-1 Grocery Store Market Segment: Wholesaler Planning Department Survey .......... F-11 Grocery Store Market Segment: Grocery Store Manager Survey............................ F-21 Grocery Store Market Segment: Refrigeration Trade Ally Survey......................... F-27
Table of Contents
MPER: BETTERBRICKS SMART MARKETS PROGRAM PAGE III
Grocery Store Market Segment: Program Staff and Market Specialist Interview Questions ............................................................................................... F-35
MPER: BETTERBRICKS SMART MARKETS PROGRAM PAGE I
EXECUTIVE SUMMARY
The Northwest Energy Efficiency Alliance (the Alliance) is a non-profit corporation supported by the Bonneville Power Administration, electric utilities, public benefits administrators, state governments, public interest groups and energy efficiency industry representatives. These entities work together to make affordable, energy-efficient products and services available in the marketplace.1
This Market Progress Evaluation Report (MPER) documents the results of baseline measurements for the BetterBricks Smart Markets Program2 (Smart Markets), targeted to regional grocery stores, as well as program activities between January 2003 and September 2005. The Smart Markets Program was originally approved in 2003 under the Commercial Building Initiative, an umbrella program for all Alliance commercial activities; it now operates under its successor, the Commercial Sector Initiative (CSI).
SUMMARY OF FINDINGS
The BetterBricks Smart Markets Program is at an early stage of development. The planning and transition stages just concluded and full-scale implementation began in early 2006. The primary findings reported in this MPER concern the baseline conditions for the various market actors targeted to be affected by Smart Markets and feedback from program staff and contractors concerning the planning and transition phase.
The grocery store market is one of three vertical markets that are targeted through the CSI. The main program goal is to change business practices to incorporate energy management principals on a consistent and sustainable basis. The program staff and contractors are generally enthusiastic about the program goals and the capabilities the Alliance has developed in the CSI and for the grocery store market. There are also challenges in this approach: grocery stores tend to be action-oriented and may be more attracted to immediate, discrete project activities than to the longer-term sustainable practices the Alliance is targeting.
1 See the website at www.nwalliance.org.
2 BetterBricks is the “face” of CSI marketing activities. Connecting CSI activities under one brand helps maximize effectiveness across markets. More information is available at www.betterbricks.com.
Executive Summary
MPER: BETTERBRICKS SMART MARKETS PROGRAM PAGE II
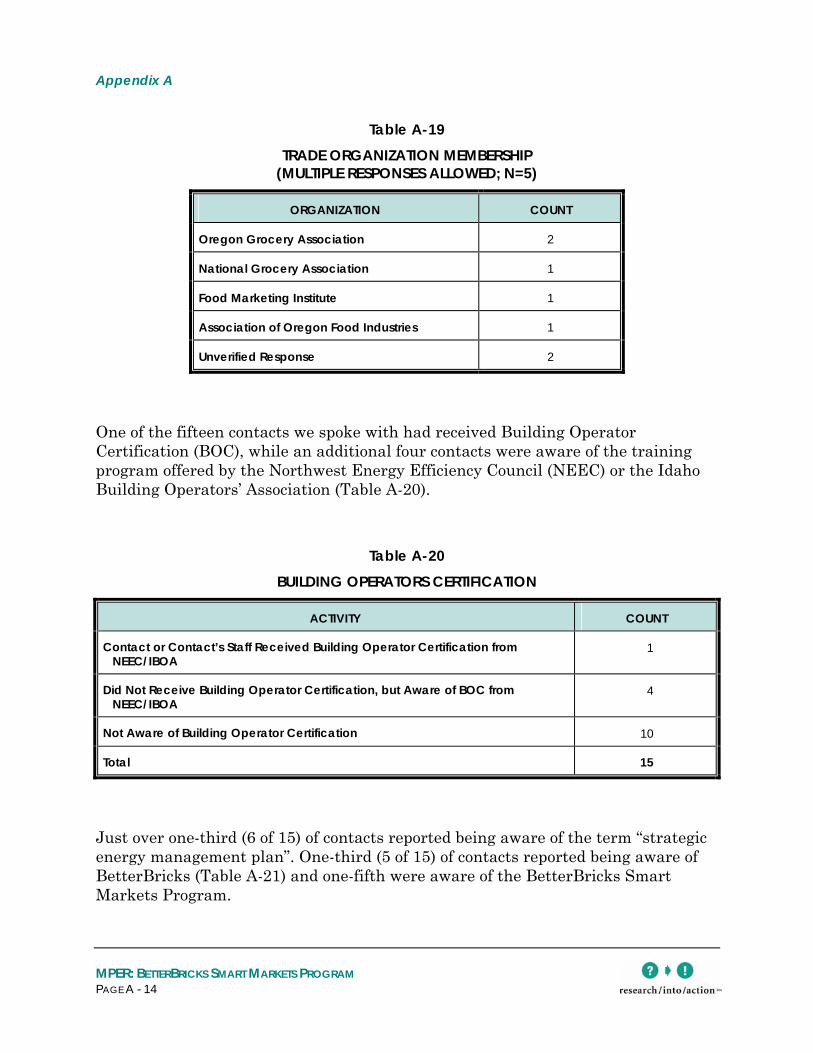
The baseline studies conducted for this MPER show that the energy efficiency practices and behaviors promoted by Smart Markets are already present to a limited degree in regional grocery store chains. Among facility leads for regional corporate chains, energy management is a familiar term and has been requested and supported by organizational management. Many efficiency solutions are already in place, but the more high performance solutions are done less frequently, and it is these activities that are likely targets for change in business practices.
A similar picture emerges for grocery store managers who oversee the daily operations of the region’s stores. Most of the managers review their energy usage and report familiarity with many fundamental operations practices: case shelf stocking, maintenance of frozen door seals, controls on parking-lot lights, etc. In general, these practices are implemented by 10% to 20% fewer managers than are familiar with the practice.
Regional wholesaler contacts involved in design and construction decisions also report strong support for energy efficiency in their organizations, though they report limited use of high performance solutions. First-cost was clearly viewed as the most important criteria in financial decisions. Unfortunately, the reliability of this information for the purposes of establishing a baseline is low. Of the total of six regional wholesalers in the area, only two of the three we spoke with and only one of the three we did not speak with are currently providing services to regional chains on new construction decisions. Thus, the research confirmed that wholesalers are one of the sources of influence on design and construction practices for regional grocery stores, but that specialty design firms also may be influential.
Refrigeration contractors throughout the Northwest tend to work with regional chains, as well as national chains and convenience stores. Refrigeration contractors interviewed were familiar with the equipment and practices that are part of Smart Markets, but several noted that energy-efficient motors have not functioned well in refrigeration environments. These contractors also report that national chains tend to have more specifications and clearer requirements for energy efficiency, but that regional chains can sometimes be more efficient than the nationals because they target niche markets (like organic foods) which require a higher quality of refrigeration equipment. At the same time, there are other regional chains that are focused on low cost and thus tend to have much older equipment than do the nationals, and are much less aware of or willing to invest in efficient solutions. These differences between regional and national chains were apparent for all aspects of refrigeration contractors’ practices and clearly support the value for improving regional grocery store business practices.
Executive Summary
MPER: BETTERBRICKS SMART MARKETS PROGRAM PAGE III
CONCLUSIONS AND RECOMMENDATIONS
These findings suggest the following conclusions and recommendations.
Conclusion 1: The BetterBricks Smart Markets Program is well on its way to implementation. As the planning and transition phases draw to a close, a clear approach has been developed for implementation and efforts are underway to reach the regional grocery chains. The efforts to date by the Alliance planning contractors and the BetterBricks Technical Advisors3 have laid the groundwork for implementation. At the same time, the primary effort to develop the approach has been internal to the Alliance and the BetterBricks Technical Advisors report being unfamiliar with many of the details of the approach.
Recommendation 1: Begin to communicate clearly with the Technical Advisors and inform them of their roles and responsibilities, as well as the vision and approach to be used in Smart Markets. Use this communication and coordination process to ensure that the Technical Advisors are included in planning and strategizing how to reach regional grocery contacts, as several have developed access during the planning and transition phase. More generally, increased communications with all other CSI teams should be initiated, particularly those for marketing and education and training.
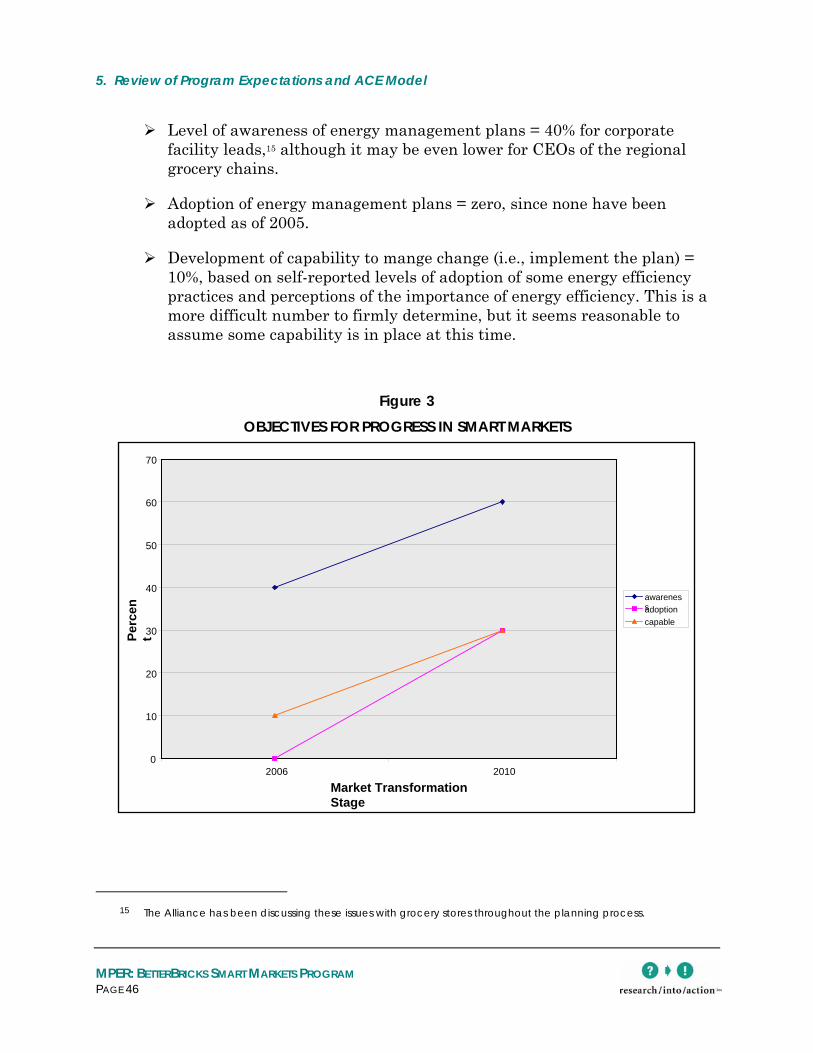
Conclusion 2: The BetterBricks Smart Markets Program objectives are not well-aligned. The objectives for awareness of the benefits available from energy efficient, high performance groceries; the adoption of energy management plans; and implementing changes in energy-related business practices as currently defined are interdependent. It is logical to assume that only a subset of those with awareness will move on to adopt plans or implement changes. Our analysis, based both on our own evaluation of other projects and on similar work from other evaluators, suggests that either the objective for awareness (60% by 2010) is too low to accomplish the other objectives and expected outcomes (30% adoption of planning and 30% presence of capability to implement by 2010) or the objectives are set too high. Given the likely rate of increase in awareness, we would suggest that the outcomes are set too high.
Recommendation 2: Adjust the program objectives to make the relationship between them more plausible. Specifically, we suggest that the
3 The BetterBricks Technical Advisors include the BetterBricks Advisors and the Daylighting and Integrated Design
Labs.
Executive Summary
MPER: BETTERBRICKS SMART MARKETS PROGRAM PAGE IV
objectives regarding adoption of energy plans and regarding changes in energy-related business practices be reduced.
Conclusion 3: ACE models appear inconsistent with stated expected program outcomes due to lack of documentation. The expected 2010 outcomes for energy savings for the program are that 30% of existing grocery stores will reduce energy usage by 10% and 30% of new grocery square footage will be designed to perform 25% more energy efficiently as compared to baseline levels. This is not reflected in either the new construction or the building operations ACE model analyses. As shown in Table E-1 in Appendix E, the new construction ACE model shows a value of 15.9% for market penetration in 2010 and 30% in 2012. The ACE model for building operations (Table E-2) shows 23% for market penetration in 2010 and 30% in 2011. Interviews with the Alliance planning manager clarified that the two-year time-lag to the 30% expected outcome for new construction and the one year time-lag to 30% for building operations were purposeful and reflected a conscious understanding that there would be a gap between when projects were completed and when savings would be achieved. This understanding is not documented anywhere in the ACE model.
Recommendation 3: Add clear documentation to the ACE model explaining why the 2010 expected program outcomes are not achieved until one to two years later.
Conclusion 4: Design and construction contacts need to be identified. The Alliance provided us with a list of six wholesalers that might be involved in design and construction services to regional chains. Only two of the three contacts we spoke with and only one of the three we did not speak with are currently providing services to regional chains on new construction decisions. Given this, it is clear that the baseline for design and construction support services is not sufficient for long-term tracking of progress in new construction practices and behaviors.
Recommendation 4: The Alliance should expend resources to directly identify design and construction service providers for the grocery store market. The CSI baseline study for regional architects identified six architects that specialize in grocery stores.4 This may be a useful source. Additionally, as the business advisor works in the field, he should ask about design and construction leads, as well as firms that are working with regional chains on upgrades, remodels and new construction projects.
4 Peters, J.S., Mike Burdick and Robert Scholl. Commercial Sector Initiative Baseline Market Study: Architects. E04-
134. Portland, Oregon: Northwest Energy Efficiency Alliance. November 2004.
Executive Summary
MPER: BETTERBRICKS SMART MARKETS PROGRAM PAGE V
Conclusion 5: At least one of the technologies the Alliance wants to promote appears to require more research before it will be accepted by the market. The refrigeration contractors noted that the energy-efficient motors they have used don’t work in wet locations. This is a clear barrier to using energy-efficient motors in refrigeration systems and needs additional research before Smart Markets promotes the technology.
Recommendation 5: As has often been the case previously with energy efficiency products and services, it is important to understand the constraints on application of the measure before launching promotions. Working with companies that have experience in the field to identify problems and then working with manufacturers to address the field experiences is probably the most effective way to ensure that products can enter the market and be easily accepted.
MPER: BETTERBRICKS SMART MARKETS PROGRAM PAGE 1
1. INTRODUCTION
The Northwest Energy Efficiency Alliance (the Alliance) is a non-profit corporation supported by the Bonneville Power Administration, electric utilities, public benefits administrators, state governments, public interest groups and energy efficiency industry representatives. These entities work together to make affordable, energy-efficient products and services available in the marketplace.5
This Market Progress Evaluation Report (MPER) documents the results of baseline measurements for the BetterBricks Smart Markets Program6 (Smart Markets), targeted to regional grocery stores, as well as program activities between January 2003 and September 2005. The Smart Markets Program was originally approved in 2003 under the Commercial Building Initiative, an umbrella program for all Alliance commercial activities; it now operates under its successor, the Commercial Sector Initiative (CSI).
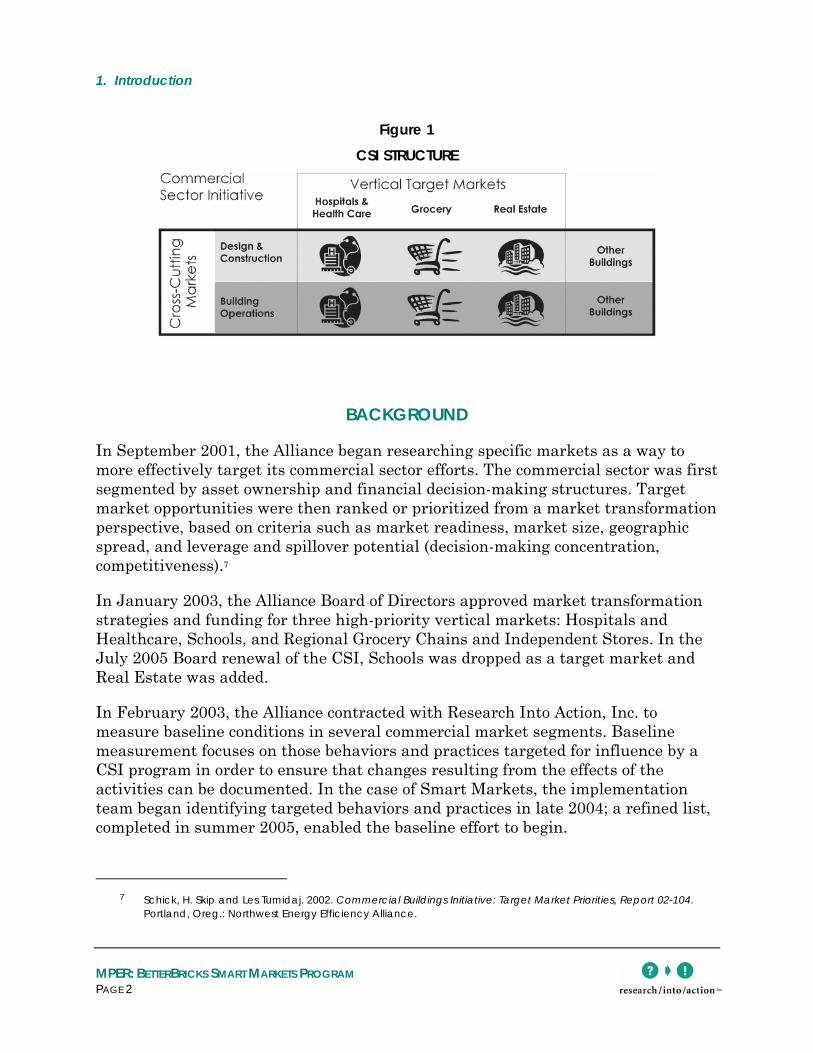
The CSI comprises all of the Alliance’s commercial sector activities. It currently addresses three “vertical” markets (hospitals and healthcare, groceries, and commercial real estate) and two “cross-cutting” markets (design and construction, and building operations), as shown in Figure 1.
5 See the website at www.nwalliance.org.
6 BetterBricks is the “face” of CSI marketing activities. Connecting CSI activities under one brand is expected to maximize effectiveness across markets. More information is available at www.betterbricks.com.
1. Introduction
MPER: BETTERBRICKS SMART MARKETS PROGRAM PAGE 2
Figure 1 CSI STRUCTURE
BACKGROUND
In September 2001, the Alliance began researching specific markets as a way to more effectively target its commercial sector efforts. The commercial sector was first segmented by asset ownership and financial decision-making structures. Target market opportunities were then ranked or prioritized from a market transformation perspective, based on criteria such as market readiness, market size, geographic spread, and leverage and spillover potential (decision-making concentration, competitiveness).7
In January 2003, the Alliance Board of Directors approved market transformation strategies and funding for three high-priority vertical markets: Hospitals and Healthcare, Schools, and Regional Grocery Chains and Independent Stores. In the July 2005 Board renewal of the CSI, Schools was dropped as a target market and Real Estate was added.
In February 2003, the Alliance contracted with Research Into Action, Inc. to measure baseline conditions in several commercial market segments. Baseline measurement focuses on those behaviors and practices targeted for influence by a CSI program in order to ensure that changes resulting from the effects of the activities can be documented. In the case of Smart Markets, the implementation team began identifying targeted behaviors and practices in late 2004; a refined list, completed in summer 2005, enabled the baseline effort to begin.
7 Schick, H. Skip and Les Tumidaj. 2002. Commercial Buildings Initiative: Target Market Priorities, Report 02-104.
Portland, Oreg.: Northwest Energy Efficiency Alliance.
1. Introduction
MPER: BETTERBRICKS SMART MARKETS PROGRAM PAGE 3
Context for the Smart Markets Initiative
The context for Smart Markets is grounded in CSI’s goal to:
Make energy efficiency an integral part of business decision-making. Within targeted vertical markets change energy related business practices to achieve energy efficiency in design and construction and in building and facility operations. Create natural market demand for related trade ally products and services.8
The focus on business decision-making reflects an evolving Alliance recognition, based on its eight years of work in the commercial sector, that the lack of demand for energy efficiency by business decision-makers has hampered the adoption of energy-efficient practices being promoted through technical assistance programs. Technical assistance, particularly for new building design, was the primary tactic used between 2003 and 2005 in the Alliance’s commercial programs. However, by 2004 it had become increasingly clear that in order to accomplish market transformation within the commercial sector, the Alliance would need to be more actively involved in the business decision-making processes that largely determine the extent of the energy efficiency activities conducted in each target market.
The July 2005 Renewal Plan for CSI for the 2006-08 program years specifically defines the theory of change for the market and how the Alliance will support this through their funding of business advisors and technical specialists. Specific energy saving outcomes that should result from these activities are also identified.
EVALUATION APPROACH
This MPER is based on interviews with Alliance program staff and contractors, surveys of market actors and a review of program documents. The evaluation began with a review of program documents, as well as discussions with the program planning team and the business advisor to identify key issues and target populations for the baseline surveys.
We developed draft data collection instruments for each of the target populations for the baseline survey, and each draft was reviewed by Alliance staff and the business advisor. (See Appendix F for copies of the instruments.) The target populations for the baseline surveys include: (a) the corporate facility leads for each of the 24 regional chains targeted by Smart Markets; and (b) the lead for design and construction at the six targeted regional wholesalers. In addition, baselines were
developed for grocery store managers who are on the frontline for store operations and the refrigeration contractors who provide services for the major energy-using equipment in grocery stores. These target populations and the achieved samples for each are presented in Table 1.
Table 1 POPULATIONS FOR SMART MARKETS MPER
MARKET ACTOR GROUP POPULATION SAMPLE ESTIMATED CONFIDENCE/
Grocery Store Chain – Local Store Managers 222 51 90% +/-8%
Wholesaler – Design and Construction Leads 6 3 NA
Refrigeration Contractor 33 14 85% +/- 10%
The analysis of the data proceeded in two steps. The baseline data were collected using Data Entry Builder, a software tool that permits data entry during the interview process, and analyzed using the Statistical Package for the Social Sciences (SPSS). We relied largely on counts and frequencies, as the samples were insufficient for statistical analysis. The interview data were qualitative and were analyzed using triangulation, in which the multiple points of view were compared and contrasted to develop a comprehensive understanding of the program experience.
The program document review was used to support the qualitative data analysis and to provide context and background for the analysis. As an outgrowth of the qualitative analysis process, we prepared a logic model for the program. Finally, we reviewed the Alliance Cost Effectiveness (ACE) model, both to understand the
1. Introduction
MPER: BETTERBRICKS SMART MARKETS PROGRAM PAGE 5
program and to consider, in light of program experience, the reasonableness of the assumptions.
Completed and planned research activities to support this and future MPERs are shown in Table 2.
Table 2 RESEARCH ACTIVITIES
ACTIVITY MPER #1 (COMPLETED)
MPER #2 (PLANNED)
MPER #3 (PLANNED)
Baseline Surveys
• Grocery Store Chain – Corporate Facility Leads X X
• Grocery Store Chain – Local Store Managers X X
• Grocery Store Chain – Decision-Makers X
• Wholesaler – Design and Construction Leads X X
• Refrigeration Contractors X X
• Design Professionals X
Program/Staff Interviews
• Program Staff and Contractors X X X
• Business Advisors X X X
Review Logic Model: Outcomes, Goals, Progress Indicators X X X
Assess Marketing Efforts X X
Assess Education and Training Efforts X X
Assess Energy Plans X X
Market Characterization X X
Assess Market Progress X X
1. Introduction
MPER: BETTERBRICKS SMART MARKETS PROGRAM PAGE 6
CONTENTS OF THIS MPER
This MPER includes six chapters. Each chapter begins with a summary of the chapter and then presents the findings that support the summary. Chapter 2 presents a history of Smart Markets and a discussion of the perceptions of the program design and intent among the Alliance staff and business and technical advisors serving the grocery sector. Chapter 3 presents summaries of the baseline results for surveys of grocery chain corporate facility leads, grocery store managers, wholesaler design and construction departments, and refrigeration contractors. (The results for each survey are detailed in Appendices A through D.) Chapter 4 describes the recommended progress indicators and Chapter 5 provides an assessment of the ACE model for Smart Markets. Finally, Chapter 6 presents our conclusions and recommendations.
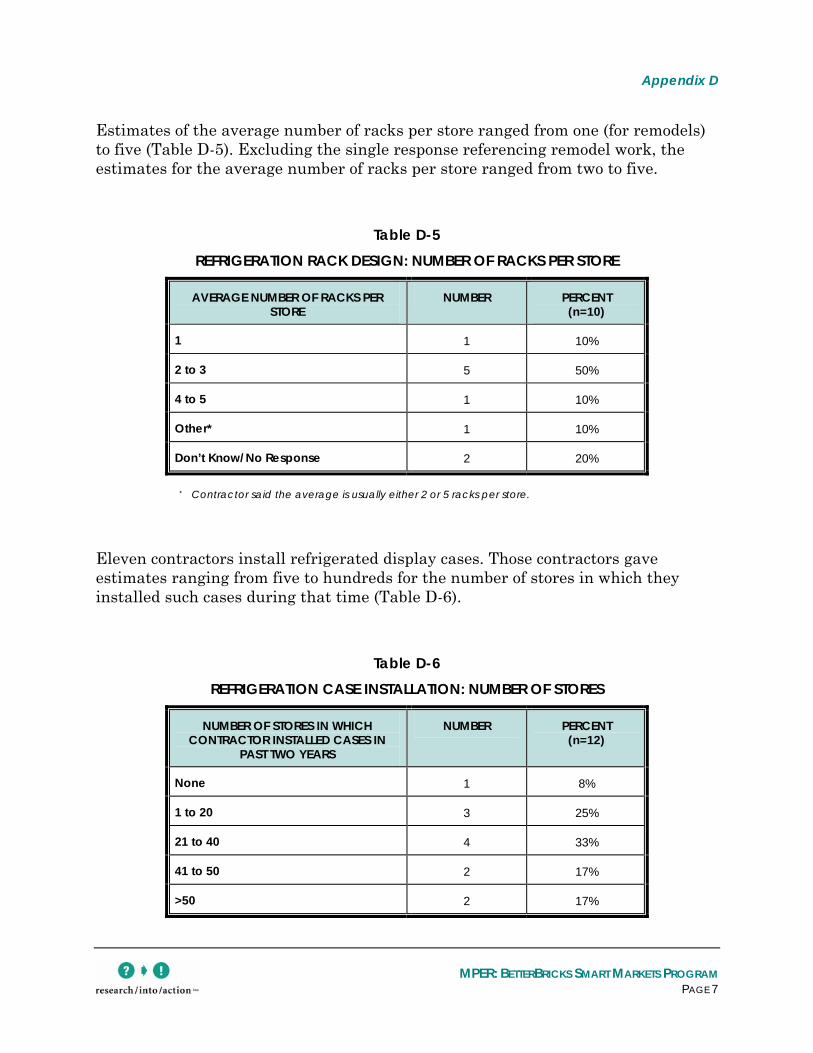
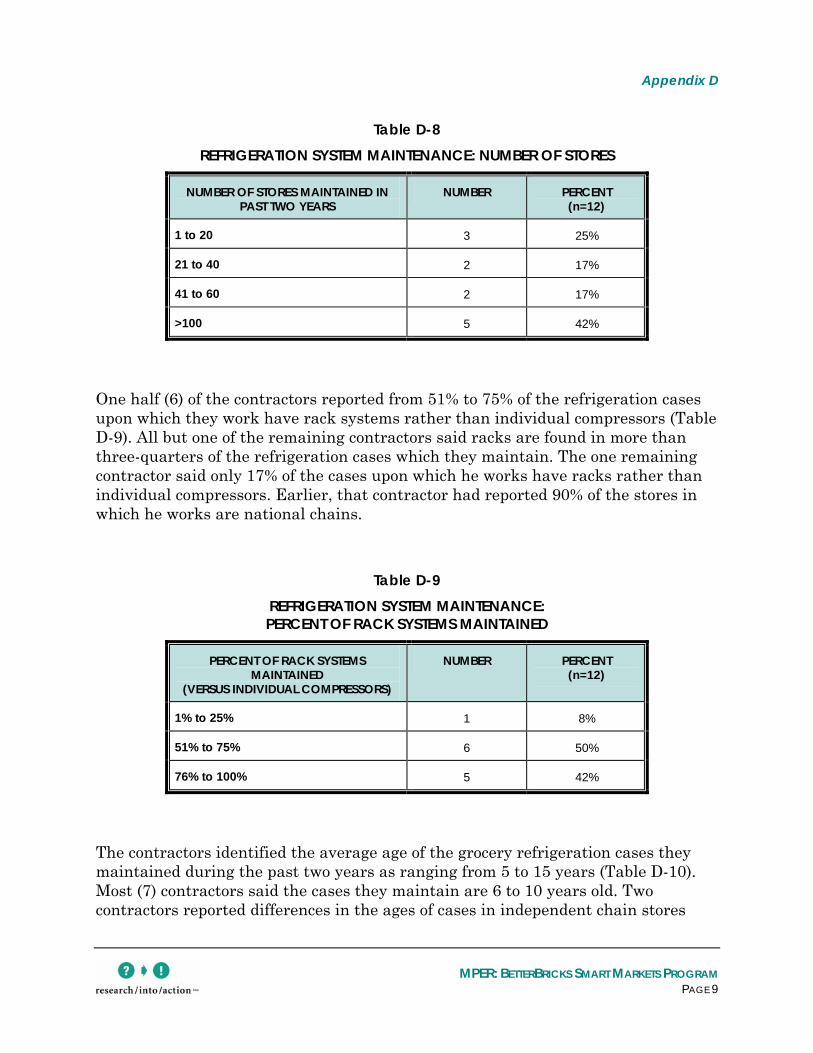
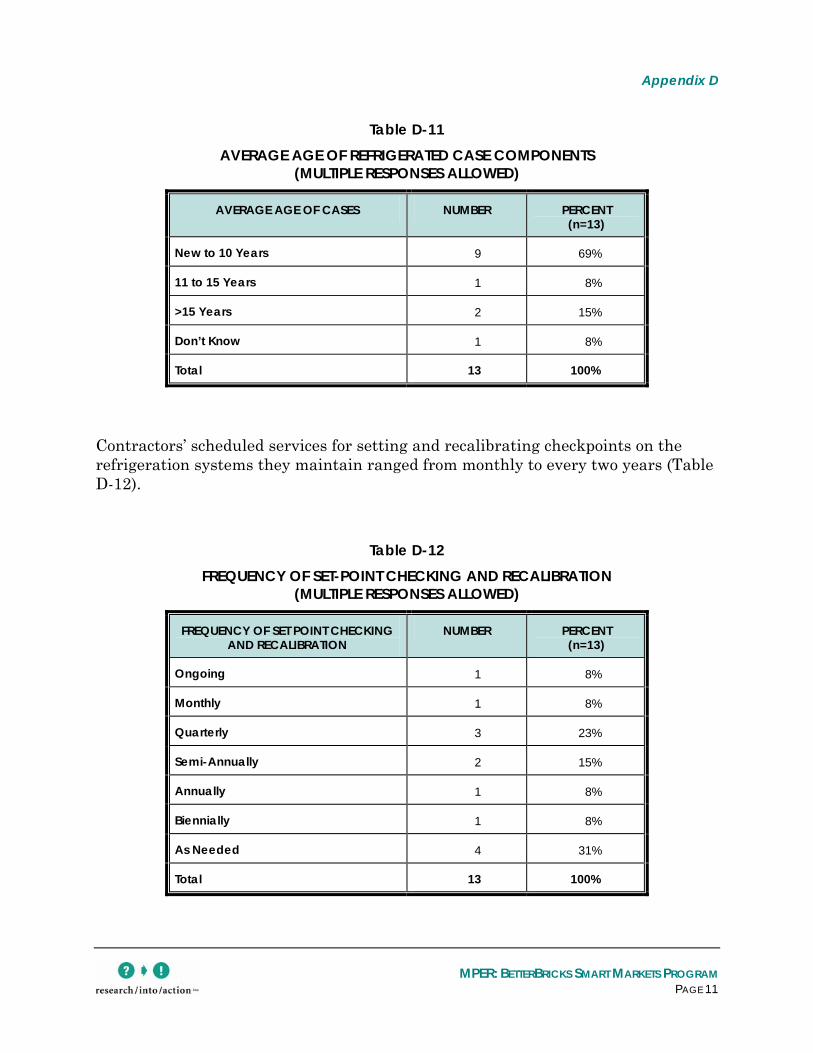
MPER: BETTERBRICKS SMART MARKETS PROGRAM PAGE 7
2. PROGRAM DESCRIPTION AND INDICATORS OF PROGRESS
This chapter provides a detailed description of the Smart Markets Program. The description is followed by a graphical program model and a description of the goals and objectives and the progress indicators for the program.
DESCRIPTION OF THE BETTERBRICKS SMART MARKETS PROGRAM
Background
The 2001 Alliance target market research found that, through the regional wholesalers and large chain operators, regional grocery chains offered attractive leverage points to achieve energy efficiency improvements in existing store operations and in design and construction for new stores. The research determined that intense competition continues to drive mergers, store development and improvements, and cost containment.
The Alliance believes that these circumstances provide a unique opportunity to influence energy-related decisions and effect long-term changes in business practices (store design and remodeling practices, O&M programs, etc.) that can be applied chain-wide. Smart Markets plans to work directly with regional grocery wholesalers and larger chain operators (>5 and <35 locations) to change energy-related business practices for a substantial portion of the grocery market.
The targeted changes in business practices will result in facilities that achieve reductions in energy-related capital and operating costs, as well as potential non-energy benefits and an alignment of design and construction with industry best practices. The market transformation theory and program logic focus on the following hypotheses:
If regional grocery chain decision-makers (and their wholesalers) are aware of the benefits available through improving energy-related business practices, then they will initiate and/or support energy management plans and changes in business practices.
If energy managers, store managers and others have a license to pursue energy management more aggressively, and are given the necessary support, they will develop and implement plans to do so.
2. Program Description and Indicators of Progress
MPER: BETTERBRICKS SMART MARKETS PROGRAM PAGE 8
If grocery decision-makers request trade ally support to achieve energy efficiency in design and construction and facility operations, then the trade allies will be able and willing to support these efforts.
If trade allies for grocery stores are provided with training and support by BetterBricks Technical Advisors, then they will be able to support grocery facility requests for energy efficiency in design, construction and facility operations.
The basic program logic is described below and is more fully discussed in Chapter 5. The program logic leads to sustainable changes in business practices and policies, such as always considering life-cycle costs, rather than just first-cost for energy-related investments. When implemented, these policies would make energy efficiency standard in grocery procurement, management and operations, and in construction and design for upgrades and new buildings.
To achieve these changes, the Alliance has contracted with a business advisor to work directly with grocery chains and wholesalers, and plans to contract with a second to work with the refrigeration contractors who provide services to grocery stores. To identify receptive organizations, the business advisors are meeting with corporate contacts at the regional grocery chains and wholesalers who are responsible for financial decisions, operations decisions and facility management. The business advisor will conduct an assessment of candidate organizations to identify opportunities and from this information will create an account plan for implementing sustainable change at selected companies.
Energy Plans
The main strategy used to achieve the goal of changing energy-related business practices is to encourage companies to create comprehensive, integrated energy plans. Ideally, these plans would include energy goals and objectives, as well as timelines and responsibilities for achieving them. Key to the success of a plan is organizational commitment and the allocation of necessary resources. Core business practices that should be addressed by a comprehensive plan include financial decision-making, financial analysis methods, facility operating performance, facility upgrades, equipment procurement practices, design and construction practices, and monitoring and tracking of performance.
The energy plan concept is flexible and serves merely as a means to the end of increasing a company’s energy efficiency. A formal and detailed SEMP is appropriate for a multi-million dollar, multi-state grocery chain, but not for a regional grocery chain with six stores. For these smaller organizations that
2. Program Description and Indicators of Progress
MPER: BETTERBRICKS SMART MARKETS PROGRAM PAGE 9
represent the target audience for Smart Markets, a simple series of energy management guidelines or best practices and a brief plan for their implementation by store managers or a facility director would be more appropriate. In all cases, however, the goal is to integrate energy efficiency thinking into the normal business processes of the company. A prime example would be to replace simple payback with life-cycle costing when purchasing energy-consuming equipment. Once such a policy is in place and accepted as the standard practice, the purchase of high-efficiency equipment would become the norm. Without such a policy, facility managers or trade allies have to make the case for more expensive high-efficiency equipment on a project-by-project basis. An energy plan institutionalizes the practice so it is done on a consistent basis.
As important as the energy plan itself is the process through which it is developed and implemented. To be successful, this process must result in much more than a piece of paper. It must generate an understanding of the benefits that will arise from implementing the plan that is shared by decision-makers, financial analysts, facility managers, construction managers, procurement agents and everyone else who will be affected. This understanding must ultimately lead to a company-wide commitment to make it happen. Plans and policies that sit on a shelf are common. The Alliance’s goal is to ensure that the concepts contained in an energy planare translated into practices and actions that save energy.
Program Implementation
The business advisor to the chains and wholesalers will demonstrate the business case for Smart Markets, assess the chains’ energy management capabilities, support the development of an energy management plan, and provide advice on and support for plan implementation. The business advisor to the refrigeration contractors will identify contractors willing to participate in trainings offered by Alliance technical advisors and projects associated with high-performance grocery stores.
In addition to the business advisors for Smart Markets, the Alliance’s grocery store program manager will be able to leverage BetterBricks Technical Advisors (the BetterBricks Advisors and the Daylighting and Integrated Design Labs) and skills from the CSI’s design and construction and building operations programs, as well as the services of CSI’s marketing team. The role of the BetterBricks Advisors will be particularly important as projects are implemented by targeted firms, either for demonstration purposes or to support implementation of an energy plan.
2. Program Description and Indicators of Progress
MPER: BETTERBRICKS SMART MARKETS PROGRAM PAGE 10
Equally important within the program logic is building the technical capability among trade allies in the design and construction fields that serve grocery stores. Grocery stores are different from the other vertical markets, as they require services from refrigeration contractors in addition to those for electrical lighting and mechanical (HVAC) systems. The refrigeration business advisor will therefore meet with refrigeration contracting firms and develop account plans to build the capability and capacity of these firms to provide a service package to support energy efficiency improvements in grocery stores. As with the grocery stores themselves, the basis of these plans and the key to their acceptance will be a business case for the value to be gained by refrigeration contractors implementing such practices.
PROGRAM MODEL
A graphic model of the program is displayed in Figure 2. The model places the program logic within the context of how the market for energy efficiency appears to operate without the program and suggests that Smart Markets will stimulate the adoption of energy planning approaches that otherwise would not be adopted in this vertical market. The right-hand side of the figure shows how a typical grocery store facility staff or a wholesaler design and construction staff might conduct a project with an energy efficiency component. If that project were successful, the facility manager or design and construction staff would have an interest in knowing more and would likely conduct additional projects. Smart Markets seeks to intervene with those chains and wholesalers who have completed some projects and are interested in knowing how to apply energy efficiency more generally in their business practices.
This point of contact is represented by the oval Business Advisors Outreach toward the middle of the figure. Business advisors will seek out those organizations and develop the account plan to assist the organization to transition to more energy-efficient business practices. That process, using the colored boxes, suggests that the business advisor will work with the CEOs of the regional chains, with the facility leads for the chains, and with design and construction staff for the wholesalers or architects that supply the chains. Each of these groups has a specific role to play in the process and the business advisor will facilitate that process.
The CEOs need to become aware of the business case for change and to recognize the need to allocate resources, develop a plan and provide a directive for the new business practices. The facility leads will first need to be aware of and then be directly involved in developing a plan and the new business practices, and they will need a commitment of resources to do so. The wholesaler design and construction or architect staffs will also need to be aware of the business case for change and be trained and capable of responding to requests for services from the regional chains.
2. Program Description and Indicators of Progress
MPER: BETTERBRICKS SMART MARKETS PROGRAM PAGE 11
Figure 2 MARKET PROCESS FOR ENERGY EFFICIENCY IMPROVEMENTS WITH ALLIANCE SMART MARKETS PROGRAM MODEL
Grocery store facility staff aware
of energy efficiency solutions
Grocery store facility staff implement Energy Efficiency
Projects (one at a time)
Wholesaler Design & Construction staff include energy efficiency
solutions in construction projects
Project experience increases their interest in knowing more
about Energy Efficiency
Efficiency investments continue
Wholesaler D&C staff include more energy efficiency solutions
in construction projects
Chain facility staff implement more energy efficiency practices
and projects
Trade Allies trained by BB Technical Services and able to provide HPH
services
BB Technical Services support implementation of account plan
Alliance marketing efforts provide support to Business Advisors and BB
Technical Services
BB Technical Advisors provide services to Trade Allies who serve the grocery
store marketplace
Firm-focused plan for refrigeration
contractors
Business Advisors develop
Account Plan
Business Advisors Outreach
Chain CEO requests capability and allocates resources to develop energy
management approach
Chain CEO requests capability and allocates resources to implement energy
management plans
Chain CEO aware
Corporate facility lead
aware
Wholesaler staff
aware
Facility manager and others develop energy management approach
Various departments implement business practice aspects of energy management approach. Lifecycle cost analysis applied to practices and projects as practical.
Chain CEO managers implement
business practices
Store managers implement behavioral
operations changes
Chain facility lead implements
operations practices and facility upgrades
Grocery D&C staff implement
construction practices
30% of grocery chains’ procurement specifications for all energy services and equipment include energy
efficiency requirements
30% of grocery stores reduce energy usage in
building operations by 10%
30% of new grocery square footage is
designed to perform 25% more energy efficiently
30% of refrigeration contractors deliver best
practices in design 20% deliver best practices in
refrigeration O&M
Refrigeration contractors aware
Refrigeration contractors trained in use of service package
Refrigeration contractors
implement service package
More efficiency in
Pacific Northwest
MARKET PROCESS INPUTS
Alliance program staff Alliance contractors
Local utilities
EXTERNAL CONDITIONS Energy information
Utility programs Energy prices
Governmental policies and regulations Business conditions
Food prices
BEFORE PROGRAM
2006
2006
ENERGY EFFICIENCY INVESTMENTS ARE SUSTAINED AS ADDITIONAL CHAINS ADOPT BUSINESS PRACTICES ON THEIR OWN USING SERVICES AND SUPPLIERS AVAILABLE IN THE MARKETPLACE
2. Program Description and Indicators of Progress
MPER: BETTERBRICKS SMART MARKETS PROGRAM PAGE 12
The refrigeration contractors will also need to be aware of the business case for change, both for grocery stores and for their own businesses, and they will need to be trained and capable of delivering a service package that addresses the energy efficiency needs of grocery stores that change their business practices.
During this process, the BetterBricks Technical Advisors and other CSI support services will be providing training and advising services to trade allies throughout the region. These trade allies will be trained and capable of addressing requests from grocery stores and thus will facilitate the process of achieving long-term sustainable change in the grocery vertical market.
Finally, and most important from the Alliance’s perspective, the program theory assumes that chains which adopt and implement energy plans will gain competitive market advantages and that other chains will notice this and try to emulate the business practices on their own. Alliance marketing and training activities for the Smart Markets Program are aimed at raising general awareness of these advantages in the grocery industry, which should help speed this process. Transformation will be achieved when chains use the knowledge and capabilities available in the market to implement energy plans rather than relying on Alliance advice and resources.
PROGRAM GOALS, KEY OBJECTIVES AND EXPECTED OUTCOMES
The following goals, objectives and outcomes, are depicted in the program model and stated in the July 2005 Program Description document. Goals are the overall long-term behavior changes that the Alliance program efforts are targeted to achieve. The objectives are behavior changes the Alliance expects to achieve by 2010. The outcomes are changes in energy usage that the Alliance expects will result from the program activities by 2010. The stated long-term goals and key objectives for Smart Markets are listed below; the indicators that can be used to track progress toward these goals and objectives are discussed in the next section.
The long-term goals of the Smart Markets Program are:
Grocery owners and executive decision-makers expect energy-efficient (high-performance) buildings and operations, driving changes in energy-related business practices.
National and regional grocery stores adopt plans to change energy-related business practices, including design and construction and store operations.
2. Program Description and Indicators of Progress
MPER: BETTERBRICKS SMART MARKETS PROGRAM PAGE 13
Grocery store designers and construction managers effectively apply advanced design and construction practices, resulting in new and renovated grocery stores that are highly energy-efficient.
Energy managers, store managers and others make energy management an integral part of store operations, resulting in a high level of operating performance.
The key objectives, to be achieved by 2010, are:
Sixty percent of Northwest grocery decision-makers are aware of the specific benefits available from new and existing high-performance grocery stores.
Grocers representing 30% of the targeted food retail floor space adopt energy management plans that change business practices, including:
• One or more national chains with a significant Northwest customer base
• One or more regional wholesalers with a significant Northwest customer base
• Ten or more regional chains and/or independents
Thirty percent of grocery management/staff responsible for design and construction are capable of managing change in energy-related business practices.9
Thirty percent of store and/or facility managers are capable of managing change in energy-related business practices for facility operations.
Thirty percent of grocery facility operations staff are capable of providing or obtaining enhanced operations and maintenance services.
Northwest refrigeration service providers align their business to deliver best practices in refrigeration design, operations and maintenance.
9 The term “capable of managing change” is defined as: 1) Must have access to adequate financial and technical
resources to implement an agreed-upon SEMP, including the associated business practice changes and energy management projects; 2) must have access to other departments, such as finance, accounting, and planning, as needed to support business practice change and energy management activities; and 3) must have on-going access to the executive level (CEO, CFO, COO) to discuss and receive support for strategic energy management planning and implementation.
2. Program Description and Indicators of Progress
MPER: BETTERBRICKS SMART MARKETS PROGRAM PAGE 14
• Thirty percent deliver best practices in refrigeration design
• Twenty percent deliver best practices in refrigeration operations and maintenance
The expected outcomes for energy savings in 2010 are:
Thirty percent of the new floor space will be designed to perform at least 25% more energy efficiently than buildings designed to baseline levels.
Thirty percent of targeted grocery floor-space uses 10% less energy in building operations as compared to baseline levels.
Progress Indicators
The progress indicators are linked to the objectives in a series of tables for each market actor group targeted by the program. The first table lists indicators that will be tracked in a program database and through monthly reports by the business advisors.
The baseline measures for the progress indicators reported in the remaining tables are typically self-reports on behavior and practice adoption by the market actors as reported in baseline surveys. These serve as progress indicators toward achievement of the program objectives and, ultimately, the program outcomes. Because they are self-reports, it is important to collect multiple indicators and to use them to collectively assess progress toward the objectives.
The progress indicators, especially for refrigeration contractors, will likely be expanded as the Smart Markets products and services are developed and it becomes clear as to the direction of the services and as to what could be a useful indicator of progress. A survey with wholesaler design and construction services leads found that, while they play a role in new construction projects for grocery chains, they no longer have the primary role. Therefore, there are no baseline results for grocery store design and construction practices presented at this time. Additionally, no baseline was completed with CEO/CFOs for grocery chains at this point. It will be important to work with the program staff to assess the feasibility of such a baseline in the next six months. In the future, it is likely that other indicators could be identified for other market actor groups as products and services are developed; these should be incorporated into future survey efforts to track market progress.
2. Program Description and Indicators of Progress
MPER: BETTERBRICKS SMART MARKETS PROGRAM PAGE 15
PROGRESS INDICATORS
The key five-year objectives for Smart Markets are noted above. For each of these objectives, we have developed a set of indicators that can be used to track market progress over the five-year time period. In addition, we identified a list of outputs that can be used to track program progress. Table 3 presents recommended program tracking indicators for the Smart Markets Program. These typically can be followed in a program-tracking database or through monthly reports by the business advisors.
Table 3 PROGRAM TRACKING INDICATORS FOR SMART MARKETS
PROGRAM TRACKING INDICATOR GOAL STATUS SOURCE
REGIONAL GROCERY STORES DECISION-MAKERS
Business Advisor Contacts Program tracking database
Assessments Conducted Program tracking database
Energy Plans Consulted On 2 in first year
Program tracking database
Energy Plans Adopted 10 by 2010
Program tracking database
REGIONAL GROCERY STORES FACILITY LEADS
Business Advisor Contacts Program tracking database
Assessments Conducted Program tracking database
Consultations on Energy Plans 2 in first year
Program tracking database
Energy Plans Adopted 10 by 2010
Program tracking database
Training Provided Training has not been defined yet, but once defined can be tracked from business advisors’ monthly reports
Tools Provided Training has not been defined yet, but once defined can be tracked from business advisors’ monthly reports
Continued
2. Program Description and Indicators of Progress
MPER: BETTERBRICKS SMART MARKETS PROGRAM PAGE 16
PROGRAM TRACKING INDICATOR GOAL STATUS SOURCE
DESIGN AND CONSTRUCTION CONTACTS
Business Advisor Contacts Program tracking database
Assessments Conducted Program tracking database
Consultations on Energy Plans Program tracking database
Wholesaler Adopts Energy Plan 1 by 2010 Program tracking database
Training Provided Training has not been defined yet, but once defined can be tracked from business advisors’ monthly reports
Tools Provided Training has not been defined yet, but once defined can be tracked from business advisors’ monthly reports
REFRIGERATION CONTRACTORS
Business Advisor Contacts Program tracking database
Assessments Conducted Program tracking database
Training Provided Training has not been defined yet, but once defined can be tracked from business advisors’ monthly reports
Tools Provided Training has not been defined yet, but once defined can be tracked from business advisors’ monthly reports
NATIONAL GROCERY CHAINS
Business Advisor Contacts Program tracking database
Assessments Conducted Program tracking database
Energy Plans Adopted 1 by 2010 Program tracking database
Training Provided Training has not been defined yet, but once defined can be tracked from business advisors’ monthly reports
Tools Provided Training has not been defined yet, but once defined can be tracked from business advisors’ monthly reports
Table 4 through Table 7 display progress indicators the evaluation identified relative to the targeted objectives. Objectives are behavior changes that occur as a result of program activities. The progress indicators can provide a basis for
2. Program Description and Indicators of Progress
MPER: BETTERBRICKS SMART MARKETS PROGRAM PAGE 17
assessing change in terms of grocery chains’ commitment to energy efficiency and their rate of incorporating energy-efficient technologies into their procurement, operations, upgrades, and design and construction practices. No single indicator should be used, but rather these indicators should be used collectively to assess progress.
Each table displays the objective (in bold) and the suggested progress indicators for each market actor group, with baseline measures from the surveys documented in this MPER. Some of the objectives are repeated across multiple market actors, while others are only noted for one. In a few cases, we have identified a potential additional objective, these are noted in italics. Comments to the right provide additional information about the indicator.
Table 4 presents the indicators for the regional grocery store facility leads. The corporate facility leads have control over budgets associated with facility operations and maintenance (O&M) and sometimes remodeling, renovations and new construction. The total number of regional chains targeted by Smart Markets is 24.10
Table 4 PROGRESS INDICATORS FOR GROCERY STORE FACILITY LEADS
OBJECTIVE AND INDICATORS 2005 COMMENT
Sixty percent of Northwest grocery decision-makers are aware of the specific benefits available from new and existing high performance groceries.
• Executive level commitment to energy management 33% Very High
1-5 scale 5=Very High
• Aware of BetterBricks Smart Markets Program 20%
Continued
Grocers representing 30% of the targeted food retail floor space adopt energy management plans that change business practices.
• Aware of energy plan 40%
• Have an energy management plan Not asked in
10 In Table 4 and Table 6, those indicators reported as “not asked in baseline” were identified as important
indicators after the baselines had been designed and fielded. They will be included in future studies.
2. Program Description and Indicators of Progress
MPER: BETTERBRICKS SMART MARKETS PROGRAM PAGE 18
OBJECTIVE AND INDICATORS 2005 COMMENT baseline
Thirty percent of store and/or facility managers are capable of managing change in energy-related business practices for facility operations.
• Service contracts mention energy efficiency 4%
• Energy rate schedule and contracts reviewed within the last year 60%
• Local stores benchmarked 53%
• Energy performance targets developed for local stores 33%
• Energy management written into job descriptions of local store staff 4%
• Energy accounting software used 4%
• More than two-thirds of stores in chain use electronic controls on key energy-using systems:
1. Refrigeration 66%
2. HVAC system 50%
3. In-store lighting 33%
4. Parking-lot lighting 60%
• More than two-thirds of stores in chain follow best practices:
1. Maintenance program for frozen door seals 60%
2. Anti-sweat controls on refrigeration case doors 46%
3. Reduced lights during night stocking 40%
4. Airlocks at entrances/receiving doors 26%
5. Permanent split capacitor (PSC) motors 6%
6. Fans with electronically commutated motors 6%
• Staff has completed BOC training 4%
Continued
Thirty percent of grocery chains use procurement specifications for all energy services and equipment with energy efficiency requirements.
• Written specifications for purchasing equipment 40%
• Specifications for purchasing equipment require energy efficiency 4%
• Company wide-written guidelines for energy decisions 4%
2. Program Description and Indicators of Progress
MPER: BETTERBRICKS SMART MARKETS PROGRAM PAGE 19
OBJECTIVE AND INDICATORS 2005 COMMENT
Thirty percent of targeted grocery floor space uses 10% less energy in building operations as compared to baseline levels.
Electric EUI 54; Natural Gas
EUI .73
KEMA 2004
Table 5 displays indicators for progress within local grocery stores. The grocery store managers are most likely to be responsible for operations decisions and rarely make decisions about facility maintenance or new construction. The total number of grocery stores identified in the region is 222. The baseline is based on responses from 51 stores.
Table 5 PROGRESS INDICATORS FOR GROCERY STORE MANAGERS
OBJECTIVE AND INDICATORS 2005 COMMENT
Sixty percent of Northwest grocery store managers are aware of the specific benefits available from new and existing high-performance groceries.
• Executive-level commitment to energy efficiency NA Not asked in baseline
Grocers representing 30% of the targeted food retail floor space adopt energy management plans that change business practices.
• Executives have made a formal request that store reduce energy costs
52%
• Written energy usage goals exist 40%
• Progress toward energy usage goals are reviewed more than once a year
29%
Continued
Thirty percent of store and/or facility managers are capable of managing change in energy-related business practices for facility operations.
• Have airlock at customer entrance or receiving door 61%
• Controls on doors for freezers and coolers to reduce sweating 59%
• Control programs to shut off or reduce the lights for night stocking 51%
• Facility energy audits or assessments 24%
2. Program Description and Indicators of Progress
MPER: BETTERBRICKS SMART MARKETS PROGRAM PAGE 20
OBJECTIVE AND INDICATORS 2005 COMMENT
Thirty percent of grocery chains use procurement specifications with energy efficiency requirements.
• Lighting equipment purchase specifications include energy efficiency requirements
71%
• Refrigeration equipment purchase specifications include energy efficiency requirements
57%
Thirty percent of targeted grocery floor space uses 10% less energy in building operations as compared to baseline levels.
Electric EUI 54; Natural Gas
EUI .73
KEMA 2004
Thirty percent of the new floor space will be designed to perform at least 25% more energy efficiently than buildings designed to baseline levels.
To be measured by
Alliance
Table 6 provides progress indicators for refrigeration service contractors and a few crossover indicators that address the services grocery stores are requesting from refrigeration contractors. We identified 17 firms providing refrigeration services to regional grocery chains.
Table 6 PROGRESS INDICATORS FOR REFRIGERATION CONTRACTORS
OBJECTIVE AND INDICATORS 2005 COMMENT
Sixty percent of Northwest refrigeration service providers are aware of the specific benefits available from the refrigeration service package for high-performance groceries.
• Aware of BetterBricks Smart Markets Program – refrigeration service package
NA Not asked in baseline
• Company commitment to energy efficiency NA Not asked in baseline
Customers specify best practices in refrigeration service delivery.
• More than 50% of stores specify set-point maintenance 16%
2. Program Description and Indicators of Progress
MPER: BETTERBRICKS SMART MARKETS PROGRAM PAGE 21
OBJECTIVE AND INDICATORS 2005 COMMENT
Thirty percent of refrigeration service providers deliver best practices in refrigeration design: Design and Installation Service Providers.
• More than 50% of case designs use proprietary energy efficiency technology
30%
• More than 50% of rack designs use proprietary energy efficiency technology
30%
• More than 85% of new racks have floating head controls 44%
• More than 85% of new racks have floating suction controls 33%
Thirty percent of refrigeration service providers deliver best practices in refrigeration design: Installation-Only Service Providers.
• More than 75% of new cases have ECMs or PSCs 31%
• More than 80% of new cases have anti-sweat heater controls 54%
• More than 95% of new cases have T-8 lighting w/electronic ballasts 45%
Twenty percent of refrigeration service providers deliver best practices in refrigeration operations and maintenance.
• More than 50% of cases replace standard motors with ECMs or PSCs 14%
• Checking and recalibration of set-points semi-annually or more frequently
53%
• Stated ideal for checking and recalibration of set-points semi-annually or more frequently
53%
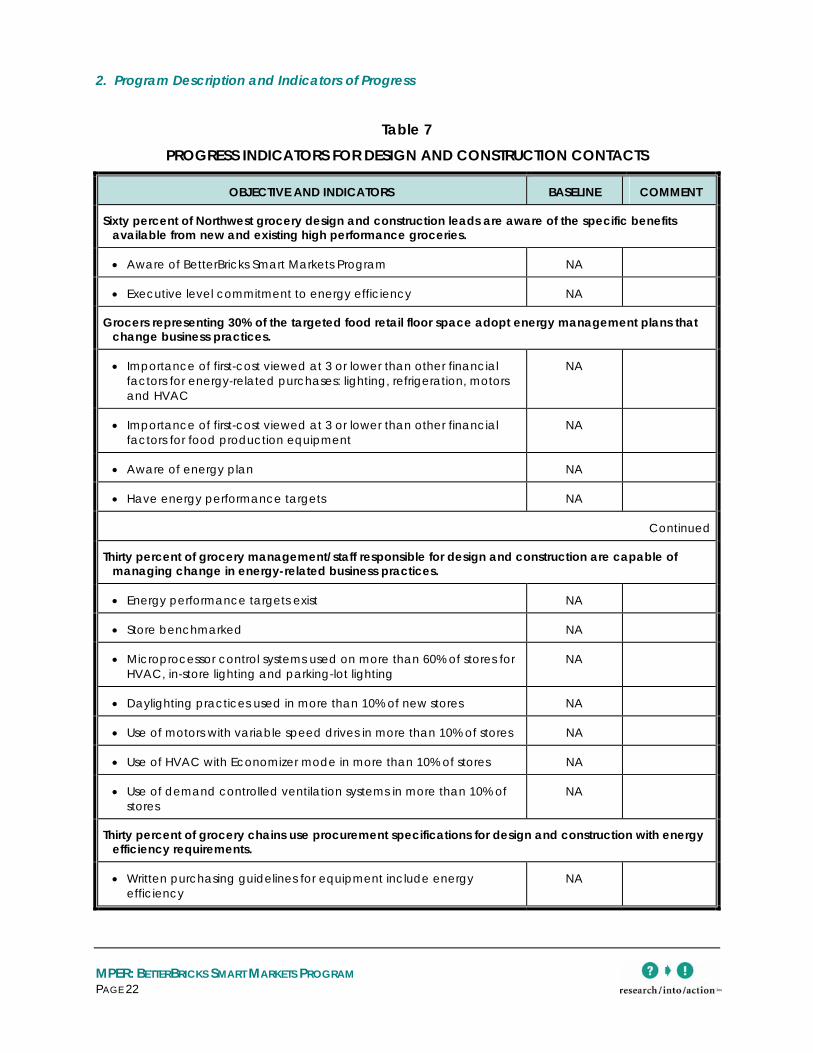
Table 7 focuses on the design and construction contacts for grocery stores. Design and construction services are provided by wholesalers (three of the six located in the region) and by architects and engineers (~50 based on Peters, et al., 2004) who work with grocery stores.11
11 Peters, J.S., Mike Burdick, and Robert Scholl. Market Baseline Evaluation Report: Architects. E04-134. Northwest
Energy Efficiency Alliance, Portland, Oreg.: November 2004.
2. Program Description and Indicators of Progress
MPER: BETTERBRICKS SMART MARKETS PROGRAM PAGE 22
Table 7 PROGRESS INDICATORS FOR DESIGN AND CONSTRUCTION CONTACTS
OBJECTIVE AND INDICATORS BASELINE COMMENT
Sixty percent of Northwest grocery design and construction leads are aware of the specific benefits available from new and existing high performance groceries.
• Aware of BetterBricks Smart Markets Program NA
• Executive level commitment to energy efficiency NA
Grocers representing 30% of the targeted food retail floor space adopt energy management plans that change business practices.
• Importance of first-cost viewed at 3 or lower than other financial factors for energy-related purchases: lighting, refrigeration, motors and HVAC
NA
• Importance of first-cost viewed at 3 or lower than other financial factors for food production equipment
NA
• Aware of energy plan NA
• Have energy performance targets NA
Continued
Thirty percent of grocery management/staff responsible for design and construction are capable of managing change in energy-related business practices.
• Energy performance targets exist NA
• Store benchmarked NA
• Microprocessor control systems used on more than 60% of stores for HVAC, in-store lighting and parking-lot lighting
NA
• Daylighting practices used in more than 10% of new stores NA
• Use of motors with variable speed drives in more than 10% of stores NA
• Use of HVAC with Economizer mode in more than 10% of stores NA
• Use of demand controlled ventilation systems in more than 10% of stores
NA
Thirty percent of grocery chains use procurement specifications for design and construction with energy efficiency requirements.
• Written purchasing guidelines for equipment include energy efficiency
NA
2. Program Description and Indicators of Progress
MPER: BETTERBRICKS SMART MARKETS PROGRAM PAGE 23
OBJECTIVE AND INDICATORS BASELINE COMMENT
• Written guidelines for new construction include energy efficiency NA
Thirty percent of the new floor space will be designed to perform at least 25% more energy efficiently than buildings designed to baseline levels.
NA
2. Program Description and Indicators of Progress
MPER: BETTERBRICKS SMART MARKETS PROGRAM PAGE 24
MPER: BETTERBRICKS SMART MARKETS PROGRAM PAGE 25
3. PROGRAM PROGRESS
This chapter discusses the history of Smart Markets, the progress made to date, and staff and contractor perspectives on the program.
SUMMARY
Smart Markets is one of the three vertical markets for the CSI. The goal of Smart Markets is to change business practices in regional grocery chains and wholesalers over the next five years so that sustainable energy savings are achieved. Smart Markets seeks transformative changes in the grocery store market segment for building operations, design and construction, and equipment selection and systems integration. The Alliance has hired a business advisor to work with regional chains, to coordinate a suite of advisory services from the BetterBricks Advising Services, and to generate products and services that can facilitate these business practice changes.
As of December 2005, the Alliance has completed the planning and transition phases of Smart Markets. Projects have been completed or are underway with three regional grocery chains, one wholesaler and one national grocery chain. More projects are expected to emerge as the program gets into full operation (scheduled for January 2006).
Staff and contractor perceptions of Smart Markets are generally positive. They perceive the model as one that can be valuable and useful to regional chains and wholesalers as these businesses face competitive challenges from national chains and each other, and need to address increasing energy costs. The staff and contractors also recognize a challenge for Smart Markets to balance the desire for immediate action (i.e., ad hoc projects) on the part of many regional grocery chains with the Alliance’s commitment to invest in sustainable practices that will result in permanent change to business practices.
3. Program Progress
MPER: BETTERBRICKS SMART MARKETS PROGRAM PAGE 26
PLANNING PHASE ACTIVITIES
The Alliance contracted with Schick Consulting and Pacific Energy Associates, Inc. (PEA) in 2001 to assist in program planning and an analysis of the commercial market.12 With the Board’s approval of the target markets in 2003, Schick Consulting and PEA were retained to develop the program plans and to go into the market to get feedback on initial program concepts. PEA staff focused specifically on the grocery store sector.
As they sought to develop more contacts in the grocery store sector and to develop the program plans, PEA came into contact with several people who were serving or had served as facility leads for regional chains and had a commitment to energy efficiency. Two of these contacts were put under contract to help develop program components. Additionally, the Alliance contracted with Ecotope and their subcontractor VaCom to analyze potential savings from best practices for refrigeration in grocery stores. In 2003 and 2004, the Alliance staff and their planning support contractors accomplished a variety of tasks to prepare for the implementation of Smart Markets. Specifically, they:
Traveled throughout the region, meeting with regional grocery chain contacts and gaining an understanding of the level and interest in energy management
Developed a draft business case document outlining the arguments for better energy management within the regional grocery store environment13
Conducted an analysis of possible best practice solutions for new construction and conducted the energy modeling required to obtain estimates of the benefits and costs of these best practices
Developed a list of best practice solutions for existing stores
During this same period, the BetterBricks Advising Services, the CSI’s commercial technical assistance group, was asked to increase its efforts with the target market sectors. Although no specific outreach was conducted, a variety of groceries projects emerged during this transition period from January 2003 to December 2005.
12 Schick, S and Les Tumidaj. September 2002. Commercial Buildings Initiative Target Market Priorities, Report #02-
13 This was originally conceived as a Guideline for Grocery Stores and has evolved to be part of the collateral that will be used by the business advisors.
3. Program Progress
MPER: BETTERBRICKS SMART MARKETS PROGRAM PAGE 27
Prominent projects described in the following sections include work with Albertsons, New Seasons Market, Yokes Fresh Market and Town & Country Markets.
Albertsons
This work was initiated by a design team working with Albertsons who contacted the Seattle Daylighting Lab. The design team sought to better understand how to apply daylighting and heat recovery principles to the standard Albertsons store design. The efforts with Albertsons included work by the Seattle Daylighting Lab, as well as a special study completed by a BetterBricks advisor. According to those interviewed, the advising services offered a team of technical services with lots of ideas that Albertsons otherwise was both unaware of and did not have the internal resources to pursue.
In the fall of 2005, contacts at Albertsons reported to the BetterBricks Advisors that the assistance from the Alliance had fundamentally changed the way they design their stores and that they are daylighting all their stores now. Additionally, the Advisors learned Albertsons is beginning to implement some of the results of the heat recovery work done with the Alliance. As a result of these efforts, Albertsons has expressed an interest in continuing to work with the Alliance to develop an integrated set of solutions for mechanical, daylighting and refrigeration systems.
New Seasons Market
The New Seasons Market projects have included data logging for lighting and a lighting mock-up in one of their newer stores. The BetterBricks Advisors also provided design review for two of New Seasons’ stores.
The projects with the rapidly growing New Seasons chain developed as a result of contacts by New Seasons with the BetterBricks Advisors network. This led to a meeting with the CEO and the operations, service and maintenance, and construction managers, at which the Smart Markets business advisor described the Smart Markets opportunity and the value of New Seasons increasing its understanding of its energy usage and developing an energy management plan.
New Seasons’ first activity after this meeting was to conduct a data logging study of the lighting in their then-newest store. The results of the study confirmed that lighting could be optimized and the lighting mock-up was done to demonstrate options. With the commitment from New Seasons to move forward on planning, the
3. Program Progress
MPER: BETTERBRICKS SMART MARKETS PROGRAM PAGE 28
business advisor will become more involved in the New Seasons effort as the chain is able to commit internal resources to the process.
Yoke’s Fresh Markets
The URM/Yokes Fresh Markets projects were initiated through a contact made by the Spokane Integrated Design Lab with the design team at URM. With the growth in the Yokes Markets, the Spokane Lab had conducted some training, which led to questions from Yokes about how their stores were performing. As a result of the questions, the advisors provided design consultation, including the value of daylighting for a new store. The design consultation occurred too late to influence the final design of the store; however, it led to a data logging project on the HVAC system at another store to test what effects daylighting would have on HVAC sizing. The data logging studies (completed in fall 2005, but not yet fully analyzed at the time of this MPER) were funded jointly by the local utility (Avista) and the Alliance and were managed by the business advisor for Smart Markets.
Town & Country Markets
Shortly after being hired by the Alliance as a program contractor, the business advisor began working with Town & Country Markets, a regional grocery chain in Washington, to identify high-performance solutions for a remodel of their main store. This project is using resources from the BetterBricks Advising Services under the direction of the business advisor.
The advice from BetterBricks has been well received, although it is likely that only a limited number of the recommendations will be adopted. The relationship is moving towards the conducting of an assessment of the chain’s business practices, with the goal of helping them begin the energy management planning process.
As the first Smart Markets project to truly function in the new CSI environment, it is notable that some challenges have arisen in communications between the Advising Services teams, the business advisor and the Alliance program manager. The Alliance has a matrix management structure for CSI, with a program manager for each vertical market and another manager for each cross-cutting market activity. As the Town & Country project emerged, the process for resolving issues between vertical market teams and cross-cutting market teams was just being determined. As the different teams began working with Town & Country, it became apparent that the role expectations between BetterBricks Advisors, the Smart Markets business advisor and the program manger were not fully clear and would need to be resolved.
3. Program Progress
MPER: BETTERBRICKS SMART MARKETS PROGRAM PAGE 29
Other Program Activities
In addition to the project work with different chains, recent program activities have centered on the renewal process which began in January 2005 and culminated with Board approval of funding for 2006 through 2008 in July 2005. During that same period, the Alliance created the BetterBricks Smart Markets name and published an RFP for a business advisor for the grocery store sector. Paul Enfield of Enfield Enterprises was hired as the lead business advisor. Enfield Enterprises recruited the two grocery store experts who had earlier helped to develop program elements to form a full-service team that will provide business advisory services to grocery stores and assist with the development of additional products and services for Smart Markets. In addition, a request for qualifications (RFQ) was released in December 2005 to obtain additional expertise and insight for the product and to serve in development activities.
With full-scale implementation underway in 2006, the program manager and business advisors anticipate initiating energy planning with four to six of the 23 targeted regional chains, as well as making inroads with one or two wholesalers.
PERCEPTIONS OF THE PROGRAM
While staff’s and contractors’ perceptions of Smart Markets are generally very positive, the program is at an early stage and thus some of the contractors, in particular, feel a frustration over the pace of the program delaying their getting out to talk to grocery stores and follow-up on earlier contacts.
There is general concurrence that the overall strategy –energy planning – will be effective as long as it occurs within the context of the grocery store environment, which tends to be a hands-on industry. Also clear is that, as envisioned in the initial target market study, the specific tactics needed to achieve the goals for Smart Markets will be unique to the grocery store market segment and thus will take some time to evolve. The concern, however, is that the tactics need to emerge naturally from the relationships that have been and are being developed with grocery stores. An overly prescriptive, Alliance-driven approach may not work as well as one that evolves directly from interactions with the market players. Equally important, Alliance planning time to develop its approach is essentially seen as taking too long and missing opportunities to work with the market that exist right now.
The perceptions of the program presented here represent the views of two of the three Alliance staff members involved in the program, two of the four contractors
3. Program Progress
MPER: BETTERBRICKS SMART MARKETS PROGRAM PAGE 30
that provided services to the Alliance during the planning and transition stage, the lead contact for the BetterBricks Advising Services contractors and the current lead business advisor for Smart Markets.
Goals and Objectives
Those who are staff or were directly involved in the 2006-08 renewal process have a fairly clear idea of the goals and objectives of the program. Those who were less involved in the process have read them or just heard about them and have questions and concerns. Those most closely involved provided views such as:
“I see our goal is to work with operations management… to refocus and start looking at energy as a controllable cost that can have major effects on the profitability of the stores.”
“[The goal is] to work with target market firms and the suppliers to the target market to better integrate energy issues in their decision-making, in a comprehensive way.”
“[The goal is] getting chains to adopt energy management plans and implement them, and having the wholesalers that serve them with design services see the value in doing that.”
Those less close to the process are less familiar with the intention behind the renewal document statements. They stated such things as:
“The Alliance is focused too much on plans on paper and then going stepwise through the plans – they need to build relationships with grocers.”
“They are so general. The Alliance ought to have goals for MW hours saved in the buildings being built in a particular period of time. That is something that can be checked. Whether it is led by a SEMP (Strategic Energy Management Plan) or because the chain jumps in and does the whole thing, who cares?”
These responses point to a tension between those who are actively involved in grocery store efficiency issues and feel a need for more action and those who are involved in the planning process and see a need to develop an approach first before going into the field.
We asked the contacts how they think grocery stores will be different in five years at the close of this cycle of Smart Markets. The contacts were optimistic, even by
3. Program Progress
MPER: BETTERBRICKS SMART MARKETS PROGRAM PAGE 31
those seeing Smart Markets as needing more action, as they envisioned a more comfortable and visually varied shopping environment compared to conditions in 2005. There were a variety of expectations, but clearly the targets for change are seen as controls, lighting and refrigeration. The comments below show both the enthusiasm the contacts feel for the effort, as well as the types of changes that are anticipated.
“The Alliance could get five to seven chains to turn around and do some big stuff and affect the whole culture.”
“We should see more controls on refrigeration, HVAC and lighting – floating head refrigeration racks, anti-sweat controls on doors, demand control ventilation, more centralized controls for each piece of equipment; and many more cases that have doors.”
“We’ll see more ceramic metal halide on the products and produce, optimized layouts for lighting and more skylights. Commissioning of systems should be commonplace.”
“We’ll see more contrast in lighting – less ambient light, more focused direct lighting and some daylighting. Temperatures should be more even and consistent, with better stocking practices in cases, less heaters over the registers, use of vestibules for temperature control, and minimal lights left on after hours.”
Asked about barriers to accomplishing the goals and objectives, contacts primarily mentioned concerns about the regional markets’ ability to respond to Smart Markets efforts. The following issues emerged:
There are no natural channels for reaching into the market – wholesalers were hypothesized as a channel, but their role in the industry has changed and that channel no longer seems feasible.
The grocery sector is so financially stressed because of the competitiveness of the industry that it is difficult to take on one more thing, even if it could improve their situation.
Getting to the right person in the right chain(s) to be able to take on the activity and gaining the trust of the chains will be difficult. The business advisor will have to be available and be able to maintain established relationships to make things happen.
3. Program Progress
MPER: BETTERBRICKS SMART MARKETS PROGRAM PAGE 32
There is a lack of internal capability in the grocery industry to deal with the advanced controls that are the solutions to many of the energy issues.
At the same time, the contacts identified two factors that could facilitate program implementation.
Energy costs are increasing, which brings them to the attention of management and makes solutions more attractive.
Smaller companies (such as the regional grocery chains) have an advantage of being able to try something in a single store, while larger chains (such as the nationals) have too many steps for approval of such testing.
Implementation
There are three areas staff and contractors are addressing as they begin implementation. The first concerns coordination with other CSI activities, the second is the role of doing projects to gain a commitment to planning and the third is the development of tools and products to be used in implementation.
Coordination with Other CSI Activities
The BetterBricks Advising Services contractors have been working with grocery stores for several years on an opportunistic basis (i.e., with little direct outreach). Historically, they would be approached by a design team or an owner with a question about how to improve or test a design concept. The BetterBricks Advising Services teams work with the design team or store owner to explore the idea and to encourage them to implement the solutions. As a result of these efforts, the Advising Services believe they have developed substantial capability to address refrigeration, design and construction, daylighting, and electric lighting issues for grocery stores.
The Advising Services have some concerns that coordination and communication may be a problem because the Smart Markets business advisor and the program manager are unfamiliar with the skills and capabilities of the Advisors. After three years of working with grocery stores on an ad hoc basis, several capable engineering and refrigeration firms have been identified and have provided useful services to grocery stores. Additionally, the matrix management structure in which a different Alliance program manager oversees the vertical markets and another oversees the cross-cutting markets had not yet been explained to the Advising Services team
3. Program Progress
MPER: BETTERBRICKS SMART MARKETS PROGRAM PAGE 33
members when this MPER was prepared. The BetterBricks Advisor lead reported that Advisors still looked to him as the lead and did not understand the role of the program manager, the business advisor and the different program managers for the cross-cutting program services.
The Role of Projects
Smart Markets implementation began during the planning phase, largely because the Alliance and its contractors needed to meet with market actors to gain a better understanding of market conditions. Some of these contacts naturally began asking for program services when there was an obvious interest in advanced energy solutions at the chain. As they begin full implementation, the Smart Markets team hopes to take regional chains and wholesalers toward energy management planning, with the goal of having at least two chains and one wholesaler far enough along to be worth developing case studies by the end of the first year. The main steps in this process will be:
First, to gain the attention of senior management and conduct an assessment of their business practices. The assessment will be conducted using a tool (likely a software tool) that enables the entire management team including operations, facilities, maintenance and construction to review how their business practices as an organization affect their energy usage. The process of conducting the assessment will alert the management team to opportunities, which will then be prioritized.
Second, Smart Markets business advisors will work with the Alliance program manager to develop an account plan for how the Alliance can work with the chain to address the priority opportunities and change their business practices. The account plan will incorporate the BetterBricks Advising Services and utilities where needed to ensure that sustainable business processes are developed and encouraged.
While these are the likely two steps, there are indications from some of the contractors we spoke with that demonstration projects may be necessary before some chains will be willing to seriously consider broadly applying the business and technical concepts the Alliance is promoting. As one contact said:
“Once the grocers trust people then they will organically make things happen. They will not sign paper and do methodical planning. They are people who live by the seats of their pants.”
3. Program Progress
MPER: BETTERBRICKS SMART MARKETS PROGRAM PAGE 34
The role of the project activities will vary across the chains and wholesalers, but the program goal is to use projects to increase internal business practice management capability, not simply to complete ad hoc projects. The account plans are expected to help define the strategy for each chain or wholesaler, recognizing that each organization has its own conditions.
Tools and Products
There are a variety of tools that those interviewed believe will be needed to fully implement Smart Markets. The first is the assessment tool. The two options are to have the business advisor develop one or to adopt the EnVINTA Energy Achiever, a commercially available tool. Contacts were leaning toward the EnVINTA Energy Achiever because they perceived that it would be time-efficient and well respected.
Other key tools are the business case, which will explain the value proposition for changing business practices and lists, or a PowerPoint presentation on best practices for both new and existing grocery stores. These tools will be used by the business advisors to provide guidance to chains that work with Smart Markets. Contacts reported that “something simple” would be all that would be needed, as grocery store staff typically do not have time to read through large amounts of material.
A refrigeration specialist is expected to be hired as a team member with the business advisor; this person will probably need to have tools as well and it is possible this will include a service package design for grocery refrigeration systems. At least one contact noted that the Technical Advisors already included a skilled refrigeration team and hoped that that capability will be considered.
Smart Markets is also working with the marketing team at the Alliance to develop messages and collateral to be used in their outreach. Contacts noted that messages would be helpful, that the name had just been developed, and that producing the various lists of best practices and the business case was the primary focus of their work with the marketing team.
Eventually, Smart Markets will provide assistance with specifications for procurement of equipment, maintenance and service contractors, and design services. These tools will be developed, possibly as on-line resources, when they can provide value to the regional chains and wholesalers.
3. Program Progress
MPER: BETTERBRICKS SMART MARKETS PROGRAM PAGE 35
Expectations for Program Progress
The Smart Markets staff and contractors we spoke with see challenges in gaining sufficient access to chain management and management’s willingness to allocate resources. They see the national chains and wholesalers as more difficult to influence, as the nationals are such large institutions and the wholesalers are struggling financially to a greater extent than the regional chains.
Some contacts suggested that finding the right chains will be the major challenge, as many will be interested in getting services, but few will be willing to commit the time and resources required to actually build the capability and allocate the resources necessary to change business practices. Additionally, the Alliance has a significant challenge in getting the BetterBricks technical services contractors to embrace and commit to the business practices-oriented approach of Smart Markets. This commitment is necessary to facilitate communication and coordination so that the grocery chains perceive the services as fully integrated, useful and valuable.
As noted above, the staff and contractors for Smart Markets all believe that the program has a great deal to offer regional chains and wholesalers and that the approach and the team working on Smart Markets is capable. Team members are enthusiastic about the new construction opportunities and the openness of the regional chains to ideas that have been presented so far. The Alliance can support this by ensuring stability in program management and facilitating communication.
3. Program Progress
MPER: BETTERBRICKS SMART MARKETS PROGRAM PAGE 36
MPER: BETTERBRICKS SMART MARKETS PROGRAM PAGE 37
4. BASELINE RESULTS
Three of the four surveys conducted for this MPER provide baseline measures for regional grocery store chain facility decision-makers, regional chain grocery store managers and regional refrigeration contractors. The fourth survey of wholesaler design and construction leads does not provide a baseline, as the survey found that wholesalers are only involved in a portion of the regional grocery chain design and construction activities. Detailed results for each survey are provided in Appendices A through D.
SUMMARY OF BASELINE RESULTS FROM REGIONAL GROCERY CHAIN FACILITY DECISION-MAKERS
Regional grocery store chains typically provide centralized facility support services to their local stores, rather than hire facility support staff for each location. The corporate facility lead has the role of overseeing budgets for operations and maintenance, and sometimes remodeling, renovations and new construction at the local level. This person often reports directly to the head of operations, or to the CEO or CFO for the company. No baseline of CEO/CFOs has been conducted at this time, but the evaluators will explore with the program staff the feasibility of doing that in the next six months.
We began with a list of 24 chains and sought to interview the key facility decision-maker for each. We completed 15 interviews. Grocery chains are aware of the need for energy management: two-thirds have either company employees or service contracts for energy management services, although the services are usually covered by store employees rather than through service contracts. The opposite was true for HVAC systems, which were more likely to be covered by service contracts than company employees. Service contracts almost never mention energy efficiency. Somewhat contradictorily, most contacts rated the level of commitment to energy management of their CEO/COO as “high” (“4” or “5” on a five-point scale).
Management in 12 of the 15 chains had made a formal request to local stores to save energy within the last two years. The request specified by the most contacts was turning off lights or equipment when not in use. Only 6 of the 15 chains had any written specifications for purchasing equipment. Only one contact reported any policies that mention energy efficiency.
4. Baseline Results
MPER: BETTERBRICKS SMART MARKETS PROGRAM PAGE 38
Many of the chains had implemented several of the energy management practices we asked about: most chains regularly track energy consumption for all their stores, have reviewed their energy rate schedules in the last year and have benchmarked at least one of their stores. One-third of chains have energy performance targets. Company-wide written guidelines for energy decisions, having energy management written into local store staff job descriptions, and using energy accounting software were all extremely uncommon.
At least some of the stores in most chains have electronic controls on HVAC systems, refrigeration systems, and on both in-store and parking-lot lighting. A majority had electronic controls on their refrigeration systems and parking-lot lighting in 100% of their stores.
With regard to the different operations practices we asked about, all of the practices are typically overseen by the corporate office rather than handled at the local store. T-8 lighting with electronic ballasts are used in 100% of most chains’ stores and most contacts reported their chain’s stores had undergone group relamping within the last five years. Group relamping appears to be more common when the chain oversees the practice than when local stores are free to handle it.
Almost half of the contacts report all their chain’s stores have maintenance programs for frozen door seals; slightly fewer report having controls on anti-sweat devices on refrigeration case doors. Refrigeration set-points are checked at least quarterly by most chains and most stores adjust the set-points seasonally. Similarly, almost all chains check or reset their thermostats and timers about twice a year. While almost all chains have double-doors at the entrances of some of their stores, few contacts reported that all their chain’s stores have them.
Regarding more advanced practices, estimates of the prevalence of permanent split capacitor fan motors in their chain’s stores were generally low, although almost half of contacts couldn’t provide an estimate. Estimates of the prevalence of electronically commutated fan motors were also low.
Most contacts and their staffs are not involved in trade organizations. Two-thirds of contacts were unaware of the Building Operators’ Certification program; only one of the 15 contacts had received that certification.
A substantial minority (6 of 15) of contacts were aware of the term “strategic energy management plan”. One-third of contacts were aware of BetterBricks and one-fifth were aware of the BetterBricks Smart Markets Program.
4. Baseline Results
MPER: BETTERBRICKS SMART MARKETS PROGRAM PAGE 39
SUMMARY OF BASELINE RESULTS FROM GROCERY STORE MANAGERS
Regional grocery store chains have managers who oversee the operations of each of the local stores. The store management will include at least one manager whose main responsibility is making sure the retail operations are successful. In rare cases, the store manager oversees facility activities, but usually the store manager calls a local service contractor or corporate facility services when a facility issue occurs.
We identified 222 stores for the 24 regional chains. We completed interviews with 51 managers representing 22 of the 24 chains. Store managers have a role in facility management for their stores and some are directly involved in purchasing equipment, but most rely on corporate or wholesalers for support. The vast majority (89%) of grocery store managers receive guidance in facility operations from a contact at their corporate or wholesaler’s office, or from some other source. While most (52%) say someone at the corporate office has made a formal request that their store reduce energy costs, 60% indicate they have not received written guidelines involving energy usage or efficiency.
More than two-thirds (69%) of managers have reviewed their stores’ energy usage data, either alone or with someone from their corporate office, at some time in their tenure as a store manager. Over one-third (39%) of managers report their stores have energy usage goals and 90% of those managers whose stores have such goals report that progress towards the goals is reviewed at least once a year.
Managers report familiarity with most of the energy-saving operations and maintenance practices we asked about and report that most of the practices are implemented at their stores. The practice with the lowest awareness is performing energy audits or assessments, with 57% aware. About one-fourth of managers report their store has had an audit.
Just over half (54%) of the managers are involved in the purchasing of lighting and refrigeration equipment for their stores. Of those managers who are involved in such purchases, most say lighting (71%) and refrigeration (57%) equipment purchases are governed by policies or specifications that have energy efficiency requirements.
Less than half (45%) of the managers and their staffs are involved in professional associations or trade organizations. While 50% of the store managers expressed an interest in training, only one-third could think of topics in the area of building operations and maintenance that they thought would be useful for themselves or their staff.
4. Baseline Results
MPER: BETTERBRICKS SMART MARKETS PROGRAM PAGE 40
SUMMARY OF BASELINE RESULTS FROM REFRIGERATION CONTRACTORS
The largest single energy consuming end-use in grocery stores is refrigeration. Because refrigeration requires expertise, contractors have evolved as the primary means by which regional grocery stores purchase and maintain their refrigeration equipment. Also, because of the technical skills required and the fact that refrigeration systems are generally reliable, there are a limited number of firms who generally provide services across a wide geographic area.
We began with a list of 28 unique refrigeration firms. We found that 11 were not qualified, as they either did not provide refrigeration services to grocery stores or only served the national or the convenience store markets. Of the remaining 17 firms, we completed interviews with 12 refrigeration contracting firms who work with grocery stores in the Pacific Northwest. These contractors do more work for independent chain stores than for convenience stores, and more work for national chain stores than for either of the other two categories of grocery stores.
Most of the contractors design, install and maintain grocery refrigeration systems. The contractors design and install refrigeration systems in fewer stores (typically fewer than 40 per contractor during the past two years) than those in which they maintain refrigeration systems (typically more than 40 per contractor during the past two years).
More than one-half of the refrigeration systems maintained by the contractors use rack systems rather than individual compressors. The refrigeration cases maintained by these contractors range from 5 to 15 years in age, with older cases more likely to be found in independent chain stores than in stores owned by national chains. On average, case components tend to be slightly older than the cases themselves. More than one-half of the contractors believe refrigeration system set-points ideally should be checked and recalibrated semiannually or more frequently, and more than half of them do so. National chain stores are more likely to prescribe the frequency of set-point maintenance than are other grocery stores.
Energy-efficient motors were included in less than one-half of the new refrigeration cases of most of the contractors during the past two years. Standard motors were replaced with energy-efficient motors in an even smaller fraction of refrigeration cases during that time. Contractors’ comments suggest there are problems with the reliability and availability of energy-efficient motors. Their comments also suggest energy-efficient motors are more likely to be included in new cases and as replacements for standard motors in existing cases in national stores than in independent stores.
4. Baseline Results
MPER: BETTERBRICKS SMART MARKETS PROGRAM PAGE 41
Most of the contractors provide anti-sweat heater controls in most of the refrigeration cases they install and T-8 lighting and electronic ballasts are commonplace in these cases, although not universal. A large minority of the contractors provide proprietary energy efficiency technology in the refrigeration cases, racks or condensers they install.
One-half or more of the contractors install floating head controls and/or floating suction controls on the refrigeration racks they install. Most of these contractors install such controls on more than one-half of their racks.
Most of the contractors have commissioned grocery refrigeration systems designed and installed by their firms and most have retro-commissioned or re-commissioned an existing grocery refrigeration system. A large minority of the contractors have commissioned new refrigeration systems designed and installed by another refrigeration contractor.
A large minority of the contractors reported their firms design grocery store HVAC systems and most of those contractors said they have commissioned such systems.
Contractors’ comments reveal their work for independent chain stores differs from their work for national chain stores in regard to both the kinds of work they do and the kinds of equipment they install for these stores.
SUMMARY OF SURVEY RESULTS FROM REGIONAL WHOLESALER DESIGN AND CONSTRUCTION LEADS
Regional grocery chains purchase products and services from wholesalers. These include products that they sell in the store, as well as services such as refrigeration maintenance or design and construction services for remodeling, renovating or new construction. In the past five years, the services wholesalers offer have been reduced as a result of cost pressures in the grocery market.
There are six grocery wholesalers who service the Pacific Northwest regional grocery chains. Two of the three wholesalers no longer have a design and construction service and one of the wholesalers refused an interview. The design and construction lead for three of the six grocery wholesalers were interviewed, providing information about energy-efficient building and equipment purchasing practices for Northwest grocery stores.
At the outset of this study, the program team assumed that these six wholesalers provided more than 80% of the design and construction services for regional grocery stores. Given that only three or four of the six provide these services, it is clear that
4. Baseline Results
MPER: BETTERBRICKS SMART MARKETS PROGRAM PAGE 42
a small number of architecture and engineering firms are now offering these services, as was found by the baseline survey of architects.14
The practices of the wholesaler design and construction leads are summarized as follows.
The two interviewed wholesalers who serve the greatest number of stores use energy performance targets for planning and designing projects. Both have also benchmarked some or all of their stores. Weatherization was fairly common in all three contacts’ recent projects.
Natural lighting and increases in existing natural lighting were far less common, with daylight harvesting not used at all. Two of the three contacts reported common usage of T-8 or T-5 lighting for all indoor applications, as well as the common use of electronic ballasts in their stores.
The use of large, integrated, or built-up HVAC systems was also reported as common or fairly common in the stores of two of the contacts, and only the wholesaler serving the least number of stores reported their HVAC systems commonly had a fully functional economizer mode. None of the contacts reported their HVAC systems commonly had large motors with VSDs and only the contact serving the greatest number of stores reported a significant use of demand controlled ventilation systems.
Almost all of the contacts’ refrigeration systems purchased during the previous year included a heat reclaim system. Typically, the reclaimed heat was used to heat water. The refrigeration cases themselves commonly included energy-efficient fan motors. Microprocessor-based control systems were commonly used for their recent refrigeration systems, but only two of the three reported commonly using such control systems for HVAC, in-store lighting systems, and parking-lot lighting.
The importance of first-cost equals or outweighs the importance of other financial considerations when these wholesalers make grocery store equipment purchases. However, all of the contacts said they are familiar with and use either the term life-cycle cost or total cost of ownership when making some equipment purchases.
The two contacts who serve the greatest number of stores both participate in developing purchasing specifications, which in their cases include requirements about energy efficiency for lighting, refrigeration and HVAC equipment, and for
14 Peters, et al., 2004.
4. Baseline Results
MPER: BETTERBRICKS SMART MARKETS PROGRAM PAGE 43
motors and control systems. The contact serving the greatest number of stores also has energy efficiency requirements for the purchase of food production equipment.
Because only two of these three contacts actually provide new construction services to regional chains, this is clearly not a sufficient sample to constitute a baseline of new construction practices and behaviors for the Smart Markets Program. It will be necessary to identify a more active pool of contacts involved in new construction in order to have confidence in baseline measures.
4. Baseline Results
MPER: BETTERBRICKS SMART MARKETS PROGRAM PAGE 44
MPER: BETTERBRICKS SMART MARKETS PROGRAM PAGE 45
5. REVIEW OF PROGRAM EXPECTATIONS AND ACE MODEL
This section presents a review of the expectations for program progress and findings from a review of the Alliance Cost Effectiveness (ACE) model for the Smart Markets Program. The Alliance has developed two ACE models for Smart Markets: one for design and construction and one for building operations.
SUMMARY
The relationship between the objectives for awareness of the comprehensive type of energy plans the Alliance is promoting (60% by 2010), the adoption of energy plans (30% by 2010), and the development of capability to implement them (30% by 2010) do not reflect the experience of energy efficiency programs across the country. Either the goal for awareness is too low to make the accomplishment of the other objectives likely or the other objectives are too high, given the likely rate of increase in awareness and adoption of energy plans. Given the objective of 60% awareness by 2010, our assessment is that more reasonable 2010 objectives for the others are 15% of new floor space designed to reduce energy usage by 25% and perhaps 20% of grocery stores reduce energy usage in building operations by 10%.
Also, the expected 2010 outcomes for energy savings for the program are that 30% of existing grocery stores will reduce energy usage by 10% and 30% of new grocery square footage will be designed to perform 25% more energy efficiently as compared to baseline levels. This is not reflected in either the new construction or the building operations ACE model analyses. As shown in Table E-1 in Appendix E, the new construction ACE model uses a value 15.9% for market penetration in 2010. The ACE model for building operations (Table E-2) uses 6.1% for market penetration in 2010.
REVIEW OF PROGRAM EXPECTATIONS
The evaluation team reviewed the program model and the progress indicators for the stated objectives and outcomes in Chapter 2. The objectives and outcomes are interdependent and assume a logical relationship between one another. Figure 3 presents the objectives for awareness, energy management plan adoption and development of capability to implement a plan, in graphical form, using the results of the survey for the measured indicators for 2005 and the stated objectives for 2010.
5. Review of Program Expectations and ACE Model
MPER: BETTERBRICKS SMART MARKETS PROGRAM PAGE 46
Level of awareness of energy management plans = 40% for corporate facility leads,15 although it may be even lower for CEOs of the regional grocery chains.
Adoption of energy management plans = zero, since none have been adopted as of 2005.
Development of capability to mange change (i.e., implement the plan) = 10%, based on self-reported levels of adoption of some energy efficiency practices and perceptions of the importance of energy efficiency. This is a more difficult number to firmly determine, but it seems reasonable to assume some capability is in place at this time.
Figure 3 OBJECTIVES FOR PROGRESS IN SMART MARKETS
15 The Alliance has been discussing these issues with grocery stores throughout the planning process.
0
10
20
30
40
50
60
70
2006 2010
Market Transformation Stage
Perc
ent
awareness adoptioncapable
5. Review of Program Expectations and ACE Model
MPER: BETTERBRICKS SMART MARKETS PROGRAM PAGE 47
As shown in Figure 3, awareness will need to increase 20% from the 2005 level to achieve the stated objective of 60% by 2010. This is probably possible. Awareness is the easiest behavior to change; an initial effort has been underway throughout the planning and transition period and demonstrates that awareness has achieved 40% in a very short time. If CEO awareness is lower than 40%, such an increase to 60% by 2010 still seems reasonable, given the ease of influencing awareness once contact is made with CEOs. However, Figure 3 shows that the adoption of energy plans has to increase more than awareness levels and development of capability to manage change (i.e., implement the energy plan) has to increase the same amount as awareness levels, even though these changes are much more difficult to achieve.
On the other hand, innovative ideas do not typically increase in a straight line, but tend to follow either an S-curve or a gradual growth curve. Figure 4 shows these alternatives for the adoption of energy plans and development of capability to implement.
Figure 4 ALTERNATIVE OBJECTIVES FOR PROGRESS IN SMART MARKETS
0
10
20
30
40
50
60
70
2006 2007 2008 2009 2010
Market Transformation
Perc
ent o
f
awarenes adoptioncapable
5. Review of Program Expectations and ACE Model
MPER: BETTERBRICKS SMART MARKETS PROGRAM PAGE 48
Two thoughts for consideration emerge from this review.
First, experience with program progress for market transformation programs suggests that there is generally a lag between awareness, adoption and implementation. The targeted objectives are to have 30% of the chains adopt energy management plans and also have the capability to implement energy efficiency business practices by 2010. The targeted outcome for 2010 is to have 30% of the grocery stores (66 stores) reduce energy usage in building operations. This may be a very difficult combination to achieve.
Second, even if this pattern is within reach for the targeted outcomes for operations and maintenance, it is more problematic for the new construction outcome. To achieve the new construction outcome, the commitment to an energy management plan and improved business practices must precede the design stages, which can take a year or more to implement. Expecting to achieve the program outcome of energy efficiency improvements in 30% of the new floor space in five years may be too soon.
This review suggests that the outcome targets are likely too high, even if the objectives are achieved. An even more challenging situation arises if the awareness increase among CEOs is slow or the rate of adoption is gradual for energy plan adoption and for capability building. At a minimum, the evaluation team believes that the target for energy plan adoption should lag the target for capability to manage change and that the outcome targets should lag energy plan adoption.
Figure 5 displays a potential scenario for adoption of energy management plans and continued growth in capability to implement efficient business practices that is gradual and results in only 20% of the chains adopting an energy plan by 2010; in that case, the outcome targets of 30% of grocery stores and 30% of new floor space are even less likely to be achievable. To accomplish the 30% outcome achievement targets would require the energy plan adoption and capability to manage change to be at least 40% to 50%.
5. Review of Program Expectations and ACE Model
MPER: BETTERBRICKS SMART MARKETS PROGRAM PAGE 49
Figure 5 LIKELY RATES OF ADOPTION
ALLIANCE COST-EFFECTIVENESS MODEL REVIEW
The key assumptions of the cost effectiveness analyses models were outlined in the following documents, both dated June 21, 2005:
CSI Grocery Store Design & Construction – Key Assumptions: This document describes market transformation improvements to design and construction of new grocery stores.
CSI Grocery Building Operations – Key Assumptions: This document describes market transformation improvements to building operations in groceries.
The full set of cost-effectiveness assumptions used for the two analyses models of the Smart Markets Program is extensive and complex and is not presented here. However, Table 8 and Table 9 contain the most critical facility-level values identified by the Alliance.
GROCERY OPERATIONS ACTIVITIES (AS REFERENCED IN PENULTIMATE ROW OF TABLE 8)
MEASURE CATEGORY ADDITIONAL EFFICIENCY MEASURES
Refrigeration System Optimization
• Calibration of pressure and temperature sensors and set-points • Resetting suction pressures to maximum values while maintaining
case temperatures • Resetting condensing pressures to minimum values that float
against ambient temperature • Resetting anti-condensate heater set-points and schedule • Cleaning of condenser and evaporator coils
Lighting and HVAC-Specific Measures
• Calibration of temperature and humidity sensors • Adjustment of temperature and humidity set-points and time
schedules • Customized lighting schedules that reduce energy without
affecting sales or merchandising • Implementing a lighting maintenance program (cleaning fixtures,
group re-lamping)
Along with the overall facility-level inputs above, the design and construction analysis model provides an estimate of projected new construction area square footage for the region, including the percent estimated to be energy-efficient without program intervention (i.e., baseline energy efficiency penetration). This is shown in Appendix E.
Alignment of Program Expected Outcomes and Cost-Effectiveness Analyses
For the Smart Markets Program, the cost-effectiveness analyses and the program’s expected outcomes do not appear aligned in the current ACE model. The expected outcomes for energy savings for the program are that, by 2010, 30% of existing grocery stores will reduce energy usage by 10% and 30% of new grocery square footage will be designed to perform 25% more energy efficiently as compared to baseline levels. This is not reflected in either the new construction or the building operations ACE model analyses. As shown in Table E-1 in Appendix E, the new construction ACE model uses a value of 15.9% for market penetration in 2010 and does not attain the 30% expected outcome until 2012. The ACE model for building operations (Table E-2) uses 23% for market penetration in 2010 and attains the 30% expected outcome in 2011. Interviews with the Alliance planning manager
5. Review of Program Expectations and ACE Model
MPER: BETTERBRICKS SMART MARKETS PROGRAM PAGE 53
clarified that the two-year time-lag to the 30% expected outcome for new construction and the one-year time-lag to 30% for building operations were purposeful and reflected a conscious understanding that there would be a gap between when projects were completed and when savings would be achieved. However, this understanding is not documented anywhere in the ACE model.
5. Review of Program Expectations and ACE Model
MPER: BETTERBRICKS SMART MARKETS PROGRAM PAGE 54
MPER: BETTERBRICKS SMART MARKETS PROGRAM PAGE 55
6. CONCLUSIONS AND RECOMMENDATIONS
This section summarizes the findings, draw conclusions and makes recommendations for program enhancement
SUMMARY OF FINDINGS
The BetterBricks Smart Market Program is at an early stage of development. The planning and transition stages just concluded and full-scale implementation was scheduled to begin in January 2006. The primary findings reported in this MPER concern the baseline conditions for the various market actors targeted to be affected by Smart Markets and feedback from program staff and contractors concerning the planning and transition phase.
The grocery store market is one of three vertical markets that are targeted through the CSI. The main program goal is to change business practices to incorporate energy management principals on a consistent and sustainable basis. The program staff and contractors are generally enthusiastic about the program goals and the capabilities the Alliance has developed in the CSI and for the grocery store market. There are also challenges in this approach: grocery stores tend to be action-oriented and may be more attracted to immediate, discrete project activities rather than the longer-term sustainable practices the Alliance is targeting.
An additional challenge comes from the extended planning phase that, as noted previously, became intertwined with early implementation projects. The implementers in these projects were the BetterBricks Technical Advisors, who developed their own approach to the grocery market that did not focus on business practices. The result has been challenges in communication and coordination across the various contractors involved in CSI as they have begun to transition together toward the Smart Markets approach.
Some of the barriers identified for working in the grocery store market include: the lack of a natural channel to the market as the role of wholesalers has diminished; a high degree of financial stress in the industry because of competitive pressures; difficulty in gaining trust and access to the right people at the chains; and a lack of technical skills to deal with the advanced controls that provide solutions to energy usage.
6. Conclusions and Recommendations
MPER: BETTERBRICKS SMART MARKETS PROGRAM PAGE 56
The baseline studies conducted for this MPER show that the energy efficiency practices and behaviors promoted by Smart Markets are already present to a limited degree in regional grocery store chains. Among facility leads for regional corporate chains, energy management is a familiar term and has been requested and supported by organizational management. More than half of the regional chains use electronic controls for several energy-using systems in at least some of their stores; most have already relamped using T-8s with electronic ballasts; and most monitor their set-points, thermostats and timers at least quarterly. The more high performance solutions, however, are done less frequently, and it is these activities that are likely targets for changes in business practices: setting up energy performance targets, having guidelines for energy decisions, using energy accounting software, using energy-efficient motors and fans, and using controls on all systems in every store.
A similar picture emerges for grocery store managers who oversee the daily operations of the region’s stores. While most of the managers review their energy usage, only just over a third have energy usage goals and even fewer review progress toward the goals each year. Most managers also report familiarity with many fundamental operations practices: case shelf stocking, maintenance of frozen door seals, controls on parking-lot lights, etc. In general, these practices are implemented by 10% to 20% fewer managers than are familiar with the practice. Somewhat unexpectedly, over half of the managers report that they are responsible for purchasing lighting and refrigeration equipment, and most believe that the specifications already include requirements for energy efficiency.
Regional wholesaler contacts involved in design and construction decisions also report strong support for energy efficiency in their organizations; however, we were only able to complete interviews with three of the six wholesalers in the region. Two of the contacts prepare specifications for equipment purchasing and include energy efficiency in their specifications; two reported that the stores they work with commonly use T-8, T-5 and electronic ballasts, and all three contacts report they use heat reclamation systems with their new refrigeration systems. Electronic controls also were reported as being commonly available on recently-purchased refrigeration systems, as were efficient fan motors. The more high performance solutions are less commonly used: natural lighting, VSDs on large motors, demand controlled ventilation, electronic controls for HVAC, and in-store or parking-lot lighting. First-cost was clearly viewed as the most important criteria in financial decisions.
Unfortunately, only two of the three regional wholesalers we spoke with and only one of the three we did not speak with are currently providing services to regional
6. Conclusions and Recommendations
MPER: BETTERBRICKS SMART MARKETS PROGRAM PAGE 57
chains on new construction decisions. So this baseline is not sufficient for long-term tracking of progress in new construction practices and behaviors.
Refrigeration contractors throughout the Northwest tend to work with regional chains, as well as national chains and convenience stores. Refrigeration contractors interviewed were familiar with the equipment and practices that are part of Smart Markets, but several noted that energy-efficient motors have not functioned well in refrigeration environments. These contractors also report that national chains tend to have more specifications and clearer requirements for energy efficiency, but that regional chains can sometimes be more efficient than the nationals because they target niche markets (like organic foods) which require a higher quality of refrigeration equipment. At the same time, there are other regional chains that are focused on low cost and thus tend to have much older equipment than do the nationals, and are much less aware of or willing to invest in efficient solutions. These differences between regional and national chains were apparent for all aspects of refrigeration contractors’ practices and clearly support the value for improving regional grocery store business practices.
The program model for Smart Markets demonstrates that the program theory is designed to integrate with the current market process for improved energy efficiency. The progress indicators are linked to the objectives and demonstrate that the market has adopted some energy-efficient practices and behaviors. The baseline measures are typically self-reports on behavior and practice adoption by the market actors as reported in baseline surveys. As the program evolves, some progress indicators will likely need to be revised to reflect the specific directions and tactics of the program.
The review of the objectives suggests that the expected levels of adoption be re-examined for consistency and reasonableness. Finally, the expected program outcomes and the ACE model appear to use different values for program penetration for 2010; while there is an explanation for this it needs to be documented clearly within the model.
CONCLUSIONS AND RECOMMENDATIONS
These findings suggest the following conclusions and recommendations.
Conclusion 1: The BetterBricks Smart Markets Program is well on its way to implementation. As the planning and transition phases draw to a close, a clear approach has been developed for implementation and efforts are underway to reach
6. Conclusions and Recommendations
MPER: BETTERBRICKS SMART MARKETS PROGRAM PAGE 58
the regional grocery chains. The efforts to date by the Alliance planning contractors and the BetterBricks Technical Advisors16 have laid the groundwork for implementation. At the same time, the primary effort to develop the approach has been internal to the Alliance and the BetterBricks Technical Advisors report being unfamiliar with many of the details of the approach.
Recommendation 1: Begin to communicate clearly with the Technical Advisors and inform them of their roles and responsibilities, as well as the vision and approach to be used in Smart Markets. Use this communication and coordination process to ensure that the Technical Advisors are included in planning and strategizing how to reach regional grocery contacts, as several have developed access during the planning and transition phase. More generally, increased communications with all other CSI teams should be initiated, particularly those for marketing and education and training.
Conclusion 2: The BetterBricks Smart Markets Program objectives are not well-aligned. The objectives for awareness of the benefits available from energy efficient, high performance groceries; the adoption of energy management plans; and implementing changes in energy-related business practices as currently defined are interdependent. It is logical to assume that only a subset of those with awareness will move on to adopt plans or implement changes. Our analysis, based both on our own evaluation of other projects and on similar work from other evaluators, suggests that either the objective for awareness (60% by 2010) is too low to accomplish the other objectives and expected outcomes (30% adoption of planning and 30% presence of capability to implement by 2010) or the objectives are set too high. Given the likely rate of increase in awareness, we would suggest that the outcomes are set too high.
Recommendation 2: Adjust the program objectives to make the relationship between them more plausible. Specifically, we suggest that the objectives for adoption of energy plans and regarding changes in energy-related be reduced.
Conclusion 3: ACE models appear inconsistent with stated expected program outcomes due to lack of documentation. The expected 2010 outcomes for energy savings for the program are that 30% of existing grocery stores will reduce energy usage by 10% and 30% of new grocery square footage will be designed to perform 25% more energy efficiently as compared to baseline levels. This is not
16 The BetterBricks Technical Advisors include the BetterBricks Advisors and the Daylighting and Integrated Design
Labs.
6. Conclusions and Recommendations
MPER: BETTERBRICKS SMART MARKETS PROGRAM PAGE 59
reflected in either the new construction or the building operations ACE model analyses. As shown in Table E-1 in Appendix E, the new construction ACE model shows a value of 15.9% for market penetration in 2010 and 30% in 2012. The ACE model for building operations (Table E-2) shows 23% for market penetration in 2010 and 30% in 2011. Interviews with the Alliance planning manager clarified that the two-year time-lag to the 30% expected outcome for new construction and the one-year time-lag to 30% for building operations were purposeful and reflected a conscious understanding that there would be a gap between when projects were completed and when savings would be achieved. This understanding is not documented anywhere in the ACE model.
Recommendation 3: Add clear documentation to the ACE model explaining why the 2010 expected program outcomes are not achieved until one to two years later.
Conclusion 4: Design and construction contacts need to be identified. The Alliance provided us with a list of six wholesalers that might be involved in design and construction services to regional chains. Only two of the three contacts we spoke with and only one of the three we did not speak with are currently providing services to regional chains on new construction decisions. Given this, it is clear that the baseline for design and construction support services is not sufficient for long-term tracking of progress in new construction practices and behaviors.
Recommendation 4: The Alliance should expend resources to directly identify design and construction service providers for the grocery store market. The CSI baseline study for regional architects identified six architects that specialize in grocery stores.17 This may be a useful source. Additionally, as the business advisor works in the field, he should ask about design and construction leads, as well as firms that are working with regional chains on upgrades, remodels and new construction projects.
Conclusion 5: At least one of the technologies the Alliance wants to promote appears to require more research before it will be accepted by the market. The refrigeration contractors noted that the energy-efficient motors they have used don’t work in wet locations. This is a clear barrier to using energy-efficient motors in refrigeration systems and needs additional research before Smart Markets promotes the technology.
17 Peters, J.S., Mike Burdick and Robert Scholl. Commercial Sector Initiative Baseline Market Study: Architects. E04-
134. Portland, Oregon: Northwest Energy Efficiency Alliance. November 2004.
6. Conclusions and Recommendations
MPER: BETTERBRICKS SMART MARKETS PROGRAM PAGE 60
Recommendation 5: As has often been the case previously with energy efficiency products and services, it is important to understand the constraints on application of the measure before launching promotions. Working with companies that have experience in the field to identify problems and then working with manufacturers to address the field experiences is probably the most effective way to ensure that products can enter the market and be easily accepted.
This appendix presents the findings of a survey with 15 regional grocery store chain facility leads. The facility leads are the people who are responsible for decisions about facility operations and maintenance – and sometimes new construction – for the regional grocery chains.
SAMPLE
The Alliance provided a list of 24 grocery chains which it plans to target for Smart Markets. This list includes regional chains with at least five stores and excludes large national chains. For each grocery chain, we attempted to interview the person responsible for making decisions about facility operations for all the stores within the corporation.
Our contact information included the names of 103 officials at the 24 chains whose titles suggested they may be the person responsible for making the relevant decisions (e.g., CEO, Vice President of Operations, Director of Facilities). Part of the interview procedure involved contacting the officials listed and asking whom at the company would be the best person to interview.
When we believed we had identified the right contact, we asked some screening questions to ensure they had at least one of several responsibilities: facility operations, facility maintenance, new construction management or renovation management. We attempted to interview one official at each chain. We completed interviews with 15 decision-makers at 15 of the 24 targeted grocery chains (Table A-1). Officials at four of the chains refused to participate.
Appendix A
MPER: BETTERBRICKS SMART MARKETS PROGRAM PAGE A - 2
Table A-1 SAMPLE DISPOSITION
DISPOSITION CHAINS
Completed 15
Refused 4
Not reached 5
Total 24
The screening questions mentioned above also allowed interviewers to omit questions from the survey to which the contact would not be able to provide a knowledgeable answer. Most of the contacts we spoke with had most of the responsibilities on which we were focused (Table A-2).
Table A-2 CONTACTS’ RESPONSIBILITIES
RESPONSIBILITY HAS RESPONSIBILITY TOTAL
Facility (Equipment) Operations 14 15
Facility Maintenance 14 15
New Construction Management 12 15
Remodel and Renovation Management 13 15
SURVEY FINDINGS
Sharing of Energy Management and Equipment Service Duties
Contacts were asked whether their company has employees that are responsible for energy management and selected energy-using systems; they were also asked whether their company has service contracts that cover these items. Table A-3 shows that two-thirds (10 of 15) or more of the chains had either employees or a
Appendix A
MPER: BETTERBRICKS SMART MARKETS PROGRAM PAGE A - 3
service contract covering all four of the items that we inquired about, including energy management. We did not assume the energy management was equal to strategic energy management, but used this as a way to assess general commitment to energy management.
Table A-3 ENERGY MANAGEMENT AND EQUIPMENT RESPONSIBILITIES
RESPONSIBLE ACTIVITY COMPANY EMPLOYEES
ONLY
SERVICE CONTRACT
ONLY
BOTH EMPLOYEES
AND CONTRACT
NEITHER EMPLOYEES
NOR CONTRACT
TOTAL
Energy Management 6 2 2 5 15
HVAC Systems 0 9 6 0 15
Electrical Systems 4 4 2 5 15
Refrigeration Equipment 4 6 2 3 15
Regarding energy management, it appears that companies are more likely to have company employees responsible than to have a service contract covering it. The opposite is true for HVAC systems: no companies covered this solely with their own employees, while every single company reported having a service contract covering HVAC systems. Six companies had both employees and a contract covering HVAC systems. For electrical and refrigeration systems, companies were about equally likely to cover the systems with their own employees or a service contract.
When chains have a service contract covering these items, the contracts very seldom mention energy efficiency: only one chain’s HVAC service contract mentioned energy efficiency, as did one chain’s electrical service contract (Table A-4).
Appendix A
MPER: BETTERBRICKS SMART MARKETS PROGRAM PAGE A - 4
Table A-4 RESPONSIBILITIES COVERED BY MAINTENANCE SERVICE CONTRACTS
RESPONSIBILITY CONTRACT MENTIONS ENERGY EFFICIENCY
TOTAL WITH CONTRACT
Energy Management 0 4
HVAC Systems 1 15
Electrical Systems 1 6
Refrigeration Equipment 0 8
Corporate Commitment to Energy Management
Contacts at 12 chains reported they or someone in their company had made a formal request to local stores to reduce energy costs within the last two years. Ten of these contacts were able to specify the substance of the requests. Turning off lights or equipment when not in use was the substance of requests reported by the most (6 of 10) contacts (Table A-5).
Table A-5 SUBSTANCE OF REQUESTS TO REDUCE ENERGY COSTS
(MULTIPLE RESPONSES ALLOWED; N=10)
REQUEST TYPE COUNT
Turn Off Lights/Equipment When Not In Use 6
Check Settings on Automatic Controls 2
Retrofit Lighting/Equipment 2
Keep Exterior Doors Closed 1
Aggregate Energy Billing 1
Check Airflow In Refrigeration Cases 1
Appendix A
MPER: BETTERBRICKS SMART MARKETS PROGRAM PAGE A - 5
Most (9 of 15) chains do not have any written specifications for purchasing equipment (Table A-6). Only one contact reported having written purchasing specifications that have a requirement for energy efficiency—specifically applying to purchases of lighting, refrigeration, food production and HVAC equipment, as well as to purchases of motors and construction design services.
Table A-6 PURCHASING/PROCUREMENT POLICIES
PURCHASING POLICY COUNT
Written Specifications, Include Energy Efficiency Requirement 1
Written Specifications Have No Energy Efficiency Requirement 5
No Written Specifications 9
Total 15
Contacts used a five-point scale, where “1” is “very low”, and “5” is “very high”, to describe the level of commitment of their company’s CEO or COO to encouraging energy management in local stores (Table A-7).
Table A-7 CEO’S/COO’S COMMITMENT TO ENERGY MANAGEMENT
LEVEL OF COMMITMENT COUNT
5 (Very High) 5
4 3
3 4
2 1
1 (Very Low) 1
Don’t Know 1
Total 15
Appendix A
MPER: BETTERBRICKS SMART MARKETS PROGRAM PAGE A - 6
Just over half (8 of 15) of contacts reported the commitment level is high or very high.
Prevalence of Energy Management Practices
Contacts were asked whether their company engages in various key energy management practices. Table A-8 shows that the majority of chains regularly track energy consumption (11 of 15), have reviewed their rate schedules within the last year (9), and have had one or more of their facilities benchmarked (8).
Table A-8 PREVALENCE OF ENERGY MANAGEMENT PRACTICES
PRACTICE IMPLEMENTED TOTAL
Regularly Tracking Energy Consumption for All Local Stores 11 15
Reviewed Energy Rate Schedules and Contracts in the Last Year
9 15
Benchmarking Local Store Facilities 8 15
Energy Performance Targets for Local Stores 5 15
Company-Wide Written Guidelines for Energy Decisions (fuel choice, equipment purchases, etc.)
1 15
Energy Management Written Into Job Descriptions of Local Store Staff
1 15
Using Energy Accounting Software 1 15
Five contacts reported their local stores have energy performance targets, four of whom also reported that progress toward the targets is reviewed regularly. Three of the five contacts from chains with energy performance targets reported they had been the lead in developing the targets, one reported having participated on a team to develop the targets, and one contact reported having played only a minor role.
The eleven contacts who reported that they or someone who reports to them regularly track energy consumption data for all their local stores were asked whether they track energy usage data (e.g., kWh) or energy costs. Seven contacts reported they track both usage and costs, while two reported tracking usage and the
Appendix A
MPER: BETTERBRICKS SMART MARKETS PROGRAM PAGE A - 7
same number reported tracking costs. Contacts from chains that regularly track energy consumption were also asked how often they review their consumption data. Just over half (6 of 11) reported they review their consumption data monthly.
Contacts estimated the portion of the local stores within their chains that have electronic controls on several energy-using systems. A categorization of their estimates is provided in Table A-9. Electronic controls appear to be used on similar portions of chains’ stores across the system types, with the possible exception of in-store lighting systems; six chains reported that none of their stores have electronic controls on in-store lighting systems—no other system type had such a large number of chains reporting that the system is not electronically controlled in any of their stores.
Table A-9 PERCENT OF LOCAL STORES THAT HAVE ELECTRONIC CONTROLS ON SYSTEMS
SYSTEM 0% 1% -24%
25% - 49%
50% -74%
75% -99%
100% TOTAL
Refrigeration Systems 1 1 0 4* 6 4* 15
HVAC Systems 1 2 1 3 3 4 14**
In-Store Lighting 6 1 0 3 4 1 15
Parking Lot Lighting 2 1 1 2 3 6 15
* One contact reported 100% for new stores and 63% for existing stores.
** One contact could not provide an estimate for HVAC systems.
Corporate Supervision of Operations Practices
The Alliance’s market specialists identified a number of key operations practices that can save energy in grocery stores. We asked contacts whether their grocery chain directly oversees or provides active guidance to its local store facilities about how the practices should be carried out, or whether the local stores are essentially free to handle the practice as they see fit. If a chain had a company-wide service contract covering the practice, the company was considered to be supervising the practice.
Appendix A
MPER: BETTERBRICKS SMART MARKETS PROGRAM PAGE A - 8
Table A-10 displays, for each practice we asked about, whether contacts reported their company directly oversees it; the table is sorted by the number of companies that reported they oversee the practices. For all of the practices we asked about, the majority of contacts reported their corporate offices do provide supervision or guidance to local stores. Use of T-8 lamps with electronic ballasts was the practice most reported to be overseen by the corporate office, with 14 of 15 chains reporting they supervise the practice.
Table A-10 CORPORATE SUPERVISION OF OPERATIONS PRACTICES
OPERATIONS PRACTICE CORPORATE SUPERVISES
TOTAL
Using T-8 Lamps and Electronic Ballasts 14 15
Use of Airlocks at Store Entrances 12 15
Checking and Setting Refrigeration Check-Points 11 15
Timer or Photocell Controls on Parking Lot Lighting 11 15
Using Anti-Sweat Controls on Refrigerator/Freezer Doors 11 15
Group Relamping 10 15
Programs to Turn Off or Reduce Lighting During Night Stocking 10 15
Maintenance Programs for Frozen Seals on Display Case Doors 10 15
Checking and Resetting Thermostats and Timers 9 15
Use of Electronically Commutated Fan Motors 9 15
Use of Permanent Split Capacitor Fan Motors 9 15
Prevalence of Best Practices
With regard as to how all of these practices are carried out at the chains’ stores, we asked one or more follow-up questions about each practice to gauge where stores’ current practices are in comparison to best practices (as identified by the Alliance’s market specialists). For many of the practices, we simply asked contacts to estimate the percentage of their stores that handle the practice in the manner recommended
Appendix A
MPER: BETTERBRICKS SMART MARKETS PROGRAM PAGE A - 9
by Alliance market specialists. For several of the practices, we asked different questions, depending on whether the company directly oversees the practice.
Lighting Practices
Answers to follow-up questions about lighting practices were the same regardless of whether chains directly oversee the practice, with the exception of group relamping (see Table A-11). Having timers or photocell controls on parking lot lighting was the most commonly implemented lighting practice among those we asked about, with 11 of 15 contacts reporting this is implemented at 100% of their stores. A majority (8) of contacts also reported having T-8 lighting with electronic ballasts at 100% of their stores.
Table A-11 LIGHTING: ESTIMATED PORTION OF CHAINS’ STORES MEETING BEST PRACTICE
BEST PRACTICE 0% 1% - 33%
34% -66%
67% -99%
100% DON’T KNOW
TOTAL
Timers or Photocell Control of Parking Lot Lighting — — 1 3 11 — 15
Contacts who reported their chain directly oversees whether or how often local stores do group relamping were asked when group relamping was last done at their stores. Half of these contacts (5 of 10) reported their stores had done group relamping within the last two years, three had group-relamped in the previous three years and two did not know.
The three contacts reporting their companies do not oversee group relamping estimated the percentage of their stores that practice group relamping. Two contacts guessed none of their stores do group relamping; the third contact guessed that 25% of the chain’s stores practice it.
Appendix A
MPER: BETTERBRICKS SMART MARKETS PROGRAM PAGE A - 10
Refrigeration Practices
All contacts estimated the portion of their chains’ stores that have maintenance programs for frozen door seals (on freezer doors) and the portion with controls on the anti-sweat devices on refrigeration-case doors. For both practices, the most frequently given response was that 100% of the chain’s stores implement them: 7 of 15 said all their stores have maintenance programs for frozen door seals and 6 of 15 said all their stores have anti-sweat controls on refrigeration case doors (Table A-12).
Table A-12 REFRIGERATION: ESTIMATED PORTION OF CHAINS’ STORES MEETING BEST PRACTICE
BEST PRACTICE 0% 1% - 33%
34% - 66%
67% -99%
100% DON’T KNOW
TOTAL
Maintenance Programs for Frozen Door Seals 3 — 2 1 7 2 15
Anti-Sweat Controls on Refrigeration Case Doors 1 3 1 1 6 3 15
Of the 11 contacts who reported the corporate office guides its stores as to how often refrigeration set-points should be checked, we asked for an estimate of how often this is done in the chain’s typical store. The most commonly reported (5 of 11) frequency of checking refrigeration set-points was quarterly (Table A-13).
Table A-13 FREQUENCY OF CHECKING REFRIGERATION
SET-POINTS IN TYPICAL STORE
FREQUENCY COUNT
Monthly 4
Quarterly 5
Less Often 2
Total 11
Appendix A
MPER: BETTERBRICKS SMART MARKETS PROGRAM PAGE A - 11
We also asked these same eleven contacts (whose companies directly oversee the checking of refrigeration set-points) to estimate the portion of their stores that have adjusted their refrigeration set-points within the last six months—this would place them within best practices according to Alliance market specialists, who indicated the set-points should be adjusted seasonally. Most (6 of 11) contacts reported that 100% of their stores had done so (Table A-14).
Table A-14 REFRIGERATION SET-POINTS: PORTION OF STORES MEETING BEST PRACTICE
FREQUENCY 25% 50% 75% 100% DON’T KNOW
TOTAL
Adjusted Refrigeration Set-Points in Last 6 Months
1 1 1 6 2 11
The four contacts who reported their chain does not supervise or guide local stores in how often refrigeration set-points ought to be checked or reset were asked to estimate the percentage of the stores in their chain that check the set-points every month, and the percentage of stores that adjust the set-points seasonally. All four contacts reported that 100% of their stores check the set-points monthly and adjust the set-points seasonally
HVAC Practices
The nine contacts who reported their chain directly oversees how frequently stores check or adjust thermostats and timers were asked how often the devices are checked in a typical store and what percent of stores have adjusted their thermostats and timers within the last six months (the Alliance’s market specialists determined that having adjusted the devices within the last six months would fall within best practices). The most commonly reported (7 of 9) frequency of checking thermostats and timers was twice per year (Table A-15).
Appendix A
MPER: BETTERBRICKS SMART MARKETS PROGRAM PAGE A - 12
Table A-15 FREQUENCY OF CHECKING/RESETTING THERMOSTATS
AND TIMERS IN A TYPICAL STORE
FREQUENCY COUNT
Twice Per Year 7
Less Often 1
Don’t Know 1
Total 9
Of the six contacts reporting their chains do not oversee how often thermostats and timers should be checked, two-thirds (4 of 6) of contacts reported that 100% of their stores check and adjust thermostats and timers about twice a year (Table A-16)
Table A-16 THERMOSTATS AND TIMERS: PORTION OF STORES MEETING BEST PRACTICE
FREQUENCY 100% DON’T KNOW TOTAL
Checking, Adjusting Thermostats and Timers About Twice A Year
4 2 6
All contacts estimated the portion of their stores that have double-doors at customer entrances or receiving entrances, and the portion of stores with “permanent split capacitor” (PSC) motors. Most contacts (9 of 15) estimated the portion of their chains’ stores with double-doors at entrances at between 1% and 33% (Table A-17). With regard to PSC motors, contacts frequently (7 of 15) could not estimate the prevalence of their use in their chains’ stores.
Appendix A
MPER: BETTERBRICKS SMART MARKETS PROGRAM PAGE A - 13
Table A-17 HVAC: ESTIMATED PORTION OF CHAINS’ STORES MEETING BEST PRACTICE
All contacts also estimated the portion of all the fan motors in use at their chains’ stores that are electronically commutated (ECM). Again, frequently (7 of 15) contacts did could not provide an estimate (Table A-18). However, among those who could provide an estimate, most (5 of 8) gave 0% (i.e., none of the fan motors in use at any of their stores are ECM).
Table A-18 FAN MOTORS: ESTIMATED PORTION OF CHAINS’ STORES MEETING BEST PRACTICE
BEST PRACTICE 0% 1% - 33%
34% - 66%
67% - 99%
100% DON’T KNOW
TOTAL
Portion of Fan Motors in Chains’ Stores that Have Electronically Commutated Motors
5 2 — — 1 7 15
Resources for Saving Energy
Five contacts reported they or a member of their staff are involved in state grocery store associations or other professional organizations (Table A-19).
Appendix A
MPER: BETTERBRICKS SMART MARKETS PROGRAM PAGE A - 14
Table A-19 TRADE ORGANIZATION MEMBERSHIP
(MULTIPLE RESPONSES ALLOWED; N=5)
ORGANIZATION COUNT
Oregon Grocery Association 2
National Grocery Association 1
Food Marketing Institute 1
Association of Oregon Food Industries 1
Unverified Response 2
One of the fifteen contacts we spoke with had received Building Operator Certification (BOC), while an additional four contacts were aware of the training program offered by the Northwest Energy Efficiency Council (NEEC) or the Idaho Building Operators’ Association (Table A-20).
Table A-20 BUILDING OPERATORS CERTIFICATION
ACTIVITY COUNT
Contact or Contact’s Staff Received Building Operator Certification from NEEC/IBOA
1
Did Not Receive Building Operator Certification, but Aware of BOC from NEEC/IBOA
4
Not Aware of Building Operator Certification 10
Total 15
Just over one-third (6 of 15) of contacts reported being aware of the term “strategic energy management plan”. One-third (5 of 15) of contacts reported being aware of BetterBricks (Table A-21) and one-fifth were aware of the BetterBricks Smart Markets Program.
Appendix A
MPER: BETTERBRICKS SMART MARKETS PROGRAM PAGE A - 15
Table A-21 ENERGY EFFICIENCY RESOURCE AWARENESS
RESOURCE COUNT TOTAL
Strategic Energy Management Plan 6 15
BetterBricks 5 15
BetterBricks Smart Markets Program 3 15
.
Appendix A
MPER: BETTERBRICKS SMART MARKETS PROGRAM PAGE A - 16
MPER: BETTERBRICKS SMART MARKETS PROGRAM
APPENDIX B
Grocery Store Managers Baseline
Appendix B
MPER: BETTERBRICKS SMART MARKETS PROGRAM
MPER: BETTERBRICKS SMART MARKETS PROGRAM PAGE B - 1
GROCERY STORE MANAGERS BASELINE
This appendix presents results from interviews with 51 managers of grocery stores that are part of regional chains. The store managers are responsible for retail operations in their store and may have some oversight of facility operations.
SAMPLE
The Alliance plans to target grocery chains that have at least five stores and operate mostly within the Pacific Northwest—this excludes very small chains and national chains. The survey of grocery store managers focused on operations at stores affiliated with the targeted chains. The Alliance’s market specialists provided the research team with lists identifying 24 grocery chains they plan to target. Included on these lists were the various brand names for the local stores that comprise the chains.
To interview managers at targeted local grocery stores, we needed to obtain contact information for the local stores and their managers; this information was available through a commercial business information provider (InfoUSA) and was organized not by corporate parent (chain name), but by store brand name. The information provided by the Alliance identified 43 brand names used by the 24 targeted chains, and an additional 8 brand names,18 for a total of 51 grocery brands.
Using the purchased list, we obtained names and contact information for managers at local stores for 45 of the 51 brands. The local stores for which we obtained contact information represented at least 22 of the original 24 targeted chains.19 Ultimately, the list we compiled contained names and contact information for managers at 222 stores within the targeted group.
Calls were made to the store managers between late September and early October 2005. As we completed the interviews, we sought to increase the robustness of the sample by attempting to interview at least one store manager at each of the various grocery brands. We also kept track of in which of the four Northwest states the
18 Some of these additional brand names may belong to chains not previously identified as targeted.
19 Because the list of additional brands provided by the Alliance did not include information about corporate parentage, it is impossible to determine exactly how many targeted chains are represented here.
Appendix B
MPER: BETTERBRICKS SMART MARKETS PROGRAM PAGE B - 2
stores were located in order to ensure an adequate number of respondents from each state; we kept track of the relative size of the chains of which the stores were a member to ensure the sample contained a more or less equivalent portion of stores whose chains are small, medium and large.
Table B-1 presents the final disposition of the interviews. We interviewed 51 grocery store managers at 33 of the targeted grocery brands. The interviews took about 10 minutes. Before proceeding with each interview, we confirmed that the interviewee was in fact the person responsible for decisions about operations and management for that grocery store. In trying to contact the managers, we sometimes found that the person we were asking for was not actually the store manager—in these cases we asked to be referred to whoever held that position. The list from InfoUSA therefore was satisfactory to locate the store and sometimes the store manager.
Table B-1 DISPOSITION OF INTERVIEWS
DISPOSITION TOTAL
Completed 51
Hard Refusal 5
Soft Refusal 3
Refused
Needs Corporate Clearance 36
Left Company/Changed Jobs 2
Duplicate Record 1
Disconnected Number 3
List Errors
Not Qualified—Not A Store Manager 1
Attempts Failed 46 No Contact Made
No Attempt (Quota Reached) 74
Total 222
Appendix B
MPER: BETTERBRICKS SMART MARKETS PROGRAM PAGE B - 3
FINDINGS
Almost nine in ten (89%) store managers reported they receive guidance about facility operations from a contact at their corporate office, wholesaler’s office or from some other source. Just over half (52%) reported that someone in their corporate office has at some point made a formal request that their store reduce energy costs. Forty percent of managers have received written guidelines involving energy usage or efficiency from someone in their company, with only 2% of managers saying they did not understand what that would mean.
As shown in Table B-2, about one-third of managers reported that they have reviewed energy usage data on their own (33%), that they have reviewed the data with corporate contacts or with corporate contacts and on their own (34%), or that they have not reviewed energy usage data at all (31%).
Table B-2 REVIEWING ENERGY USAGE
USAGE DATA REVIEW PRACTICE PERCENT (n=51)
Reviewed Data on Their Own 33%
Reviewed Data With Corporate Contact and on Their Own 26%
Reviewed Data With Corporate Contact 8%
Have Not Reviewed Data or Don’t Know 31%
Most (61%) stores do not have energy usage goals. Managers who reported their stores do have usage goals were asked whether they review progress toward their goals annually, more often or less often. However, most stores who have energy usage goals review their progress towards the goals regularly: three-fourths (75%) of managers who had reported their stores have usage goals reported they review their progress more often than once a year, with 15% saying they review the goals about once a year and 10% saying they review them less often. Only a small portion of managers whose stores have energy usage goals reported there are any bonuses tied to achieving the goals.
Appendix B
MPER: BETTERBRICKS SMART MARKETS PROGRAM PAGE B - 4
Managers were asked if they were familiar with a series of specific practices that can save energy in grocery stores. Managers who were familiar with a given practice were asked whether the practice was being implemented in their store. Of the seven practices we asked about, the most well-known practice was having timer or photocell controls on parking-lot lighting (Table B-3). Virtually all (96%) managers were aware of these controls and almost nine in ten (88%) managers reported the controls are implemented in their stores.
Table B-3 IMPLEMENTING ENERGY EFFICIENCY PRACTICES
(MULTIPLE RESPONSES ALLOWED; N=51)
PRACTICE AWARE IMPLEMENTED
Control of Parking Lot Lighting (Timer or Photocell) 96% 88%
Guidelines for Correct Loading of Cases 86% 75%
Maintenance Program for Frozen Door Seals 84% 69%
Double-Doors (Airlock) at Customer Entrance or Receiving Door 98% 61%
Controls on Doors for Freezers and Coolers to Reduce Sweating 78% 59%
Control Programs to Shut Off or Reduce the Lights for Night Stocking
94% 51%
Facility Energy Audits or Assessments 43% 24%
No less than three-fourths of managers reported being aware of all the practices we asked about, with the exception of facility audits or assessments, of which only 43% were aware. The majority of managers reported all the practices are implemented in their stores, with the same exception.
Just over half (54%) of managers reported they purchase lighting or refrigeration equipment for their stores. We asked the 28 managers who reported they purchase these types of equipment whether they have specifications or policies to follow which include a requirement for energy efficiency. Most of the managers involved in purchasing the equipment report they do have such a policy: 71% for lighting and 57% for refrigeration equipment purchases.
Appendix B
MPER: BETTERBRICKS SMART MARKETS PROGRAM PAGE B - 5
When asked whether they or their employees are involved in any of the state grocery store associations or other professional organizations, 45% of managers reported such involvement; 16% reported they were not personally involved, but were unsure whether any of their staff were involved. Managers who reported they or their staff were involved in these types of organizations were asked for the names of the organizations in which they participate. Of the 22 who responded, four said someone in the corporate office was a member, but they did not know of which association. The remaining 19 provided names for 26 organizations, as shown in Table B-4. The two most frequently mentioned were the National Grocers Association (NGA) and the Food Marketing Institute (FMI). Seven of the responses described either the wholesaler or an association whose name could not be confirmed through a web search.
Table B-4 INVOLVEMENT IN INDUSTRY ASSOCIATIONS
(MULTIPLE RESPONSES ALLOWED; N=19)
ORGANIZATION COUNTS
National Grocers Association 5
Food Marketing Institute 4
Idaho Retailers Association 2
Montana Food Distributors Association 2
Washing State Food Dealer Associations 2
Oregon Grocery Association 1
Food Distributors International 1
American Grocers Association 1
Wholesaler 4
Other (could not be verified) 4
Total 26
Few (8%) managers reported that they or any members of their staff had received certification from training in any areas of building operations and maintenance. No
Appendix B
MPER: BETTERBRICKS SMART MARKETS PROGRAM PAGE B - 6
managers had received Building Operator Certification, nor had any of their staff been so certified. In fact, none of the managers had even heard of the Building Operator Certification program.
Managers were asked to consider whether training might be useful to themselves or their staff in the area of energy management or facility operations and maintenance, and were asked to name specific topics, if any, in which they would like training. Most managers (65%) could not think of any topics for which they thought training would be useful. Table B-5 shows the topic areas mentioned by the 18 managers who did provide a response.
Table B-5 TOPICS IN WHICH TRAINING MAY BE USEFUL
(MULTIPLE RESPONSES ALLOWED; N=18)
TOPIC PERCENT
General Interest in Training 50%
Energy Audits 22%
Evaluating Our Usage 17%
Simple/Specific Energy Savings Practices 17%
Case Loading 6%
The most common response among those managers who could provide one was a general expression of interest in or openness to any training that may be available; 50% of managers gave this type of response. The next most common topic, mentioned by just over one-fifth (22%) of those responding, was information on facility energy audits. Just under one-fifth (17%) were interested in learning how to evaluate their usage or in understanding how efficient or inefficient their facility was in comparison to others. The same portion showed interest in simple, specific energy-saving practices.
MPER: BETTERBRICKS SMART MARKETS PROGRAM
APPENDIX C
Regional Wholesaler Design and Construction Leads
Appendix C
MPER: BETTERBRICKS SMART MARKETS PROGRAM
MPER: BETTERBRICKS SMART MARKETS PROGRAM PAGE C - 1
REGIONAL WHOLESALER DESIGN AND CONSTRUCTION LEADS
This appendix provides the results from a survey of design and construction services offered by grocery wholesalers in the Pacific Northwest.
SAMPLE
Throughout the four states of Washington, Oregon, Idaho and Montana there are grocery wholesalers who work with regional grocery chains. These firms provide a wide range of services, including food supply, building design and operation, storage and administration. We were able to conduct interviews with the design and construction leads at three of the six wholesalers who serve the Pacific Northwest. In these interviews, we asked questions about grocery lighting, refrigeration and HVAC systems, as well as design and construction-related practices. The other three possible contacts either refused to participate in the survey or indicated that they no longer offered design and construction services. Due to the small number of respondents, each response is discussed and portrayed in the tables below.
All three of the contacts are responsible for decisions about new equipment purchasing, as well as facility planning and design, for grocery stores. More specifically, two of the three wholesalers reported having primary responsibility for equipment purchasing for local stores served by their company and one contact reported having primary responsibility for new construction management for local stores (Table C-1). None of the three wholesalers has primary responsibility for managing remodels or renovations at local stores they serve.
The number of stores for which the contacts provided design and construction services during the past year was 45 for one contact and more than 25 for another. The third contact reported providing design and construction services to five stores during the past year. The contact who reported assisting 45 stores said those stores comprised approximately 1.8 million square feet of store space.20
20 The Alliance assumes the total grocery market is approximately 57 million square feet. KEMA, Assessment of the
Commercial Building Stock in the Pacific Northwest, Report 04-125, March 2004. See: www.nwalliance.org/resources/mktreports.asp.
Appendix C
MPER: BETTERBRICKS SMART MARKETS PROGRAM PAGE C - 2
Table C-1 WHOLESALER PRIMARY RESPONSIBILITIES AND NUMBERS OF PROJECTS
RESPONSIBILITY CONTACT 1 CONTACT 2 CONTACT 3
Equipment Purchasing No Yes Yes
New Construction Management No No Yes
Number of Store Projects In Previous Year 45 25+ 5
FINDINGS
One of the three contacts’ companies has written guidelines for energy decisions involving equipment purchases or store planning and design (Table C-2). Two of the companies have energy performance targets to use when planning and designing projects, and some of the stores served by two of the wholesalers have been benchmarked. To benchmark their stores, one company compares all of its stores to each other on a monthly basis. The other wholesaler reported 25 of their 450 stores have been benchmarked by their utility.
Table C-2 WHOLESALER PRACTICES
PRACTICE CONTACT 1 CONTACT 2 CONTACT 3
Written Purchasing Guidelines No Yes No
Energy Performance Targets Yes Yes No
Stores Benchmarked Yes Yes No
Weatherization was fairly common in the contacts’ recent projects. Of those grocery stores for which the contacts provided design and construction services during the past year, the percentages which used double-door vestibules or airlocks at store entrances or receiving doors were 98%, 60% and 90%, respectively (Table C-3). Two contacts said all (100%) of their grocery projects included insulated and weather-stripped receiving doors in the previous year. The third contact reported 80% of his projects had receiving doors weatherized in these ways.
Appendix C
MPER: BETTERBRICKS SMART MARKETS PROGRAM PAGE 3
Table C-3 USE OF CERTAIN LIGHTING AND WEATHERIZATION FEATURES
FEATURE CONTACT 1 CONTACT 2 CONTACT 3
Double-Door Vestibules at Entrances 98% 60% 90%
Insulated and Weather-Stripped Receiving Doors
100% 100% 80%
Daylighting Increased 5% 2% 10%
Skylights Used 1% 2% 0%
Daylight Harvesting 0% 0% 0%
Natural lighting and increases in existing natural lighting were far less common in the contacts’ recent projects. The three contacts reported daylighting in the grocery stores for which they provided design and construction services during the past year increased over the stores’ or operating companies’ previous standards by 5%, 2%, and 10%, respectively (Table C-3). Two of the contacts reported skylights were used in 1% and 2% of their projects last year. The third contact said skylights were not used in any of the stores in which he worked during that time. Daylight harvesting, that is, control systems to decrease general store lighting when natural lighting is available, was not used by any of the contacts in any of their store projects during the past year.
Regarding control systems for various kinds of equipment installed during the past year, the three contacts estimated the percentages of their grocery store projects in which microprocessor-based control systems (as distinguished from analog control systems) were used for their refrigeration systems to be 85%, 100% and 80%, respectively (Table C-4). Estimates of the jobs that used microprocessor-based control systems for HVAC systems varied widely from contact to contact, and were 95%, 2%, and 80%, respectively. Estimates for the use of microprocessor-based control systems for in-store lighting systems were roughly the same at 85%, 2% and 80%, respectively. The use of microprocessor-based control systems for parking-lot lighting was similarly estimated to be 100%, 2% and 80%, respectively.
Appendix C
MPER: BETTERBRICKS SMART MARKETS PROGRAM PAGE C - 4
Table C-4 USE OF MICROPROCESSOR CONTROL SYSTEMS
EQUIPMENT CONTACT 1 CONTACT 2 CONTACT 3
Refrigeration 85% 100% 80%
HVAC 95% 2% 80%
In-Store Lighting 85% 2% 80%
Parking-Lot Lighting 100% 2% 80%
The contacts also provided estimates of the percentages of various lighting equipment they purchased during the previous year that had certain energy efficiency attributes. For example, regarding purchases of overhead lighting, the contacts estimated 100%, 35% and 95%, respectively, of their purchases were T-8 lamps rather than T-12 lamps (Table C-5). For purchases of refrigeration-case and display lighting, the three contacts estimated 100%, 35% and 100%, respectively, of their purchases were of T-5 or T-8 lights. They also estimated that 100%, 35% and 95%, respectively, of the ballasts they purchased were electronic ballasts rather than magnetic ballasts.
Table C-5 PERCENTAGES OF ENERGY-EFFICIENT LIGHTING AND HVAC EQUIPMENT PURCHASED
FEATURE CONTACT 1 CONTACT 2 CONTACT 3
Overhead T-8 Lighting 100% 35% 95%
Electronic Ballasts 100% 35% 95%
T-8 or T-5 Case or Display Lighting 100% 35% 100%
Integrated or Built-Up HVAC Systems 65% 99% 20%
Large Motors with Variable Speed Drives 10% 5-10% NA
HVAC with Fully Functional Economizer Mode
5% 5-10% 90+%
Demand Controlled Ventilation System 45% 1-2% 0%
Appendix C
MPER: BETTERBRICKS SMART MARKETS PROGRAM PAGE 5
The contacts also provided estimates for the percentages of energy-efficient HVAC systems and components purchased during the preceding year. For the systems themselves, the contacts reported 65%, 99% and 20%, respectively, of their purchases were of large, integrated, or built-up systems, rather than of individual, roof-top units or gas packs (Table C-5). The percentages of the HVAC systems with large motors with variable speed drives (VSDs) were estimated to be 10% by one contact, and from 5% to 10% by another contact. The third contact did not provide an estimate for such motors. The percentages of HVAC systems purchased with a fully functional economizer mode were estimated to be 5%, from 5% to 10% and 90% or more. Finally, two of the contacts reported the percentages of the HVAC systems they had purchased that used a demand controlled ventilation system to sense carbon dioxide were 45%, and 1% to 2%, respectively. One contact said none of the systems he had purchased during the preceding year had a demand controlled ventilation system.
For the refrigeration systems purchased by the wholesalers during the previous year, the contacts gave estimates of 100%, 95% and 100%, respectively, for the percentages of the systems that included a heat reclaim system (Table C-6). The use of the reclaimed heat in all of the stores served by two of the contacts was to heat water. In the stores served by the third contact, one-half of the reclaimed heat was used to heat water and the other half was used to heat the buildings. Two of the three contacts reported all of the refrigeration cases they purchased in the past year included energy-efficient fan motors. The third contact said 90% of the cases he purchased had such motors.
Table C-6 PERCENTAGES OF ENERGY EFFICIENT REFRIGERATION FEATURES
FEATURE CONTACT 1 CONTACT 2 CONTACT 3
Heat Reclaim System 100% 95% 100%
Reclaimed Heat Used for Water 100% 100% 50%
Cases with Energy-Efficient Fan Motors 100% 100% 90%
The contacts rated the importance to their organizations of first-cost when purchasing various kinds of equipment. On a five-point scale, where “1” is “not at all important” and “5” is “very important,” the contacts’ responses indicate the
Appendix C
MPER: BETTERBRICKS SMART MARKETS PROGRAM PAGE C - 6
importance of first-cost equals or outweighs the importance of other financial considerations when making such purchases. More specifically, all responses were a “3” or higher (Table C-7).
Table C-7 IMPORTANCE OF FIRST-COST
ITEM BEING PURCHASED CONTACT 1 CONTACT 2 CONTACT 3
Lighting 5 4 4
Refrigeration Equipment 4 4 4
Motors 3 4 NA
HVAC 3 4 4
Food Production Equipment 3 3 4
All of the contacts said they are familiar either with the term life-cycle cost or total cost of ownership. Two contacts said they apply these approaches to all of their equipment purchases. The other contact said he applies life-cycle cost or total cost of ownership mostly to purchases of refrigeration cases. This latter contact was the only one of the three who said he does not develop specifications for purchasing equipment and is not a member of a team that develops such specifications. The other two contacts, both of whom participate in developing purchasing specifications, said their specifications for the purchase of lighting, refrigeration and HVAC equipment, and purchases of motors and control systems, have requirements about energy efficiency (Table C-8). One of these two contacts said their purchasing specifications for food production equipment also have energy efficiency requirements.
Appendix C
MPER: BETTERBRICKS SMART MARKETS PROGRAM PAGE 7
Table C-8 PURCHASING SPECIFICATIONS WITH ENERGY EFFICIENCY REQUIREMENTS
ITEM BEING PURCHASED CONTACT 1 CONTACT 2 CONTACT 3
Lighting Yes Yes NA
Refrigeration Yes Yes NA
Motors Yes Yes NA
HVAC Yes Yes NA
Control Systems Yes Yes NA
Food Production Equipment Yes No NA
One of the three contacts reported membership in a professional organization, the Store Development Consortium, a national organization of wholesalers (Table C-9). Two of the contacts reported familiarity with the term BetterBricks, one of them said he had heard of the Alliance’s BetterBricks Smart Markets Program, and two contacts said they were aware of the term Strategic Energy Management Plan.
Table C-9 PROFESSIONAL AFFILIATIONS AND AWARENESS OF CERTAIN TERMS
AFFILIATION / TERM CONTACT 1 CONTACT 2 CONTACT 3
Professional Affiliation No No Yes
BetterBricks Yes No Yes
BetterBricks Smart Markets with the Alliance
Yes No No
Strategic Energy Management Plan Yes Yes No
Two of the contacts offered suggestions for education and training topics related to energy management that would be useful to them or to their staff. One contact mentioned courses on refrigeration systems and the proper maintenance procedures for compressors. The other mentioned courses regarding specifications for new
Appendix C
MPER: BETTERBRICKS SMART MARKETS PROGRAM PAGE C - 8
three-phase electric service, air handlers, refrigeration, heat reclaiming, lighting and daylighting. The third contact added, “We're interested in new and better ideas, but [the Alliance] needs to understand that we don't have the staff or energy to make many changes without additional labor, materials and financial support.”
MPER: BETTERBRICKS SMART MARKETS PROGRAM
APPENDIX D
Refrigeration Contractors Baseline
Appendix D
MPER: BETTERBRICKS SMART MARKETS PROGRAM
MPER: BETTERBRICKS SMART MARKETS PROGRAM PAGE D - 1
REFRIGERATION CONTRACTORS BASELINE
This appendix presents the results of a survey of contacts in 12 refrigeration firms that provide services to regional grocery stores.
SAMPLE
In order to better understand current refrigeration decision-making and practices in grocery stores in Washington, Oregon, Idaho and Montana, we interviewed refrigeration contractors who work in grocery stores in the four states. The focus of the interviews was on work done for independent chain stores, as distinguished from the smaller convenience grocery stores (convenience stores) and from the larger, national supermarket chains (national chains). For purposes of this study, independent chain stores are those typically having five to roughly 35 locations, owned and headquartered in the Pacific Northwest.
The Alliance provided a list of 33 firms. Calls were made to all of the entries, and fourteen contractors representing 12 firms were interviewed. For the two firms where two people were interviewed, the responses were combined into one completed interview. Therefore, for the remainder of this discussion, the number of completed interviews is given as 12.
Table D-1 shows the disposition of all entries on the original Alliance list. In addition to the completed interviews, there were five duplicate entries, and 11 contractors were not qualified to be interviewed. Of the 11, five do no grocery store work. Five others were not interviewed because the amount of work they do for independent chain stores is a negligible portion of their total grocery store work. The remaining unqualified contractor functions as a refrigeration broker, subcontracting all actual refrigeration work to other firms.
Appendix D
MPER: BETTERBRICKS SMART MARKETS PROGRAM PAGE D - 2
Table D-1 POPULATION DISPOSITION
DISPOSITION NUMBER
Completed 14*
Refused 2
List Error: Duplicate Records 5
No Work for Grocery Stores 5
No Work for Independent Chain Stores 5
Not Qualified
No Refrigeration Work 1
No Contact Made: Calls Not Returned 3
Total 35*
* On two occasions, two contractors were interviewed from the same firm. These contractors had different roles and could provide information the other contractor could not provide. The information provided by the contractors from the same firms was combined into one interview.
FINDINGS
This section describes the contractors’ involvement with refrigeration design, installation and maintenance decisions and activities in grocery stores. Refrigeration components specifically addressed include refrigeration system racks, cases, motors, lighting and controls. The contractors’ uses of proprietary refrigeration technology and of commissioning are also explored. The appendix closes with a review of the contractors’ comments about the differences between their work done for independent chain stores and their work done for other types of grocery stores.
Characteristics of Interviewed Contractors
Most of the contractors work in more than one state. Three-quarters or more of the contractors work in Washington or Oregon, more than one half (58%) of them work in Idaho and one-third work in Montana (Table D-2). One half of the contractors work in states outside of the Pacific Northwest including Alaska, Arizona, California, Colorado, Nevada, New Mexico, Wyoming and others.
Appendix D
MPER: BETTERBRICKS SMART MARKETS PROGRAM PAGE 3
More than one-half of the contractors’ firms have only a single location. One-quarter of their firms have three or more locations, including one firm with 25 locations and another with 79 locations.
These latter firms also have the largest number of employees, reporting 800 and 9,000 employees, respectively. However, more than one-half (58%) of the contractors’ firms have 50 or fewer employees, with the fewest number of employees being four.
Table D-2 CHARACTERISTICS OF INTERVIEWED CONTRACTORS
CHARATERISTIC NUMBER PERCENT (n=12)
STATES IN WHICH CONTRACTORS WORK (MULTIPLE RESPONSES ALLOWED)
Washington 10 83%
Oregon 9 75%
Idaho 7 58%
Montana 4 33%
Other States 6 50%
NUMBER OF FIRM’S LOCATIONS
One 7 58%
Two 2 17%
Three or More 3 25%
NUMBER OF EMPLOYEES
1 to 25 4 33%
26 to 50 3 25%
51 to 75 1 8%
>100 3 25%
No Response 1 8%
Continued
Appendix D
MPER: BETTERBRICKS SMART MARKETS PROGRAM PAGE D - 4
CHARATERISTIC NUMBER PERCENT (n=12)
NUMBER OF YEARS FIRM HAS SERVICED GROCERY STORES
10 to 15 3 25%
16 to 30 6 50%
30+ 2 17%
No Response 1 8%
GROCERY STORE WORK AS PORTION OF FIRM’S TOTAL WORK
1% to 25% 1 8%
26% to 50% 2 17%
51% to 75% 4 33%
76% to 100% 4 33%
No Response 1 8%
ACTIVE IN TRADE ASSOCIATIONS
Yes 8 67%
No 4 33%
The number of years during which the contractors’ firms have been offering refrigeration services to grocery stores ranged from 12 to 100, with one-half of the firms having provided such services for 15 to 30 years (Table D-2). More than one-half of the refrigeration work done by two-thirds of the contractors is for grocery stores. Only one contractor reported doing less than 25% of his work for grocery stores.
Two-thirds of the contractors reported being active in trade associations for refrigeration or heating, ventilation and air conditioning (HVAC). Their most commonly reported trade association affiliations were with the American Society of Heating, Refrigeration and Air Conditioning Engineers (ASHRAE—four mentions) and the Refrigeration Service Engineers Society (RSES—three mentions). Other trade associations mentioned were the Refrigeration Engineers and Technicians Association (RETA), the Food Marketing Institute (FMI), the Mechanical Contractors Association (MCA), Mechanical Service Contractors of America (MCSA)
Appendix D
MPER: BETTERBRICKS SMART MARKETS PROGRAM PAGE 5
and the Hill Phoenix discussion group. Three of the contractors are active in two or more associations.
Contractors were screened on the basis of the portion of total grocery store refrigeration work they do for three types of stores: convenience stores, independent chain stores and national chains (Table D-3). The portion of the interviewed contractors’ grocery store work devoted to convenience stores ranged from none to 45%, with an average percentage of 11% and a median percentage of 8%. The portion of the contractors’ grocery store work devoted to independent chains ranged from 10% to 90%. Both the average and the median percentages for this work were 38%. The portion of the contractors’ grocery store work devoted to national chains ranged from none to 90%, with an average percentage of 51%, and a median percentage of 50%. Not surprisingly, refrigeration contractors who do grocery refrigeration work are doing more work for independent chain stores than for convenience stores, and more work for national chains than for either of the other two types of stores.
Table D-3 PERCENT OF CONTRACTOR WORK BY GROCERY STORE TYPE
PERCENT OF WORK CONVENIENCE STORES
INDEPENDENT CHAINS
NATIONAL CHAINS
0 to1% 4 — 1
5% to 20% 7 4 1
21% to 40% — 3 2
41% to 60% 1 3 4
61% to 80% — 1 1
>81% — 1 3
Range 0%-45% 10%-90% 0%-90%
Average Percent 11% 38% 51%
Median Percent 8% 38% 50%
Appendix D
MPER: BETTERBRICKS SMART MARKETS PROGRAM PAGE D - 6
Refrigeration System Design, Installation and Maintenance
Of the 12 interviews, 11 reported involvement in decisions about refrigeration system design for grocery stores in the Pacific Northwest. Eleven firms reported involvement in refrigeration system installation decisions and all of the contractors reported involvement in maintenance decisions. However, the involvement of some contractors in design decisions was qualified by further comments. For example, a contractor who reported 90% of his grocery store work was for national chain stores said he does not design many systems because the national chains typically have their own, pre-existing specifications. Another contractor said he is involved in refrigeration-system design only for convenience stores, which comprise just 5% of his grocery store work. A third contractor said he does no custom design work for the convenience stores that comprise 20% of his grocery store work, while he reported having input on refrigeration system design, but no decision-making authority for independent chains that comprise 30% of his work.
Of the 11 contractors who said they design grocery store refrigeration systems, 10 reported designing refrigeration compressor racks.21 Estimates of the number of stores for which the contractors’ firms designed refrigeration racks over the past two years ranged from six to thousands (Table D-5).
Table D-4 REFRIGERATION RACK DESIGN: NUMBER OF STORES
NUMBER OF STORES FOR WHICH CONTRACTOR DESIGNED REFRIGERATION
RACKS IN PAST TWO YEARS
NUMBER PERCENT (n=12)
None 2 17%
1 to 20 3 25%
21 to 40 4 33%
>41* 1 8%
Don’t Know/No Response 2 17%
* This contractor reported his firm designs refrigeration racks for thousands of stores.
21 Systems can range from one or two compressors serving individual walk-in coolers in a convenience store to
several multiplexed racks of compressors, located in a machine room in the back of the store and serving several display cases and coolers in a supermarket.
Appendix D
MPER: BETTERBRICKS SMART MARKETS PROGRAM PAGE 7
Estimates of the average number of racks per store ranged from one (for remodels) to five (Table D-5). Excluding the single response referencing remodel work, the estimates for the average number of racks per store ranged from two to five.
Table D-5 REFRIGERATION RACK DESIGN: NUMBER OF RACKS PER STORE
AVERAGE NUMBER OF RACKS PER STORE
NUMBER PERCENT (n=10)
1 1 10%
2 to 3 5 50%
4 to 5 1 10%
Other* 1 10%
Don’t Know/No Response 2 20%
* Contractor said the average is usually either 2 or 5 racks per store.
Eleven contractors install refrigerated display cases. Those contractors gave estimates ranging from five to hundreds for the number of stores in which they installed such cases during that time (Table D-6).
Table D-6 REFRIGERATION CASE INSTALLATION: NUMBER OF STORES
NUMBER OF STORES IN WHICH CONTRACTOR INSTALLED CASES IN
PAST TWO YEARS
NUMBER PERCENT (n=12)
None 1 8%
1 to 20 3 25%
21 to 40 4 33%
41 to 50 2 17%
>50 2 17%
Appendix D
MPER: BETTERBRICKS SMART MARKETS PROGRAM PAGE D - 8
Estimates by the contractors for the average number of cases installed per store ranged from one to more than 100 (Table D-7). The two contractors who gave the highest estimates, both of whom estimated the installation of as many as 120 cases in a single store during the past two years, further distinguished their responses. One of them said the range for new stores in which he worked was 100 to 120, but the range for remodeled stores was 25 to 75 cases per store. The other contractor gave an estimate of 3 to 120 for the number of cases he installed per store, but mentioned the average for independent chain store installations was 10 to 12 cases per store.
Table D-7 REFRIGERATION CASE INSTALLATION: NUMBER OF CASES PER STORE
AVERAGE NUMBER OF CASESS PER STORE
NUMBER PERCENT (n=11)
1 to 50 4 36%
51 to 100 6 55%
Don’t Know 1 9%
Grocery store refrigeration systems are maintained by all of the interviewed contractors or their firms. The number of stores in which the contractors maintain refrigeration systems ranges from 12 to 400 (Table D-8). Two of the contractors subdivided their responses, mentioning the number of independent chain stores in which they maintain refrigeration systems. For one of those contractors, independent chain stores comprise 20% (30 of 150) of his grocery refrigeration maintenance customers. Independent chain stores are 15% (3 of 20) of such customers for the other contractor.
Appendix D
MPER: BETTERBRICKS SMART MARKETS PROGRAM PAGE 9
Table D-8 REFRIGERATION SYSTEM MAINTENANCE: NUMBER OF STORES
NUMBER OF STORES MAINTAINED IN PAST TWO YEARS
NUMBER PERCENT (n=12)
1 to 20 3 25%
21 to 40 2 17%
41 to 60 2 17%
>100 5 42%
One half (6) of the contractors reported from 51% to 75% of the refrigeration cases upon which they work have rack systems rather than individual compressors (Table D-9). All but one of the remaining contractors said racks are found in more than three-quarters of the refrigeration cases which they maintain. The one remaining contractor said only 17% of the cases upon which he works have racks rather than individual compressors. Earlier, that contractor had reported 90% of the stores in which he works are national chains.
Table D-9 REFRIGERATION SYSTEM MAINTENANCE: PERCENT OF RACK SYSTEMS MAINTAINED
PERCENT OF RACK SYSTEMS MAINTAINED
(VERSUS INDIVIDUAL COMPRESSORS)
NUMBER PERCENT (n=12)
1% to 25% 1 8%
51% to 75% 6 50%
76% to 100% 5 42%
The contractors identified the average age of the grocery refrigeration cases they maintained during the past two years as ranging from 5 to 15 years (Table D-10). Most (7) contractors said the cases they maintain are 6 to 10 years old. Two contractors reported differences in the ages of cases in independent chain stores
Appendix D
MPER: BETTERBRICKS SMART MARKETS PROGRAM PAGE D - 10
compared to the ages of cases in national chain stores. Both responses of these two contractors are included, resulting in the N of 14. Both contractors said the cases they maintain in independent chain stores are older than those they maintain in national chains (roughly twice as old). One of these contractors said the average age of cases in his independent chain stores is 10 to 12 years and the average age of the national chains’ cases is 4 to 6 years. The other contractor said the cases he services in independent chain stores are 15 years old, while those he services in national chains are 8 years old.
Table D-10 AVERAGE AGE OF REFRIGERATED CASES SERVICED
(MULTIPLE RESPONSES ALLOWED)
AVERAGE AGE OF REFRIGERATED CASES SERVICED
NUMBER PERCENT (n=14)
1 to 5 Years 3 21%
6 to 10 Years 6 43%
11 to 15 Years 4 29%
Don’t Know 1 7%
Total 14 100%
Contractors also reported the average age of the refrigerated-display-case components of the grocery refrigeration systems they maintain, estimating a range of new to 25 years (Table D-11).22 Two-thirds (9 of 13) of them gave a range of new to 10 years. Excluding the single response that referred to new cases, the minimum age given for case components maintained by the contractors was 5 years. One contractor (the multiple response) distinguished between the ages of case components in independent chain stores he services and those in national chains, saying case components in the former are 15 to 20 years old, while those in cases in national chain stores are 5 to 6 years old.
22 Case components include motors, evaporators (heat exchangers), expansion valves, anti-sweat heaters,
controls and lighting equipment.
Appendix D
MPER: BETTERBRICKS SMART MARKETS PROGRAM PAGE 11
Table D-11 AVERAGE AGE OF REFRIGERATED CASE COMPONENTS
(MULTIPLE RESPONSES ALLOWED)
AVERAGE AGE OF CASES NUMBER PERCENT (n=13)
New to 10 Years 9 69%
11 to 15 Years 1 8%
>15 Years 2 15%
Don’t Know 1 8%
Total 13 100%
Contractors’ scheduled services for setting and recalibrating checkpoints on the refrigeration systems they maintain ranged from monthly to every two years (Table D-12).
Table D-12 FREQUENCY OF SET-POINT CHECKING AND RECALIBRATION
(MULTIPLE RESPONSES ALLOWED)
FREQUENCY OF SET POINT CHECKING AND RECALIBRATION
NUMBER PERCENT (n=13)
Ongoing 1 8%
Monthly 1 8%
Quarterly 3 23%
Semi-Annually 2 15%
Annually 1 8%
Biennially 1 8%
As Needed 4 31%
Total 13 100%
Appendix D
MPER: BETTERBRICKS SMART MARKETS PROGRAM PAGE D - 12
The most common service intervals were quarterly and as needed, each mentioned three times. One of the contractors is counted twice because he approaches independent chain stores differently than national chain stores. He said he services the latter on an as-needed basis, but services independent chain stores every two years. The “Other” responses for the frequency of set-point maintenance were “ongoing” and “it varies.” As an indication of what this latter contractor may have meant when he said “it varies” is that he subsequently said the ideal frequency for such maintenance is “as needed.”
The most commonly mentioned “ideal” frequency for checking and recalibrating set-points was semi-annually, mentioned by five contractors (Table D-13). Three contractors said set-points should never be checked and recalibrated. Two of these three made this statement in regard to electronic controls and one of those two contractors distinguished electronic controls from mechanical controls, saying the latter should be checked and recalibrated semi-annually (the multiple response).
Table D-13 IDEAL FREQUENCY OF SET-POINT CHECKING AND RECALIBRATION
(MULTIPLE RESPONSES ALLOWED)
IDEAL FREQUENCY OF SET POINT CHECKING AND RECALIBRATION
NUMBER PERCENT (n=13)
Never 3 23%
Quarterly 2 15%
Semi-Annually 5 38%
Annually 1 8%
Every 3 Years 1 8%
As Needed 1 8%
Total 13 100%
Contractors’ estimates of the percentage of their grocery store customers who specify the frequency for set-point checking and recalibration ranged from none to 100% (Table D-14). One contractor said both none and 100% (multiple response), adding none of the independent chain stores for whom he works specify a maintenance frequency, while all of his national chain customers specify the
Appendix D
MPER: BETTERBRICKS SMART MARKETS PROGRAM PAGE 13
maintenance frequency. One of the two “Other” contractors echoed this difference between independent and national chains, saying, “Mostly [national] chains have such specifications rather than independents.” The remaining “Other” response was that the frequency of set-point maintenance for the stores in which he works is determined by computer readouts on an ongoing basis.
Table D-14 PERCENT OF CUSTOMERS WHO SPECIFY SET-POINT
MAINTENANCE FREQUENCY (MULTIPLE RESPONSES ALLOWED)
PERCENT OF CUSTOMERS WHO SPECIFY SET-POINT MAINTENANCE FEQUENCY
NUMBER PERCENT (n=13)
None 5 38%
5% to 10% 1 8%
11% to 20% 2 15%
50% 1 8%
100% 1 8%
Other 2 15%
Don’t Know 1 8%
Total 13 100%
Motors
All of the contractors reported familiarity with energy-efficient motors, such as electronically commuted motors (ECMs) or permanent split capacitor fan motors (PSCs). The percentage of refrigeration cases installed by the contractors’ companies over the past two years that included ECM or PSC fan motors ranged from none to 100% (Table D-15). One contractor offered a multiple response to the question about the number of cases installed with energy-efficient motors, distinguishing between independent chain stores and the national chains. He specified a portion of the national chain stores for which he had worked as having installed cases with the energy-efficient motors, but also said he had installed no
Appendix D
MPER: BETTERBRICKS SMART MARKETS PROGRAM PAGE D - 14
cases with these motors in the independent chain stores for which he worked. Another contractor echoed this distinction, saying he had installed cases with energy-efficient motors “primarily for the national chains.”
Table D-15 PERCENT OF REFRIGERATION CASES WITH ECM OR PSC MOTORS
(MULTIPLE RESPONSES ALLOWED)
PERCENTAGE OF REFRIGERATION CASES INSTALLED IN PAST TWO YEARS
WITH ECM OR PSC MOTORS
NUMBER PERCENT (n=13)
None 2 15%
1% to 10% 2 15%
11% to 25% 3 23%
26% to 50% 1 8%
>75% 4 31%
No Response 1 8%
Total 13 100%
Regarding the percentages of cases in which the contractors replaced standard motors with energy-efficient motors during the past two years, two contractors distinguished between independent chain stores and national chains. One of these contractors reported no such replacements for independent stores, while reporting replacement of standard motors in 30% of the cases he serviced in national chain stores. The other one of these two contractors reported energy-efficient motor replacements of standard motors in 10% of the cases in independent stores and 90% of the cases in national chain stores. The most common response, given six times (including a multiple response), was that no standard motors were replaced with ECMs or PSCs during the past two years (Table D-16). The responses indicating the highest portion of such replacements were 75% and 90%, the latter percentage being for national chains’ refrigeration cases, as described previously.
Appendix D
MPER: BETTERBRICKS SMART MARKETS PROGRAM PAGE 15
Table D-16 PERCENT OF REFRIGERATION CASES WHERE STANDARD MOTOR
WAS REPLACEDWITH ECM OR PSC MOTORS (MULTIPLE RESPONSES ALLOWED)
PERCENT OF CASES WHERE STANDARD MOTOR WAS REPLACED WITH ECM OR
PSC MOTOR
NUMBER PERCENT (n=14)
None 6 43%
1% to 5% 2 14%
10% to 35% 4 29%
>50% 2 14%
Total 14 100%
Anecdotally, energy-efficient motors are problematic in two ways: they have a high failure rate and they are not always available when needed. At least four contractors made unsolicited comments about one or both of these problems.
Regarding the unreliability of the energy-efficient motors, contractors volunteered comments about the motors’ inability to withstand moisture, an unavoidable condition in refrigeration cases. One contractor said he had replaced 50% of the energy-efficient motors he has installed during the past two years, adding, “They won’t take water. The boards short out. An ECM won’t last a year in a produce case.”
Another contractor said, “We try to avoid replacing [standard motors with energy-efficient motors] because of high failure rate of the [energy-efficient] motors. They don't tolerate water and don't work well in low temperature applications.”
One contractor mentioned that a new energy-efficient and moisture-resistant motor has recently come onto the market, but added that it is not yet widely enough used to know how well it will perform in refrigeration cases.
The second problem with energy-efficient motors is their lack of availability when needed. One contractor said, “These motors aren't stocked, so [service providers] will often put in a standard motor, at least temporarily. You can't keep one of everything on your truck.”
Appendix D
MPER: BETTERBRICKS SMART MARKETS PROGRAM PAGE D - 16
Another contractor said, “Parts houses don't have those motors in stock. To install [an energy-efficient] motor, we would have to return with additional labor charges and a more expensive motor.”
Other Efficiency Measures
Eight of the 11 contractors who install grocery refrigeration cases reported providing anti-sweat heater controls on the refrigeration cases they install. However, one of the three contractors who said they do not provide such controls said, “[This is] done by the original equipment manufacturer.” Estimates of the percentage of cases they installed in the past two-years which used these controls ranged from 20% to 100% among the eight contractors who said they provide anti-sweat heater controls (Table D-17). Three of these eight indicated they do this only for the national chain stores in which they work.
Table D-17 PERCENT OF CASES WITH ANTI-SWEAT HEATER CONTROLS
PERCENT NUMBER PERCENT (n=11)
0% 3 27%
20% 1 9%
50% 1 9%
80% or More 6 54%
Six of the 11 contractors who install refrigeration cases reported providing T-8 lighting with electronic ballasts in the refrigeration cases they install (Table D-18). However, three of the remaining five said they provide cases as equipped by the manufacturer, with one of these three contractors adding, “All cases come with these.” This contractor was therefore included in the six contractors who responded affirmatively and also included in the “100%” category. Of these six contractors, one estimated such lighting equipment is provided in 50% of the cases he installs, another estimated it is in 95% of his installed cases, and the remaining four said all of their cases include T-8 lighting with electronic ballasts.
Appendix D
MPER: BETTERBRICKS SMART MARKETS PROGRAM PAGE 17
Table D-18 PERCENT OF CASES WITH T-8 LIGHTING & ELECTRONIC BALLASTS
PERCENT NUMBER PERCENT (n=11)
0 5 45%
50% 1 9%
95% to100% 5 45%
Don’t Know 1 9%
Five of the 10 contractors who design and install refrigeration systems reported including proprietary energy efficiency technology in the cases and systems they install. Estimates of the portion of their new cases installed during the past two years that included their proprietary technology ranged from 5% to 100% (Table D-19). Estimates of the portion of new racks designed and installed over the last two years that used proprietary energy efficiency technology ranged from none to 100%, while estimates of the portion of new condensers designed and installed during that time using their proprietary energy efficiency technology ranged from none to 90%.
Table D-19 PROPRIETARY ENERGY EFFICIENCY TECHNOLOGY
PROPRIETARY ENERGY EFFICIENCY TECHNOLOGY
NUMBER PERCENT (n=10)
PERCENTAGE OF NEW CASES USING PROPRIETARY ENERGY EFFICIENCY TECHNOLOGY
Never 5 50%
1% to 20% 2 20%
50% 1 10%
100% 2 20%
Continued
Appendix D
MPER: BETTERBRICKS SMART MARKETS PROGRAM PAGE D - 18
PROPRIETARY ENERGY EFFICIENCY TECHNOLOGY
NUMBER PERCENT (n=10)
PERCENTAGE OF NEW RACKS USING PROPRIETARY ENERGY EFFICIENCY TECHNOLOGY
Never 5 50%
None 1 10%
20% 1 10%
50% 2 20%
100% 1 10%
PERCENTAGE OF NEW CONDENSERS USING PROPRIETARY ENERGY EFFICIENCY TECHNOLOGY
Never 5 50%
None 1 10%
1% to 25% 1 10%
50% 2 20%
76% to 100% 1 10%
Eight of the nine contractors whose firms design grocery refrigeration racks said they install floating head controls on refrigeration racks. Estimates by these contractors of the percentages of their racks installed during the past two years with such controls ranged from 5% to 100% (Table D-20). One contractor did not provide an estimate. In addition, one of the contractors who said he does not install floating head controls said the racks used by one of the “major chains” for whom he works include floating head controls which were installed by the rack manufacturer.
Appendix D
MPER: BETTERBRICKS SMART MARKETS PROGRAM PAGE 19
Table D-20 PERCENT OF RACKS WITH FLOATING HEAD CONTROLS
PERCENTAGE OF RACKS WITH FLOATING HEAD CONTROLS
NUMBER PERCENT (n=9)
0% 1 11%
5% 1 11%
50% 2 22%
85% to100% 4 44%
No Response 1 11%
Six of the nine contractors whose firms design grocery refrigeration racks said they installed floating suction controls on refrigeration racks during the past two years. One of the remaining three contractors said he did not know whether his firm had installed such controls. Estimates of the percentages of racks with such controls ranged from less than 10% to 100% (Table D-21). As with the floating head controls, one of the contractors who does not install floating suction controls said the racks used by one of the “major chains” for whom he works include floating suction controls installed by the rack manufacturer.
Table D-21 PERCENT OF RACKS WITH FLOATING SUCTION CONTROLS
PERCENT NUMBER PERCENT (n=9)
0% 3 33%
<10% 1 11%
50% 2 22%
80% to 100% 3 33%
Appendix D
MPER: BETTERBRICKS SMART MARKETS PROGRAM PAGE D - 20
Five of the 12 contractors said their firms design heating, ventilation and air conditioning (HVAC) systems for grocery stores. Of these five, three were able to provide estimates of the number of these systems their firms had designed in the past two years. These three contractors reported their firms had designed zero, five and twelve grocery-store HVAC systems.
Nine of the twelve contractors reported familiarity with the term commissioning for refrigeration or HVAC systems. Seven of these nine said they have at some time commissioned a new refrigeration system that was designed and installed by their firm (Table D-22).
Table D-22 COMMISSIONING
COMMISSIONING ATTRIBUTE NUMBER PERCENT (n=12)
PERCENTAGE OF OWN SYSTEMS COMMISSIONED
None 5 42%
10% 1 8%
100% 5 42%
Don’t Know 1 8%
NUMBER OF OTHER CONTRACTORS’ SYSTEMS COMMISSIONED
None 7 58%
4 to 15 3 25%
50 1 8%
No Response 1 8%
NUMBER OF RETRO-COMMISSIONED SYSTEMS
None 4 33%
1-10 1 8%
11-20 2 17%
21-30 2 17%
Appendix D
MPER: BETTERBRICKS SMART MARKETS PROGRAM PAGE 21
>100 1 8%
Don’t Know 2 17%
One of these seven reported that during the past two years, he had commissioned 10% of the grocery refrigeration systems designed and installed by his firm. Five of these seven reported they had commissioned all of their firms’ systems during that time. The remaining contractor was unable to estimate a percentage for commissioning.
Five of the nine contractors, who were familiar with commissioning, reported having at some time commissioned a new grocery refrigeration system that was designed and installed by another contractor. The number of such systems commissioned during the past two years by these contractors ranged from four to fifty. The contractor, who reported commissioning fifty systems, added they were “almost all in national chain stores.” One of these five contractors did not report the number of such systems commissioned by his firm.
Eight of the nine contractors who were familiar with commissioning reported having retro-commissioned or re-commissioned an existing grocery refrigeration system. Estimates for the number of commissioning projects during the past two years ranged from 4 to 125. A contractor who reported 30 retro-commissioning projects during the past two years added that only two of them were done for independent chain stores.
Three of the nine contractors who were familiar with commissioning reported having at some time commissioned a grocery HVAC system.
Independent Chain Stores Compared with Other Categories of Grocery Stores
Our first three or four interviews with refrigeration contractors revealed significant differences in the work they do for the different types of grocery stores. Based upon those interview results, we added questions to the survey instrument specifically inquiring about the amount of work done for each of the grocery store types and about differences in the work done for the three types of stores. Each of the contractors already interviewed was re-interviewed to obtain responses to the additional questions. Furthermore, throughout the interviews, we probed for differences in work done for the different types of stores, thus, generating many of the comments presented in the preceding discussion. Perhaps the most noteworthy of those differences are:
Appendix D
MPER: BETTERBRICKS SMART MARKETS PROGRAM PAGE D - 22
The relative portions of work done for each of the three grocery store types (more for independent chain stores than for convenience stores, and more for the national chains than for either of the other two store types),
The age of refrigeration cases maintained in independent chain stores compared to the age of those maintained in national chains (roughly twice as old ).
Independent stores appear less likely than national chain stores to have energy-efficient motors or anti-sweat heater controls installed in their refrigeration cases.
In addition, in response to being asked directly whether the work they do for independent chain stores is different from the work they do for convenience stores or national chains, seven of the eight responding contractors said “yes.” When asked how the work differed, the following explanations were offered:
Regarding the establishment of equipment standards for stores, one contractor distinguished the effects of the different organizational structures of national chains compared to independent chains. The [national] ones have specifications on equipment and project management, [while the] wholesalers help bring clarity and consistency to the independent chains.”
“We can work with the store development folks with independents, but with [national] chains we have less discretion and input.”
“We don't do the same level of service on the independents because they can't afford it.”
“[Independents are] more likely than [national] chain stores to incorporate energy-efficient refrigeration technology.”
“We are more likely to do the design and sell the equipment for independent chain stores; we usually only do installations and maintenance for [national] chains.”
“Regional independents tend to go upscale or sell natural foods because they can't compete price-wise with big chains. The display and refrigeration [are different] for these stores. Independents are all about presentation rather than volume [large ‘coffin’ cases]. Refrigeration is more critical for blemished produce not grown with pesticides. Vertical merchandising is more important with smaller stores. This creates greater
Appendix D
MPER: BETTERBRICKS SMART MARKETS PROGRAM PAGE 23
refrigeration load. Independents don't have room for machine rooms so will go with rooftop [less efficient] package units.”
“Independents only want cheap. They're buying used stuff. Energy costs aren't an issue for them.”
These and the foregoing comments reveal significant differences between the categories of grocery stores, particularly between independent chains and national chains, in regard to the kinds of work the contractors were able to do for them and the kinds of equipment the contractors were able to install for them. On the one hand, the comments suggest refrigeration contractors have a greater say in the design, installation and maintenance decisions for refrigeration systems in independent chain stores than they do for the same decisions in national chains or in convenience stores. On the other hand, the comments indicate the influence of the refrigeration contractors on independent-chain-store decisions is limited by those stores’ smaller budgets, by their smaller size relative to the national chain stores and by the independent chain stores’ needs to maximize the use of their floor space.
Appendix D
MPER: BETTERBRICKS SMART MARKETS PROGRAM PAGE D - 24
MPER: BETTERBRICKS SMART MARKETS PROGRAM
APPENDIX E
Supporting Information for the ACE Model Analysis
Appendix E
MPER: BETTERBRICKS SMART MARKETS PROGRAM
MPER: BETTERBRICKS SMART MARKETS PROGRAM PAGE E - 1
SUPPORTING INFORMATION FOR THE ACE MODEL ANALYSIS
The building operations analysis listed the percentage of affected existing buildings (Table E-1).
Table E-1 MARKET SIZE: ADJUSTED MARKET SIZE AND BASELINE ENERGY EFFICIENCY FOR NEW CHAIN GROCERIES*
YEAR TOTAL SQUARE FEET OF NEW CONSTRUCTION
PERCENT SQUARE FOOTAGE THAT IS ENERGY-EFFICIENT
2005 1,003,762 5.0%
2006 905,129 6.1%
2007 904,167 9.4%
2008 854,379 11.8%
2009 951,095 12.9%
2010 950,152 15.9%
2011 802,717 23.6%
2012 801,786 30.1%
2013 849,694 34.1%
2014 848,775 41.3%
2015 847,863 50.1%
* Table adapted from ACE Model spreadsheet: CSI Grocery-Design 6-21-05.xls; ‘Long-term Market Saturation’ tab; cells C7:F38.
The building operations model listed the percentage of affected floor space in existing buildings (Table E-2).
Appendix E
MPER: BETTERBRICKS SMART MARKETS PROGRAM PAGE E - 2
Table E-2 MARKET SIZE: GROCERY STORE
OPERATIONS ACTIVITIES*
YEAR PERCENT OF FLOOR SPACE
2005 4.0%
2006 5.0%
2007 8.3%
2008 12.2%
2009 17.1%
2010 23.0%
2011 30.3%
2012 37.4%
2013 44.8%
2014 52.3%
2015 60.1%
* Table adapted from ACE Model spreadsheet: CSI-Grocery-Building-Ops-05.xls; ‘Long-term Market Saturation’ tab; cells C7:F38.
The energy conservation measures or energy efficiency activities undertaken as part of the market transformation program are outlined in Table E-3 and Table E-4.
Appendix E
MPER: BETTERBRICKS SMART MARKETS PROGRAM PAGE E - 3
Table E-3 EFFICIENCY MEASURES: GROCERY STORE DESIGN AND CONSTRUCTION
MEASURE CATEGORY EFFICIENCY MEASURES
Refrigeration • Parallel systems with mechanical sub-cooling • At least four suction groups (including sub-cooling) • Floating head pressure with variable set-point control • Low power condenser selection
HVAC • Central air handler(s) with space heat recovery from refrigeration • Variable speed fan control
Lighting • 1.3 W/SF sales area lighting power density • Skylights with stepped light level control • Display case light controls
Fixtures • Efficient display case fan motors • Modulating anti-sweat heater control
Walk-ins • Efficient fan motors
Table E-4 EFFICIENCY MEASURES: GROCERY STORE OPERATIONS
MEASURE CATEGORY EFFICIENCY MEASURES
Benchmark Energy Consumption and Track Performance
• Portfolio energy performance analysis • Whole building energy use analysis and tracking • Building component performance measurement and tracking
Enhanced O&M Practices
• Improved efficiency of periodic replacements; e.g., extended surface area filters
• Refrigeration system maintenance; charge, oil and air-flow measurement • Preventive maintenance tracking and scheduling • Enhanced O&M service contract provisions • Training for facilities operations staff
Energy Tune-Up • Controls; e.g., case defrost, lighting level reset during stocking hours, etc. • Enhanced repair/replacement; e.g., efficient evaporator fans; case lighting • Refrigeration system optimization; e.g., unloading/ sequencing control
optimization • Repairs; e.g., walk-in cooler door seals; refrigeration leaks
Appendix E
MPER: BETTERBRICKS SMART MARKETS PROGRAM PAGE E - 4
.
.
MPER: BETTERBRICKS SMART MARKETS PROGRAM
APPENDIX F
Data Collection Instruments
Appendix F
MPER: BETTERBRICKS SMART MARKETS PROGRAM
MPER: BETTERBRICKS SMART MARKETS PROGRAM PAGE F - 1
GROCERY STORE MARKET SEGMENT: CORPORATE FACILITY LEADER SURVEY
RESEARCH QUESTIONS GROCERY STORE MARKET SEGMENT
ASSUMPTIONS RESEARCH QUESTIONS SURVEYTBD
GROCERY STORE MANAGERS
Leverage is gained by working with a chain or wholesaler to gain support to implement energy management practices at the store level.
Do grocery store managers have a connection to main office of chain? What experience of support has there been for energy management from main office of chain? What is the perception of difficulties in implementing cost-effective upgrades?
Corporate support is needed to fully realize the benefits of energy planning.
Has there been formal approval of an energy management plan? Is energy a line item reviewed by financial managers? Is it considered in annual performance reviews?
Energy should be considered a predictable and controllable part of business and energy planning should be a standard business practice.
Is there an energy management plan in place? Are there specifications for maintenance of energy using equipment: lighting, refrigeration, HVAC? Is there an inventory of energy using equipment?
Sales improve when a store is well lit, refrigeration systems are properly controlled and products are properly displayed.
Are corporate facility leads aware of the benefits of improved store lighting, benefits of improved case lighting, or of anti-sweat devices?
Energy performance should be monitored and tracked and performance targets set.
Awareness and use of energy accounting software, benchmarking. Are performance targets set for reduction in energy-related operating costs over set time period?
Once aware of specific concepts and services, the corporate facility lead will begin to use them.
Awareness of specific concepts: Building Operator Certification, commissioning (retro-commissioning), BetterBricks (other tools)?
Characteristics Characteristics: size, age of store and number of stores, plans for remodel, renovation or new construction.
Appendix F
MPER: BETTERBRICKS SMART MARKETS PROGRAM PAGE F - 2
TARGET
Corporate Facility Mangers (or other corporate contact with relevant responsibilities – those in making key equipment replacement decisions or who review the cost/benefit or other features of major purchases)
These are the primary target contact for outreach
QUESTIONS FOR CORPORATE FACILITY MANAGER
Date
Name of Store
Name of Contact
Title/Position
Phone Number
Introductory Statement
May I speak to .
My name is , with Research Into Action in Portland, Oregon; I am conducting research for the Northwest electric utilities. I would like to ask you some questions about the use of energy in grocery stores. My questions will take about 20-30 minutes. Can we schedule a good time to talk?
A. Are you currently the person responsible for decisions about facility operations and management for grocery stores in your corporation?
1 Yes, facility Operations and Management
2 No
Appendix F
MPER: BETTERBRICKS SMART MARKETS PROGRAM PAGE F - 3
If A = 2 (No): Could you tell me the name of the person responsible for decisions about facility operations and management activities for your corporation?
Name
Phone number or location
If A = 1, continue.
If A = 2, terminate and thank them for their time.
Thank you for taking time to talk with me today. These questions should take about 20 minutes.
I’d like to begin by asking you about your responsibilities. Thinking about the local stores in your corporation, do you have primary responsibility for any of the following? (Read list and check all that apply)
1. Facility operations at local stores (equipment operations)? Y N
If Yes, Skip to 3.
2. If No: Who does have this responsibility?
3. Facility maintenance at local stores (making sure things work) ? Y N
If Yes, Skip to 5.
4. If No: Who does have this responsibility?
5. New construction management for new local stores? Y N
If Yes, Skip to 7.
Appendix F
MPER: BETTERBRICKS SMART MARKETS PROGRAM PAGE F - 4
6. If No: Who does have this responsibility?
7. Remodels and renovations management for existing local stores? Y N
If Yes, Skip to 9.
8. If No: Who does have this responsibility?
Does your company have company employees responsible for any of the following equipment or activities at local stores?
9. HVAC (heating, ventilation & air conditioning) systems? Y N DK
10. Electrical systems? Y N DK
11. Refrigeration Equipment? Y N DK
12. Energy management? Y N DK
Do you have maintenance service contracts for:
13. HVAC systems at local stores? Y N DK
14. Electrical systems at local stores? Y N DK
15. Refrigeration Equipment at local stores? Y N DK
16. Energy management at local stores? Y N DK
17. Do you have specific instructions for energy efficiency for any of these service contracts? Y N
Appendix F
MPER: BETTERBRICKS SMART MARKETS PROGRAM PAGE F - 5
If No, Skip to 21.
18. If Yes: Which ones (open ended)?
19. Not used
20. Not used
21. Within the last two years, have you or someone in your company main office made a formal request to local stores to reduce energy costs? Y N DK
If No or DK, Skip to 24.
22. If Yes: When was that and what did the request specifically ask the stores to do?
23. If Yes: Using a scale of 1–5, where 1 is very low and 5 is very high, What is the level of commitment from the CEO or COO in your company to encourage energy management in local stores? 1 2 3 4 5 DK
24. Does your company have any written guidelines for energy decisions (involving fuel choice, energy usage or equipment purchases)? Y N DK
If Yes to 24 ask 24a.
24a. How active a role did you have in developing the guidelines? None at all A minor role Participated in a team Was the lead for their development
25. Do you have energy performance targets for the local stores? Y N DK
Appendix F
MPER: BETTERBRICKS SMART MARKETS PROGRAM PAGE F - 6
If No or DK, Skip to 28.
26. If Yes: Do you regularly review progress towards these targets? Y N DK
27. If Yes: Have your local stores met those targets in the last year? Y N DK
28. Is energy management written into local store staff’s job descriptions? Y N DK
29. Have you ever benchmarked any local store facilities? Y N DK
If No or DK, Skip to 31.
30. If Yes: How many stores and what was the basis for the benchmark (national averages, something else?
31. Do you or someone who reports to you regularly track energy consumption for all local stores by recording use and comparing data to previous usage? Y N DK
If No or DK, Skip to 33.
32. If Yes: About how often is energy consumption data reviewed? Daily Weekly Monthly Quarterly Yearly Don’t know
33. Do you use energy accounting software? Y N DK
Appendix F
MPER: BETTERBRICKS SMART MARKETS PROGRAM PAGE F - 7
If No or DK, Skip to 35.
34. If Yes: What is the name of the software you prefer?
35. Have you reviewed your energy rate schedules and energy contracts in the past 12 months? Y N DK
Energy Management in Existing Buildings
What percent do your local stores have control systems on the following systems?
36. Refrigeration system
37. HVAC system
38. In-store lighting
39. Parking lot lighting
I’m going to read you a list of energy practices. For each one, please estimate the percent of your local stores that have implemented the practice.
40. Facility energy audits or assessments
41. T-8 lighting with electronic ballasts
42. Control of parking lot lighting with timer or photocell
43. Programs to shut off or reduce the lights for night stocking
44. Anti-sweat controls on doors for freezer cases and/or cooler cases
Appendix F
MPER: BETTERBRICKS SMART MARKETS PROGRAM PAGE F - 8
45. Maintenance program for frozen display case door seals
46. Guidelines for correct loading of cases
47. Electronically commutated fan motor (ECM)
48. Permanent Split Capacitor (PSC) fan motor
49. Double doors (airlock) at customer entrance or receiving door
Purchasing and Procurement Policies
50. Do you have written specifications for purchasing equipment? Y N DK
If No or DK, Skip to 59.
51. If Yes: Do you include a requirement for energy efficiency in the specifications? Y N DK
If Yes: What equipment in particular has an energy efficiency specification?
52. Lighting? Y N DK
53. Refrigeration ? Y N DK
54. Food production equipment? Y N DK
55. Motors? Y N DK
56. HVAC? Y N DK
Appendix F
MPER: BETTERBRICKS SMART MARKETS PROGRAM PAGE F - 9
57. Control systems? Y N DK
58. O&M services? Y N DK
59. Do you have new construction or remodel responsibility? Y N DK
60. Do you provide construction design services? Y N DK
61. Are you involved in any of the state grocery store associations or other professional organizations? Y N DK
If No or DK, Skip to 63.
62. If Yes: Which one(s)
63. What kind of education and training related to energy management would be most useful to you or your staff?
64. Have you or any of your staff received training to obtain a Building Operator Certification? Y N DK
If No or DK, Skip to 66.
65. If Yes: Is your Building Operator Certification from the Northwest Energy Efficiency Council (NEEC) or the Idaho Building Operators Association, or is it from some other group? Utility/NEEC/IBOA Don’t Know/Refused Other (Specify)
If Certification is from NEEC or IBOA, Skip to 67.
Appendix F
MPER: BETTERBRICKS SMART MARKETS PROGRAM PAGE F - 10
66. If anything but Certification from NEEC or IBOA: Are you aware of the Building Operators Certification offered by the Northwest Energy Efficiency Council (NEEC) or the Idaho Building Operators Association? Y N DK
Characteristics
67. Have you heard of BetterBricks? Y N DK
68. Have you heard of the BetterBricks Smart Markets Program with the Northwest Energy Efficiency Alliance? Y N DK
69. Have you heard of the term Strategic Energy Management Plan? Y N DK
My last question.
70. What are the three things about your job that make you feel you contribute the most to your organization or make you feel best about yourself professionally?
a.
b.
c.
71. In the future, we may be conducting follow-up interviews, would you be willing to be contacted again? Y N DK
Thank you for your time.
Appendix F
MPER: BETTERBRICKS SMART MARKETS PROGRAM PAGE F - 11
GROCERY STORE MARKET SEGMENT: WHOLESALER PLANNING DEPARTMENT SURVEY
RESEARCH QUESTIONS GROCERY STORE MARKET SEGMENT
ASSUMPTIONS RESEARCH QUESTIONS SURVEYTBD
WHOLESALERS
Leverage is gained by working with a chain or wholesaler to gain support to implement energy management practices at the store level.
What experience of support for energy management from the main office of thewholesaler? What is the perception of difficulties in implementing cost-effective upgrades?
Corporate support is needed to fully realize the benefits of energy planning.
Is there formal approval of an energy management plan?
Energy should be considered a predictable and controllable part of business and energy planning should be a standard business practice.
Is there an energy management plan in place? Are there specifications for purchase of energy using equipment: lighting, refrigeration, HVAC?
Sales improve when a store is well lit, refrigeration systems are properly controlled and products are properly displayed.
Are design planners aware of the benefits of improved store lighting, benefits of improved case lighting, or of anti-sweat devices?
Once aware of specific concepts and services, wholesaler design groups will begin to use them.
Awareness of specific concepts: Building Operator Certification, commissioning (retro-commissioning), daylighting, natural ventilation, BetterBricks (other tools)?
Characteristics Characteristics: size, age of store and number of stores, plans for remodel, renovation or new construction.
TARGET
Wholesaler planning department lead may be involved in equipment purchasing and new construction and remodel design decisions.
Appendix F
MPER: BETTERBRICKS SMART MARKETS PROGRAM PAGE F - 12
QUESTIONS FOR WHOLESALER PLANNING DEPARTMENT LEAD
Date
Name of Store
Name of Contact
Title/Position
Phone Number
Introductory Statement
May I speak to .
My name is , with Research Into Action in Portland, Oregon; I am conducting research for the Northwest electric utilities. I would like to ask you some questions about the use of energy in grocery stores. My questions will take about 20-30 minutes. Can we schedule a good time to talk?
A. Are you currently the person responsible for decisions about new equipment and facility planning and design for grocery stores your company works with?
1. Yes, equipment
2. Yes, facility planning and design
3. No
If A = 3 (No): Could you tell me the name of the person responsible for decisions about new equipment purchases or facility planning and design for your corporation?
Name
Phone number or location
If A = 1 or 2, continue.
If A = 3, terminate and thank them for their time.
Appendix F
MPER: BETTERBRICKS SMART MARKETS PROGRAM PAGE F - 13
Thank you for taking time to talk with me today. These questions should take about 10 minutes.
I’d like to begin by asking you about your responsibilities. Thinking about the local stores served by your corporation, do you have primary responsibility for any of the following? (Read list and check all that apply)
1. Equipment purchasing for local stores your company works with? Y N
2. New construction management for local stores of chains your company works with? Y N
If Yes, Skip to 4.
3. If No: Who does have this responsibility?
4. Remodels and renovations management for existing local stores your company works with? Y N
If Yes, Skip to 6.
5. If No: Who does have this responsibility?
6. Does your company have any written guidelines for energy decisions (involving equipment purchases or planning and design)? Y N DK
7. Do you have energy performance targets when you are doing planning and design of projects? Y N DK
8. Have you ever benchmarked any local store facilities? Y N DK
If No or DK, Skip to 10.
Appendix F
MPER: BETTERBRICKS SMART MARKETS PROGRAM PAGE F - 14
9. If Yes: How many stores and what was the basis for the benchmark (national averages, something else)?
Energy Management
10. How many projects did you provide design and construction services for this past year?
If Zero, Skip to 29.
11. What was the total square footage of those projects?
12. Of those projects you provided design and construction services for this past year, what percentage used double-door vestibules or airlocks at store entrances or receiving doors?
13. In what percentage of the stores were the receiving doors insulated and weather stripped?
14. Did you include any daylighting in projects during the past year? Y N DK
If No or DK, Skip to 18.
15. If Yes: In what percentage of projects in the past year was the use of daylight increased over the store or operating company's previous standard (this would include windows and clearstories as well as skylights)?
16. If Yes: In what percentage of the projects in the past year were skylights used?
17. If Yes: In what percentage of the projects in the past year was daylight harvesting used (control systems to decrease general store lighting when natural lighting is available)?
Appendix F
MPER: BETTERBRICKS SMART MARKETS PROGRAM PAGE F - 15
18. For each type of energy system, I would like to know what percent of the store projects had analog control systems installed in them as compared to microprocessor-based control systems?
Analog Control Microprocessor Control
a. Refrigeration system
b. HVAC system
c. In-store lighting
d. Parking lot lighting
I’m going to read you a list of equipment that you may have purchased in the past year for these projects. For each one, please estimate the percent age of your purchases of lighting that had the following attributes:
19. For overhead lighting what percent of your purchases were for: a. T-12 lamps? b. T-8 lamps?
20. When you purchased ballasts what percent of your purchases were for magnetic as compared to electronic ballasts? a. Magnetic? b. Electric?
21. When you purchased lamps for case and display lighting, what percent of your purchases were for T-5 or T-8 lamps as compared to T-12s? a. T-5 or T-8 lamps? b. T-12 lamps?
Appendix F
MPER: BETTERBRICKS SMART MARKETS PROGRAM PAGE F - 16
The next questions concern HVAC equipment. For each one, please estimate the percent age of your purchases of HVAC equipment that had the following attributes:
22. When you purchased HVAC equipment what percent were for individual roof top units or gas packs and what percent were for large integrated, or built up systems? a. Individual Roof Top Units, or Gas packs? b. Integrated, or built up systems?
23. What percent of the systems had a Variable speed drive on the large motor?
24. What percent of the systems utilized a fully functional economizer mode?
25. What percent used a demand controlled ventilation system (to sense carbon dioxide)?
Now thinking about refrigeration:
26. For the refrigeration systems you purchased, what percent included a heat reclaim system?
27. What percent of the heat reclaim systems were used to heat water and what percent to heat the building? a. Water? b. Building?
28. What percentage of refrigerated cases purchased in the past year included energy efficient fan motors?
Appendix F
MPER: BETTERBRICKS SMART MARKETS PROGRAM PAGE F - 17
Purchasing and Procurement Policies
29. Do you develop specifications for purchasing equipment? Y N DK
If No or DK, Skip to 44.
If Yes: On a scale of 1-5 with 1 being not at all important and 5 being very important, how important is first-cost when purchasing….
30. Lighting? 1 2 3 4 5
31. Refrigeration equipment? 1 2 3 4 5
32. Food production equipment? 1 2 3 4 5
33. Motors? 1 2 3 4 5
34. HVAC? 1 2 3 4 5
35. If Yes: Are you familiar with the term “life-cycle cost” or “total cost of ownership”? Y N DK
If No or DK, Skip to 37.
36. If Yes: To what types of equipment purchases do you apply life-cycle cost or TOC?
37. If Yes: Do you include a requirement for energy efficiency in the equipment purchase specifications? Y N DK
If No or DK, Skip to 44.
Appendix F
MPER: BETTERBRICKS SMART MARKETS PROGRAM PAGE F - 18
If Yes: What equipment in particular has an energy efficiency specification?
38. Lighting? Y N DK
39. Refrigeration ? Y N DK
40. Food production equipment? Y N DK
41. Motors? Y N DK
42. HVAC? Y N DK
43. Control systems? Y N DK
44. Are you involved in any of the state grocery store associations or other professional organizations? Y N DK
If No or DK, Skip to 46.
45. If Yes: Which one(s)
46. What kind of education and training related to energy management would be most useful to you or your staff?
Characteristics
47. Have you heard of BetterBricks? Y N DK
48. Have you heard of the BetterBricks Smart Markets Program with the Northwest Energy Efficiency Alliance? Y N DK
Appendix F
MPER: BETTERBRICKS SMART MARKETS PROGRAM PAGE F - 19
49. Have you heard of the term Strategic Energy Management Plan? Y N DK
50. In the future, we may be conducting follow-up interviews, would you be willing to be contacted again? Y N DK
Thank you for your time.
Appendix F
MPER: BETTERBRICKS SMART MARKETS PROGRAM PAGE F - 20
Appendix F
MPER: BETTERBRICKS SMART MARKETS PROGRAM PAGE F - 21
GROCERY STORE MARKET SEGMENT: GROCERY STORE MANAGER SURVEY
TARGET
Managers of local grocery stores in the 30 targeted organizations.
QUESTIONS FOR GROCERY STORE MANAGERS
Date
Name of Store
Name of Contact
Title/Position
Phone Number
Introductory Statement
May I speak to .
My name is , with Research Into Action in Portland, Oregon; I am conducting research for the Northwest electric utilities. I would like to ask you some questions about the use of energy in grocery stores. My questions will take about 10-15 minutes. Can we schedule a good time to talk?
A. Are you currently the person responsible for decisions about operations and management for this grocery store?
1 Yes, Operations and Management
2 No
Appendix F
MPER: BETTERBRICKS SMART MARKETS PROGRAM PAGE F - 22
If A = 2 (No): Could you tell me the name of the person responsible for decisions about facility operations and management activities for this grocery store (If they direct to a corporate contact note that and check with corporate lists)?
Name
Phone number or location
If A = 1, continue.
If A = 2, terminate and thank them for their time.
Thank you for taking time to talk with me today. These questions should take about 10-15 minutes.
I’d like to begin by asking you about your responsibilities.
1. Do you receive guidance about facility operations from a contact at a corporate or main office or wholesaler’s office, or some other location? Y N DK
If No, Skip to 3.
2. If Yes: Who provides guidance?
3. Has your company main office or wholesaler ever made a formal request to you to reduce energy costs? Y N DK
4. Has your company ever provided any written guidelines to you for decisions involving energy usage or efficiency? Y N DK
5. Have you ever reviewed the energy usage data for your store on your own or with someone from the main office? Y N DK
6. Does your store have energy usage goals? Y N DK
Appendix F
MPER: BETTERBRICKS SMART MARKETS PROGRAM PAGE F - 23
If No or DK, Skip to 9.
7. If Yes: Is the achievement of energy usage goals reviewed every year? More often or Less often? Every Year More often than every year Less Often than every year
8. If Yes: Is there any reward, “bonus,” tied to the achievement of these goals? Y N DK
Energy Management in Existing Buildings
I’m going to read you a list of building practices. For each one, please tell me if you’ve heard of the practice, and if so whether it has been implemented it at this grocery store.
Have you heard about….
9. Facility energy audits or assessments? Y N DK
10. Control of parking lot lighting (timer or photocell)? Y N DK
11. Control programs to shut off or reduce the lights for night stocking? Y N DK
12. Controls on doors for freezers and coolers to reduce sweating? Y N DK
13. Maintenance program for frozen door seals? Y N DK
14. Guidelines for correct loading of cases? Y N DK
15. Double doors (airlock) at customer entrance or receiving door? Y N DK
Appendix F
MPER: BETTERBRICKS SMART MARKETS PROGRAM PAGE F - 24
Have you implemented….
16. Facility energy audits or assessments? Y N DK
17. Control of parking lot lighting (timer or photocell)? Y N DK
18. Control programs to shut off or reduce the lights for night stocking? Y N DK
19. Controls on doors for freezers and coolers to reduce sweating? Y N DK
20. Maintenance program for frozen door seals? Y N DK
21. Guidelines for correct loading of cases? Y N DK
22. Double doors (airlock) at customer entrance or receiving door? Y N DK
Purchasing and Procurement Policies
23. Do you purchase lighting or refrigeration equipment for your store? Y N DK
If No or DK, Skip to 26.
24. If Yes: Do you have specifications or policies to follow when you purchase lighting whole equipment or parts that include a requirement on energy efficiency? Y N DK
25. If Yes: Do you have specifications or policies to follow when you purchase refrigeration whole equipment or parts that include a requirement on energy efficiency? Y N DK
Appendix F
MPER: BETTERBRICKS SMART MARKETS PROGRAM PAGE F - 25
26. Are you or others in your store involved in any of the state grocery store associations or other professional organizations? Y N DK
If No or DK, Skip to 28.
27. If Yes: Which one(s)
28. Off the top of your head, are there any training topics in the area of energy management in facility operations and maintenance that come to mind as potentially useful for you or your staff?
29. Have you or any of your staff received certification from training in any area of building operations and maintenance? Y N DK
If No or DK, Skip to 32.
30. If Yes: Have you or any of your staff received a Building Operator Certification? Y N DK
If No or DK, Skip to 32.
31. If Yes: Is your Building Operator Certification from the Northwest Energy Efficiency Council (NEEC) or the Idaho Building Operators Association, or is it from some other group? Utility/NEEC/IBOA Don’t Know/Refused Other (Specify)
If Certification is from NEEC or IBOA, Skip to 33.
32. If anything but Certification from NEEC or IBOA: Are you aware of the Building Operators Certification offered by the Northwest Energy Efficiency Council (NEEC) or the Idaho Building Operators Association? Y N DK
Appendix F
MPER: BETTERBRICKS SMART MARKETS PROGRAM PAGE F - 26
Characteristics
My last question.
33. What are the three things about your job that make you feel you contribute the most to your organization or make you feel best about yourself professionally?
a.
b.
c.
34. In the future, we may be conducting follow-up interviews, would you be willing to be contacted again? Y N DK
Thank you for your time.
Appendix F
MPER: BETTERBRICKS SMART MARKETS PROGRAM PAGE F - 27
GROCERY STORE MARKET SEGMENT: REFRIGERATION TRADE ALLY SURVEY
RESEARCH QUESTIONS GROCERY STORE MARKET SEGMENT
ASSUMPTIONS RESEARCH QUESTIONS SURVEYTBD
TRADE ALLIES
Trade allies are aware of efficient refrigeration solutions.
Knowledge of specific practices: high efficiency refrigerator cases with ECM and PSC motors; anti-sweat heater controls; efficient case lighting (other tolls)?
10-13, 16,18, 30
Trade allies provide efficient refrigeration solutions
Experience implementing specific practices: high efficiency refrigerator cases with ECM and PSC motors; anti-sweat heater controls; efficient case lighting (other tools)?
14-15, 17, 19, 25, 27, 31-37
Trade allies promote efficient refrigeration solutions to their clients
Do trade allies offer new technologies as part of the systems they sell?
20-23, 24, 26,
Characteristics Characteristics: size of firm, location of firm, number of skilled staff
1-9; 28-29, 38-39, 40-44
TARGET
Owners or supervisors for refrigeration contractors.
Appendix F
MPER: BETTERBRICKS SMART MARKETS PROGRAM PAGE F - 28
QUESTIONS FOR REFRIGERATION TRADE ALLIES
Date
Name of Company
Name of Contact
Title/Position
Phone Number
Introductory Statement
May I speak to .
My name is , with Research Into Action in Portland, Oregon; I am conducting research for the Northwest electric utilities. I would like to ask you some questions about the use of energy in grocery stores. My questions will take about 15-20 minutes. Can we schedule a good time to talk?
A. Are you currently the person responsible for decisions about refrigeration system design for grocery stores in the Pacific Northwest?
1. Yes, equipment design
2. No
If A = 2 (No): Could you tell me the name of the person responsible for these decisions?
Name
Phone number or location
If A = 1, continue.
Appendix F
MPER: BETTERBRICKS SMART MARKETS PROGRAM PAGE F - 29
How about installation and maintenance for grocery stores in the Pacific Northwest grocery stores in the Pacific Northwest?
1. Yes, equipment installation
2. Yes, maintenance
3. No
If A = 3 (No): Could you tell me the name of the person responsible for these decisions?
Name
Phone number or location
If A = 1 or 2, continue.
If A = 3, terminate and thank them for their time.
Thank you for taking time to talk with me today. These questions should take about 15 minutes.
The first question concerns refrigeration services you provide to grocery stores.
1. Does your firm design refrigeration racks? Y N DK
If No or DK, Skip to 4.
2. If Yes: Can you estimate the number of stores for which your company designed refrigeration racks over the past two years?
3. If Yes: What would you estimate is an average number of racks per store?
4. Does your firm install refrigeration cases? Y N DK
Appendix F
MPER: BETTERBRICKS SMART MARKETS PROGRAM PAGE F - 30
If No or DK, Skip to 7.
5. If Yes: Can you estimate the number of stores for which your company installed refrigeration cases in the past two years?
6. If Yes: What would you estimate is an average number of cases per store?
7. Does your firm maintain refrigeration systems? Y N DK
If No or DK, Skip to 15.
8. If Yes: What would you estimate is the current number of grocery stores in which your company maintains refrigeration systems?
9. If Yes: What portion (percentage) of these cases is refrigerated by rack systems (verses individual compressors)?
10. If Yes: What is the average age of the refrigeration cases your company maintained in the past two years?
11. If Yes: What is the average age of the other components (not cases) of the refrigeration systems you maintained?
12. If Yes: How frequently are set points checked and recalibrated on a typical refrigeration system you maintain?
13. If Yes: What portion (percentage) of companies you service provide you a specified set point checking and recalibration frequency?
14. If Yes: Ideally, how frequently do you feel set points should be checked and recalibrated?
Appendix F
MPER: BETTERBRICKS SMART MARKETS PROGRAM PAGE F - 31
15. Are you familiar with energy-efficient motors such as ECM (electronically commuted motors) or PSC (permanent split capacitor fan motors)? Y N DK
If No or DK, Skip to 18.
16. If Yes: What percentage of refrigeration cases installed by your company over the past two years included ECM or PSC fan motors?
17. If Yes: What percentage of refrigeration cases you maintained in the past two years have replaced a standard fan motor with and ECM or PSC fan motor?
18. Do you provide anti-sweat heater controls on the refrigeration cases you install? Y N Sometimes DK
If No or DK, Skip to 20.
19. If Yes: What percentage of this company's refrigeration cases installed in the past two years use anti-sweat heater controls?
20. Do you provide T-8 lighting with electronic ballasts in the refrigeration cases you install? Y N DK
If No or DK, Skip to 22.
21. If Yes: What percentage of your company's refrigeration cases were provided with energy efficient T-8 lighting with electronic ballasts in the past two years?
22. Do you design and install cases and systems with any proprietary energy efficiency technology? Y N DK
If No or DK, Skip to 26.
Appendix F
MPER: BETTERBRICKS SMART MARKETS PROGRAM PAGE F - 32
23. If Yes: What portion (percentage) of the new cases designed and installed over the past two years used your proprietary energy efficiency technology?
24. If Yes: What portion (percentage) of the new racks designed and installed over the last two years used your proprietary energy efficiency technology?
25. If Yes: What portion (percentage) of the new condensers designed and installed over the last two years used your proprietary energy efficiency technology?
26. Do you install floating head controls on refrigeration racks? Y N DK
If No or DK, Skip to 28.
27. If Yes: What percentage of the refrigeration racks you installed used floating head controls in the past two years?
28. Do you install floating suction controls on refrigeration racks? Y N DK
If No or DK, Skip to 29.
29. If Yes: What percentage of the refrigeration racks you installed used floating suction controls in the past two years?
30. Do you design HVAC systems for grocery stores? Y N DK
If No or DK, Skip to 31.
31. If Yes: Please estimate the number of HVAC systems your company designed in the past two years?
Appendix F
MPER: BETTERBRICKS SMART MARKETS PROGRAM PAGE F - 33
32. Are you familiar with the term commissioning for refrigeration or HVAC systems? Y N DK
If No or DK, Skip to 41.
33. If Yes: Have you ever commissioned a new refrigeration system that you designed and installed?
If No or DK, Skip to 35.
34. If Yes: What portion (percentage) of the systems you installed did you commission in the past two years?
35. If Yes: Have you ever commissioned a new refrigeration system that was designed and installed by another refrigeration contractor?
If No or DK, Skip to 37.
36. If Yes: How many of these systems did you commission in the past two years?
37. If Yes: Have you ever retro-commissioned or re-commissioned a refrigeration system that was already operating in a store?
If No or DK, Skip to 39.
38. If Yes: How many systems have you retro-commissioned over the last two years?
39. If Yes: Have you ever commissioned a new or existing HVAC system?
If No or DK, Skip to 41.
Appendix F
MPER: BETTERBRICKS SMART MARKETS PROGRAM PAGE F - 34
40. If Yes: How many a new or existing HVAC systems have you commissioned over the last two years?
41. Are you active in any trade associations for refrigeration or HVAC? Y N DK
If No or DK, Skip to 43.
42. If Yes: Which one(s)
Characteristics
43. What states do you work in?
44. How many locations do you have?
45. How many employees do you have?
46. How long has your company been offering services for grocery stores?
47. What portion of your work is for grocery stores (as opposed to other types of businesses)?
Thank you for your time.
Appendix F
MPER: BETTERBRICKS SMART MARKETS PROGRAM PAGE F - 35
GROCERY STORE MARKET SEGMENT: PROGRAM STAFF AND MARKET SPECIALIST INTERVIEWQUESTIONS
Date
Name
Company
Roles and Responsibilities
1. What is your role in the program?
2. How long have you had this role?
3. Who are the main people you work with at the Alliance or as contractors to the Alliance and what are their roles?
Planning Period
For this discussion we can divide the Smart Markets initiative into the implementation planning phase and the current transition phase. The planning phase is prior to Board approval in July 2005 and transition phase is the current time period.
4. What was the first activity you participated in for the Smart Markets Program?
5. What type of planning activities have you been involved in?
6. When did the planning activities start?
Appendix F
MPER: BETTERBRICKS SMART MARKETS PROGRAM PAGE F - 36
7. What has been the focus of these activities?
8. What have you learned so far?
9. What outreach or project activities occurred during the planning period?
10. What are they?
11. What has been the result of these activities?
12. What has been done in these projects?
13. What is the expected result?
Goals and Objectives
14. In your own words, what are the goals and objectives of the Smart Markets Program?
15. Do you feel these are achievable (explain—Probe relative to barriers, timelines, specific targets, etc.)?
16. How were these goals and objectives developed?
17. Describe the target groups for the Smart Markets Program and what the objectives/goals are for each?
18. What are the three most likely barriers to accomplishing these goals/objectives?
19. How do you see the initiative overcoming these barriers?
Appendix F
MPER: BETTERBRICKS SMART MARKETS PROGRAM PAGE F - 37
20. If you go to a grocery store today, what do you expect to see?
21. When you go to a grocery store in five years, what do you expect will be different?
22. What are the key messages for the Smart Markets Program?
23. How are you communicating these messages?
Implementation Plans
24. What activities are you expecting to accomplish with independent grocery chains?
25. What have you done so far (number of contacts, types of projects, etc.)?
26. What do you expect to do in the next 12 months?
27. What activities are you expecting to accomplish with wholesalers?
28. What have you done so far(number of contacts, types of projects, etc.)?
29. What do you expect to do in the next 12 months?
30. What activities are you expecting to accomplish with national grocery chains?
31. What have you done so far (number of contacts, types of projects, etc.)?
32. What do you expect to do in the next 12 months?
Appendix F
MPER: BETTERBRICKS SMART MARKETS PROGRAM PAGE F - 38
33. What other organizations or groups are important to the success of your work in the Smart Markets Program?
Program Staff-Specialists Relationships
34. What is your view of the purpose of the market specialist?
35. What is your view of the role of the Alliance staff relative to the market specialist?
36. What have been some of the strengths of having a market specialist for the Smart Markets Program?
37. What are some of the challenges of having a market specialist for the Smart Markets Program?
38. For Staff: What has been the greatest challenge for you relative to the market specialist to date?
39. What type of challenges do you anticipate in the future?
40. For Specialist: What has been the greatest challenge for you relative to Alliance staff to date?
41. What type of challenges do you anticipate in the future?
CSI Services
42. What tools and resources have you developed/are you using?
43. What additional tools and resources would you like to have?
Appendix F
MPER: BETTERBRICKS SMART MARKETS PROGRAM PAGE F - 39
44. Have you worked with the marketing and communications group at the Alliance?
45. What has been your experience with this group and how have they worked for the grocery market segment?
46. What type of materials, if any, would be useful to your efforts?
47. Have you worked with the BetterBricks Advising Services team (daylighting labs, integrated design labs, lighting design lab, Training services)?
48. What has been your experience with these services and how have they worked for the grocery market segment?
49. What type of technical services do you feel are needed for the grocery store sector?
50. Are you familiar with NEEC’s Building Operator Certification program?
51. Do you consider the BOC appropriate for people who work in grocery stores?
Closing
52. What do you expect to be the most difficult challenge of the grocery store initiative?
53. What do you expect to be the most successful aspect of the initiative?
54. What would you say is working well about the Smart Markets effort?
55. What do you think most needs to be changed in the Smart Markets Program?
Appendix F
MPER: BETTERBRICKS SMART MARKETS PROGRAM PAGE F - 40