After Paris Agreement: Way forward for Bangladesh Institute of Water and Flood Management (IWFM) Bangladesh University of Engineering and Technology (BUET) A.K.M Saiful Islam National Sharing Workshop On Enhancing Climate Resilience Practice and Governance in partnership between Department of Disaster Science and Management and Department of Public Administration University of Dhaka with Islamic Relief Bangladesh’ during 29-30 October 2016 at Sinate Bhaban, DU Institute of Water and Flood Management (IWFM) Bangladesh University of Engineering and Technology (BUET) https://www.youtube.com/watch?v=ifrHogDujXw
Transcript
After Paris Agreement:Way forward for Bangladesh
Institute of Water and Flood Management (IWFM)Bangladesh University of Engineering and Technology (BUET)
A.K.M Saiful Islam
National Sharing Workshop On Enhancing Climate Resilience Practice and Governance in partnership between Department of Disaster Science and Management and Department of Public AdministrationUniversity of Dhaka with Islamic Relief Bangladesh’ during 29-30 October 2016 at Sinate Bhaban, DU
Institute of Water and Flood Management (IWFM)
Bangladesh University of Engineering and Technology (BUET)
htt
ps:
//w
ww
.yo
utu
be
.co
m/w
atch
?v=i
frH
ogD
ujX
w
CO2 constantly increasing from pre-industrial period (1880) and so does the temperature
Global mean temperatures in July 2016 were the warmest on record not just for July, but for any month dating to the late 1800s, according to four separate newly-released analyses.
Rising temperature causes Melting of Arctic Sea Ice
Images gathered from the Defense Meteorological Satellite Program of NASA show the minimum Arctic sea ice concentration 1979 (left), 2003 (center) and 2012 (right).
Sea level rise is caused primarily by two factors related to global warming: the addedwater from melting land ice and the expansion of sea water as it warms. This chartderived from coastal tide gauge data, shows how much sea level changed from about1870 to 2000.
Pledges made for the Paris agreement on climate change last winter would lead to global temperature rise of 2.6 to 3.1°C by the end of the century,
The Paris Agreement was a historicalachievement for the world's response toclimate change, aiming at limiting warming towell 2°C. furthermore agreed that theyshould strive to limit temperature rise evenfurther, to 1.5°C.
Pledges made for the Paris agreement onclimate change last winter would lead toglobal temperature rise of 2.6 to 3.1°C by theend of the century, according to a newanalysis published in the journal Nature.
The researchers also examined whatadditional measures would be necessaryafter 2030 to limit future temperature rise to2°C or 1.5°C in 2100.
Rogelj et al (2016)
Implications of climate change for Bangladesh
• Bangladesh is one of the most vulnerable countries considering climate change due to its geographic location, high population density, poverty and natural disasters.
• Country is sufferings from a number of natural disasters such as monsoon floods, early pre-monsoon flash floods, heavy rainfall and landslides, cyclones and storm surges, thunderstorms, hail stones, lightening and droughts etc.
• Climate change will pose additional threats to the existing environmental issues of the countries.
Heatwave during6-30 April 2016
A total of 57 people died during 12-13 May 2016 hit by the Lightening
GLD 360 data on 12 May 153,621 strokes detected
GLD 360 data on 13 May 242,570 strokes detected
Farmers are working during thunder stormsWithout any protection
Devastating Flash floods hit the northeast region of Bangladesh during 17-21 April Rubber dam to protect from flash
Flood constructed by LGED
Flash flood and hailstorm has caused extensive damage ato mature and half-mature Boro paddy in haor (large marshy land) areas
Damage of the crops due to Flash flood during April 2016
Meghalaya, Tripura and Barak hilly basins Heavy rainfall during 17-21 April
Cyclone ‘Roanu’ landfalls in Bangladesh on21st May 2016 and killed about 24 people, damage crops, fisheries in the central & southeast coastal regions
Recent Floods in Bangladesh and South Asia
Floods in Pakistan 2016
Floods in Nepal 2016
Floods in India 2016
Floods in Bangladesh 2016 Floods in China 2016
Floods in Bhutan 2016
Global warming will exceed 1.5C by 2025 and 2C by 2040Near surface global annual mean warming since pre-industrial for simulations from CMIP5, CMIP3 and by a HadCM3 perturbed parameter experiments of SRES A1B and the RCPs. Both concentration and emissions driven simulations.
Betts et al. (2011)
50% models
Both observation and predictions indicate constant rise of temperature throughout the century
Increasing trend ranging between 3.24°C to 5.77°C under RCP 8.5
Temperature anomaly based on the observed data of the 24 BMD stations (1971-2015)
Fahad et al. (2016)
Temperature Anomaly (°C) relative to 1861-1880 for 2020s, 2050s and 2080s
Highest increase of temperature in February during 2080s
ranging between 3.6°C and 9.8°C. July, August and September
temperature increase ranging between 0.7° and 4°C.
Fahad et al. (2016)
Change of Precipitation in the 2020s, 2050s and 2080s from 1971-2000
Highest increase in rainfall to be occurred during the pre-monsoon period (i.e. March, April and May) ranging between 125mm–615mm.
Pre-monsoon and Monsoon rain increasing
Winter rain decreasing
Fahad et al. (2016)
Changes of extreme maximum and minimum temperature• It means extremity of temperature would become more prominent from the mid to end of
the 21st Century.
• From distribution of minimum temperature, TNn (minimum of daily minimum temperature) shows a reduction of its extremity in future years.
TXx- maximumof daily maximumtemperature
TNn- minimumof daily minimumtemperature
Hasan et al. (2016)
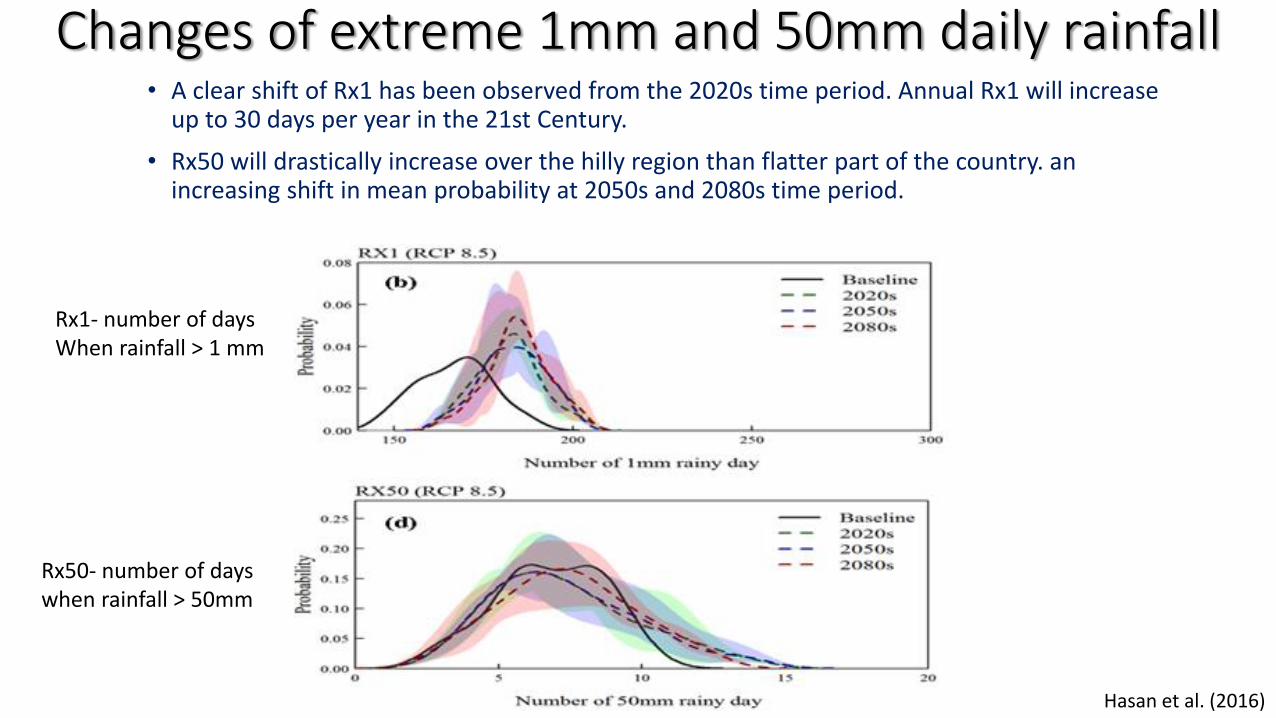
Changes of extreme 1mm and 50mm daily rainfall• A clear shift of Rx1 has been observed from the 2020s time period. Annual Rx1 will increase
up to 30 days per year in the 21st Century.
• Rx50 will drastically increase over the hilly region than flatter part of the country. an increasing shift in mean probability at 2050s and 2080s time period.
Rx1- number of days When rainfall > 1 mm
Rx50- number of dayswhen rainfall > 50mm
Hasan et al. (2016)
Water Resources Impact Assessment:SWAT Modeling for the Brahmaputra basin
• The Brahmaputra is a major transboundary river which drains an area of around 530,000 km2 and crosses four different countries: China (50.5% of total catchment area), India (33.6%), Bangladesh (8.1%) and Bhutan (7.8%) (Gain et al. 2013).
• Average discharge of the Brahmaputra is approximately 20,000 m3/s. The climate of the basin is monsoon driven with a distinct wet season from June to September, which accounts for 60–70% of the annual rainfall (Immerzeel, 2008).
Mohammed et al. (2016)
Changes of flow in terms of percentage (left) and total flow (right)
Monsoon (June-Sep) will be more wetter than present time which will increase chances of floods
Mohammed et al. (2016)
Changes in annual peak flow and low flow
Return
Period
(years)
Change
in Flow
of 2020s
Compar
ed to
Baseline
Period
(%)
Change
in Flow
of 2050s
Compar
ed to
Baseline
Period
(%)
Change
in Flow
of 2080s
Compar
ed to
Baseline
Period
(%)
2 5.96 6.35 14.89
5 7.06 8.17 16.31
10 7.62 10.14 17.18
20 8.07 12.40 17.97
50 8.55 15.74 18.93
100 8.86 18.50 19.61
200 9.15 21.47 20.25
500 9.49 25.71 21.06
Mohammed et al. (2016)
Coastal modeling using Delft3D hydrodynamic model• DELFT3D- FLOW is a multi-dimensional (2D or 3D) hydrodynamic (and transport)
simulation program which calculates unsteady flow and transport phenomena that result from tidal and meteorological forcing on a rectilinear or a curvilinear, boundary fitted grid.
Tazkia et al. (2016)
Inundation map for 1.0m and 0.5m Sea Level Rise (SLR)
Inundation area will be increased under increased with SLR
1.0m SLR0.5m SLR Tazkia et al. (2016)
Changes of Inundation area due SLR
SLRInundated Area
(sq.km)
Percent of total
Bangladesh
Percent of
Coastal Zone
Affected
population
(million)
0.5m 2000 1.6 4.3 2.5
1m 3930 3.8 8.4 6.0.0
1.5m 5300 5.1 11.3 8.0
1m (without
Polder) 8500 8.3 18.0 13
Tazkia et al. (2016)
Inundation statistics for the Sundarbans – the world largest mangrove forest
SLR (m) Inundated Area
(km2)
% of inundation Area
0.5m 491 11.37
1m 1847 42.78
1.5m 2635 61.04
Tazkia et al. (2016)
Changes of the inundation and impact of the coastal cyclones (SIDR, AILA and Roanu) due to SLR
Cyclone SIDR
Nov 15 2007
Calibration and Validation of Model for SIDR, AILA and ROANU at Hiron point and Khepupara.
Suffix a,b,c for SIDR. Suffix d for AILA. Suffix e,f for ROANU.
WL during AILA at Hiron pointWL during SIDR at Khepupara
Shaha et al. (2016)
Changes of inundation patterns or cyclone SIDR (2007), AILA (2009) and Roanu (2016)Conditions
SIDR AILA ROANU
Inundation area
% of Country
Affected Population
Inundation area
% of Country
Affected Population
Inundation area
% of Country
Affected Population
Only cyclone
1484 1.2 1.91999
1.5 2.3 501 0.34 0.54
cyclone and 0.5m SLR
3380 2.6 4.14226
3.3 5.1 2752 2.19 1.77
cyclone and 1m SLR
5777 4.4 7.06216
4.8 7.5 7504 6.30 4.82
cyclone and 1.5m SLR
7588 5.8 9.17497
5.8 9.012432
9.80 7.99
SIDR AILA Roanu
Shaha et al. (2016)
Crop Modeling using DSSAT (Decision Support System for Agro-technology Transfer) • Extreme climate change will
pose threat on various dimensions and Agriculture is one of them.
• About 75% of our agricultural land is rice and it covers 28% of GDP.
Real Name Brridhan29
Height 95 cm
Duration of growth 160 days
Grain quality Medium
Yield (Kg/hectares) 7500
Developed on 1994Hasan et al. (2016)
Change of Rice Yield in the near future (2021-2050)
Hasan et al. (2016)
Change of Rice Yield in the fur future (2070-2099)
Change of Rice Yield in the near future (2070-2099)
Hasan et al. (2016)
Changes of the Yield of Boro rice in Bangladesh in 2030’s (2021-2050) and 2080’s (2070-2099)
The yield of Borocrop trend isgradually decreasingat an alarming rate.
Under highemission RCP 8.5scenarios the meanyield of Boro willdecrease about 10%in 2030’s to 20% in2080’s.Hasan et al. (2016)
Summary of the impact assessment for Bangladesh beyond Paris Agreement (>2C)
• In Bangladesh, both mean maximum and minimum temperature will rise and rainfall will increase slightly. Extreme events (heatwave, extreme on day rainfall etc.) will be more frequent.
• Floods will be more frequent and a 100 year return period flood will have about 8% more discharge than present.
• The 0.5m SLR will inundate additional 4.3% of the coastal areas of the country and 11.37% of Sundarbans area.
• Cyclone SIDR under the 0.5m SLR will inundate additional 2.6% of the area and effect 1.4 million more people.
• Under high emission RCP 8.5 scenarios the mean yield of Boro rice will decrease about ~10% during 2030’s and ~20% during 2080s.
Receipts of Multi-lateral and Bi-lateral climate finance (As of October 2015)
http://www.climatefundsupdate.org/data
Climate Finance in Bangladesh
• Bangladesh is mobilizing to get funding from the Green Climate fundIn the past Bangladesh has established two climate funds:• Bangladesh Climate Change Trust Fund (BCCTF) by own budget allocation of
$100m• Bangladesh Climate Change Resilience Fund (BCCRF) is a multi-donor trust
fund for climate change has channeled over $188m in grant funds.
CPD, 2015http://www.climatefundsupdate.org/data
Way Forward for Bangladesh
• Bangladesh has a good strategic framework aimed at tackling climate change
• National Action Plan on Adaptation (NAPA) of 2005
• Bangladesh Climate Change Strategy and Action Plan (BCCSAP) of 2009.
• Increasing resilience to the impacts of climate change.
• Achieve low-carbon and resilient development.
• Beyond making financial commitments, industrialized countries must facilitate technology transfers, and more generally, adaptation to a low-carbon economy.
• Being one of the most vulnerable countries, Bangladesh must push for urgency to take immediate measures for limiting global warming below 1.5 degrees.
References• Bala SK, Islam AKMS, Uddin MN, Adhikary S, Islam GMT, Fahad MGR, Sutradhar LC (2016) Composite
vulnerability mapping of coastal Bangladesh using multivariate statistical approach. Ocean & Coastal Management (Under review).
• Mohammed K, Islam AKMS, Islam GMT, Bala SK, Khan MJU (2016) Climate change will increase floods and low flows of the Brahmaputra River. Journal of Hydrologic Engineering (Under Review).
• Islam AKMS, Paul S, Mohammed K, Billah M, Fahad MGR, Hasan MA, Islam GMT, Bala SK (2016) Hydrological response to climate change of the Brahmaputra basin using CMIP5 General Circulation Model ensemble. Journal of Water and Climate (Under Review).
• Fahad MG, Islam AKMS, Nazari R, Hasan MA, Islam GMT, Bala SK (2016) Regional changes of precipitation and temperature over Bangladesh using bias corrected multi-model ensemble projections considering high emission pathways. International Journal of Climatology (Under Review).
• Hasan MA, Islam AKMS, Akanda AS (2016) Climatic extremes from dynamically downscaled CMIP5 models over Bengal Delta under RCP scenarios: An advanced bias-correction approach with new gridded data. International Journal of Climatology (Under Review).
• Tazkia AR, Islam AKMS, Rahman MM, Krien Y, Durand F, Testut L, Islam GMT, Bala SK (2016) Sea level rise induced possible inundation patterns of the world's densely populated delta. Climatic Change (Under Review).
• Shaha PK, Tazkia AR, Islam AKMS, Rahman MM, Krien Y, Durand F, Testut L, Islam GMT, Bala SK (2016) Sea level rise induced possible inundation patterns of the world's densely populated delta. Climatic Change (Submitted).
• Hasan AS, Islam AKMS, Bala SK (2016) Impact of climate change on the production of Boro rice in Bangladesh using DSSAT crop model (In preparation).
• Holle RL and Islam, AKMS (2017) Lightning Fatalities in Bangladesh in May 2016. Proceedings of the 8th Conference on the Meteorological Applications of Lightning Data. 2017 American Meteorological Society Annual Meeting Seattle, Washington, 22-26 January 2017.