rds Beyond Nursing Quality Measurement: The Nation’s First Regional Nursing Virtual Dashboard Carolyn E. Aydin, PhD; Linda Burnes Bolton, DrPH, RN, FAAN; Nancy Donaldson, DNSc, RN, FAAN; Diane Storer Brown, PhD, RN, FNAHQ; Ananta Mukerji, MBA Abstract This paper describes the data reporting infrastructure of the California Nursing Outcomes Coalition (CalNOC), including the system’s capacity to provide member hospitals with seamless, interactive access to sophisticated reports in a secure environment. By leveraging the data repository to create both standardized and customized reporting capacity, CalNOC significantly improves the responsiveness and strategic value of the data to members, who create query-driven customized reports generated directly from the dataset. CalNOC measures and reporting tools include 7 of the 15 National Quality Forum-endorsed nursing-sensitive measures for inpatient care, as well as pressure ulcer prevention measures from the Institute for Healthcare Improvement’s 5 Million Lives campaign. CalNOC is well positioned to add other tools and measures as appropriate. The resulting capacity for a virtual dashboard, the first in the nursing quality measurement arena, is unique in the field and a model for further study and emulation. Introduction Executive dashboards are transforming health care clinical services and management as leaders monitor organizational performance and drill down and diagnose problem areas to establish priorities and design interventions for change. 1, 2, 3, 4, 5 Dashboards differ from report cards in that dashboards provide data on structure, process, and outcome variables, whereas report ca typically provide final reports on outcomes for external constituents. 6 Executive dashboards are generally characterized as tools that enable a leadership team to briefly visualize strategic metrics to guide decisionmaking grounded in actionable information. Closely tied to effective strategic benchmarking, dashboards provide clinical leaders with continuous information that is timely and focused on both internal performance and marketplace comparisons that enable leaders to put their internal data in comparative perspective. 7 Recent public reporting initiatives and the pay-for-performance demonstration project funded by the Centers for Medicare & Medicaid Services (CMS) represent the report-card strategy in which hospital performance is judged by external constituents incorporating incentives for performance improvement. However, emerging efforts that compare performance increase the demand for and imperatives related to the use of performance dashboards. 8 1
Transcript
rds
Beyond Nursing Quality Measurement: The Nation’s First Regional Nursing Virtual Dashboard Carolyn E. Aydin, PhD; Linda Burnes Bolton, DrPH, RN, FAAN; Nancy Donaldson, DNSc, RN, FAAN; Diane Storer Brown, PhD, RN, FNAHQ; Ananta Mukerji, MBA
Abstract This paper describes the data reporting infrastructure of the California Nursing Outcomes Coalition (CalNOC), including the system’s capacity to provide member hospitals with seamless, interactive access to sophisticated reports in a secure environment. By leveraging the data repository to create both standardized and customized reporting capacity, CalNOC significantly improves the responsiveness and strategic value of the data to members, who create query-driven customized reports generated directly from the dataset. CalNOC measures and reporting tools include 7 of the 15 National Quality Forum-endorsed nursing-sensitive measures for inpatient care, as well as pressure ulcer prevention measures from the Institute for Healthcare Improvement’s 5 Million Lives campaign. CalNOC is well positioned to add other tools and measures as appropriate. The resulting capacity for a virtual dashboard, the first in the nursing quality measurement arena, is unique in the field and a model for further study and emulation.
Introduction Executive dashboards are transforming health care clinical services and management as leaders monitor organizational performance and drill down and diagnose problem areas to establish priorities and design interventions for change.1, 2, 3, 4, 5 Dashboards differ from report cards in that dashboards provide data on structure, process, and outcome variables, whereas report catypically provide final reports on outcomes for external constituents.6 Executive dashboards are generally characterized as tools that enable a leadership team to briefly visualize strategic metrics to guide decisionmaking grounded in actionable information. Closely tied to effective strategic benchmarking, dashboards provide clinical leaders with continuous information that is timely and focused on both internal performance and marketplace comparisons that enable leaders to put their internal data in comparative perspective.7 Recent public reporting initiatives and the pay-for-performance demonstration project funded by the Centers for Medicare & Medicaid Services (CMS) represent the report-card strategy in which hospital performance is judged by external constituents incorporating incentives for performance improvement. However, emerging efforts that compare performance increase the demand for and imperatives related to the use of performance dashboards.8
1
In order to review and improve performance on public report cards, hospitals construct internal dashboards to review performance and identify areas in need of change. Benchmarking—the perpetual search for evidence-driven practice improvements in the quest for exceptional competitive performance with other similar hospitals in a confidential context—is an important element in this process.6, 7, 9 The California Nursing Outcomes Coalition (CalNOC), the Nation’s largest regional nursing quality measurement network, is a collaborative effort of the American Nursing Association-California (ANA/C), the Association of California Nurse Leaders (ACNL), and the CalNOC Steering Committee. Its mission is to advance improvements in patient care by: • Building and sustaining a valid and reliable statewide outcomes database. • Conducting research to advance evidence-based interventions to achieve quality. • Serving as a vendor of data on behalf of member hospitals and researchers. • Synthesizing and disseminating data to shape public policy, practice, and education. The CalNOC project has been described in detail elsewhere.10 CalNOC membership is voluntary and open to all acute care hospitals in the State of California, as well as to selected hospital groups nationwide. Currently, over 180 of California’s 366 acute care hospitals participate in CalNOC—in addition to hospitals from Nevada, Arizona, Oregon, and Hawaii—resulting in a convenience sample of hospitals with rolling site accrual. CalNOC’s unit-level nursing quality indicators are collected quarterly from adult and pediatric critical care, step-down, and medical and/or surgical units, as well as from post-acute rehabilitation and skilled nursing units. Table 1 provides a comprehensive list of nursing quality indicators organized into categories of measures related to nurse staffing; RN education level, certification, and years of experience; patient falls; pressure ulcer prevalence; restraint prevalence; central line-associated blood stream infections; and medication administration accuracy. This paper describes the data-reporting infrastructure of the CalNOC system, examining its capacity to provide member hospitals with seamless, interactive access to CalNOC data in a secure environment that authorizes users and controls access privileges. By leveraging the data repository to create both standardized and customized reporting capacity, the CalNOC system significantly improves the responsiveness and strategic value of the data to members, who are able to generate query-driven customized reports directly from the dataset. The resulting capacity for a virtual dashboard is unique in the field, providing opportunities for users to examine associations between staffing and outcome variables and to explore and analyze factors associated with performance variation. CalNOC hospitals develop their own facility dashboards, combining reports from the Web site’s virtual dashboard with those from other data sources for a combined tool to display operational, quality, and satisfaction indicators on a single document.1
2
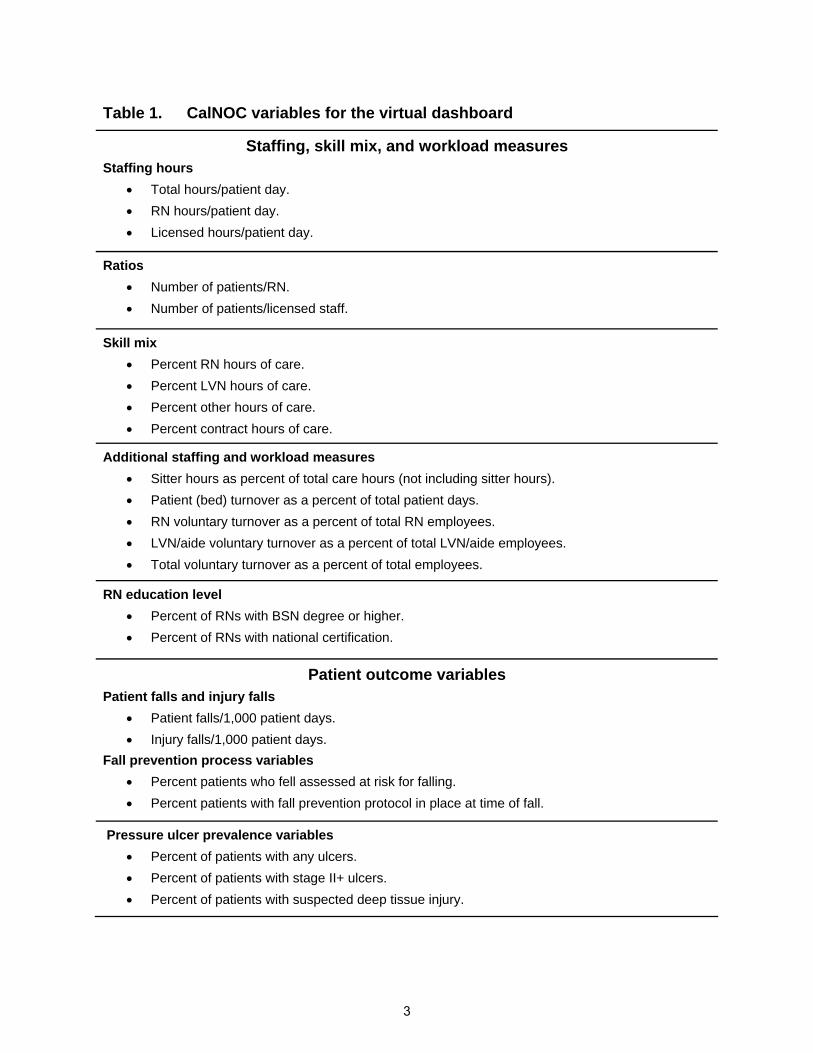
Table 1. CalNOC variables for the virtual dashboard
Staffing, skill mix, and workload measures Staffing hours
Ratios • Number of patients/RN. • Number of patients/licensed staff.
Skill mix • Percent RN hours of care. • Percent LVN hours of care. • Percent other hours of care. • Percent contract hours of care.
Additional staffing and workload measures • Sitter hours as percent of total care hours (not including sitter hours). • Patient (bed) turnover as a percent of total patient days. • RN voluntary turnover as a percent of total RN employees. • LVN/aide voluntary turnover as a percent of total LVN/aide employees. • Total voluntary turnover as a percent of total employees.
RN education level • Percent of RNs with BSN degree or higher. • Percent of RNs with national certification.
Patient outcome variables Patient falls and injury falls
Fall prevention process variables • Percent patients who fell assessed at risk for falling. • Percent patients with fall prevention protocol in place at time of fall.
Pressure ulcer prevalence variables • Percent of patients with any ulcers. • Percent of patients with stage II+ ulcers. • Percent of patients with suspected deep tissue injury.
3
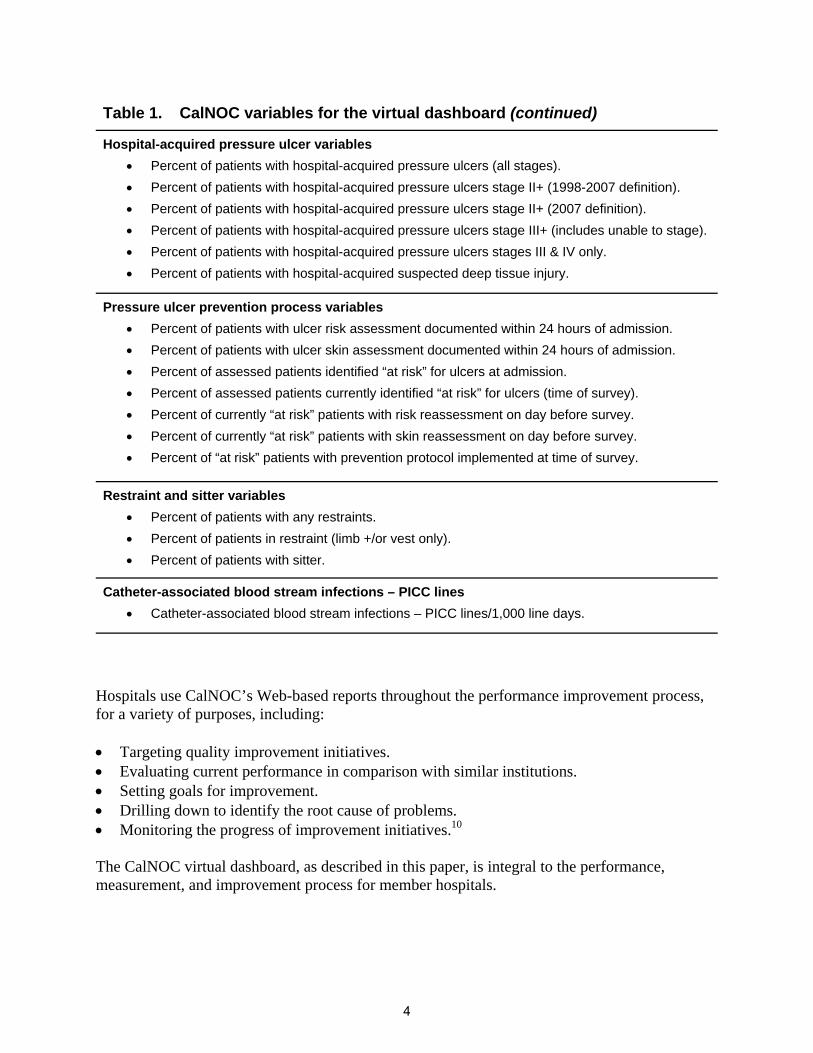
Table 1. CalNOC variables for the virtual dashboard (continued)
Hospital-acquired pressure ulcer variables • Percent of patients with hospital-acquired pressure ulcers (all stages). • Percent of patients with hospital-acquired pressure ulcers stage II+ (1998-2007 definition). • Percent of patients with hospital-acquired pressure ulcers stage II+ (2007 definition). • Percent of patients with hospital-acquired pressure ulcers stage III+ (includes unable to stage). • Percent of patients with hospital-acquired pressure ulcers stages III & IV only. • Percent of patients with hospital-acquired suspected deep tissue injury.
Pressure ulcer prevention process variables • Percent of patients with ulcer risk assessment documented within 24 hours of admission. • Percent of patients with ulcer skin assessment documented within 24 hours of admission. • Percent of assessed patients identified “at risk” for ulcers at admission. • Percent of assessed patients currently identified “at risk” for ulcers (time of survey). • Percent of currently “at risk” patients with risk reassessment on day before survey. • Percent of currently “at risk” patients with skin reassessment on day before survey. • Percent of “at risk” patients with prevention protocol implemented at time of survey.
Restraint and sitter variables • Percent of patients with any restraints. • Percent of patients in restraint (limb +/or vest only). • Percent of patients with sitter.
Hospitals use CalNOC’s Web-based reports throughout the performance improvement process, for a variety of purposes, including: • Targeting quality improvement initiatives. • Evaluating current performance in comparison with similar institutions. • Setting goals for improvement. • Drilling down to identify the root cause of problems. • Monitoring the progress of improvement initiatives.10 The CalNOC virtual dashboard, as described in this paper, is integral to the performance, measurement, and improvement process for member hospitals.
4
CalNOC Reporting Infrastructure Since its inception in 1996, CalNOC has considered the quality and value of its reporting to member hospitals to be a strategic priority. Evolving from hardcopy reports delivered by regular mail to electronic benchmarking reports e-mailed to sites, the vision for a virtual, interactive dashboard evolved concurrent with the increasingly sophisticated demand for these data and Web-driven technologies. Transforming vision into reality was made possible by funding from the Gordon and Betty Moore Foundation in 2004, which enabled CalNOC to upgrade its data operations to create new capacity to capture, analyze, and store data. The core goal was for CalNOC reports to hospitals to be delivered via an integrated Web site and data analysis application (the “CalNOC system”), a comprehensive, secure, multi-tier, Web-based application developed using Microsoft’s .Net (“dot-net”) architecture. The resulting CalNOC system includes two major sub-systems: • A comprehensive membership management application, where demographic information is
maintained for all member facilities and their assigned employees who are associated with CalNOC.
• A data analysis application, where the actual CalNOC data are stored, analyzed, and reported to the CalNOC membership.
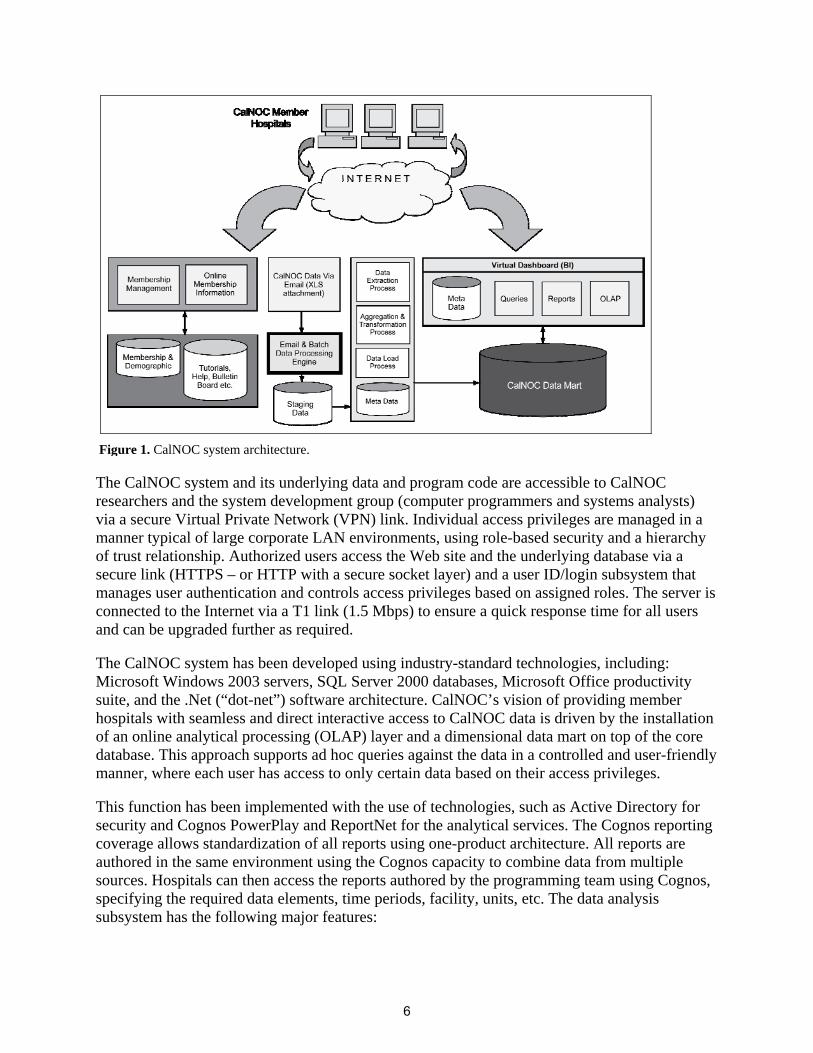
Figure 1 illustrates the CalNOC system architecture. The entire infrastructure has been developed over the course of several years, including the acquisition of hardware, software licensing, and application development (system analysis, design, development, testing, and deployment) efforts. The primary features and functionality of the Web site are available only to CalNOC member hospitals and their representatives, who log into their accounts on the Web site prior to accessing the controlled content. CalNOC Data Analysis Subsystem Data Infrastructure Overview The entire data infrastructure for the CalNOC system—including the database, the analytical software, and the Web site itself—is hosted at a centralized location. The system employs a secure Web-hosting facility on a high-speed dedicated server with processing power and storage capacity sufficient for both the database and the Web site. Based on the future growth of the database and the level of use of the Web site, the two roles can be separated into different servers at the same location as needed. This infrastructure consolidation provides a direct and interactive interface into the database via the CalNOC Web site. It enhances the responsiveness and level of service to member hospitals, ensuring that CalNOC has a tightly integrated and scalable computing platform that can grow as needed.
5
Figure 1. CalNOC system architecture.
The CalNOC system and its underlying data and program code are accessible to CalNOC researchers and the system development group (computer programmers and systems analysts) via a secure Virtual Private Network (VPN) link. Individual access privileges are managed in a manner typical of large corporate LAN environments, using role-based security and a hierarchy of trust relationship. Authorized users access the Web site and the underlying database via a secure link (HTTPS – or HTTP with a secure socket layer) and a user ID/login subsystem that manages user authentication and controls access privileges based on assigned roles. The server is connected to the Internet via a T1 link (1.5 Mbps) to ensure a quick response time for all users and can be upgraded further as required. The CalNOC system has been developed using industry-standard technologies, including: Microsoft Windows 2003 servers, SQL Server 2000 databases, Microsoft Office productivity suite, and the .Net (“dot-net”) software architecture. CalNOC’s vision of providing member hospitals with seamless and direct interactive access to CalNOC data is driven by the installation of an online analytical processing (OLAP) layer and a dimensional data mart on top of the core database. This approach supports ad hoc queries against the data in a controlled and user-friendly manner, where each user has access to only certain data based on their access privileges. This function has been implemented with the use of technologies, such as Active Directory for security and Cognos PowerPlay and ReportNet for the analytical services. The Cognos reporting coverage allows standardization of all reports using one-product architecture. All reports are authored in the same environment using the Cognos capacity to combine data from multiple sources. Hospitals can then access the reports authored by the programming team using Cognos, specifying the required data elements, time periods, facility, units, etc. The data analysis subsystem has the following major features:
6
• Data input. Member facilities submit data (e-mailed to CalNOC’s data “in box”) using Excel® spreadsheets with form-driven as well as column-driven cut-and-paste data entry.
• Data quality validation. Some basic validation logic (e.g., facility code number, patient age, etc.) is performed on the user side during data entry. Other validations (e.g., facility, unit, unit type matching, etc.) based on the database, are handled at the CalNOC data processing center using the data load subsystem, which processes e-mails with data attachments. If errors are found, the data coordinator contacts the individual facility for correction and/or clarification.
• Access to raw data. Authorized users on the CalNOC analytical team have the option to see all data online and generate reports from the database.
• Customized query-driven reports. Member hospitals use the Web site to generate customized reports using processed data that are summarized at the unit, unit type, and facility level.
Generating CalNOC Reports The data analysis subsection of the CalNOC Web site is organized as a “portal,” where all of the reports available are arranged hierarchically in function-specific folders. At the highest level, the folders are related to the type (level) of care provided by a facility (or unit within a facility). Within each of the three “care types” below, data are aggregated by level of care: • Adult acute care:
o Medical, surgical, medical/surgical units. o Step down units. o Critical care units.
• Pediatric acute care: o Medical, surgical, medical/surgical units. o Step down units. o Critical care units. o Neonatal intensive care units.
• Post-acute care: o Hospital-based distinct part skilled nursing units. o Acute rehabilitation unit.
Within each level of care are two categories of reports (folders): one, reports available to all member hospitals and two, reports available to data management staff only. Each user is only able to see and access the specific types of reports that are associated with their access privileges. Furthermore, individuals at each facility can only access reports specific to their own facility and appropriate statistics that are CalNOC-wide (e.g., totals, averages, percentiles). The only exception is the case of hospital “groups,” such as Kaiser-Permanente, Catholic Healthcare West (CHW), and other health care systems, where the group-level administrator can access data and reports pertaining to all of their facilities.
7
CalNOC’s “Virtual Dashboard” Reports are driven by a “virtual dashboard” concept, in which users are able to create and customize their own reports by specifying the parameters of interest. The CalNOC virtual dashboard provides member hospitals with the capacity to compare their own performance visually and statistically with those of “like” hospitals. Reports are stratified by hospital average daily census or aggregated for all CalNOC hospitals, as selected by the user. Available reports include trending as well as quartile and percentile reports to aid in setting performance targets and benchmarks. Users are able to see pregenerated reports online for statistics that are of interest to their own facility. Authorized users can create reports in different formats (e.g., pdf and Excel®), which is facilitated through the Cognos ReportNet platform. The Web site provides reports for facilities as a whole, by unit type (i.e., critical care, step-down, or medical/surgical units), and for individual units. The CalNOC dashboard provides three types of query-driven customized reports for the variables listed in Table 1, described in detail and illustrated below: • Common (comparison) reports. A visual presentation comparing hospital performance by
selected group (identified by facility code number only). • Summary statistics. Summary reports of all CalNOC indicators for the CalNOC total,
average daily census categories, and type of unit in an easy-to-reference format. • Facility-specific reports. Reports for individual hospital and unit performance on the same
variables. o Benchmarking reports. o Trend graphs. o Staffing effectiveness graphs.
Getting Started Each CalNOC member hospital has a designated primary site coordinator who is responsible for data collection, submission, and reporting. We recommend that primary site coordinators meet with patient care leadership to establish their institution’s goals and priorities for improvement, internal dissemination plan for CalNOC data, and preference for types of data presentation. Generating sample reports as examples for leadership to review is a good way to get the reporting process started. Each hospital will be asking: “What reports do we need?” or “What do we want to do with the data?” The following sections detail each of the menu-driven reports and the role of each report in enhancing the usefulness of CalNOC data. Generating and Using CalNOC Reports Comparison graphs—a picture is worth a thousand words. Comparison graphs provide a visual representation of comparative hospital performance. Figure 2 shows a sample comparison graph for “Falls per 1,000 Patient-Days” for all medical/surgical units in hospitals with an average daily census “under 100” patients. The site coordinator running the report made the following selections:
8
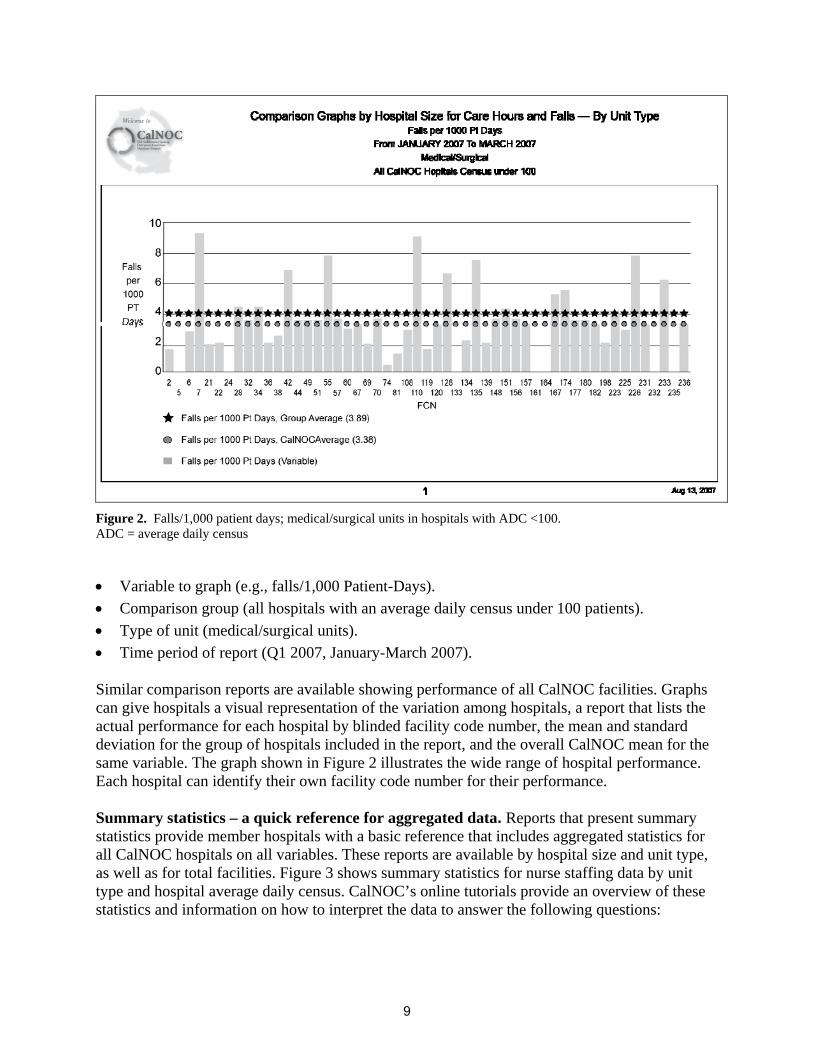
Figure 2. Falls/1,000 patient days; medical/surgical units in hospitals with ADC <100. ADC = average daily census
• Variable to graph (e.g., falls/1,000 Patient-Days). • Comparison group (all hospitals with an average daily census under 100 patients). • Type of unit (medical/surgical units). • Time period of report (Q1 2007, January-March 2007). Similar comparison reports are available showing performance of all CalNOC facilities. Graphs can give hospitals a visual representation of the variation among hospitals, a report that lists the actual performance for each hospital by blinded facility code number, the mean and standard deviation for the group of hospitals included in the report, and the overall CalNOC mean for the same variable. The graph shown in Figure 2 illustrates the wide range of hospital performance. Each hospital can identify their own facility code number for their performance. Summary statistics – a quick reference for aggregated data. Reports that present summary statistics provide member hospitals with a basic reference that includes aggregated statistics for all CalNOC hospitals on all variables. These reports are available by hospital size and unit type, as well as for total facilities. Figure 3 shows summary statistics for nurse staffing data by unit type and hospital average daily census. CalNOC’s online tutorials provide an overview of these statistics and information on how to interpret the data to answer the following questions:
9
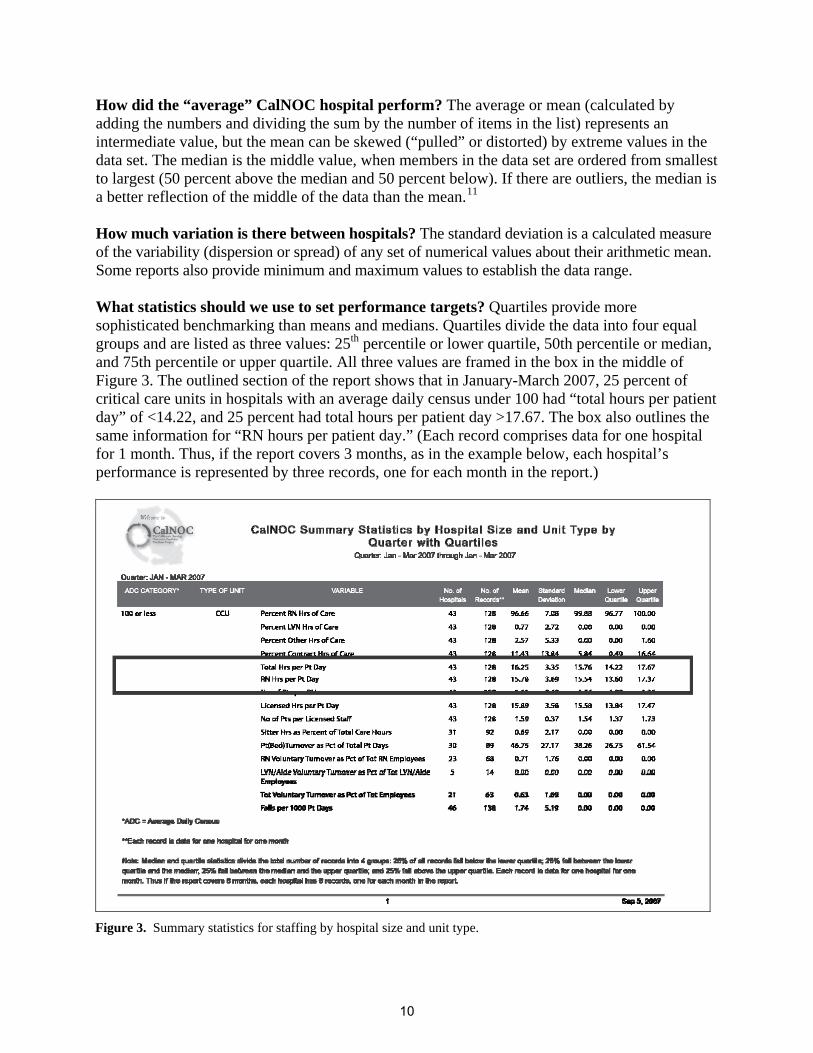
How did the “average” CalNOC hospital perform? The average or mean (calculated by adding the numbers and dividing the sum by the number of items in the list) represents an intermediate value, but the mean can be skewed (“pulled” or distorted) by extreme values in the data set. The median is the middle value, when members in the data set are ordered from smallest to largest (50 percent above the median and 50 percent below). If there are outliers, the median is a better reflection of the middle of the data than the mean.11 How much variation is there between hospitals? The standard deviation is a calculated measure of the variability (dispersion or spread) of any set of numerical values about their arithmetic mean. Some reports also provide minimum and maximum values to establish the data range. What statistics should we use to set performance targets? Quartiles provide more sophisticated benchmarking than means and medians. Quartiles divide the data into four equal groups and are listed as three values: 25th percentile or lower quartile, 50th percentile or median, and 75th percentile or upper quartile. All three values are framed in the box in the middle of Figure 3. The outlined section of the report shows that in January-March 2007, 25 percent of critical care units in hospitals with an average daily census under 100 had “total hours per patient day” of <14.22, and 25 percent had total hours per patient day >17.67. The box also outlines the same information for “RN hours per patient day.” (Each record comprises data for one hospital for 1 month. Thus, if the report covers 3 months, as in the example below, each hospital’s performance is represented by three records, one for each month in the report.)
Figure 3. Summary statistics for staffing by hospital size and unit type.
10
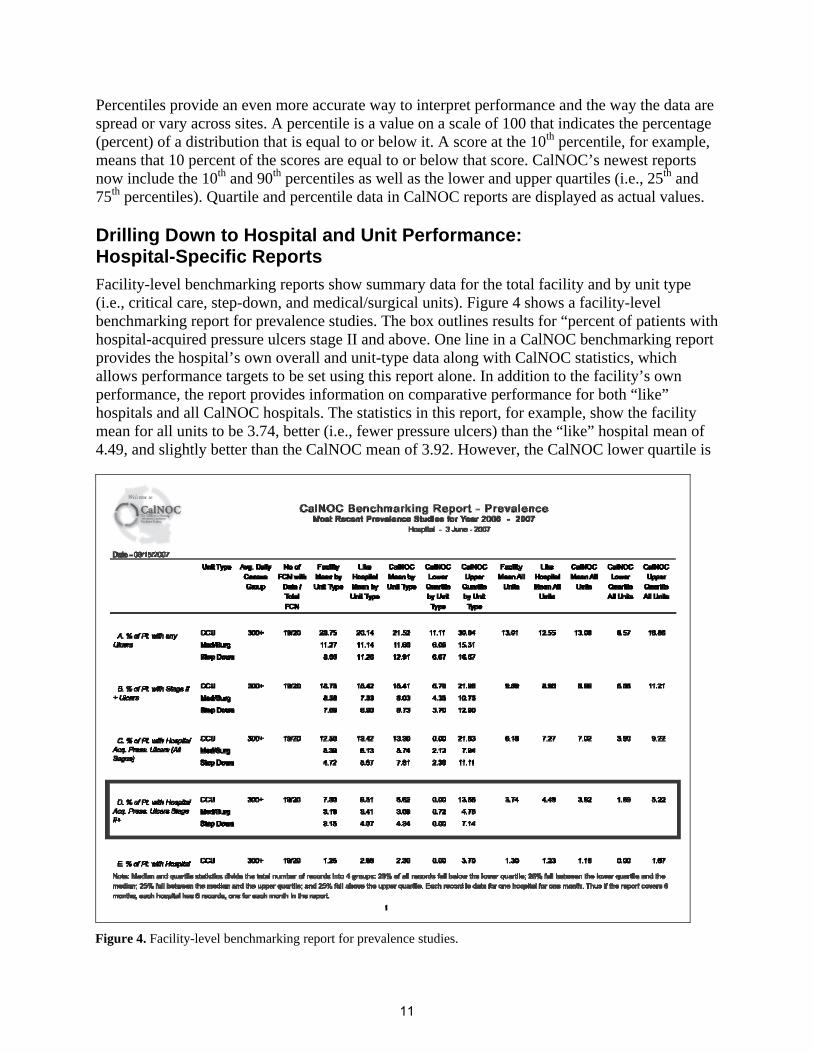
Percentiles provide an even more accurate way to interpret performance and the way the data are spread or vary across sites. A percentile is a value on a scale of 100 that indicates the percentage (percent) of a distribution that is equal to or below it. A score at the 10th percentile, for example, means that 10 percent of the scores are equal to or below that score. CalNOC’s newest reports now include the 10th and 90th percentiles as well as the lower and upper quartiles (i.e., 25th and 75th percentiles). Quartile and percentile data in CalNOC reports are displayed as actual values. Drilling Down to Hospital and Unit Performance: Hospital-Specific Reports Facility-level benchmarking reports show summary data for the total facility and by unit type (i.e., critical care, step-down, and medical/surgical units). Figure 4 shows a facility-level benchmarking report for prevalence studies. The box outlines results for “percent of patients with hospital-acquired pressure ulcers stage II and above. One line in a CalNOC benchmarking report provides the hospital’s own overall and unit-type data along with CalNOC statistics, which allows performance targets to be set using this report alone. In addition to the facility’s own performance, the report provides information on comparative performance for both “like” hospitals and all CalNOC hospitals. The statistics in this report, for example, show the facility mean for all units to be 3.74, better (i.e., fewer pressure ulcers) than the “like” hospital mean of 4.49, and slightly better than the CalNOC mean of 3.92. However, the CalNOC lower quartile is
Figure 4. Facility-level benchmarking report for prevalence studies.
11
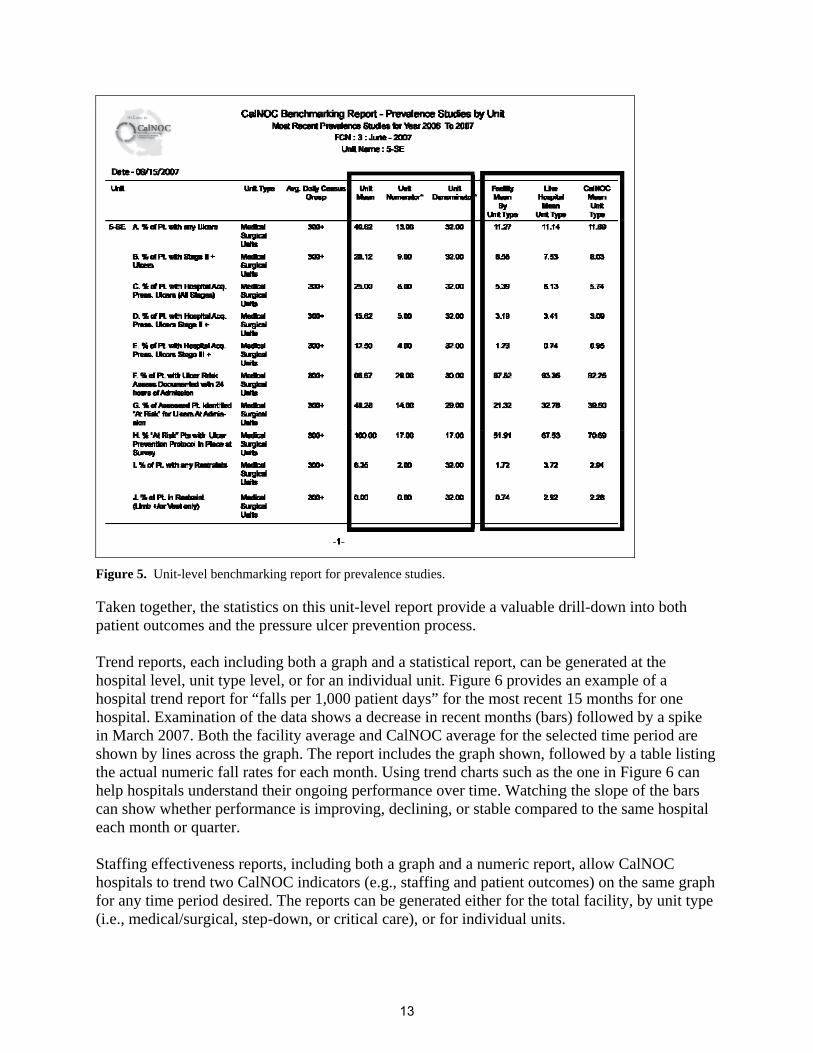
1.69, indicating less than 1.69 percent of “patients with hospital acquired pressure ulcers stage II+” in the best performing 25 percent of facilities. Thus, a hospital wishing to be in the best performing quarter for all CalNOC hospitals would select 1.69 as a performance target. Alternatively, summary statistics reports provide quartiles by hospital size, allowing hospitals to set more specific targets based on their own average daily census category, rather than on the CalNOC total. Quartiles or percentiles can be used as performance goals, as in the above example, or, if the hospital’s performance is already at the desired level, as performance thresholds. If the hospital’s performance had already been in the lowest (best) 25 percent of CalNOC hospitals, the lower quartile could be used as a performance threshold, with a drill-down analysis to determine appropriate improvement actions should performance rise to the 25th percentile (lower quartile) or above. Alternatively, the hospital could reset the performance target to the best 10 percent of CalNOC hospitals, a statistic recently added to new CalNOC reports. As more organizations better understand their performance and drill down on their own data to identify opportunities to improve, group performance might improve. As the group improves, the quartiles would move down. As the bar is raised, a site’s relative performance could deteriorate compared to the group, even though their actual performance had been stable, encouraging setting of new improvement goals. Unit-level benchmarking reports allow hospitals and unit managers to examine unit performance in detail, including both pressure ulcer prevention process variables (e.g., “percent of patients with ulcer risk documented within 24 hours of admission”) and patient outcomes (e.g., “percent of patients with hospital-acquired pressure ulcers stage II and above”). The first box in Figure 5 shows the following unit-level information for each variable: • Unit mean. • Unit numerator (the number of patients with incidence). • Unit denominator (the number of patients included in calculation of the variable). These statistics track the actual number of patients with ulcers in addition to the percent. Actual numbers may be more meaningful to unit staff than calculated rates when tracking “never events” by days between events or occurrences. The second box encloses the following statistics, useful for comparisons and goal setting: • Facility mean by unit type (overall facility data for this unit type). • “Like” hospital mean by unit type. • CalNOC mean by unit type.
12
Figure 5. Unit-level benchmarking report for prevalence studies.
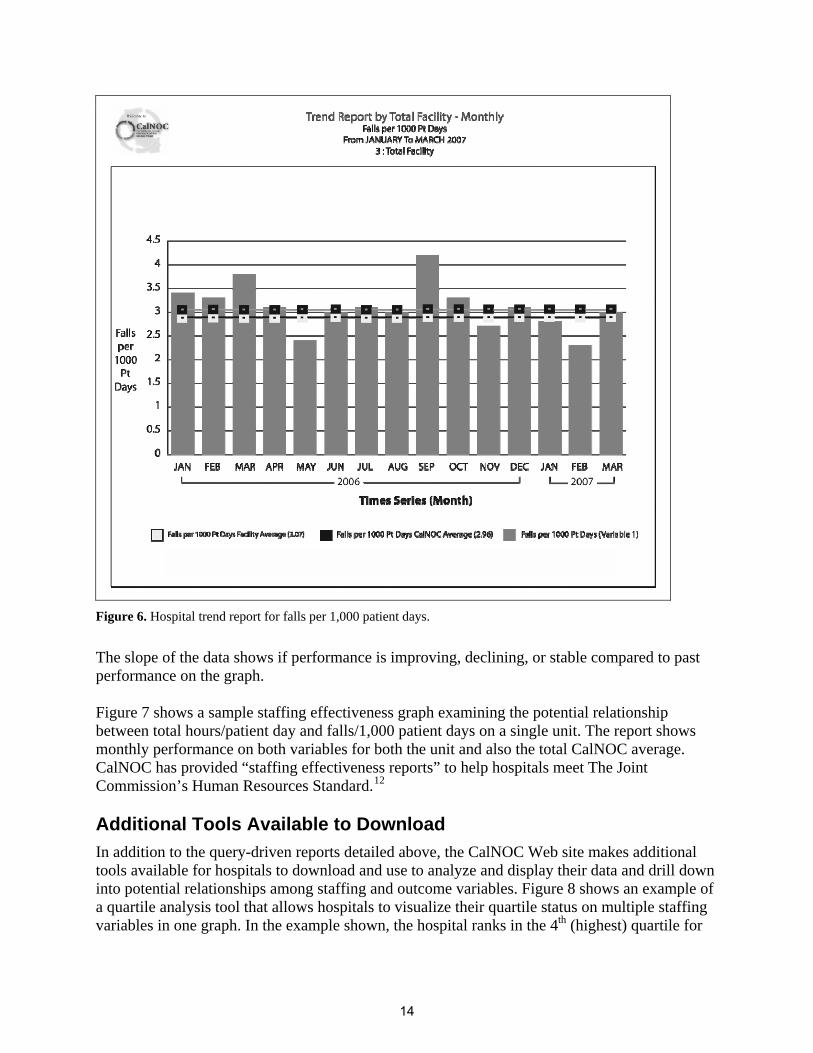
Taken together, the statistics on this unit-level report provide a valuable drill-down into both patient outcomes and the pressure ulcer prevention process. Trend reports, each including both a graph and a statistical report, can be generated at the hospital level, unit type level, or for an individual unit. Figure 6 provides an example of a hospital trend report for “falls per 1,000 patient days” for the most recent 15 months for one hospital. Examination of the data shows a decrease in recent months (bars) followed by a spike in March 2007. Both the facility average and CalNOC average for the selected time period are shown by lines across the graph. The report includes the graph shown, followed by a table listing the actual numeric fall rates for each month. Using trend charts such as the one in Figure 6 can help hospitals understand their ongoing performance over time. Watching the slope of the bars can show whether performance is improving, declining, or stable compared to the same hospital each month or quarter. Staffing effectiveness reports, including both a graph and a numeric report, allow CalNOC hospitals to trend two CalNOC indicators (e.g., staffing and patient outcomes) on the same graph for any time period desired. The reports can be generated either for the total facility, by unit type (i.e., medical/surgical, step-down, or critical care), or for individual units.
13
Figure 6. Hospital trend report for falls per 1,000 patient days.
The slope of the data shows if performance is improving, declining, or stable compared to past performance on the graph. Figure 7 shows a sample staffing effectiveness graph examining the potential relationship between total hours/patient day and falls/1,000 patient days on a single unit. The report shows monthly performance on both variables for both the unit and also the total CalNOC average. CalNOC has provided “staffing effectiveness reports” to help hospitals meet The Joint Commission’s Human Resources Standard.12
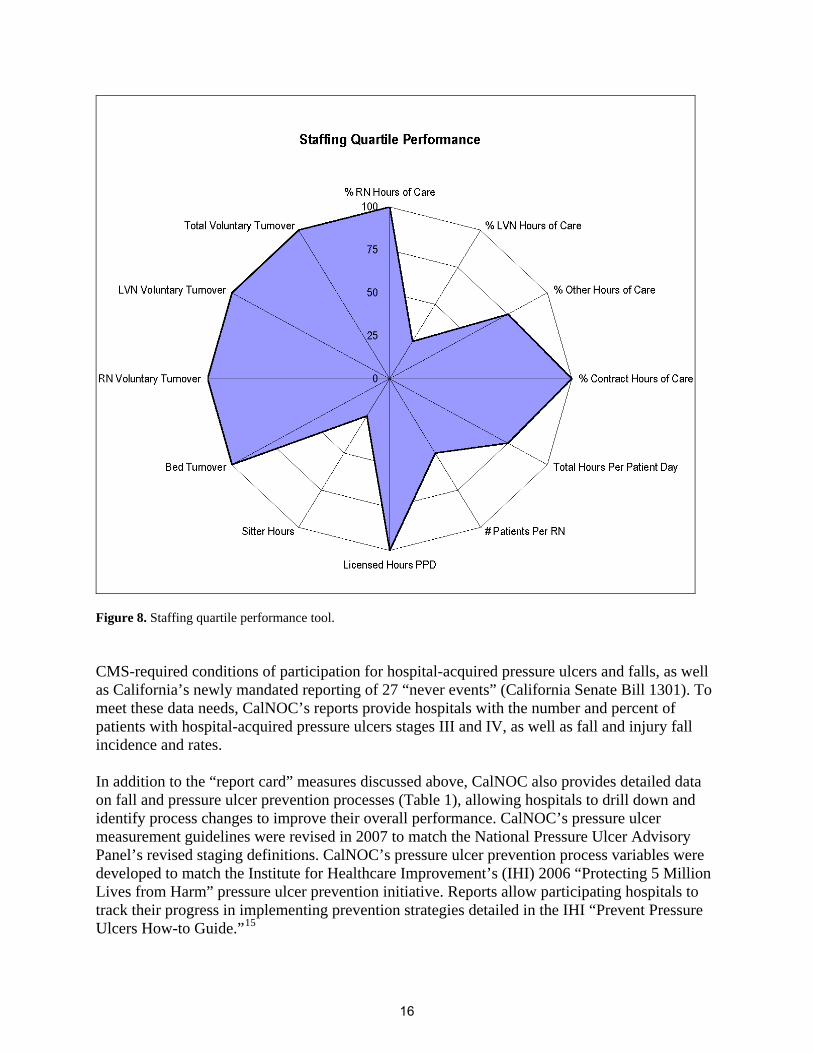
Additional Tools Available to Download In addition to the query-driven reports detailed above, the CalNOC Web site makes additional tools available for hospitals to download and use to analyze and display their data and drill down into potential relationships among staffing and outcome variables. Figure 8 shows an example of a quartile analysis tool that allows hospitals to visualize their quartile status on multiple staffing variables in one graph. In the example shown, the hospital ranks in the 4th (highest) quartile for
14
Figure 7. Unit-level staffing effectiveness report for total hours per patient day and falls for 1,000 patient days.
RN skill mix (“percent RN hours of care”), but it also ranks in the highest quartiles for staff turnover and “percent contract hours of care.” Similar tools are available to view CalNOC process and outcome measures. Using these together can help hospitals link their staffing performance with both process and outcomes and identify potential areas for improvement. Responding to a Changing Health Care Environment In 2003, the National Quality Forum (NQF) endorsed 15 consensus-based, nursing-sensitive measures for inpatient care.13 The Joint Commission completed their Technical Implementation Guide for the NQF’s 15 measures in 2005 and is currently conducting a 2-year project to test the use of the NQF 15 as a measure set.14 CalNOC’s pressure ulcer and restraint prevalence methodology and measurement definitions were accepted by the NQF as two of the 15 measures. CalNOC data collection and virtual dashboard also include an additional five of the measures for a total of seven of the 15, and CalNOC is well positioned to add others as appropriate. In addition, CalNOC serves as a data repository for participating hospitals for new 2007
15
Figure 8. Staffing quartile performance tool. CMS-required conditions of participation for hospital-acquired pressure ulcers and falls, as well as California’s newly mandated reporting of 27 “never events” (California Senate Bill 1301). To meet these data needs, CalNOC’s reports provide hospitals with the number and percent of patients with hospital-acquired pressure ulcers stages III and IV, as well as fall and injury fall incidence and rates. In addition to the “report card” measures discussed above, CalNOC also provides detailed data on fall and pressure ulcer prevention processes (Table 1), allowing hospitals to drill down and identify process changes to improve their overall performance. CalNOC’s pressure ulcer measurement guidelines were revised in 2007 to match the National Pressure Ulcer Advisory Panel’s revised staging definitions. CalNOC’s pressure ulcer prevention process variables were developed to match the Institute for Healthcare Improvement’s (IHI) 2006 “Protecting 5 Million Lives from Harm” pressure ulcer prevention initiative. Reports allow participating hospitals to track their progress in implementing prevention strategies detailed in the IHI “Prevent Pressure Ulcers How-to Guide.”15
16
Conclusion This paper describes how CalNOC has leveraged its data repository to create reporting capacity that significantly improves the responsiveness and strategic value of the database to members. CalNOC’s virtual dashboard capacity is unique in enabling hospitals to examine their data in query-driven reports that meet their own individual performance needs. In addition to “report card” measures such as the NQF 15 described above, CalNOC’s virtual dashboard provides data and analysis tools useful throughout the five steps of the performance measurement process, including: targeting quality improvement initiatives, evaluating current performance in comparison with similar institutions, setting goals for improvement, drilling down to identify the root cause of a problem, and monitoring the progress of improvement initiatives.10 CalNOC continues to expand its data collection and reporting capacity to meet the needs of the evolving health care regulatory and reporting environment, creating a virtual dashboard that is unique in the field and a model for other regions developing similar initiatives.
Author Affiliations Cedars-Sinai Medical Center and Burns & Allen Research Institute, Los Angeles, CA (Dr. Aydin, Dr. Burnes Bolton); UCSF-Stanford Center for Research & Innovation in Patient Care, UCSF School of Nursing, San Francisco, CA (Dr. Donaldson); Kaiser-Permanente Northern California Region, Oakland, CA (Dr. Brown); Aviana Global Technologies, Inc., Brea, CA (Mr. Mukerji). Address correspondence to: Carolyn Aydin, PhD, Research Scientist IV and CalNOC Data Manager; Nursing Research and Development, Room 2021, Cedars-Sinai Medical Center, 8700 Beverly Blvd, Los Angeles, CA 90048; telephone: 310-423-3694; fax: 310-423-0281; e-mail: [email protected].
References
1. Donaldson N, Brown DS, Aydin CE, et al. Leveraging nurse-related dashboard benchmarks to expedite performance improvement and document excellence. J Nurs Adm 2005: 35: 163-72.
2. Rosow E, Adam J, Coulombe K, et al. Virtual instrumentation and real-time executive dashboards. Solutions for health care systems. Nurs Adm Q 2003; 27: 58-76.
3. The Advisory Board. Enfranchising nursing in cost reform: Best practices for migrating to a new standard. Washington, DC: The Advisory Board; 2000.
4. The Advisory Board. First do no harm: Executive briefing on medication safety. Washington, DC: Clinical Initiatives Center; 2000.
5. Schaffner JW, Alleman S, Ludwig-Beymer P, et al. Developing a patient care model for an integrated delivery system. J Nurs Adm 1999; 29: 43-50.
6. Gregg AC. Performance management data systems for nursing service organizations J Nurs Adm 2002; 32: 71-78.
7. Watson GH. Strategic benchmarking. New York: John Wiley & Sons; 1993.
8. Lindenauer PK, Remus D, Roman S, et al. Public reporting and pay for performance in hospital quality improvement N Engl J Med 2007; 356: 486-96.
9. Scanlon DP, Darby C, Rolph E, Doty HE. Performance measures and quality improvement. Health Serv Res 2001; 36: 619-21.
10. Aydin CE, Burnes Bolton L, Donaldson N, et al. Creating and analyzing a statewide nursing quality measurement database. J Nurs Sch 2004; 36: 371-378.
11. Dixon WJ, Massey FJ. Introduction to statistical analysis (4th ed). New York: McGraw-Hill; 1983.
12 The Joint Commission. Environment of Care Standard EC.1.30. Standard: HR.1.30; 2001. Available at http://www.jointcommission.org/NR/rdonlyres/979B4315-F409-476B-810C22F0F0CB3BD5/0/ hap_cah_sii_hr130.pdf. Accessed April 14, 2008.
13. Nursing performance measurement and reporting: a status report. National Quality Forum. July 2007. http://www.qualityforum.org/pdf/news/IB_july2007.pdf. Accessed January 12, 2008.
14. National Quality Forum (NQF) endorsed nursing-sensitive care performance measures. The Joint Commission; 2007. Available at: www.qualityforum.org/nursing/#measures Accessed January 12, 2008.
15. Getting started kit: Prevent pressure ulcers how-to guide. Institute for Healthcare Improvement; 2006. http://www.ihi.org/IHI/Programs/Campaign/Campaign.htm?TabId=2#PreventPressureUlcers. Accessed January 12, 2008.