35
Beyond the Elements: XRD Mineralogy & XRF Analysis for Advanced Mud Logging
| Date post: | 13-Jul-2015 |
| Category: |
Technology |
| Upload: | olympus-ims |
| View: | 793 times |
| Download: | 5 times |
Beyond the Elements: XRD Mineralogy & XRF Analysis
for Advanced Mud Logging

Agenda
Meet the Speakers Jose Brum, Field Sales Engineer, Olympus Dawn Snyder, Geologist, Diversified Well Logging
Topics XRF & XRD Basics X-ray technology in oil & gas drilling Advanced mud logging techniques On-site XRF and XRD Q&A Session

Save Time Easy sample prep On-site analysis Fast results
Reduce Costs Send fewer samples to outside lab Avoid downtime waiting for results Prevent re-drilling with real-time data
Be Decisive Continuously test while drilling Geosteering without guesswork View drill depth vs mineralogy comparison plots
Benefits of on-site XRD & XRF analysis

What is X-ray fluorescence?
Quantitative elemental analysis Mg - U Measures ppm - % for most elements

What is X-ray fluorescence?
Typical XRF Spectra


What is X-ray diffraction?
Direct mineralogy with XRD Quantitative mineral phase analysis Rough range of analysis is ~ 2% - 100%

What is X-ray diffraction?
Typical XRD Patterns
Quartz
Dolomite
Gypsum
Illite
2650 ft
6250 ft

XRD vs XRF?
Both use an X-ray source and detector Both measure the response to X-rays interacting
with a substance Both provide a measurement to help identify a
substance
XRF XRD
Elemental Analysis Compound Analysis
Contains Fe Contains Fe2O3 vs Fe3O4
Contains Ca Polymorphs: CaCO3
calcite vs aragonite vs vaterite

Unconventional resources
CHALLENGE: Majority of wells being drilled in N.A. are in unconventional resource plays
SOLUTION: Advancements in horizontal drilling and hydraulic fracturing have made production from unconventional resources commercially viable

Finding the sweet spot
CHALLENGE: Geology, geochemistry, geo-mechanical properties can vary significantly throughout the play within visually homogenous shales
SOLUTION: XRD & XRF shows molecular level to identify areas with more carbonates, areas that are more siliceous, and places of changes in the clay

Monitoring mineralogy trends with XRD

Monitoring mineralogy trends with XRD

Brittle zones
CHALLENGE: Brittle zones necessary to pinpoint sweet spots for fracking can appear and disappear quickly in horizontal sections
SOLUTION: XRD data can be used to derive the brittleness of the shales within reservoirs

Rock type CHALLENGE: Need to identify oil & gas bearing zones, permeability and porosity for optimum production
SOLUTION: XRD can identify the rock types that indicate oil & gas bearing zones

Marker elements
CHALLENGE: Finding boundary layers and staying in the pay zone while drilling
SOLUTION: XRF can identify upper and lower marker elements to indicate when you have entered the pay zone or if you have left it

Monitoring elemental composition with XRF

Elemental composition vs drilling depths

Downhole vs surface techniques
CHALLENGES: Downhole measurements such as gamma, resistivity or wireline tools can fail due to temperature, pressure or vibration in the wellbore
SOLUTION: Surface-based data from XRD and XRF have little to no impact on the drilling operations and can provide the mineralogy data regardless of downhole conditions

Compatible Fluids
CHALLENGE: Drilling and injection fluids can interact with the formation in undesirable ways
SOLUTION: XRD can analyze the mineralogy so the compatible fluid can be used

Scaling
CHALLENGE: Scaling can block wells and reduce permeability of the formation
SOLUTION: XRD can identify the type of scaling so you can choose the right treatment chemicals
Common oilfield scales

Optimizing ProductionCHALLENGE: Typical well has between 25-50 stages, costing close to $250k per stage, with a typical production rate of 2%
SOLUTION: Placing stages in the most brittle areas of the formation will help to optimize production, reduce cost and minimize environmental impact of fracturing
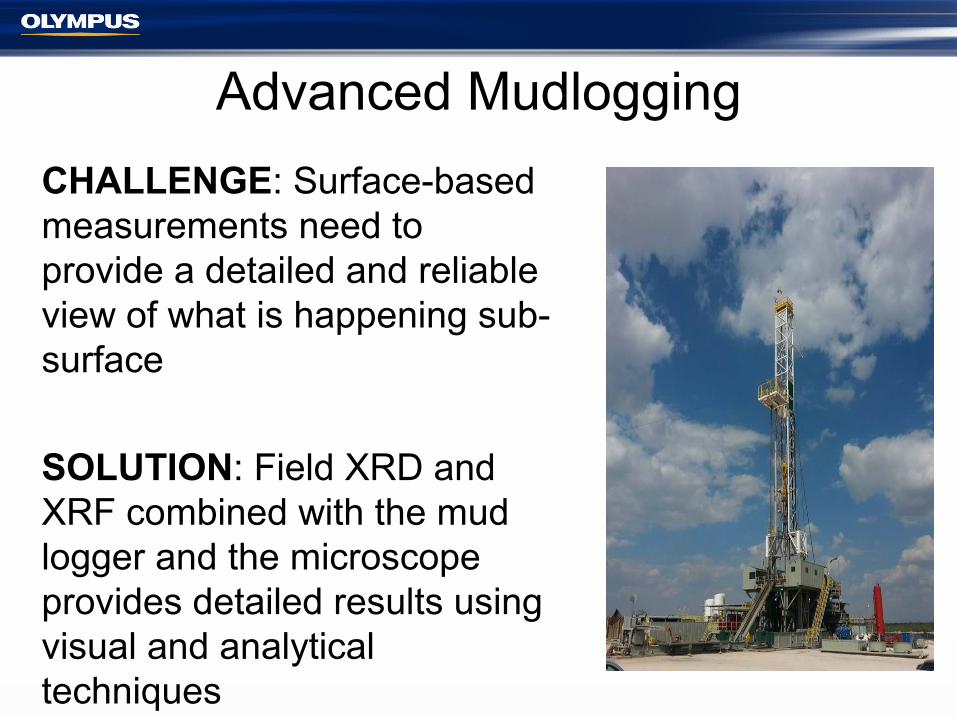
Advanced Mudlogging
CHALLENGE: Surface-based measurements need to provide a detailed and reliable view of what is happening sub-surface
SOLUTION: Field XRD and XRF combined with the mud logger and the microscope provides detailed results using visual and analytical techniques

Advanced Mudlogging
CHALLENGE: Problems such as wellbore stability and fluid losses can arise while drilling
SOLUTION: If pilot well cuttings were logged, subsequent cavings can be immediately identified with on-site XRD and XRF to pinpoint the location of losses.
Used with permission from Aaron Watkins

Advanced Mudlogging
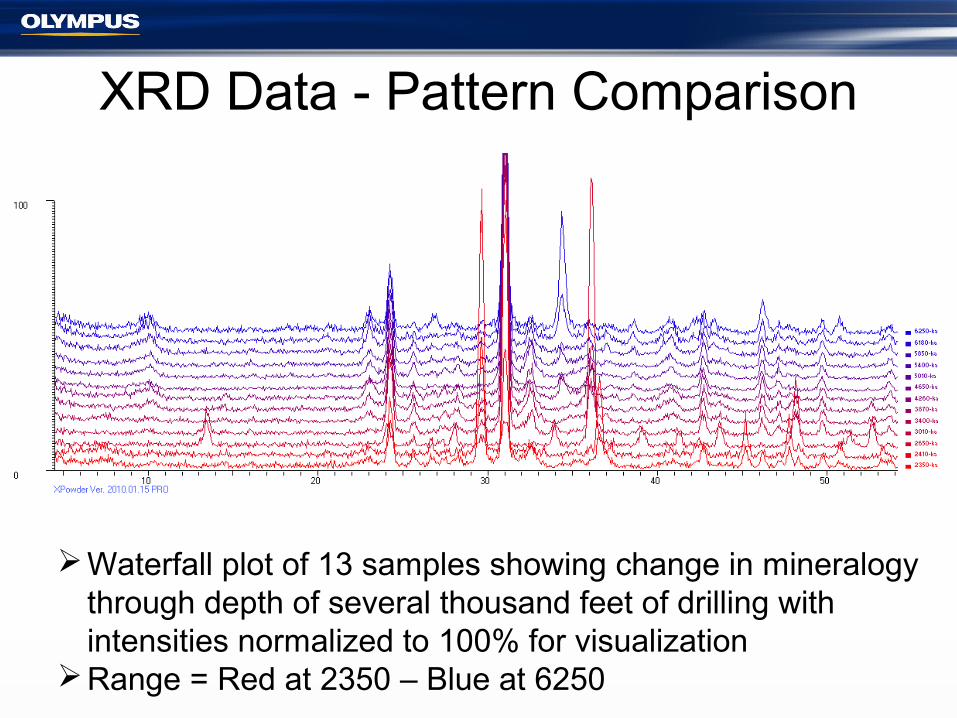
XRD Data - Pattern Comparison
Waterfall plot of 13 samples showing change in mineralogy through depth of several thousand feet of drilling with intensities normalized to 100% for visualization
Range = Red at 2350 – Blue at 6250

XRD Data - Pattern Comparison
Comparisons show visual changes in the diffraction pattern that do not require technical training to notice

XRD Data - Pattern Comparison
Quartz
Dolomite
Gypsum
Illite
2650 ft
6250 ft

XRD Data - Pattern Comparison
3400 ft
3870 ft
Illite
IlliteChlorite

XRD Data - Analysis Speed
secondary peaks clear
1 min / 4 exposures
3 min / 11 exposures
10 min / 36 exposures
For identifiable peaks, quantification stabilizes
very quickly
secondary peaks visible
primary peaks visible - likely identifiable

XRD Quantification Quick Semi-Quant (XPowder) can be set-up with a few
patterns and turned into a push-button operation Select phases visually from a small database Setting up reference files for future quantification of similar
matrices

Field XRD vs lab XRD

XRF Analysis Output
Depth Al Si P S K Ca Ti V Mn Fe Ni Cu Zn Zr
12430 4.04 13.7 0.17 0.24 2.31 2.05 0.44 0 0.03 5.11 0.0212450 2.82 13.3 0.14 0.29 1.33 3.27 0.34 0.04 0.03 4.39 0.01 0.0312470 3.31 14.2 0.2 0.33 1.38 3.34 0.35 0.04 4.53 0.0312490 3.53 12.1 0.2 0.74 1.57 4.29 1.78 1.03 0.22 5.15 0.01 0.01 0.0312510 3.39 11.8 0.17 0.5 1.64 4.37 1.03 0.6 0.12 4.8 0.0312530 3.77 11.2 0.26 0.38 1.36 7.95 1.28 0.75 0.18 4.45 0.02 0.0212550 3.44 10.9 0.15 0.41 1.46 7.3 1.21 0.55 0.14 4.28 0.0312570 2.77 9.38 0.18 0.26 1.27 8.26 0.75 0.26 0.08 3.87 0.01 0.0312590 3.11 10.5 0.17 0.62 1.42 6.16 1.88 1.19 0.34 4.78 0.02 0.01 0.0312610 3.07 9.91 0.15 0.26 1.34 7.82 0.58 0.17 0.09 3.82 0.01 0.01 0.0212630 3.19 10.7 0.17 0.33 1.59 5.29 0.5 0.11 0.08 4.52 0.01 0.03

On-site XRD & XRF Analysis
CHALLENGE: Samples sent to lab for XRD & XRF analysis can take days/wks for results
SOLUTION: Advances in XRD & XRF units have made them accessible for use in mobile labs
Inside the Diversified Well Logging Trailer

Your Mobile Lab Starts with Olympus
X5000 Portable XRF
BTX-IIBenchtop XRD
TERRA Portable XRD
Submit your questions now!


