INTRODUCTION A National Geotechnical Soft Soil Testing Facility has been set up in Ballina, NSW and is being operated by the Centre of Excellence for Geotechnical Science and Engineering (CGSE) based at the University of Newcastle. Part of the work comprised construction of instrumented embankments with and without the use of prefabricated vertical drains (PVDs) for the purposes of calibrating a new constitutive model for structured soft soils and holding an international numerical prediction symposium for embankments on soft clays. The embankment with PVDs was constructed between July and September 2013 and the embankment without PVDs was constructed between February and April 2014. This document reports site investigations performed for both embankments. PURPOSES OF GEOTECHNICAL INVESTIGATIONS The purposes of the geotechnical investigations were as follows: determine the site stratigraphy determine the geological history of the site assess the bio-chemo-geo factors that affect development of soil fabric, structure and mechanical properties assess the mechanical parameters of the clay assess sample disturbance assess insitu test methods develop site specific correlations between insitu and laboratory tests develop a structured, anisotropic, rate dependent constitutive model for the soft clay assess stochastic variability of the soils develop stochastic methods for geotechnical modelling utilising geophysics, in-situ and laboratory test data SCOPE OF GEOTECHNICAL INVESTIGATIONS The geotechnical investigations for the field testing facility were comprised of geophysics, insitu tests, soil sampling, downhole permeability testing, static water levels from vibrating wire piezometers and in-situ horizontal stresses from push in pressure cells. Mobilisations to site are summarised in Table 1. Table 1 Summary of mobilisations to site Purpose Organisation Date Work performed BBA site characterisation Coffey Geotechnics 2005-2011 PCPT, borehole drilling and laboratory testing for potential road alignments Pre-lease survey NewSyd 25/10/2011 5 PCPT through fill platform to assess depth of soft soil Initial geophysics survey Coffey Geotechnics June 2013 East West and North South electrical resistivity and MASW traverses Magnetic survey 2D surface grid ERI survey Initial SI NewSyd June 2013 25MPa + 100MPa at PCPT6, PCPT7, 38mm diameter Mostap sampling at locations 6 and 7. Shear vane testing at location 7. Dissipation testing at location 7.
Transcript
INTRODUCTION A National Geotechnical Soft Soil Testing Facility has been set up in Ballina, NSW and is being operated by the Centre of Excellence for Geotechnical Science and Engineering (CGSE) based at the University of Newcastle. Part of the work comprised construction of instrumented embankments with and without the use of prefabricated vertical drains (PVDs) for the purposes of calibrating a new constitutive model for structured soft soils and holding an international numerical prediction symposium for embankments on soft clays. The embankment with PVDs was constructed between July and September 2013 and the embankment without PVDs was constructed between February and April 2014. This document reports site investigations performed for both embankments. PURPOSES OF GEOTECHNICAL INVESTIGATIONS The purposes of the geotechnical investigations were as follows:
determine the site stratigraphy determine the geological history of the site assess the bio-chemo-geo factors that affect development of soil fabric, structure and
mechanical properties assess the mechanical parameters of the clay assess sample disturbance assess insitu test methods develop site specific correlations between insitu and laboratory tests develop a structured, anisotropic, rate dependent constitutive model for the soft clay assess stochastic variability of the soils develop stochastic methods for geotechnical modelling utilising geophysics, in-situ
and laboratory test data SCOPE OF GEOTECHNICAL INVESTIGATIONS The geotechnical investigations for the field testing facility were comprised of geophysics, insitu tests, soil sampling, downhole permeability testing, static water levels from vibrating wire piezometers and in-situ horizontal stresses from push in pressure cells. Mobilisations to site are summarised in Table 1. Table 1 Summary of mobilisations to site
Purpose Organisation Date Work performed
BBA site characterisation
Coffey Geotechnics
2005-2011 PCPT, borehole drilling and laboratory testing for potential road alignments
Pre-lease survey
NewSyd 25/10/2011 5 PCPT through fill platform to assess depth of soft soil
Initial geophysics survey
Coffey Geotechnics
June 2013 East West and North South electrical resistivity and MASW traverses
Magnetic survey
2D surface grid ERI survey
Initial SI NewSyd June 2013 25MPa + 100MPa at PCPT6, PCPT7, 38mm diameter Mostap sampling at locations 6 and 7. Shear vane testing at location 7. Dissipation testing at location 7.
Purpose Organisation Date Work performed
IGS collaboration to assess performance of new piston sampler plus other testing for IGS’s benefit
In-Situ Geotechnical Services
July 2013 10MPa, 25MPa, 100MPa, Subtraction cones
Rate of penetration of 25MPa cones (0.2cm/sec, 2cm/sec, 100cm/sec)
25MPa PCPT with U1 filter
Slot filter with grease / glycerine and grease
Vertek conductivity cone
Seismic dilatometer
Fuel florescence cone
Friction reducing strategies
Testing new piston sampler with and without low adhesion silicone coating
DP to check performance of new gear
Douglas Partners
July 2013 100MPa CPT and PCPT
Shear vane
Dissipation testing
Second SI NewSyd August 2013
HPT8
25MPa and 100MPa PCPT at location 8
Dissipation testing
SDMT8
Installation of instrumentation for PVD embankment
University of Newcastle
September 2013
Borehole drilling and soil sampling
Second geophysics survey for Embankment 2
Coffey Geotechnics
March 2014
Repeat previous east-west ERI survey for comparison and as proof-of-concept for embankment settlement assessment
Perform north-south MASW under embankment 2
Perform surface to borehole ERI for 3D tomography and future assessment of consolidation below embankment
Third SI for Embankment 2
NewSyd March 2014
HPT34, SDMT34, CPT34, Dissipations, SV34
Self boring pressurementer (camkometer)
UWA/UoN April 2014 Monotonic expansion, cyclic loops, different rate of expansion, holding tests (dissipation)
Variable rate electric drive
UWA April 2014 Tbar, piezoball and CPTu testing with variable installation rates
Stochastic SI IGS for UoN March 2014
25 by 25MPa CPTu on a set grid to allow assessment of spatial correlation in the vertical and horizontal directions
Permeability testing
UON APRIL 2015
Undertake down hole rising head permeability testing in existing well.
BAT Permeability testing
NewSyd June 2015 Undertake BAT Permeability testing
A summary of all the insitu tests can be found in Excel spreadsheet in the
Survey coordinates are Map Grid of Australia (MGA) Zone 56 and the Australian Height Datum (AHD). Locations of the geotechnical investigations are shown on the plan drawings. INSITU TESTING The following types of insitu tests were performed:
MASW, ERI and MRI surface geophysics ERI Surface to borehole traverses piezocone and non-piezocone testing using different capacity cones, pushed at
different rates, with different filters and filter positions piezocone dissipation testing shear vane testing seismic Dilatometer testing hydrostatic profile tool, including conductivity, testing Vertek conductivity probe Standard Penetration Testing (SPT) in sands and stiff clays self boring pressuremeter (SBPM) ie Camkometer Tbar and piezoball using variable rate electric drive Down hole permeability testing BAT permeability testing
Geophysics for Embankment 1 The initial geophysics campaign is reported in document GEOPLCOV00172AA-AC.pdf. Figure GPLCOV172AA_1 shows the location of the geophysical lines and the in situ geotechnical testing undertaken onsite and provided by the UoN. In situ geotechnical testing included in this report includes geotechnical boreholes, geotechnical Seismic flat Dilatometer Test (SDMT) and Cone Penetrometer Test (CPT). The limits existing all-weather road and the existing earthen material stockpile are also included in GPLCOV172AA_1. The East-West alignment included ERI 1 and MASW 1 and started at approximately chainage 80m along the North-South lines and extended in an easterly direction, to the north of an existing earthen material stockpile embankment located onsite. Geophysical equipment was hand placed along this line. The North-South geophysical line was positioned approximately parallel to the embankment of all-weather access track. Unlike the East-West geophysical line, the ERI 2 and MASW 2 were completed along alignments that were offset. This was due to the deployment of the MASW landstreamer atop of the all-weather access track embankment. MASW 2 was positioned approximately 1.6 m to the West and 0.6m above ERI 2. The ERI 2 metal stake electrodes were placed into natural ground materials (clays and silts) at the toe of the all-weather track embankment. Placement of electrodes largely avoided geofabric and embankment fill material however this was unavoidable where ERI 2 intersected the all-weather track embankment between Ch 50m and 70m and across the turning bay at the northern end at Ch155m and 180m. MASW 2 was undertaken on top of the eastern edge of the all-weather track by towing landstreamer behind a vehicle to improve the rate of acquisition in this direction. Geophysical lines were marked at the start, end and intermediate chainage positions with wooden stakes at ground level which were later surveyed by the UoN field representative. The geophysics fieldwork was completed from the 25 to 28 June 2013. Table 1 lists the coordinates of the ERI and MASW lines and the start and end relative chainages.
Table 1: Geophysical line coordinates
Line ID Start Ch.(m)
Easting (m)
Northing (m)
Elevation (mAHD)
End Ch.(m)
Easting (m)
Northing (m)
Elevation (mAHD)
East-West
ERI 1 0 511889.8 6809424.2 0.57 142 552031.2 6809415.3 0.34
Geodetic Datum: MGA Zone 56 (GDA94) Elevation Datum: Australian Height Datum (mAHD) *MASW Start and End Chainage indicate chainage of start and end geophone of first and last spread respectively Cone penetrometry Cone penetration tests were performed by NewSyd, Insitu Geotechnical Services (IGS) and Douglas Partners (DP). NewSyd and Douglas Partners used 3 axle 4WD rigs driven on to bog mats to access the site. IGS used a dual axle rubber tyred all terrain vehicle. The types of cones used were as follows:
15cm2
o Subtraction (Geomil - IGS) o SMRP (Vertek - IGS) o HPT (Geoprobe - NewSyd)
10cm2 o 10MPa (Geomil –IGS) o 25MPa (Geomil – IGS, NewSyd) o 100MPa (Geomil – IGS, NewSyd; ABVandenberg – DP)
All the cones used in these tests were equipped with cables running through the rods and attached to the data logger. All cones had male threads that connected to female sockets in the rods. When de-airing the piezo filter NewSyd and DP filled the female socket with glycerine, forced glycerine through the apertures in the cone, installed pre-saturated filters and screwed the cone into the socket displacing glycerine. IGS placed the cone assembly in a glycerine filled vacuum assembly in addition to the above methodology in an attempt to eliminate any air bubbles that might have become trapped in the system. The majority of tests were performed using U2 filters and two tests were performed using U1 filters. The cones were lowered to approximately the top of ground surface through slashed sugar cane trash and a zero reading taken. The cones were then generally pushed at a rate of 2cm/s into the ground, except for two tests where a cone was pushed a rates of 0.2cm/s and 10cm/s. A second zero reading was taken after extraction of the cone from the ground. The IGS software automatically distributes differences between the first and second zero throughout the test record. Some tests were performed by pushing a non-piezo cone to between 1.2m and 3m depth to avoid de-saturation of the filter in the upper crust then pushing the piezocone for the rest of the test. Additional tests were performed using grease and grease/glycerine filled slot filters for comparison with U2 data. Dissipation tests were performed by all three organisations. In each case penetration was stopped and was generally followed by a dissipation period determined by the lesser of 1 hour or the time for 50% dissipation. A few overnight dissipation tests were also performed. Close
inspection of the procedure used by NewSyd showed that the U2 reading just prior to shutting off the hydraulic rams was in the order of 20kPa higher than after penetration had ceased. This is considered to be caused by a slight rebound in the system. As a consequence, the U2 reading typically increased by several kPa prior to reducing with time. The increase in U2 pressure is interpreted to reflect equalisation with pore pressures away from the filter generated during cone penetration. The test with the hydrostatic profile tool (HPT) was performed in accordance with the Geoprobe manual. The tests with the Vertek conductivity probe were also performed in accordance with the manual. However, the data from the probe was found to exceed the measurement range and is interpreted to mean that the probe was not functioning properly. Fuel fluorescence cone and friction reducing mechanical cone tests were performed by IGS but the data not kept by the University of Newcastle as we have no interest in these works. The nominal area correction factors for the cone tips and sleeves provided by the manufacturers are summarised in Table 2. The A and B factors for the Geomil 25MPa and 100MPa cones owned by NewSyd were check by calibrating cone and shaft resistance against GDS controlled application of water pressures in a sealed chamber. The results of the calibration are presented in Figure 1 and show that the actual A values are 6% smaller than the quoted numbers. The calibration also shows that the 100MPa cone calibration becomes non-linear below a pressure of 0.4MPa. Table 2 Manufacturers specifications
Manufacturer / organisation
Specified A Calibrated A Specified B Calibrated B
Geomil NewSyd 25MPa
0.81 0.76 0.0 0.0
Geomil NewSyd 100MPa
0.81 0.76 0.0 0.0
Geomil IGS (all) 0.81 Not available 0.0 Not available
ABVandenberg (DP)
Figure 2 Results of PCPT calibration for A factors Seismic Dilatometry Marchetti seismic dilatometer tests were performed by IGS and NewSyd. Standard procedures for reading dilatometer pressures were followed. The buzzer on the NewSyd system appeared to stick part way through the test and the bar meter was used to gauge the on and off pressures. For the seismic tests, IGS used an autosies as the impact source while NewSyd used a hammer as an impact source. The impact plate was struck in the horizontal direction perpendicular to the axis of the truck in both cases. Shear Vanes Shear vane testing was performed by Douglas Partners and NewSyd. Both shear vanes were rotated using electric heads and the torque was measured at truck level. The GeotechAB vane owned by NewSyd is rotated 15 degrees prior to engaging with the vane in order to obtain an estimate of rod friction. The initial rate of shearing for both vanes was 0.2 degrees per second. DP increased the rate of shearing to 6 degrees per second post mobilisation of peak strength for a distance equivalent to 5 rotations. NewSyd increase the rate of shearing to 0.7 degrees per second for one complete rotation of the vane. The dimensions of the vane are summarised in Table 3. Table 3 Shear Vane Parameters
T-bar and Piezoball with variable rate electric drive Full-flow T-bar and piezoball (a ball penetrometer with pore pressure measuring sensors) tests were performed by UWA in two separate stages. The first testing stage, which focused on collecting high quality standard rate (20 mm/s) penetration and dissipation tests, was carried out using the NewSyd rig. The second set of tests were carried out using an electrically driven research grade rig built at UWA. The reaction force of this rig is approximately 3t although the electric drive system force is restricted to 1t. This system permits more complex test sequences and the second stage of testing included variable rate testing over several orders of magnitude. The piezoball used was built by UWA and has a diameter of 60mm and is connected to a 20mm diameter shaft that tapers out to a 35.7mm diameter shaft at a distance of 200 mm, allowing the device to be connected to standard size push rods. The reduced shaft length is considered sufficient to minimise migration of excess pore water generated by the larger shaft. The smaller diameter shaft provide a shaft to ball area ratio, As/Ap = 0.11 which is sufficient to ensure full-flow conditions. The net area ratio, α, was calibrated in a pressure chamber as 0.84. Penetration and extraction resistance are measured by a strain gauged section, 55mm above the top of the ball. The strain gauge is protected by a sleeve which minimises the inclusion of frictional resistance in the resistance measurements. Pore pressure is measured simultaneously at the ball tip, equator and mid-face (midway between the tip and equator). Nine Kyowa (PS-10KD) rear entry total pressure sensors, with a measurement range of ±1MPa are located in a circular recess on the surface of the sphere such that the measurement diaphragm is located approximately 3mm from the surface. A 1.5mm thick ceramic filter with an average pore space of 10μm is located in front of each sensor so that pore pressure can be measurement. Four sensors at 90 degrees in plan are located at both the equator and mid-face positions such that the pore pressure response at those locations can be taken as the average. One sensor is located at the tip. To ensure saturation, the filters were submerged in silicone oil and held under a vacuum of 100kPa for 24 hours in the laboratory, prior to going to site. The filters were then kept under oil until they were placed on the piezoball. Prior to inserting the filters, the small voids above the sensors were filled with silicone oil. Once the filters were fitted, the probe was submerged in oil and subjected to a vacuum for 1 – 2 hours prior to the test. T-bar tests were performed using a 40 x 250mm (diameter x length) T-bar tip connected perpendicularly to a 35.7mm diameter constructed at UWA such that the area ratio As/Ap = 0.1. The net area ratio was calibrated as 0.8. Amplification and signal processing is carried out inside the penetrometer to ensure a better quality signal before being sent to the surface as a digital signal. The data logging system for the piezoball and T-bar can log 16 channels at a rate of 16 bits. In addition to resistance and pressure readings, temperature and inclination are measured in the device and appropriate corrections can be applied. Zero readings were checked before and after each test. Standard rate tests were carried out at 20 mm/s. Extraction resistance is recorded in addition to penetration resistance during full-flow tests. Cyclic remoulding tests were performed at several depths by cycling the piezoball or T-bar by ±0.25m about a discrete depth for at least 10 cycles until the remoulded resistance becomes tolerably constant. Several piezoball tests included sequences of reduced velocity penetration. In these twitch tests the penetration rate was reduced over three steps. Each step was 0.25m to ensure steady state conditions were achieved. Twitch tests were carried out at rates of 20mm/s down to 0.02mm/s. Piezoball dissipation tests were carried out following both standard 20mm/s penetrations and reduced rate twitch testing. During dissipations, the penetration was stopped and the excess pore pressure was allowed to dissipate until at least 50% of the initial value.
Self boring pressuremeter In March 2014 a total of 27 pressuremeter tests were conducted on the National Geotechnical Soft Soil Testing Facility, in Ballina NSW. The tests were carried out in 6 different boreholes over a depth range of 2m to 10m below ground level. The programme involved tests with and without unload-reload loops, different strain rates (1, 10, 50 and 100 kPa/min) and strain holding tests. All tests where limited to 10% cavity strain. The UWA self-boring pressuremeter device is a modified version of the “Camkometer” developed at the University of Cambridge. The pressuremeter has an outer Diameter of 82 mm and a length of 490 mm. Once the SBPM is positioned to the test depth, the cylindrical device expands by applying an internal pressure to the rubber membrane. The pressure and the corresponding radial expansion (strain) are measured by three mechanical measuring arms. These measurement arms are extended against the inside of the membrane. To protect the rubber membrane against damage from the soil, steel strips (called the “Chinese lantern”) are used as a protection casing. Drilling and sampling Soil samples were generally obtained from boreholes drilled for installation of instrumentation. At two other locations, a push-in piston sampler developed by In-Situ Geotechnical Services (IGS) and operated using a cone rig was used. The following types of soil samplers were used:
Sherbrooke block sampler Nominal 100mm diameter free piston sampler Nominal 90mm diameter fixed piston Osterberg sampler Shelby tubes of 50mm, 63mm and 75mm diameters Standard Penetration Testing (SPT) IGS 63mm diameter push-in fixed piston sampler using stainless steel tubes with
cutting angles of 15 degrees with and without an internal low adhesion silicone coating
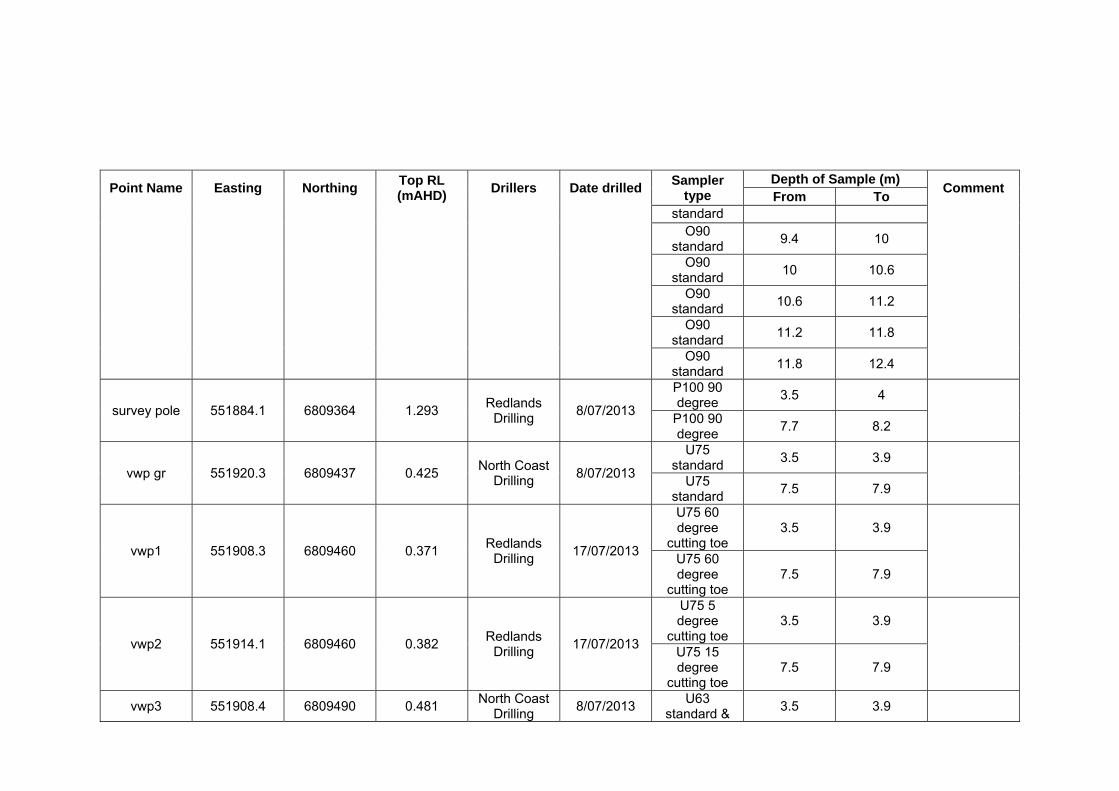
38mm diameter Mostap samples. The Shelby tubes and piston sampler tubes had cutting toes ranging from 5 degrees to 90 degrees. The holes were drilled using track mounted drilling rigs by North Coast Drilling and Redlands drilling. Hole diameters of P, H or N casing were used depending on the diameter of the sampler. Samples were taken, immediately sealed with wax at both ends, packaged in bubble wrap then stood upright in a 200 litre barrel. Once the barrel was filled it was packed with polystyrene then freighted to Newcastle using conventional road transport. Borehole logs can be found in the directory. NGI performed Sherbrooke block sampling to the north of the embankment in October 2014. 40 numbers of samples were obtained from 4 number boreholes. The samples were wrapped in cling wrap, tinfoil and coated with wax. The samples were placed in rubbish bins and packed with polystyrene chips prior to being trucked from Ballina to Newcastle.
All of the tube and Sherbrooke samples are being stored in a refrigerated container at 15 degrees Celsius.
Down hole permeability testing
Down hole permeability testing was conducted in a screened well, installed during the initial site investigation in July 2013. A continuously slotted well screen of 70mm diameter was
installed to a depth of 12.1m within a bore hole of diameter of 120mmm. The screen was backfilled using series of layers of bentonite and filter sand in order to create six filter zones of length 800 to 900mm within the overall well length.
Rising head permeability testing was undertaken using a double straddle packer system. The equipment comprised two 46mm x 800mm long inflatable packers connected by an 800mm long by 21mm diameter perforated straddle pipe. A 1/8’ LDPE inflation tubing was connected to both the upper and lower packer and to a double valve hand pump at the surface. A pressure level logger was connected to the base of the perforated straddle pipe in order to log pressure changes in the well during the test. A series of 1.5m long PVC riser tubes were threaded into the top of the upper straddle packer. The access tubing allowed for a length of 3/8” LDPE flow tubing to be connected between the perforated straddle pipe and a peristaltic pump at the surface. The entire straddle packer system was connected to a tag line with marked depth intervals and lowered down the bore hole well.
Testing was undertaken by lowering the straddle packer system to a predetermined depth such that the packers were in line with the bentonite plugs within the well construction and such that the perforated pipe was in line with the filter zone on the well screen. The straddle packers were inflated to 250kPa and determined to be stable prior to switching on the peristaltic pump in order to pump out the test interval, lowering the hydraulic head. Once the packer interval was determined to be dry the pump was switched off the hydraulic head allowed to recover while the pressure changes within the test interval were monitored by the down hole level logger.
BAT permeability testing
BAT inflow permeability testing was undertaken at discrete depth intervals, adjacent to the down hole permeability testing. The BAT permeability system comprised BAT filter tip which is used to house a 30mm diameter by 40mm high HDPE porous filter, a double ended glass vial of 35ml volume which has rubber seals at each end, two double ended hypodermic needle, pressure transducer and logger and a stainless steel assembly tube used to house the vial and needles.
The HDPE filters were saturated in water under a vacuum for 24hr prior to undertaking testing. The saturated BAT filter tip was deployed to the designated testing depth using a CPT rig and a series of 44mm diameter x 1m long hollow steel rods. A double ended vial was evacuated using a needle and syringe to create a vacuum inside the chamber prior to undertaking a permeability test. The evacuated vail and needles are assembled in the assembly tube such that the vial ends are not penetrated by the needles while the assembly is lowered down inside the push rods in order to contact the filter tip. Once the assembly tube contacts the filter tip the double the end needles penetrate the vial and filter tip connecting the filter tip, vial and pressure transducer. The assembly remains connected to the filter while pressure changes in the vial are measured as the ground water flows into the vial.
The test permeability is based on the rate of flow into the sample container which is computed by measuring the pressure change in the vial and using Boyle’s law to translate the pressure measurements to volume measurements.
TABLE B1: SUMMARY OF BOREHOLE DRILLING AND SAMPLING
inc/mex5 551969.7 6809452 0.534 North Coast Drilling 17/03/2014 O90 standard 0.4 1
O90 standard 1 1.6
O90 standard 1.6 2.2
O90 standard 2.2 2.8
Point Name Easting Northing RL
(mAHD) Drilling Organisation
Date drilled
Sampler type Depth of Sample
(m) From To
O90 standard 2.8 3.4
O90 standard 3.4 4
O90 standard 4 4.6
O90 standard 4.6 5.2
O90 standard 5.2 5.8
O90 standard 5.8 6.4
O90 standard 6.4 7
O90 standard 7 7.6
O90 standard 7.6 8.2
O90 standard 8.2 8.8
O90 standard 8.8 9.4
O90 standard 9.4 10
O90 standard 10 10.6
O90 standard 10.6 11.2
O90 standard 11.2 11.8
O90 standard 11.8 12.4
O90 standard 12.4 13 inc/mex9 551993.7 6809452 0.514 North Coast Drilling 18/03/2014 O90 standard 0.4 1
O90 standard 1 1.6
O90 standard 1.6 2.2
O90 standard 2.2 2.8 O90 standard 2.8 3.4 O90 standard 3.4 4
O90 standard 4 4.6
O90 standard 4.6 5.2
Point Name Easting Northing RL
(mAHD) Drilling Organisation
Date drilled
Sampler type Depth of Sample
(m) From To
O90 standard 5.2 5.8 O90 standard 5.8 6.4 O90 standard 6.4 7 O90 standard 7 7.6 O90 standard 7.6 8.2 O90 standard 8.2 8.8 O90 standard 8.8 9.4 O90 standard 9.4 10 O90 standard 10 10.6 O90 standard 10.6 11.2 O90 standard 11.2 11.8 O90 standard 11.8 12.4 O90 standard 12.4 13 O90 standard 13 13.6 O90 standard 13.6 14.2 O90 standard 14.2 14.8 O90 standard 14.8 15.4 O90 standard 15.4 16 O90 standard 16 16.6 O90 standard 16.6 17.2